Zip Codes with the Highest Percentage of Population Employed in Security & Protection in Henderson, NV
RELATED REPORTS & OPTIONS
Security & Protection
Henderson
Compare Zip Codes
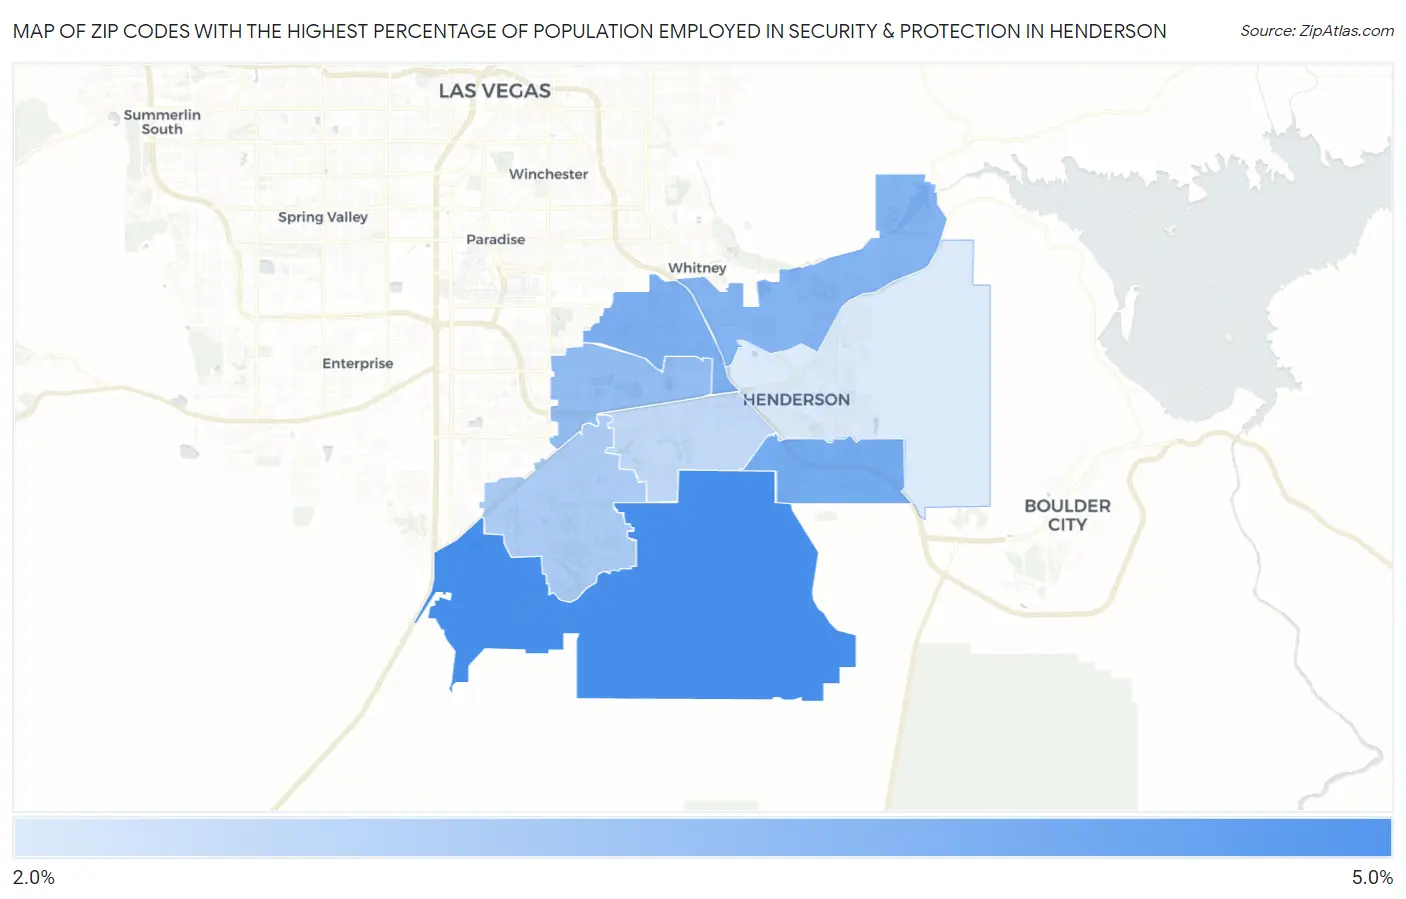
Map of Zip Codes with the Highest Percentage of Population Employed in Security & Protection in Henderson
2.0%
4.7%
Zip Codes with the Highest Percentage of Population Employed in Security & Protection in Henderson, NV
| Zip Code | % Employed | vs State | vs National | |
| 1. | 89044 | 4.7% | 3.0%(+1.70)#26 | 2.1%(+2.58)#3,262 |
| 2. | 89002 | 3.9% | 3.0%(+0.868)#42 | 2.1%(+1.75)#4,689 |
| 3. | 89014 | 3.8% | 3.0%(+0.724)#47 | 2.1%(+1.61)#5,019 |
| 4. | 89011 | 3.6% | 3.0%(+0.605)#50 | 2.1%(+1.49)#5,318 |
| 5. | 89074 | 3.3% | 3.0%(+0.314)#57 | 2.1%(+1.20)#6,110 |
| 6. | 89052 | 2.9% | 3.0%(-0.109)#71 | 2.1%(+0.774)#7,543 |
| 7. | 89012 | 2.6% | 3.0%(-0.481)#86 | 2.1%(+0.402)#9,250 |
| 8. | 89015 | 2.0% | 3.0%(-0.984)#101 | 2.1%(-0.101)#12,268 |
1
Common Questions
What are the Top 5 Zip Codes with the Highest Percentage of Population Employed in Security & Protection in Henderson, NV?
Top 5 Zip Codes with the Highest Percentage of Population Employed in Security & Protection in Henderson, NV are:
What zip code has the Highest Percentage of Population Employed in Security & Protection in Henderson, NV?
89044 has the Highest Percentage of Population Employed in Security & Protection in Henderson, NV with 4.7%.
What is the Percentage of Population Employed in Security & Protection in Henderson, NV?
Percentage of Population Employed in Security & Protection in Henderson is 3.2%.
What is the Percentage of Population Employed in Security & Protection in Nevada?
Percentage of Population Employed in Security & Protection in Nevada is 3.0%.
What is the Percentage of Population Employed in Security & Protection in the United States?
Percentage of Population Employed in Security & Protection in the United States is 2.1%.