Spanish Springs, NV Map & Demographics
Spanish Springs Map
Spanish Springs Overview
$54,854
PER CAPITA INCOME
$126,843
AVG FAMILY INCOME
$119,830
AVG HOUSEHOLD INCOME
28.0%
WAGE / INCOME GAP [ % ]
72.0¢/ $1
WAGE / INCOME GAP [ $ ]
0.39
INEQUALITY / GINI INDEX
16,418
TOTAL POPULATION
8,130
MALE POPULATION
8,288
FEMALE POPULATION
98.09
MALES / 100 FEMALES
101.94
FEMALES / 100 MALES
46.7
MEDIAN AGE
2.9
AVG FAMILY SIZE
2.6
AVG HOUSEHOLD SIZE
8,968
LABOR FORCE [ PEOPLE ]
66.3%
PERCENT IN LABOR FORCE
3.2%
UNEMPLOYMENT RATE
Spanish Springs Area Codes
Income in Spanish Springs
Income Overview in Spanish Springs
Per Capita Income in Spanish Springs is $54,854, while median incomes of families and households are $126,843 and $119,830 respectively.
| Characteristic | Number | Measure |
| Per Capita Income | 16,418 | $54,854 |
| Median Family Income | 5,045 | $126,843 |
| Mean Family Income | 5,045 | $154,408 |
| Median Household Income | 6,217 | $119,830 |
| Mean Household Income | 6,217 | $145,125 |
| Income Deficit | 5,045 | $0 |
| Wage / Income Gap (%) | 16,418 | 28.01% |
| Wage / Income Gap ($) | 16,418 | 71.99¢ per $1 |
| Gini / Inequality Index | 16,418 | 0.39 |
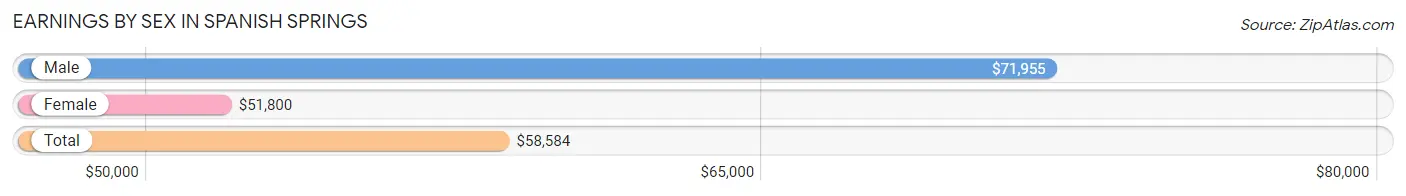
Earnings by Sex in Spanish Springs
Average Earnings in Spanish Springs are $58,584, $71,955 for men and $51,800 for women, a difference of 28.0%.
| Sex | Number | Average Earnings |
| Male | 4,672 (50.2%) | $71,955 |
| Female | 4,627 (49.8%) | $51,800 |
| Total | 9,299 (100.0%) | $58,584 |
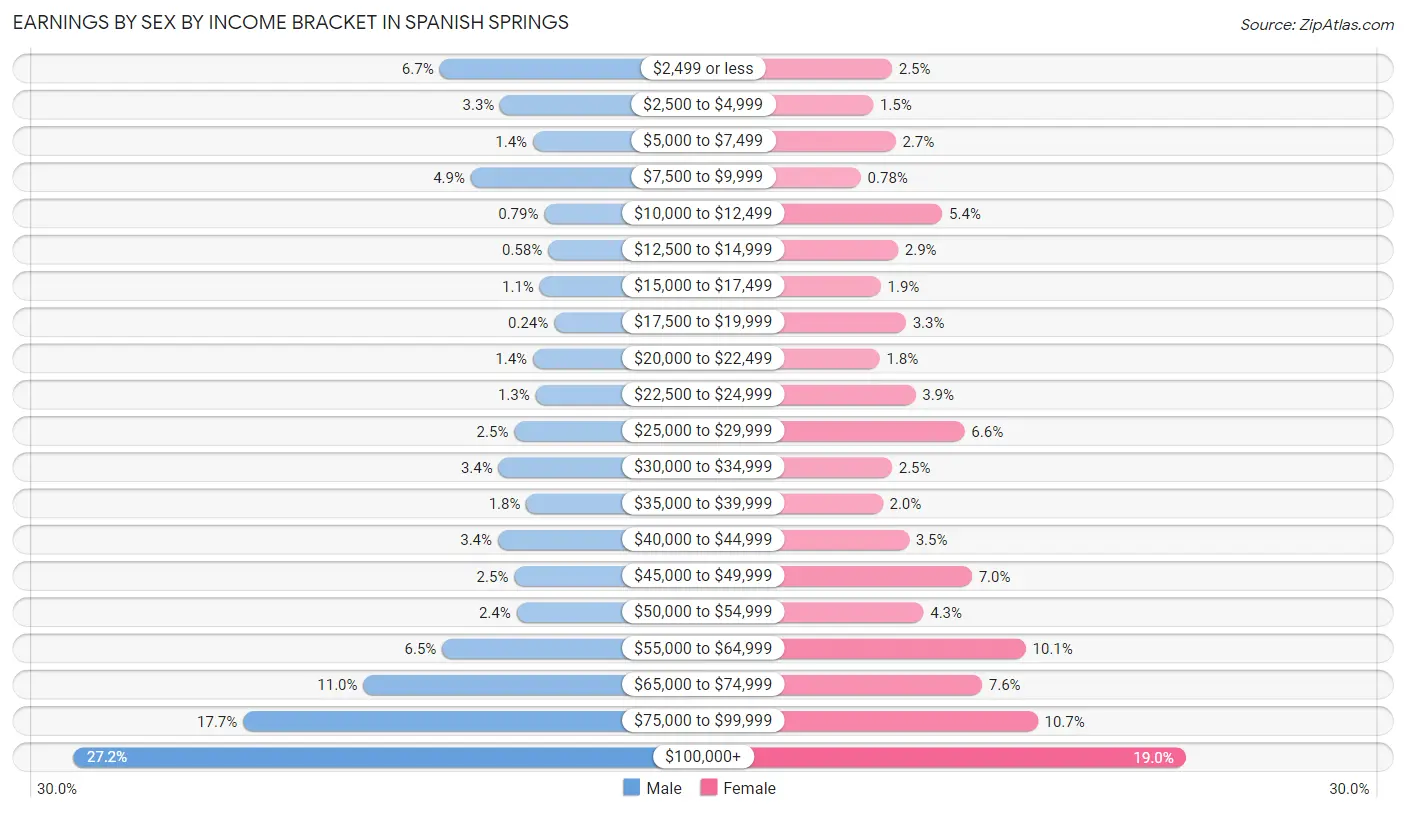
Earnings by Sex by Income Bracket in Spanish Springs
The most common earnings brackets in Spanish Springs are $100,000+ for men (1,272 | 27.2%) and $100,000+ for women (881 | 19.0%).
| Income | Male | Female |
| $2,499 or less | 312 (6.7%) | 117 (2.5%) |
| $2,500 to $4,999 | 153 (3.3%) | 68 (1.5%) |
| $5,000 to $7,499 | 67 (1.4%) | 127 (2.7%) |
| $7,500 to $9,999 | 230 (4.9%) | 36 (0.8%) |
| $10,000 to $12,499 | 37 (0.8%) | 248 (5.4%) |
| $12,500 to $14,999 | 27 (0.6%) | 133 (2.9%) |
| $15,000 to $17,499 | 49 (1.1%) | 88 (1.9%) |
| $17,500 to $19,999 | 11 (0.2%) | 153 (3.3%) |
| $20,000 to $22,499 | 67 (1.4%) | 85 (1.8%) |
| $22,500 to $24,999 | 60 (1.3%) | 178 (3.8%) |
| $25,000 to $29,999 | 116 (2.5%) | 306 (6.6%) |
| $30,000 to $34,999 | 157 (3.4%) | 117 (2.5%) |
| $35,000 to $39,999 | 84 (1.8%) | 93 (2.0%) |
| $40,000 to $44,999 | 159 (3.4%) | 161 (3.5%) |
| $45,000 to $49,999 | 116 (2.5%) | 325 (7.0%) |
| $50,000 to $54,999 | 110 (2.4%) | 199 (4.3%) |
| $55,000 to $64,999 | 305 (6.5%) | 465 (10.1%) |
| $65,000 to $74,999 | 512 (11.0%) | 351 (7.6%) |
| $75,000 to $99,999 | 828 (17.7%) | 496 (10.7%) |
| $100,000+ | 1,272 (27.2%) | 881 (19.0%) |
| Total | 4,672 (100.0%) | 4,627 (100.0%) |
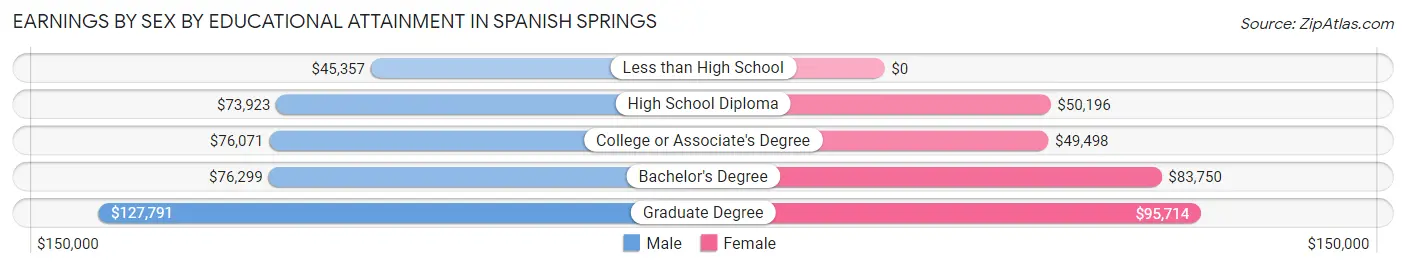
Earnings by Sex by Educational Attainment in Spanish Springs
Average earnings in Spanish Springs are $74,806 for men and $56,603 for women, a difference of 24.3%. Men with an educational attainment of graduate degree enjoy the highest average annual earnings of $127,791, while those with less than high school education earn the least with $45,357. Women with an educational attainment of graduate degree earn the most with the average annual earnings of $95,714, while those with college or associate's degree education have the smallest earnings of $49,498.
| Educational Attainment | Male Income | Female Income |
| Less than High School | $45,357 | $0 |
| High School Diploma | $73,923 | $50,196 |
| College or Associate's Degree | $76,071 | $49,498 |
| Bachelor's Degree | $76,299 | $83,750 |
| Graduate Degree | $127,791 | $95,714 |
| Total | $74,806 | $56,603 |
Family Income in Spanish Springs
Family Income Brackets in Spanish Springs
According to the Spanish Springs family income data, there are 1,524 families falling into the $100,000 to $149,999 income range, which is the most common income bracket and makes up 30.2% of all families. Conversely, the $10,000 to $14,999 income bracket is the least frequent group with only 10 families (0.2%) belonging to this category.
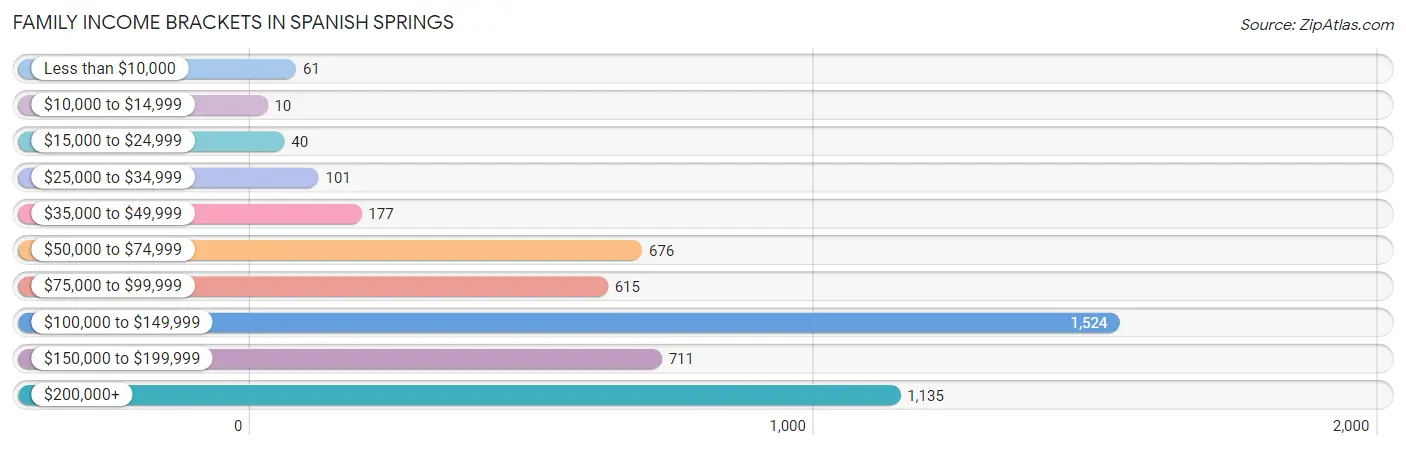
| Income Bracket | # Families | % Families |
| Less than $10,000 | 61 | 1.2% |
| $10,000 to $14,999 | 10 | 0.2% |
| $15,000 to $24,999 | 40 | 0.8% |
| $25,000 to $34,999 | 101 | 2.0% |
| $35,000 to $49,999 | 177 | 3.5% |
| $50,000 to $74,999 | 676 | 13.4% |
| $75,000 to $99,999 | 615 | 12.2% |
| $100,000 to $149,999 | 1,524 | 30.2% |
| $150,000 to $199,999 | 711 | 14.1% |
| $200,000+ | 1,135 | 22.5% |
Family Income by Famaliy Size in Spanish Springs
4-person families (771 | 15.3%) account for the highest median family income in Spanish Springs with $139,688 per family, while 2-person families (2,553 | 50.6%) have the highest median income of $56,172 per family member.
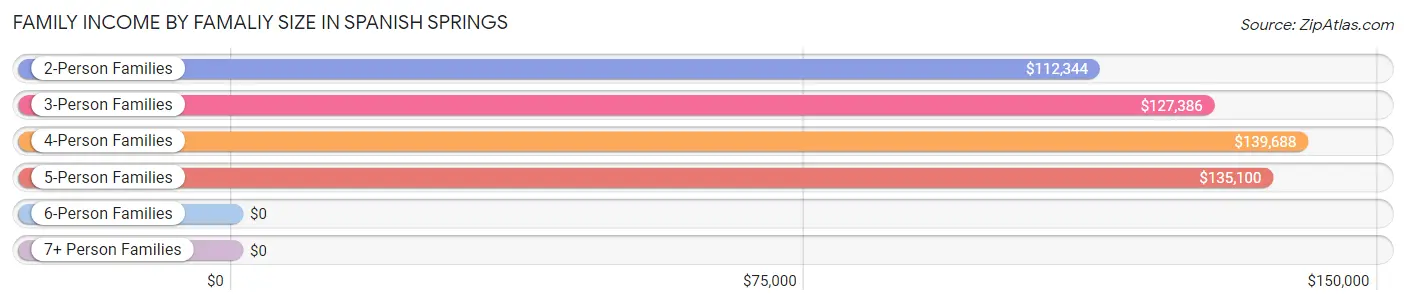
| Income Bracket | # Families | Median Income |
| 2-Person Families | 2,553 (50.6%) | $112,344 |
| 3-Person Families | 1,270 (25.2%) | $127,386 |
| 4-Person Families | 771 (15.3%) | $139,688 |
| 5-Person Families | 354 (7.0%) | $135,100 |
| 6-Person Families | 42 (0.8%) | $0 |
| 7+ Person Families | 55 (1.1%) | $0 |
| Total | 5,045 (100.0%) | $126,843 |
Family Income by Number of Earners in Spanish Springs
The median family income in Spanish Springs is $126,843, with families comprising 3+ earners (713) having the highest median family income of $159,453, while families with no earners (716) have the lowest median family income of $84,167, accounting for 14.1% and 14.2% of families, respectively.
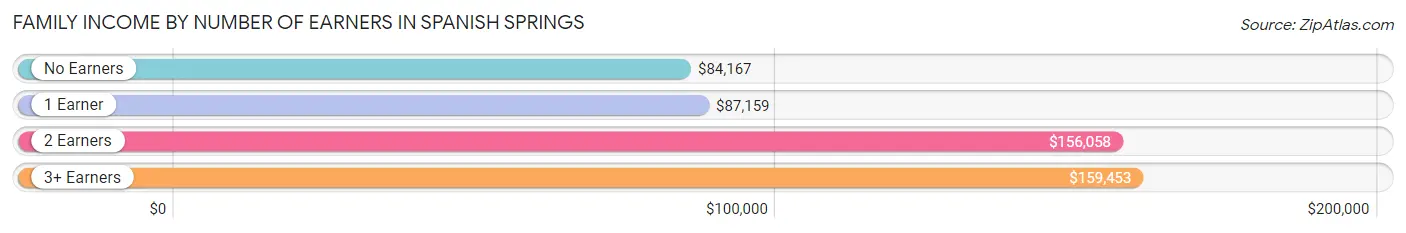
| Number of Earners | # Families | Median Income |
| No Earners | 716 (14.2%) | $84,167 |
| 1 Earner | 1,424 (28.2%) | $87,159 |
| 2 Earners | 2,192 (43.4%) | $156,058 |
| 3+ Earners | 713 (14.1%) | $159,453 |
| Total | 5,045 (100.0%) | $126,843 |
Household Income in Spanish Springs
Household Income Brackets in Spanish Springs
With 1,722 households falling in the category, the $100,000 to $149,999 income range is the most frequent in Spanish Springs, accounting for 27.7% of all households. In contrast, only 12 households (0.2%) fall into the $10,000 to $14,999 income bracket, making it the least populous group.
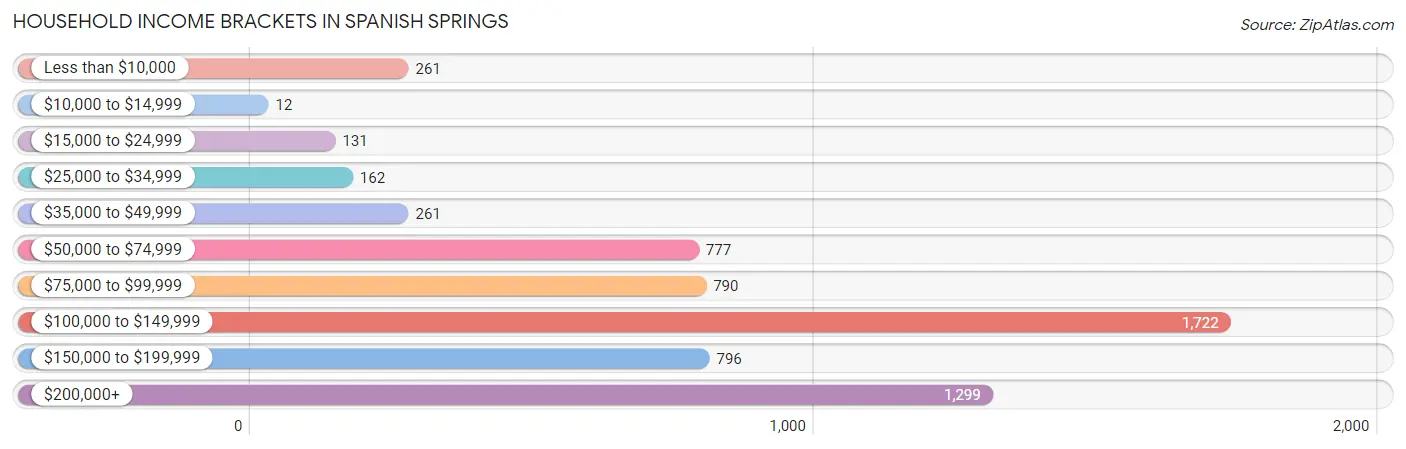
| Income Bracket | # Households | % Households |
| Less than $10,000 | 261 | 4.2% |
| $10,000 to $14,999 | 12 | 0.2% |
| $15,000 to $24,999 | 131 | 2.1% |
| $25,000 to $34,999 | 162 | 2.6% |
| $35,000 to $49,999 | 261 | 4.2% |
| $50,000 to $74,999 | 777 | 12.5% |
| $75,000 to $99,999 | 790 | 12.7% |
| $100,000 to $149,999 | 1,722 | 27.7% |
| $150,000 to $199,999 | 796 | 12.8% |
| $200,000+ | 1,299 | 20.9% |
Household Income by Householder Age in Spanish Springs
The median household income in Spanish Springs is $119,830, with the highest median household income of $146,736 found in the 45 to 64 years age bracket for the primary householder. A total of 2,825 households (45.4%) fall into this category.
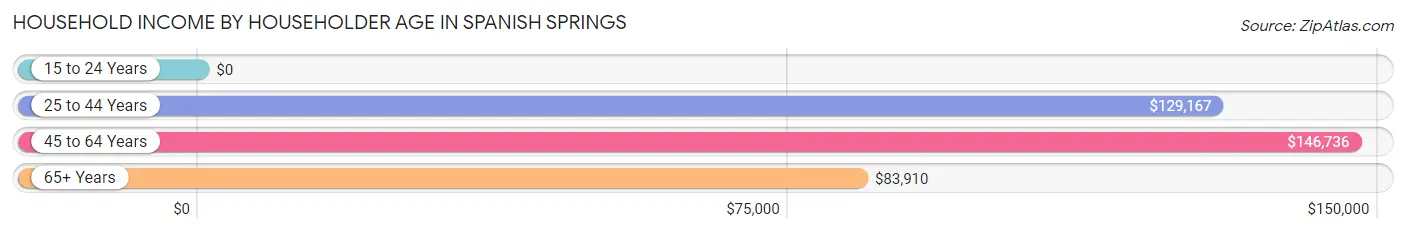
| Income Bracket | # Households | Median Income |
| 15 to 24 Years | 0 (0.0%) | $0 |
| 25 to 44 Years | 1,506 (24.2%) | $129,167 |
| 45 to 64 Years | 2,825 (45.4%) | $146,736 |
| 65+ Years | 1,886 (30.3%) | $83,910 |
| Total | 6,217 (100.0%) | $119,830 |
Poverty in Spanish Springs
Income Below Poverty by Sex and Age in Spanish Springs
With 4.3% poverty level for males and 3.8% for females among the residents of Spanish Springs, 18 to 24 year old males and 75 year old and over females are the most vulnerable to poverty, with 42 males (18.1%) and 116 females (20.6%) in their respective age groups living below the poverty level.
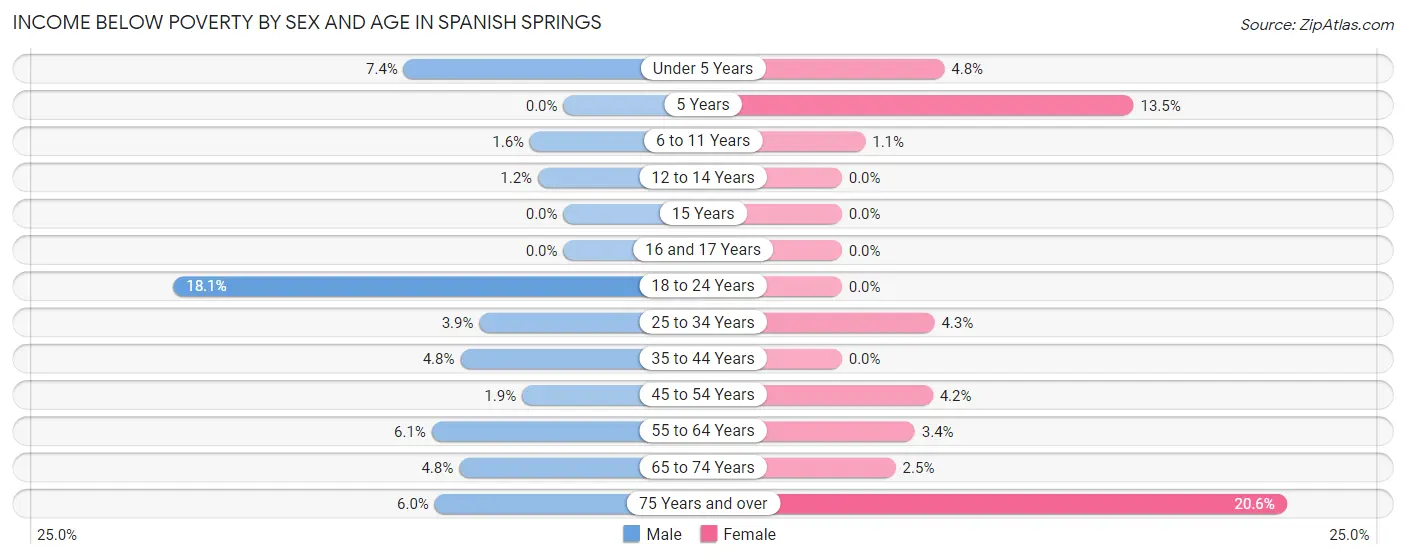
| Age Bracket | Male | Female |
| Under 5 Years | 26 (7.4%) | 14 (4.8%) |
| 5 Years | 0 (0.0%) | 13 (13.5%) |
| 6 to 11 Years | 9 (1.5%) | 5 (1.1%) |
| 12 to 14 Years | 5 (1.2%) | 0 (0.0%) |
| 15 Years | 0 (0.0%) | 0 (0.0%) |
| 16 and 17 Years | 0 (0.0%) | 0 (0.0%) |
| 18 to 24 Years | 42 (18.1%) | 0 (0.0%) |
| 25 to 34 Years | 27 (3.9%) | 30 (4.3%) |
| 35 to 44 Years | 51 (4.8%) | 0 (0.0%) |
| 45 to 54 Years | 26 (1.9%) | 54 (4.2%) |
| 55 to 64 Years | 83 (6.1%) | 55 (3.4%) |
| 65 to 74 Years | 55 (4.8%) | 25 (2.5%) |
| 75 Years and over | 24 (6.0%) | 116 (20.6%) |
| Total | 348 (4.3%) | 312 (3.8%) |
Income Above Poverty by Sex and Age in Spanish Springs
According to the poverty statistics in Spanish Springs, males aged 5 years and females aged 12 to 14 years are the age groups that are most secure financially, with 100.0% of males and 100.0% of females in these age groups living above the poverty line.
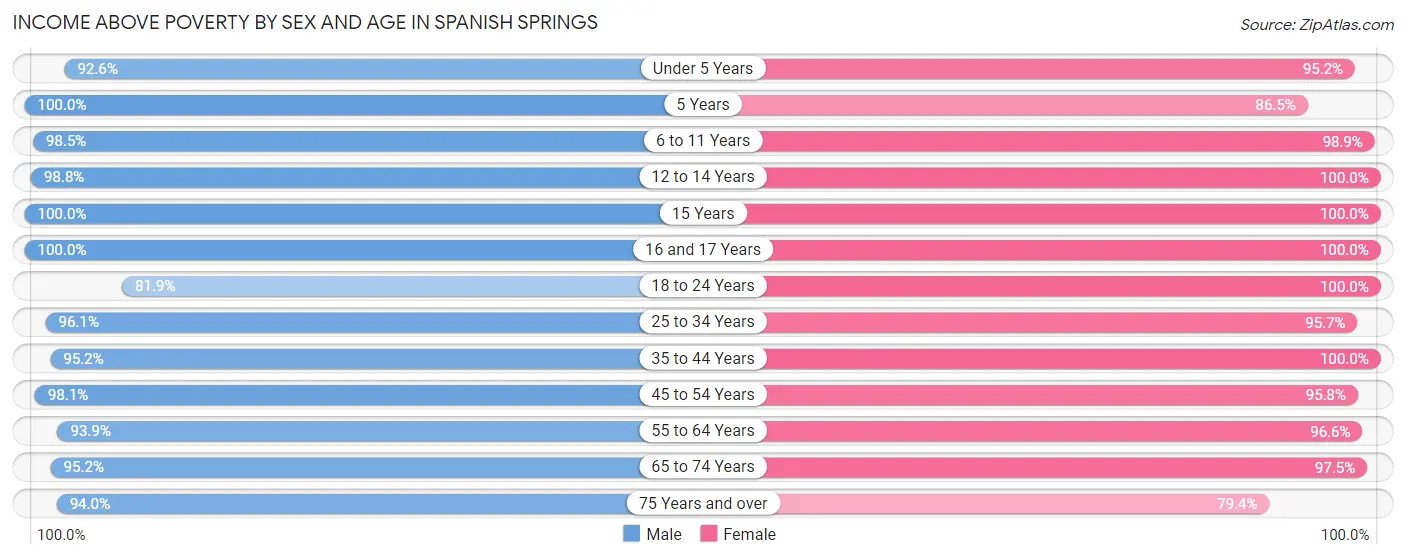
| Age Bracket | Male | Female |
| Under 5 Years | 325 (92.6%) | 280 (95.2%) |
| 5 Years | 115 (100.0%) | 83 (86.5%) |
| 6 to 11 Years | 572 (98.5%) | 453 (98.9%) |
| 12 to 14 Years | 417 (98.8%) | 403 (100.0%) |
| 15 Years | 42 (100.0%) | 104 (100.0%) |
| 16 and 17 Years | 370 (100.0%) | 168 (100.0%) |
| 18 to 24 Years | 190 (81.9%) | 594 (100.0%) |
| 25 to 34 Years | 665 (96.1%) | 668 (95.7%) |
| 35 to 44 Years | 1,015 (95.2%) | 984 (100.0%) |
| 45 to 54 Years | 1,330 (98.1%) | 1,225 (95.8%) |
| 55 to 64 Years | 1,275 (93.9%) | 1,568 (96.6%) |
| 65 to 74 Years | 1,082 (95.2%) | 975 (97.5%) |
| 75 Years and over | 378 (94.0%) | 446 (79.4%) |
| Total | 7,776 (95.7%) | 7,951 (96.2%) |
Income Below Poverty Among Married-Couple Families in Spanish Springs
The poverty statistics for married-couple families in Spanish Springs show that 1.8% or 74 of the total 4,115 families live below the poverty line. Families with 3 or 4 children have the highest poverty rate of 3.6%, comprising of 10 families. On the other hand, families with 1 or 2 children have the lowest poverty rate of 0.0%, which includes 0 families.
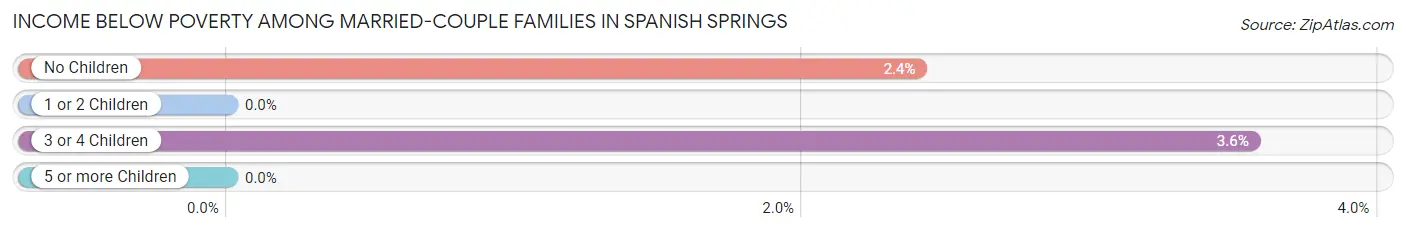
| Children | Above Poverty | Below Poverty |
| No Children | 2,598 (97.6%) | 64 (2.4%) |
| 1 or 2 Children | 1,138 (100.0%) | 0 (0.0%) |
| 3 or 4 Children | 271 (96.4%) | 10 (3.6%) |
| 5 or more Children | 34 (100.0%) | 0 (0.0%) |
| Total | 4,041 (98.2%) | 74 (1.8%) |
Income Below Poverty Among Single-Parent Households in Spanish Springs
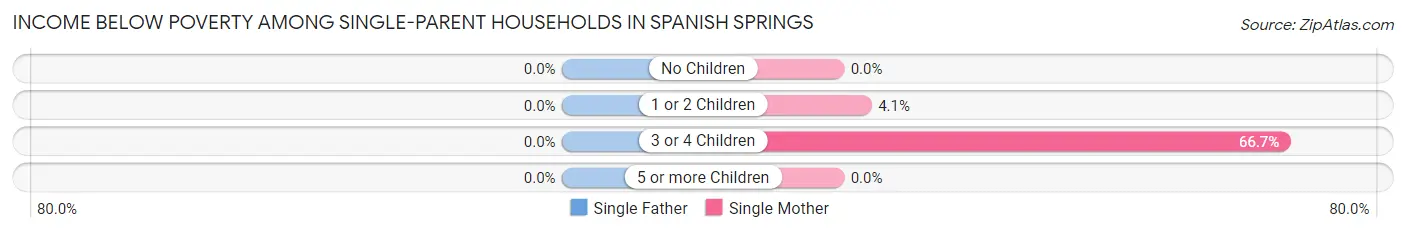
| Children | Single Father | Single Mother |
| No Children | 0 (0.0%) | 0 (0.0%) |
| 1 or 2 Children | 0 (0.0%) | 12 (4.1%) |
| 3 or 4 Children | 0 (0.0%) | 6 (66.7%) |
| 5 or more Children | 0 (0.0%) | 0 (0.0%) |
| Total | 0 (0.0%) | 18 (3.2%) |
Income Below Poverty Among Married-Couple vs Single-Parent Households in Spanish Springs
The poverty data for Spanish Springs shows that 74 of the married-couple family households (1.8%) and 18 of the single-parent households (1.9%) are living below the poverty level. Within the married-couple family households, those with 3 or 4 children have the highest poverty rate, with 10 households (3.6%) falling below the poverty line. Among the single-parent households, those with 3 or 4 children have the highest poverty rate, with 6 household (66.7%) living below poverty.
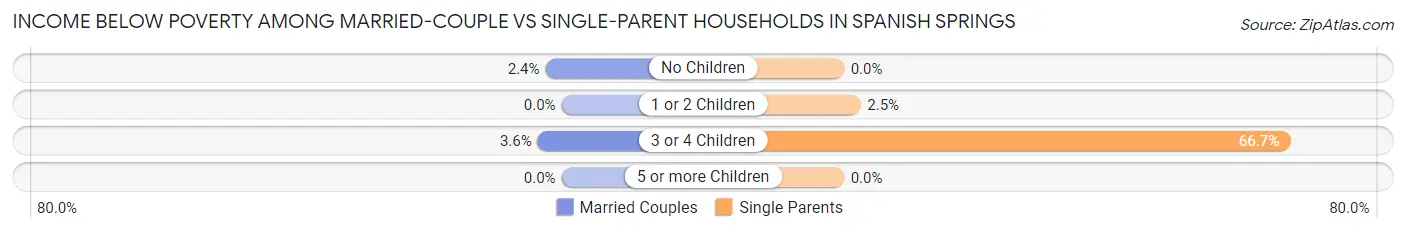
| Children | Married-Couple Families | Single-Parent Households |
| No Children | 64 (2.4%) | 0 (0.0%) |
| 1 or 2 Children | 0 (0.0%) | 12 (2.5%) |
| 3 or 4 Children | 10 (3.6%) | 6 (66.7%) |
| 5 or more Children | 0 (0.0%) | 0 (0.0%) |
| Total | 74 (1.8%) | 18 (1.9%) |
Race in Spanish Springs
The most populous races in Spanish Springs are White / Caucasian (13,355 | 81.3%), Hispanic or Latino (1,966 | 12.0%), and Two or more Races (1,511 | 9.2%).
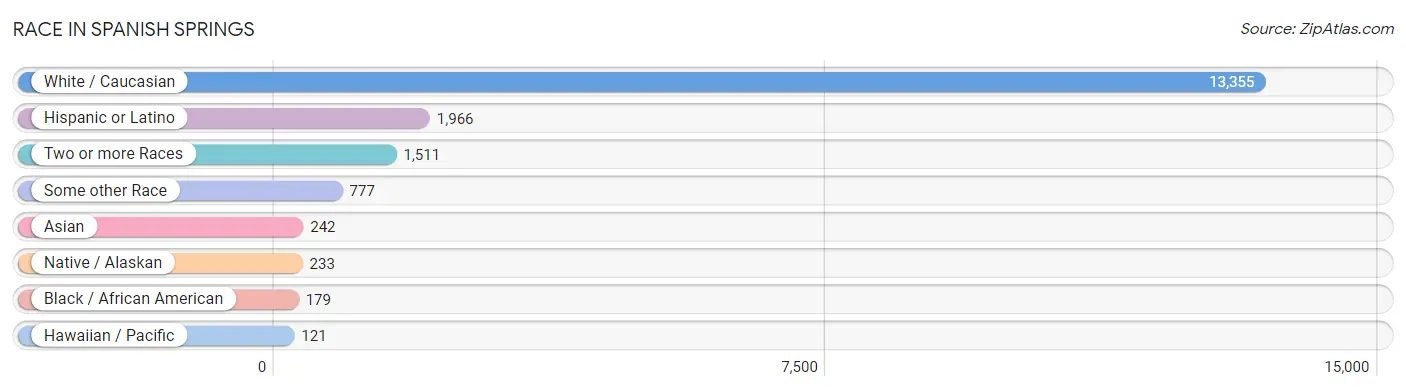
| Race | # Population | % Population |
| Asian | 242 | 1.5% |
| Black / African American | 179 | 1.1% |
| Hawaiian / Pacific | 121 | 0.7% |
| Hispanic or Latino | 1,966 | 12.0% |
| Native / Alaskan | 233 | 1.4% |
| White / Caucasian | 13,355 | 81.3% |
| Two or more Races | 1,511 | 9.2% |
| Some other Race | 777 | 4.7% |
| Total | 16,418 | 100.0% |
Ancestry in Spanish Springs
The most populous ancestries reported in Spanish Springs are German (2,668 | 16.3%), Irish (2,159 | 13.2%), English (2,033 | 12.4%), Mexican (1,313 | 8.0%), and Italian (1,222 | 7.4%), together accounting for 57.2% of all Spanish Springs residents.
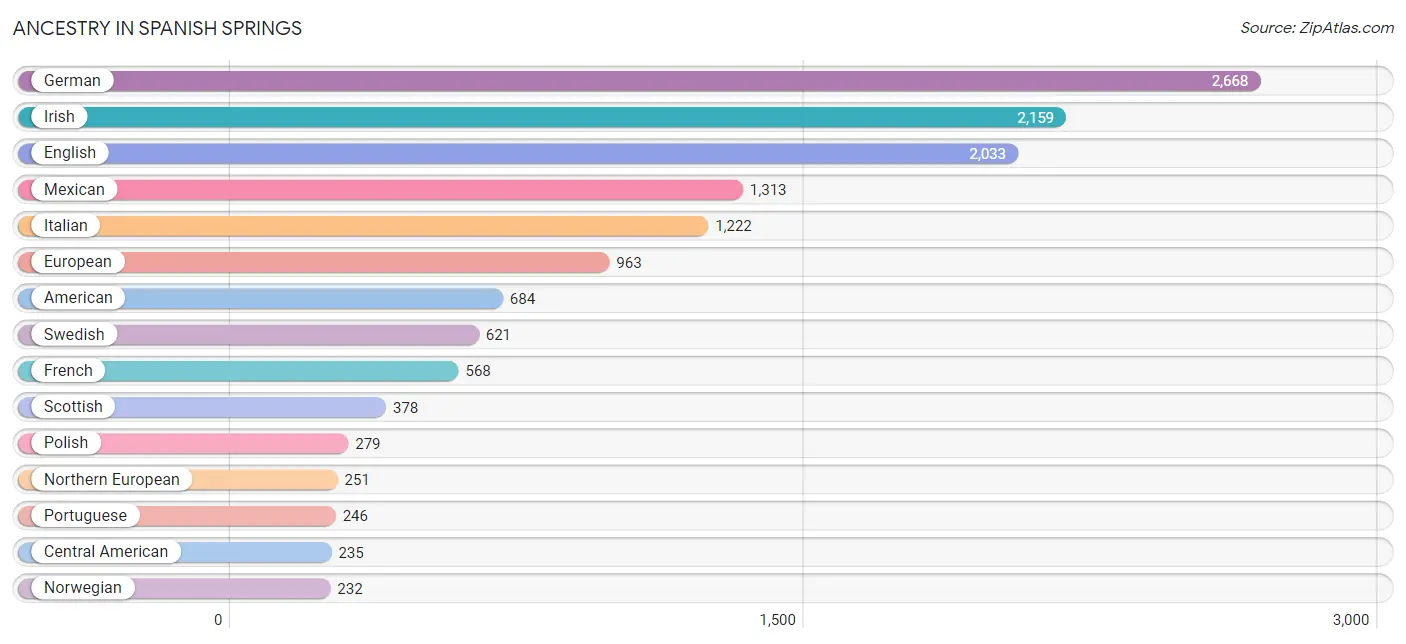
| Ancestry | # Population | % Population |
| Alsatian | 6 | 0.0% |
| American | 684 | 4.2% |
| Arab | 59 | 0.4% |
| Argentinean | 74 | 0.4% |
| Armenian | 27 | 0.2% |
| Basque | 40 | 0.2% |
| Belgian | 24 | 0.2% |
| Bhutanese | 93 | 0.6% |
| Blackfeet | 15 | 0.1% |
| Brazilian | 68 | 0.4% |
| British | 86 | 0.5% |
| Burmese | 90 | 0.5% |
| Cajun | 7 | 0.0% |
| Canadian | 84 | 0.5% |
| Central American | 235 | 1.4% |
| Central American Indian | 19 | 0.1% |
| Cherokee | 7 | 0.0% |
| Chilean | 12 | 0.1% |
| Chippewa | 4 | 0.0% |
| Cuban | 42 | 0.3% |
| Czech | 33 | 0.2% |
| Danish | 136 | 0.8% |
| Dutch | 176 | 1.1% |
| Eastern European | 160 | 1.0% |
| English | 2,033 | 12.4% |
| European | 963 | 5.9% |
| Finnish | 43 | 0.3% |
| French | 568 | 3.5% |
| French Canadian | 164 | 1.0% |
| German | 2,668 | 16.3% |
| Greek | 13 | 0.1% |
| Guamanian / Chamorro | 13 | 0.1% |
| Guatemalan | 101 | 0.6% |
| Haitian | 1 | 0.0% |
| Hungarian | 104 | 0.6% |
| Indian (Asian) | 40 | 0.2% |
| Indonesian | 3 | 0.0% |
| Irish | 2,159 | 13.2% |
| Iroquois | 17 | 0.1% |
| Italian | 1,222 | 7.4% |
| Korean | 19 | 0.1% |
| Lebanese | 46 | 0.3% |
| Lithuanian | 120 | 0.7% |
| Luxembourger | 15 | 0.1% |
| Mexican | 1,313 | 8.0% |
| Mexican American Indian | 39 | 0.2% |
| Native Hawaiian | 50 | 0.3% |
| Nicaraguan | 42 | 0.3% |
| Northern European | 251 | 1.5% |
| Norwegian | 232 | 1.4% |
| Pakistani | 7 | 0.0% |
| Palestinian | 13 | 0.1% |
| Peruvian | 9 | 0.1% |
| Polish | 279 | 1.7% |
| Portuguese | 246 | 1.5% |
| Potawatomi | 16 | 0.1% |
| Puerto Rican | 80 | 0.5% |
| Russian | 121 | 0.7% |
| Salvadoran | 92 | 0.6% |
| Samoan | 100 | 0.6% |
| Scandinavian | 57 | 0.4% |
| Scotch-Irish | 45 | 0.3% |
| Scottish | 378 | 2.3% |
| Serbian | 10 | 0.1% |
| Shoshone | 25 | 0.2% |
| Sioux | 9 | 0.1% |
| Slovak | 7 | 0.0% |
| South American | 95 | 0.6% |
| Spaniard | 137 | 0.8% |
| Spanish | 48 | 0.3% |
| Sri Lankan | 20 | 0.1% |
| Swedish | 621 | 3.8% |
| Swiss | 84 | 0.5% |
| Thai | 99 | 0.6% |
| Ukrainian | 6 | 0.0% |
| Welsh | 72 | 0.4% |
| Yugoslavian | 38 | 0.2% | View All 77 Rows |
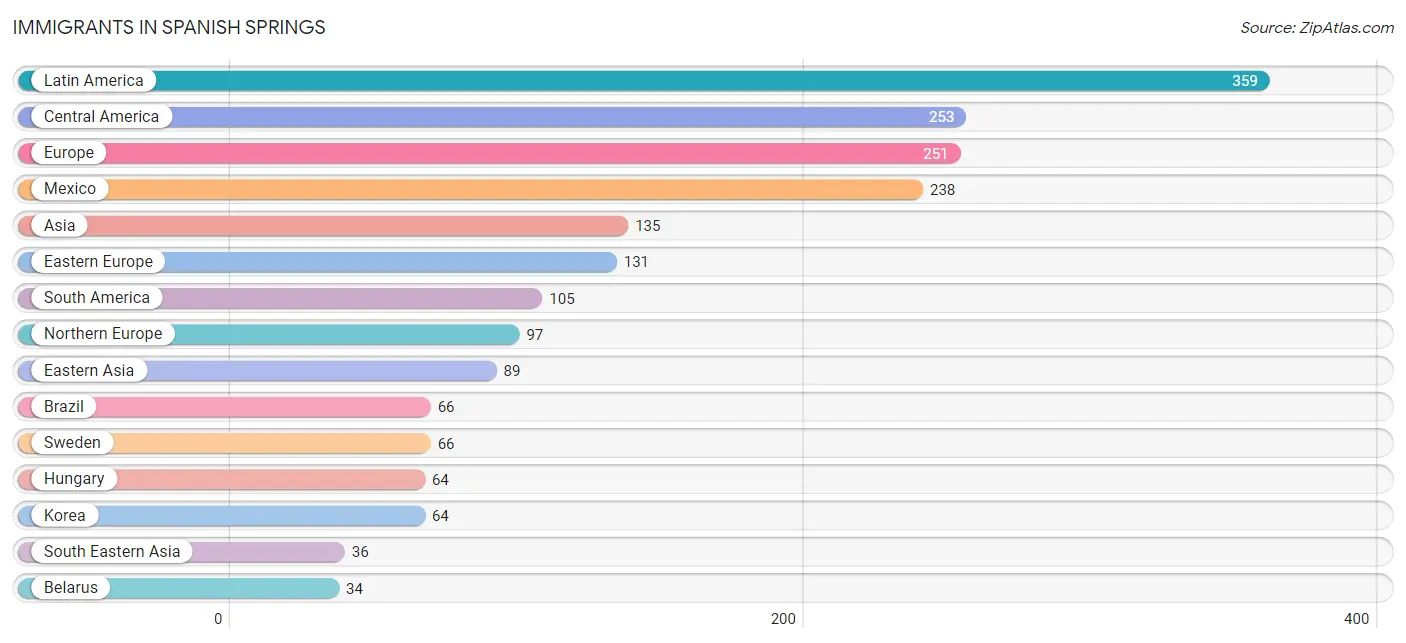
Immigrants in Spanish Springs
The most numerous immigrant groups reported in Spanish Springs came from Latin America (359 | 2.2%), Central America (253 | 1.5%), Europe (251 | 1.5%), Mexico (238 | 1.5%), and Asia (135 | 0.8%), together accounting for 7.5% of all Spanish Springs residents.
| Immigration Origin | # Population | % Population |
| Argentina | 27 | 0.2% |
| Asia | 135 | 0.8% |
| Belarus | 34 | 0.2% |
| Bosnia and Herzegovina | 25 | 0.2% |
| Brazil | 66 | 0.4% |
| Canada | 32 | 0.2% |
| Caribbean | 1 | 0.0% |
| Central America | 253 | 1.5% |
| Chile | 12 | 0.1% |
| China | 18 | 0.1% |
| Cuba | 1 | 0.0% |
| Eastern Asia | 89 | 0.5% |
| Eastern Europe | 131 | 0.8% |
| El Salvador | 11 | 0.1% |
| England | 13 | 0.1% |
| Europe | 251 | 1.5% |
| Germany | 23 | 0.1% |
| Guatemala | 4 | 0.0% |
| Hong Kong | 8 | 0.1% |
| Hungary | 64 | 0.4% |
| India | 10 | 0.1% |
| Japan | 7 | 0.0% |
| Korea | 64 | 0.4% |
| Latin America | 359 | 2.2% |
| Mexico | 238 | 1.5% |
| Northern Europe | 97 | 0.6% |
| Philippines | 20 | 0.1% |
| Russia | 8 | 0.1% |
| South America | 105 | 0.6% |
| South Central Asia | 10 | 0.1% |
| South Eastern Asia | 36 | 0.2% |
| Sweden | 66 | 0.4% |
| Taiwan | 10 | 0.1% |
| Thailand | 4 | 0.0% |
| Vietnam | 9 | 0.1% |
| Western Europe | 23 | 0.1% | View All 36 Rows |
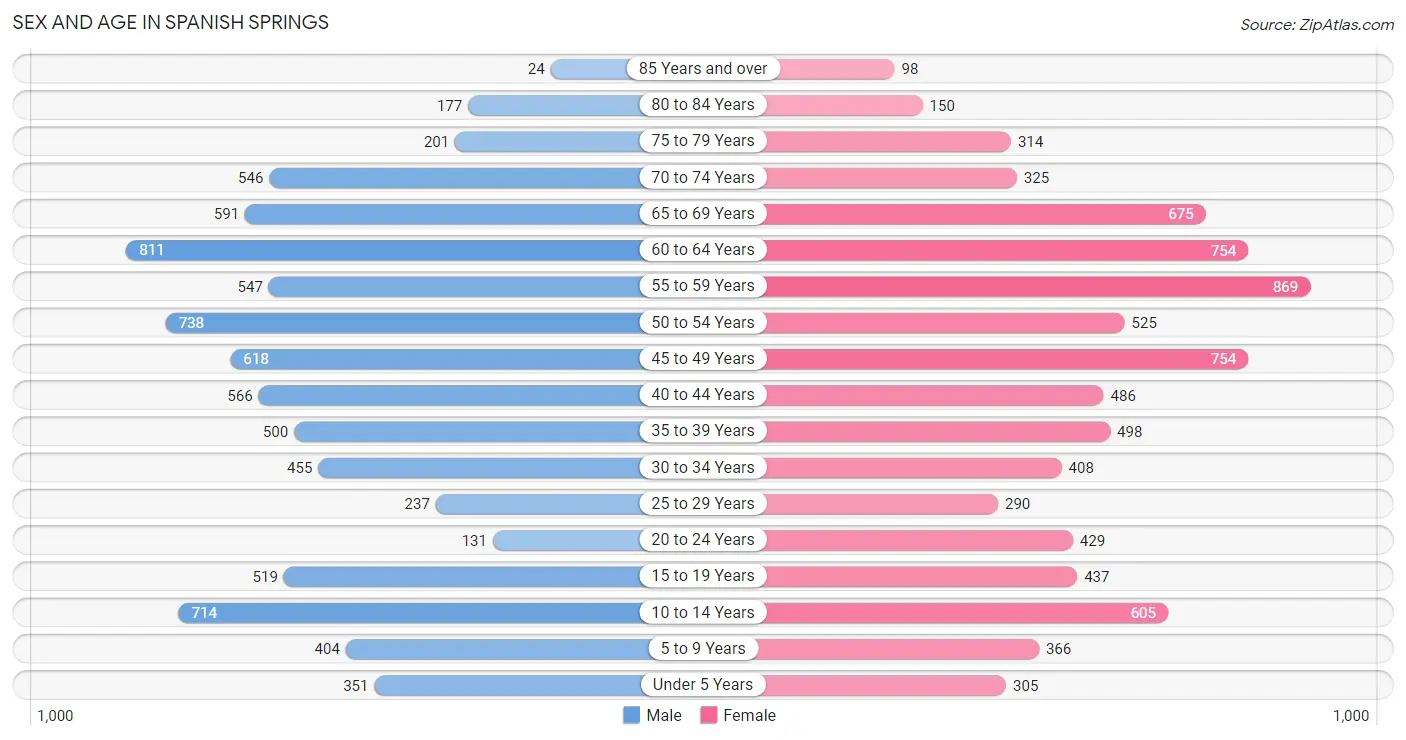
Sex and Age in Spanish Springs
Sex and Age in Spanish Springs
The most populous age groups in Spanish Springs are 60 to 64 Years (811 | 10.0%) for men and 55 to 59 Years (869 | 10.5%) for women.
| Age Bracket | Male | Female |
| Under 5 Years | 351 (4.3%) | 305 (3.7%) |
| 5 to 9 Years | 404 (5.0%) | 366 (4.4%) |
| 10 to 14 Years | 714 (8.8%) | 605 (7.3%) |
| 15 to 19 Years | 519 (6.4%) | 437 (5.3%) |
| 20 to 24 Years | 131 (1.6%) | 429 (5.2%) |
| 25 to 29 Years | 237 (2.9%) | 290 (3.5%) |
| 30 to 34 Years | 455 (5.6%) | 408 (4.9%) |
| 35 to 39 Years | 500 (6.1%) | 498 (6.0%) |
| 40 to 44 Years | 566 (7.0%) | 486 (5.9%) |
| 45 to 49 Years | 618 (7.6%) | 754 (9.1%) |
| 50 to 54 Years | 738 (9.1%) | 525 (6.3%) |
| 55 to 59 Years | 547 (6.7%) | 869 (10.5%) |
| 60 to 64 Years | 811 (10.0%) | 754 (9.1%) |
| 65 to 69 Years | 591 (7.3%) | 675 (8.1%) |
| 70 to 74 Years | 546 (6.7%) | 325 (3.9%) |
| 75 to 79 Years | 201 (2.5%) | 314 (3.8%) |
| 80 to 84 Years | 177 (2.2%) | 150 (1.8%) |
| 85 Years and over | 24 (0.3%) | 98 (1.2%) |
| Total | 8,130 (100.0%) | 8,288 (100.0%) |
Families and Households in Spanish Springs
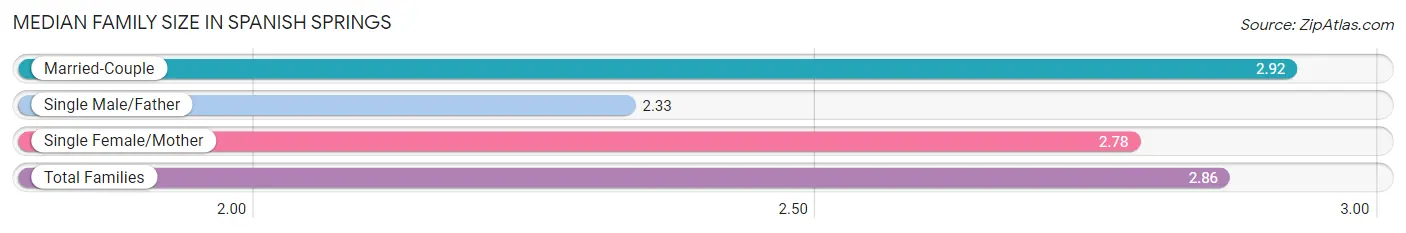
Median Family Size in Spanish Springs
The median family size in Spanish Springs is 2.86 persons per family, with married-couple families (4,115 | 81.6%) accounting for the largest median family size of 2.92 persons per family. On the other hand, single male/father families (364 | 7.2%) represent the smallest median family size with 2.33 persons per family.
| Family Type | # Families | Family Size |
| Married-Couple | 4,115 (81.6%) | 2.92 |
| Single Male/Father | 364 (7.2%) | 2.33 |
| Single Female/Mother | 566 (11.2%) | 2.78 |
| Total Families | 5,045 (100.0%) | 2.86 |
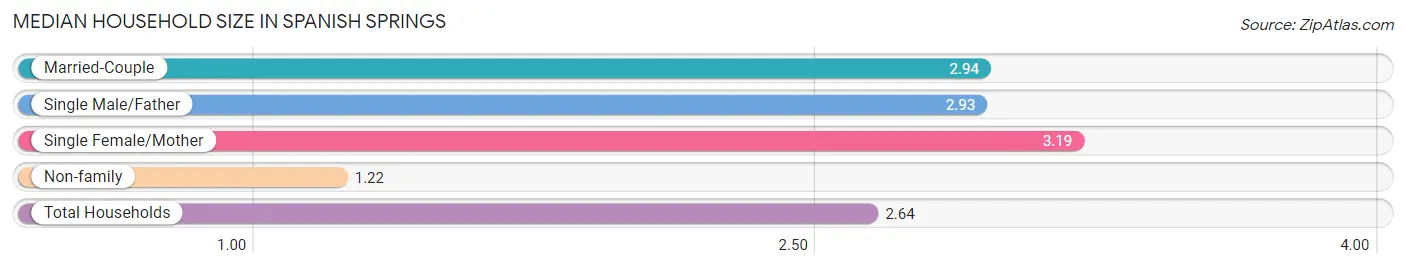
Median Household Size in Spanish Springs
The median household size in Spanish Springs is 2.64 persons per household, with single female/mother households (566 | 9.1%) accounting for the largest median household size of 3.19 persons per household. non-family households (1,172 | 18.9%) represent the smallest median household size with 1.22 persons per household.
| Household Type | # Households | Household Size |
| Married-Couple | 4,115 (66.2%) | 2.94 |
| Single Male/Father | 364 (5.9%) | 2.93 |
| Single Female/Mother | 566 (9.1%) | 3.19 |
| Non-family | 1,172 (18.9%) | 1.22 |
| Total Households | 6,217 (100.0%) | 2.64 |
Household Size by Marriage Status in Spanish Springs
Out of a total of 6,217 households in Spanish Springs, 5,045 (81.1%) are family households, while 1,172 (18.9%) are nonfamily households. The most numerous type of family households are 2-person households, comprising 2,404, and the most common type of nonfamily households are 1-person households, comprising 930.
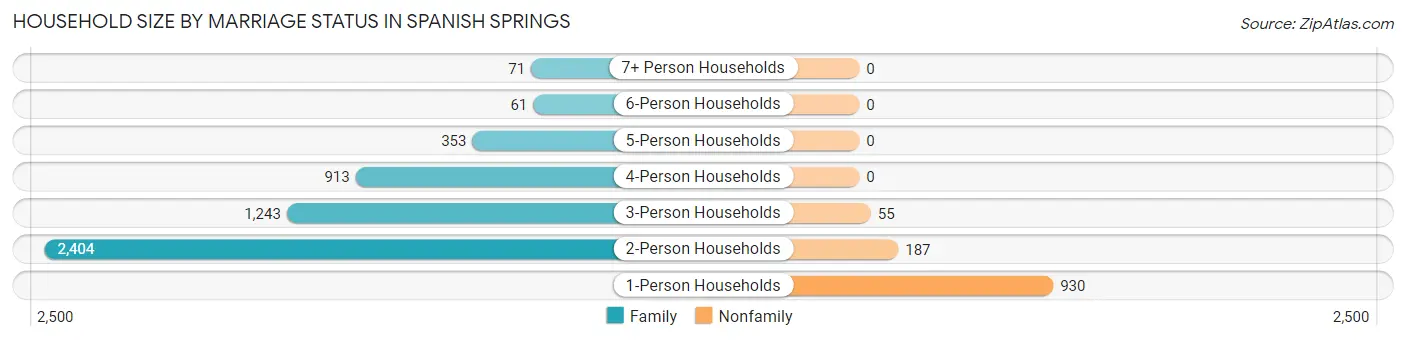
| Household Size | Family Households | Nonfamily Households |
| 1-Person Households | - | 930 (15.0%) |
| 2-Person Households | 2,404 (38.7%) | 187 (3.0%) |
| 3-Person Households | 1,243 (20.0%) | 55 (0.9%) |
| 4-Person Households | 913 (14.7%) | 0 (0.0%) |
| 5-Person Households | 353 (5.7%) | 0 (0.0%) |
| 6-Person Households | 61 (1.0%) | 0 (0.0%) |
| 7+ Person Households | 71 (1.1%) | 0 (0.0%) |
| Total | 5,045 (81.1%) | 1,172 (18.9%) |
Female Fertility in Spanish Springs
Fertility by Age in Spanish Springs
Average fertility rate in Spanish Springs is 47.0 births per 1,000 women. Women in the age bracket of 35 to 50 years have the highest fertility rate with 57.0 births per 1,000 women. Women in the age bracket of 35 to 50 years acount for 64.8% of all women with births.
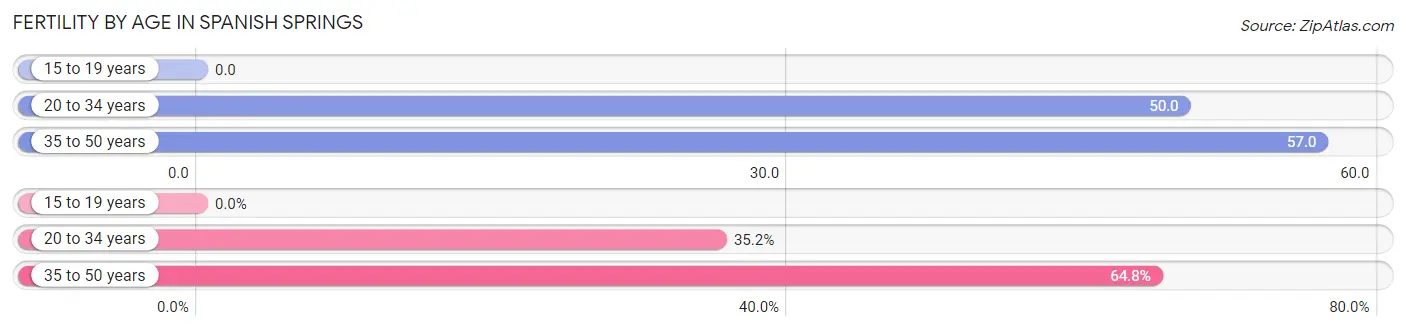
| Age Bracket | Women with Births | Births / 1,000 Women |
| 15 to 19 years | 0 (0.0%) | 0.0 |
| 20 to 34 years | 56 (35.2%) | 50.0 |
| 35 to 50 years | 103 (64.8%) | 57.0 |
| Total | 159 (100.0%) | 47.0 |
Fertility by Age by Marriage Status in Spanish Springs
86.8% of women with births (159) in Spanish Springs are married. The highest percentage of unmarried women with births falls into 35 to 50 years age bracket with 20.4% of them unmarried at the time of birth, while the lowest percentage of unmarried women with births belong to 20 to 34 years age bracket with 0.0% of them unmarried.
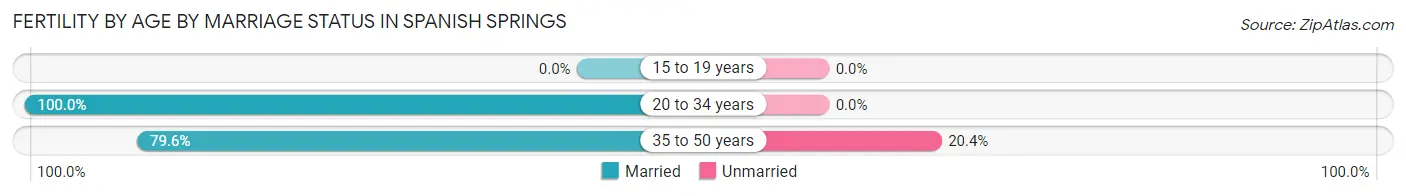
| Age Bracket | Married | Unmarried |
| 15 to 19 years | 0 (0.0%) | 0 (0.0%) |
| 20 to 34 years | 56 (100.0%) | 0 (0.0%) |
| 35 to 50 years | 82 (79.6%) | 21 (20.4%) |
| Total | 138 (86.8%) | 21 (13.2%) |
Fertility by Education in Spanish Springs
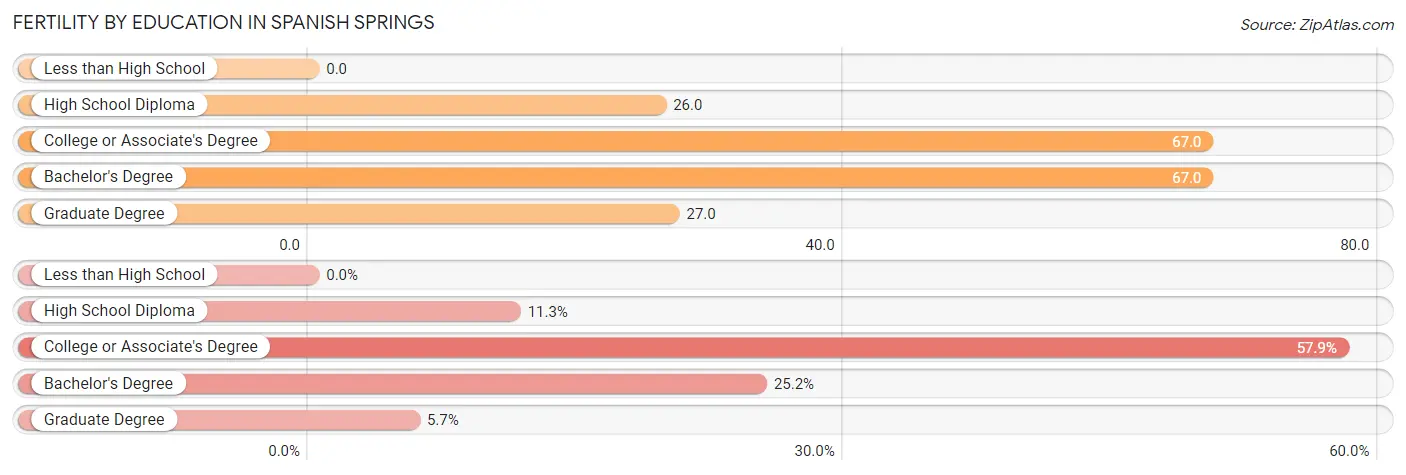
| Educational Attainment | Women with Births | Births / 1,000 Women |
| Less than High School | 0 (0.0%) | 0.0 |
| High School Diploma | 18 (11.3%) | 26.0 |
| College or Associate's Degree | 92 (57.9%) | 67.0 |
| Bachelor's Degree | 40 (25.2%) | 67.0 |
| Graduate Degree | 9 (5.7%) | 27.0 |
| Total | 159 (100.0%) | 47.0 |
Fertility by Education by Marriage Status in Spanish Springs
13.2% of women with births in Spanish Springs are unmarried. Women with the educational attainment of high school diploma are most likely to be married with 100.0% of them married at childbirth, while women with the educational attainment of college or associate's degree are least likely to be married with 22.8% of them unmarried at childbirth.
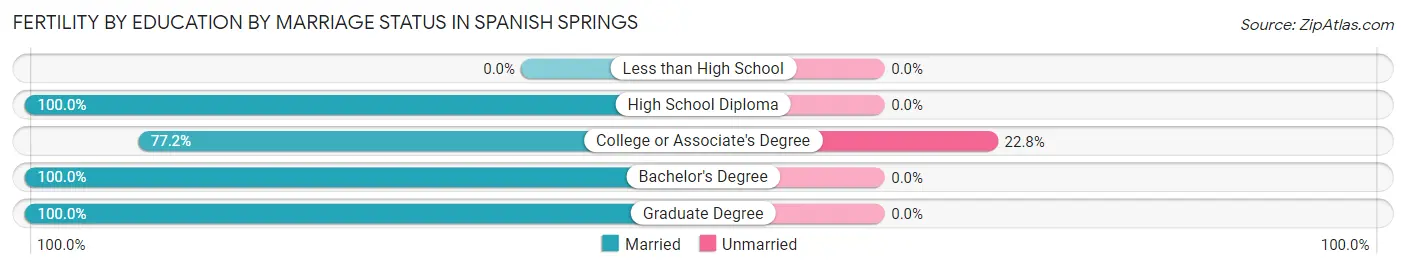
| Educational Attainment | Married | Unmarried |
| Less than High School | 0 (0.0%) | 0 (0.0%) |
| High School Diploma | 18 (100.0%) | 0 (0.0%) |
| College or Associate's Degree | 71 (77.2%) | 21 (22.8%) |
| Bachelor's Degree | 40 (100.0%) | 0 (0.0%) |
| Graduate Degree | 9 (100.0%) | 0 (0.0%) |
| Total | 138 (86.8%) | 21 (13.2%) |
Employment Characteristics in Spanish Springs
Employment by Class of Employer in Spanish Springs
Among the 8,560 employed individuals in Spanish Springs, private company employees (5,668 | 66.2%), local government employees (1,082 | 12.6%), and self-employed (not incorporated) (477 | 5.6%) make up the most common classes of employment.
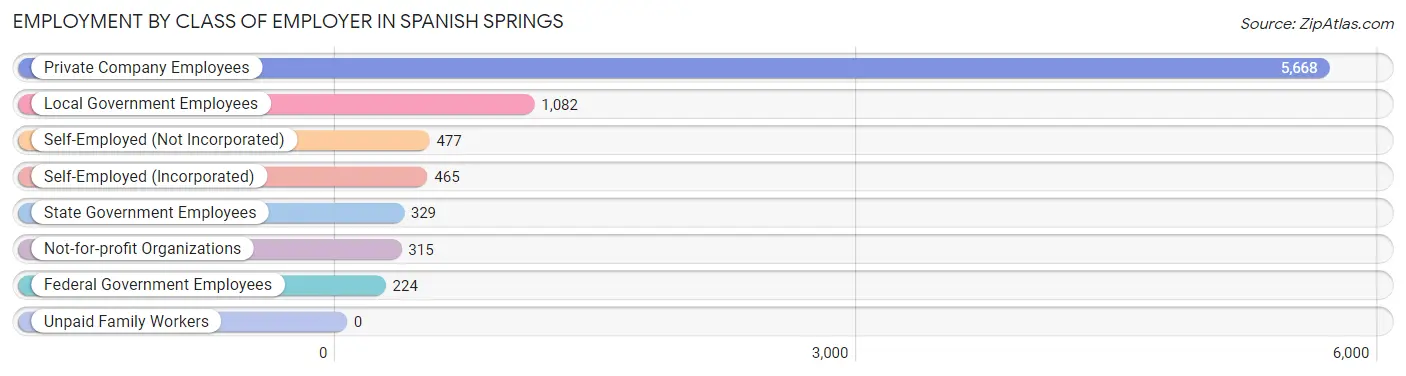
| Employer Class | # Employees | % Employees |
| Private Company Employees | 5,668 | 66.2% |
| Self-Employed (Incorporated) | 465 | 5.4% |
| Self-Employed (Not Incorporated) | 477 | 5.6% |
| Not-for-profit Organizations | 315 | 3.7% |
| Local Government Employees | 1,082 | 12.6% |
| State Government Employees | 329 | 3.8% |
| Federal Government Employees | 224 | 2.6% |
| Unpaid Family Workers | 0 | 0.0% |
| Total | 8,560 | 100.0% |
Employment Status by Age in Spanish Springs
According to the labor force statistics for Spanish Springs, out of the total population over 16 years of age (13,527), 66.3% or 8,968 individuals are in the labor force, with 3.2% or 287 of them unemployed. The age group with the highest labor force participation rate is 25 to 29 years, with 92.6% or 488 individuals in the labor force. Within the labor force, the 16 to 19 years age range has the highest percentage of unemployed individuals, with 21.3% or 98 of them being unemployed.
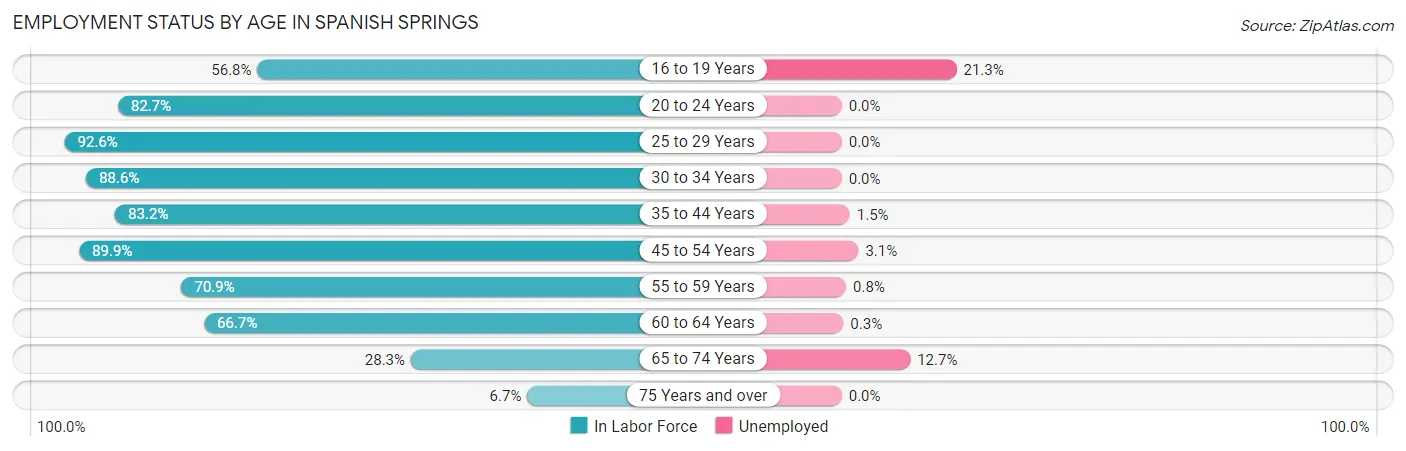
| Age Bracket | In Labor Force | Unemployed |
| 16 to 19 Years | 460 (56.8%) | 98 (21.3%) |
| 20 to 24 Years | 463 (82.7%) | 0 (0.0%) |
| 25 to 29 Years | 488 (92.6%) | 0 (0.0%) |
| 30 to 34 Years | 765 (88.6%) | 0 (0.0%) |
| 35 to 44 Years | 1,706 (83.2%) | 26 (1.5%) |
| 45 to 54 Years | 2,369 (89.9%) | 73 (3.1%) |
| 55 to 59 Years | 1,004 (70.9%) | 8 (0.8%) |
| 60 to 64 Years | 1,044 (66.7%) | 3 (0.3%) |
| 65 to 74 Years | 605 (28.3%) | 77 (12.7%) |
| 75 Years and over | 65 (6.7%) | 0 (0.0%) |
| Total | 8,968 (66.3%) | 287 (3.2%) |
Employment Status by Educational Attainment in Spanish Springs
According to labor force statistics for Spanish Springs, 81.5% of individuals (7,381) out of the total population between 25 and 64 years of age (9,056) are in the labor force, with 1.5% or 111 of them being unemployed. The group with the highest labor force participation rate are those with the educational attainment of bachelor's degree or higher, with 90.5% or 2,564 individuals in the labor force. Within the labor force, individuals with high school diploma education have the highest percentage of unemployment, with 2.9% or 50 of them being unemployed.
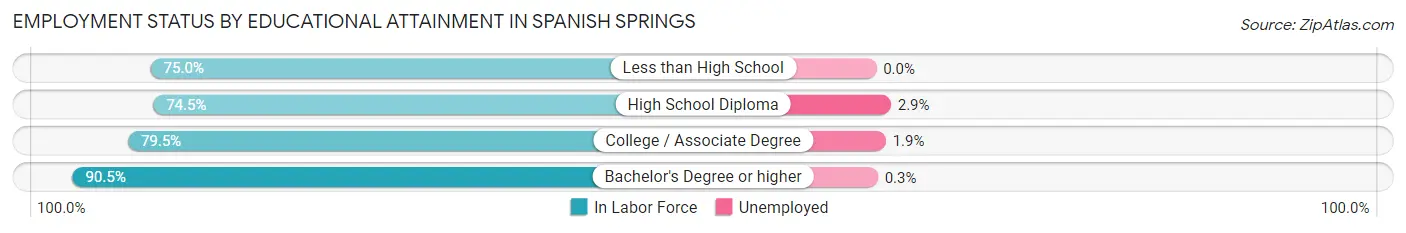
| Educational Attainment | In Labor Force | Unemployed |
| Less than High School | 285 (75.0%) | 0 (0.0%) |
| High School Diploma | 1,737 (74.5%) | 68 (2.9%) |
| College / Associate Degree | 2,791 (79.5%) | 67 (1.9%) |
| Bachelor's Degree or higher | 2,564 (90.5%) | 8 (0.3%) |
| Total | 7,381 (81.5%) | 136 (1.5%) |
Employment Occupations by Sex in Spanish Springs
Management, Business, Science and Arts Occupations
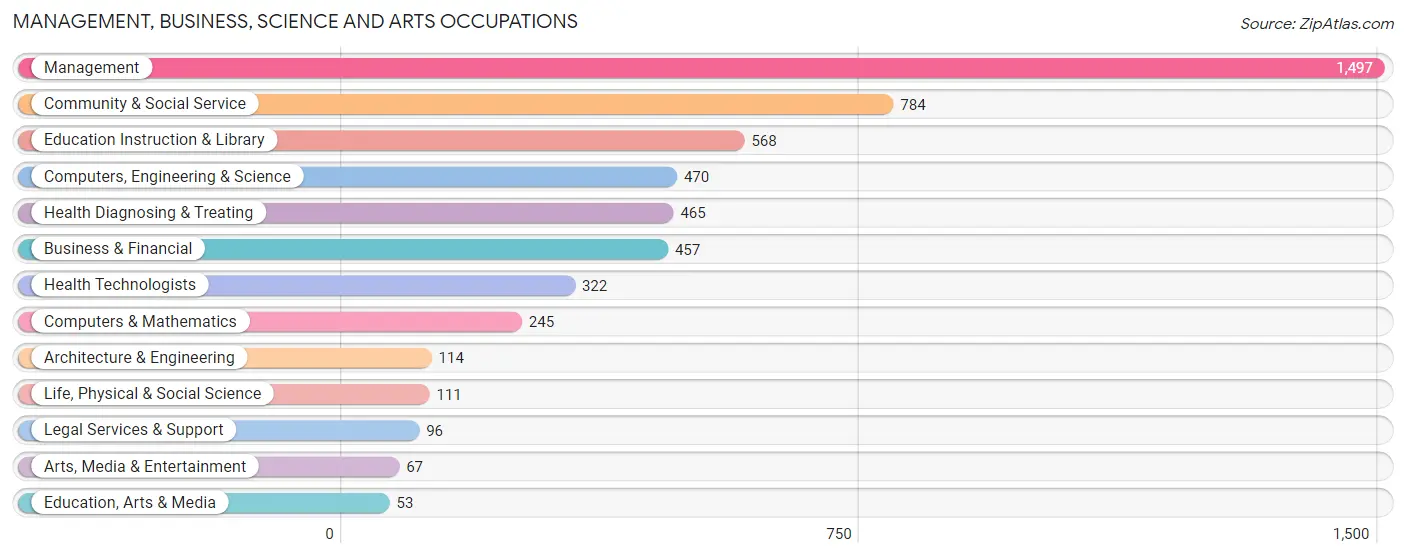
The most common Management, Business, Science and Arts occupations in Spanish Springs are Management (1,497 | 17.3%), Community & Social Service (784 | 9.0%), Education Instruction & Library (568 | 6.6%), Computers, Engineering & Science (470 | 5.4%), and Health Diagnosing & Treating (465 | 5.4%).
Management, Business, Science and Arts Occupations by Sex
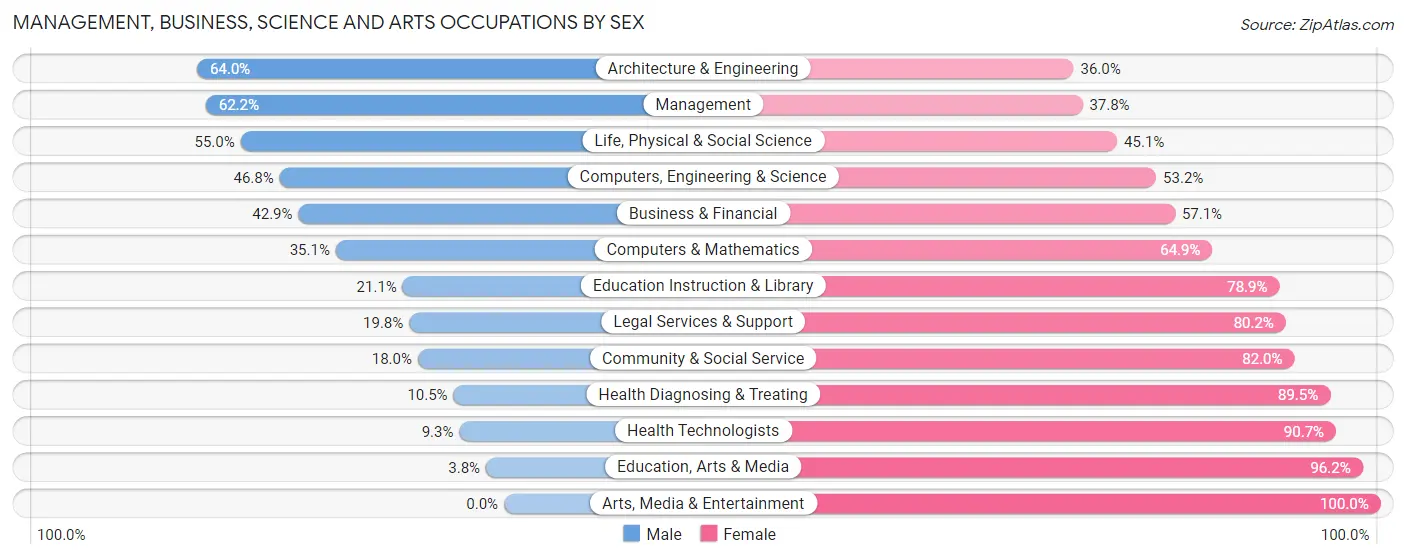
Within the Management, Business, Science and Arts occupations in Spanish Springs, the most male-oriented occupations are Architecture & Engineering (64.0%), Management (62.2%), and Life, Physical & Social Science (54.9%), while the most female-oriented occupations are Arts, Media & Entertainment (100.0%), Education, Arts & Media (96.2%), and Health Technologists (90.7%).
| Occupation | Male | Female |
| Management | 931 (62.2%) | 566 (37.8%) |
| Business & Financial | 196 (42.9%) | 261 (57.1%) |
| Computers, Engineering & Science | 220 (46.8%) | 250 (53.2%) |
| Computers & Mathematics | 86 (35.1%) | 159 (64.9%) |
| Architecture & Engineering | 73 (64.0%) | 41 (36.0%) |
| Life, Physical & Social Science | 61 (54.9%) | 50 (45.1%) |
| Community & Social Service | 141 (18.0%) | 643 (82.0%) |
| Education, Arts & Media | 2 (3.8%) | 51 (96.2%) |
| Legal Services & Support | 19 (19.8%) | 77 (80.2%) |
| Education Instruction & Library | 120 (21.1%) | 448 (78.9%) |
| Arts, Media & Entertainment | 0 (0.0%) | 67 (100.0%) |
| Health Diagnosing & Treating | 49 (10.5%) | 416 (89.5%) |
| Health Technologists | 30 (9.3%) | 292 (90.7%) |
| Total (Category) | 1,537 (41.8%) | 2,136 (58.2%) |
| Total (Overall) | 4,264 (49.2%) | 4,396 (50.8%) |
Services Occupations
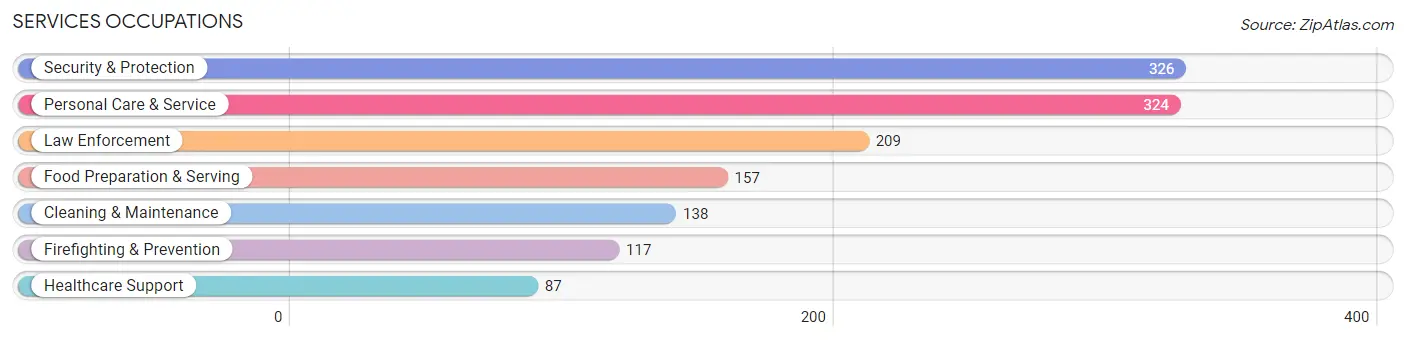
The most common Services occupations in Spanish Springs are Security & Protection (326 | 3.8%), Personal Care & Service (324 | 3.7%), Law Enforcement (209 | 2.4%), Food Preparation & Serving (157 | 1.8%), and Cleaning & Maintenance (138 | 1.6%).
Services Occupations by Sex
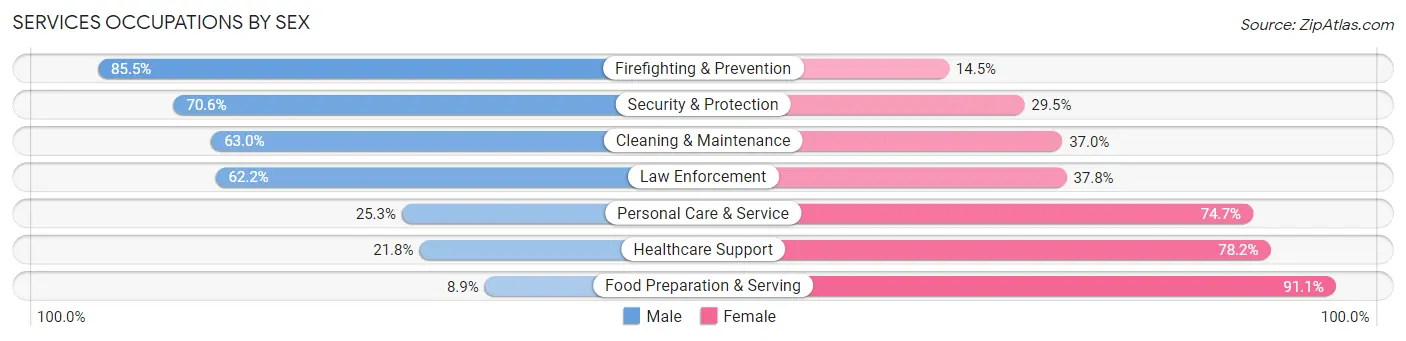
Within the Services occupations in Spanish Springs, the most male-oriented occupations are Firefighting & Prevention (85.5%), Security & Protection (70.6%), and Cleaning & Maintenance (63.0%), while the most female-oriented occupations are Food Preparation & Serving (91.1%), Healthcare Support (78.2%), and Personal Care & Service (74.7%).
| Occupation | Male | Female |
| Healthcare Support | 19 (21.8%) | 68 (78.2%) |
| Security & Protection | 230 (70.6%) | 96 (29.4%) |
| Firefighting & Prevention | 100 (85.5%) | 17 (14.5%) |
| Law Enforcement | 130 (62.2%) | 79 (37.8%) |
| Food Preparation & Serving | 14 (8.9%) | 143 (91.1%) |
| Cleaning & Maintenance | 87 (63.0%) | 51 (37.0%) |
| Personal Care & Service | 82 (25.3%) | 242 (74.7%) |
| Total (Category) | 432 (41.9%) | 600 (58.1%) |
| Total (Overall) | 4,264 (49.2%) | 4,396 (50.8%) |
Sales and Office Occupations
The most common Sales and Office occupations in Spanish Springs are Office & Administration (1,263 | 14.6%), and Sales & Related (784 | 9.0%).
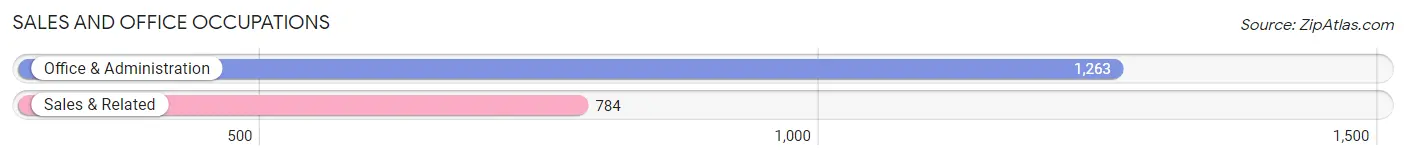
Sales and Office Occupations by Sex
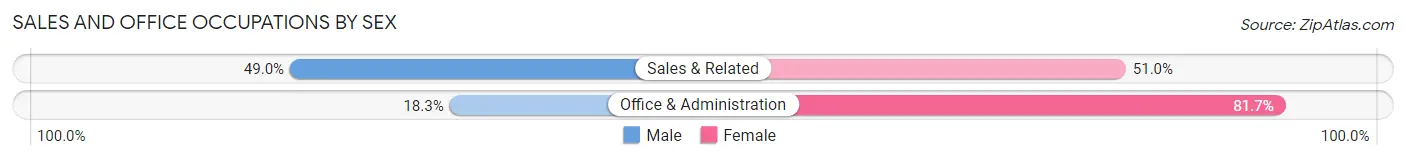
| Occupation | Male | Female |
| Sales & Related | 384 (49.0%) | 400 (51.0%) |
| Office & Administration | 231 (18.3%) | 1,032 (81.7%) |
| Total (Category) | 615 (30.0%) | 1,432 (70.0%) |
| Total (Overall) | 4,264 (49.2%) | 4,396 (50.8%) |
Natural Resources, Construction and Maintenance Occupations
The most common Natural Resources, Construction and Maintenance occupations in Spanish Springs are Installation, Maintenance & Repair (486 | 5.6%), Construction & Extraction (442 | 5.1%), and Farming, Fishing & Forestry (17 | 0.2%).
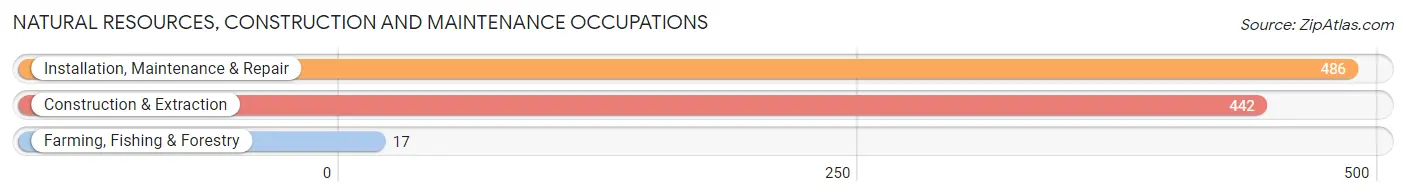
Natural Resources, Construction and Maintenance Occupations by Sex
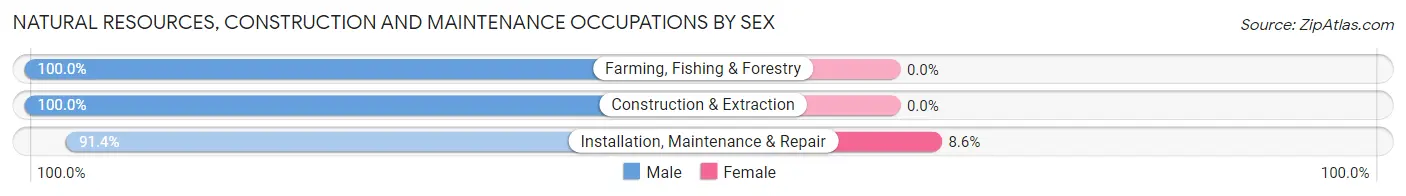
| Occupation | Male | Female |
| Farming, Fishing & Forestry | 17 (100.0%) | 0 (0.0%) |
| Construction & Extraction | 442 (100.0%) | 0 (0.0%) |
| Installation, Maintenance & Repair | 444 (91.4%) | 42 (8.6%) |
| Total (Category) | 903 (95.6%) | 42 (4.4%) |
| Total (Overall) | 4,264 (49.2%) | 4,396 (50.8%) |
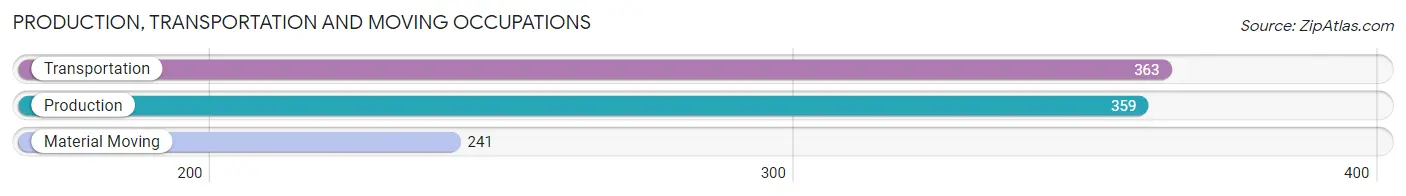
Production, Transportation and Moving Occupations
The most common Production, Transportation and Moving occupations in Spanish Springs are Transportation (363 | 4.2%), Production (359 | 4.2%), and Material Moving (241 | 2.8%).
Production, Transportation and Moving Occupations by Sex
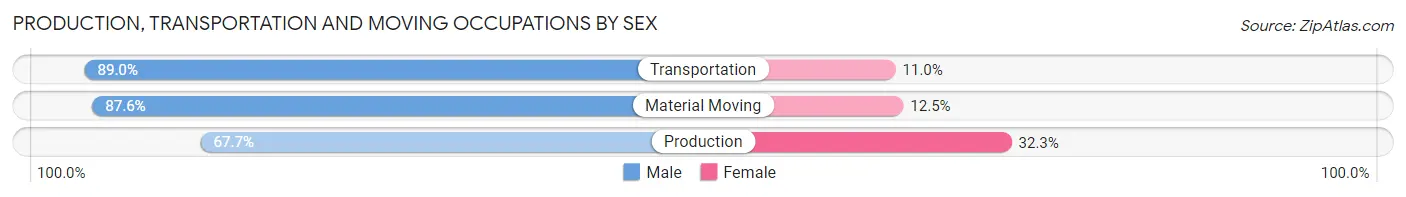
| Occupation | Male | Female |
| Production | 243 (67.7%) | 116 (32.3%) |
| Transportation | 323 (89.0%) | 40 (11.0%) |
| Material Moving | 211 (87.5%) | 30 (12.4%) |
| Total (Category) | 777 (80.7%) | 186 (19.3%) |
| Total (Overall) | 4,264 (49.2%) | 4,396 (50.8%) |
Employment Industries by Sex in Spanish Springs
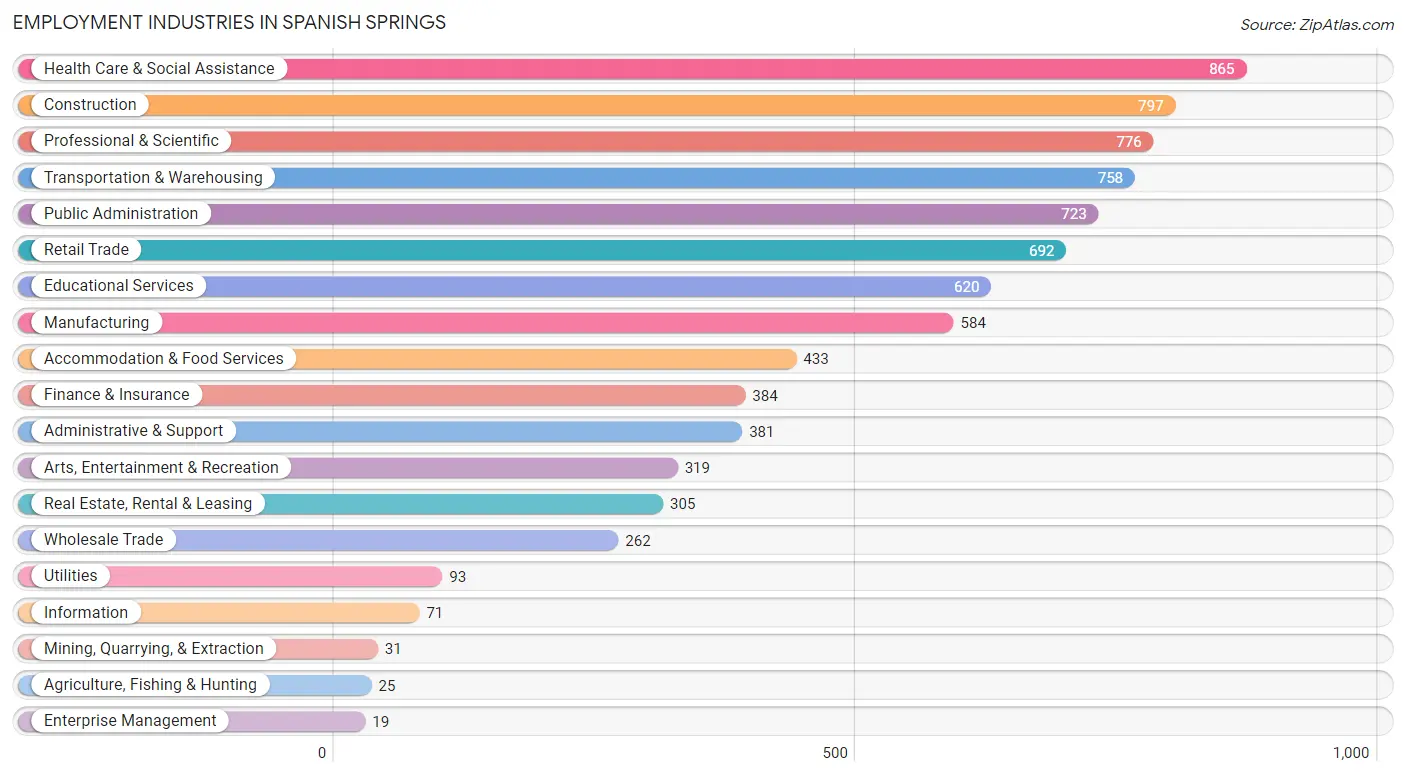
Employment Industries in Spanish Springs
The major employment industries in Spanish Springs include Health Care & Social Assistance (865 | 10.0%), Construction (797 | 9.2%), Professional & Scientific (776 | 9.0%), Transportation & Warehousing (758 | 8.7%), and Public Administration (723 | 8.4%).
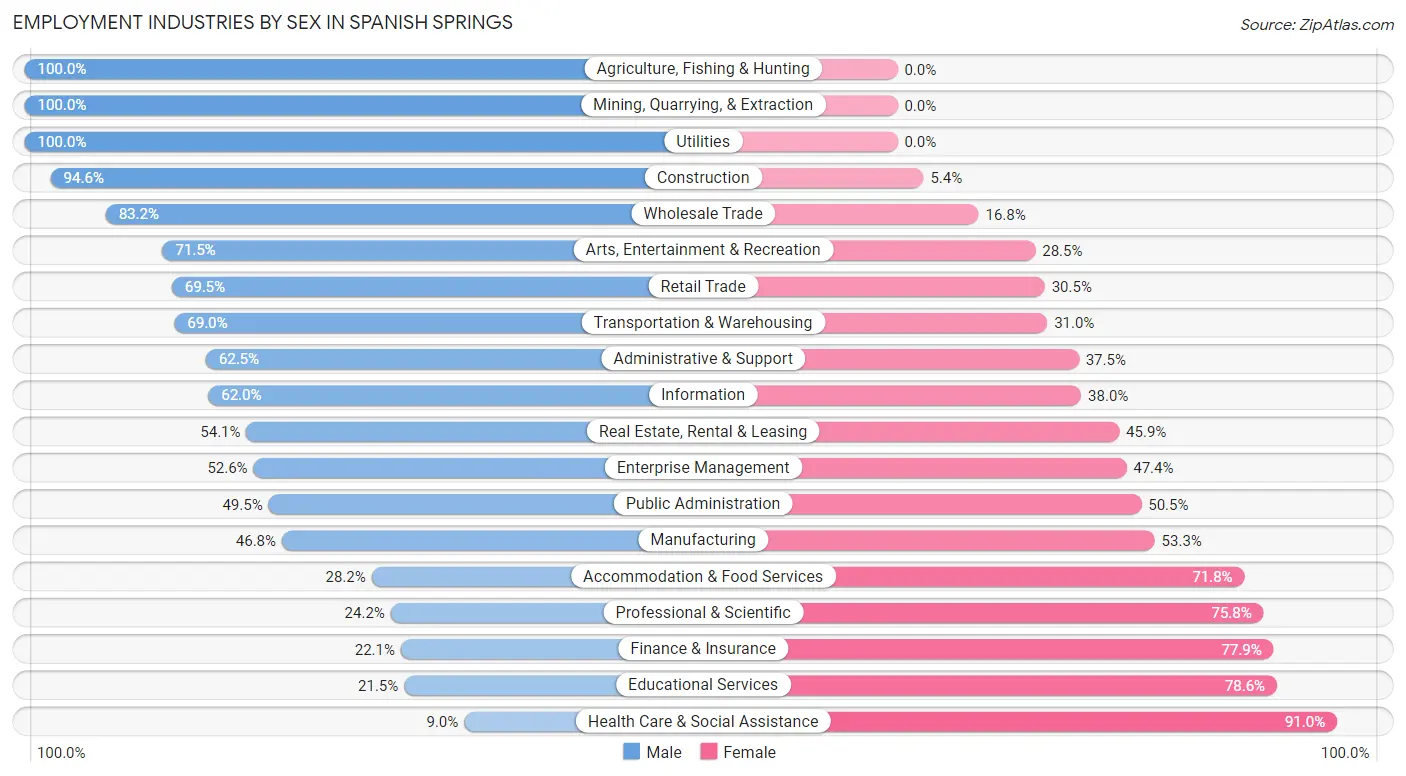
Employment Industries by Sex in Spanish Springs
The Spanish Springs industries that see more men than women are Agriculture, Fishing & Hunting (100.0%), Mining, Quarrying, & Extraction (100.0%), and Utilities (100.0%), whereas the industries that tend to have a higher number of women are Health Care & Social Assistance (91.0%), Educational Services (78.5%), and Finance & Insurance (77.9%).
| Industry | Male | Female |
| Agriculture, Fishing & Hunting | 25 (100.0%) | 0 (0.0%) |
| Mining, Quarrying, & Extraction | 31 (100.0%) | 0 (0.0%) |
| Construction | 754 (94.6%) | 43 (5.4%) |
| Manufacturing | 273 (46.8%) | 311 (53.2%) |
| Wholesale Trade | 218 (83.2%) | 44 (16.8%) |
| Retail Trade | 481 (69.5%) | 211 (30.5%) |
| Transportation & Warehousing | 523 (69.0%) | 235 (31.0%) |
| Utilities | 93 (100.0%) | 0 (0.0%) |
| Information | 44 (62.0%) | 27 (38.0%) |
| Finance & Insurance | 85 (22.1%) | 299 (77.9%) |
| Real Estate, Rental & Leasing | 165 (54.1%) | 140 (45.9%) |
| Professional & Scientific | 188 (24.2%) | 588 (75.8%) |
| Enterprise Management | 10 (52.6%) | 9 (47.4%) |
| Administrative & Support | 238 (62.5%) | 143 (37.5%) |
| Educational Services | 133 (21.4%) | 487 (78.5%) |
| Health Care & Social Assistance | 78 (9.0%) | 787 (91.0%) |
| Arts, Entertainment & Recreation | 228 (71.5%) | 91 (28.5%) |
| Accommodation & Food Services | 122 (28.2%) | 311 (71.8%) |
| Public Administration | 358 (49.5%) | 365 (50.5%) |
| Total | 4,264 (49.2%) | 4,396 (50.8%) |
Education in Spanish Springs
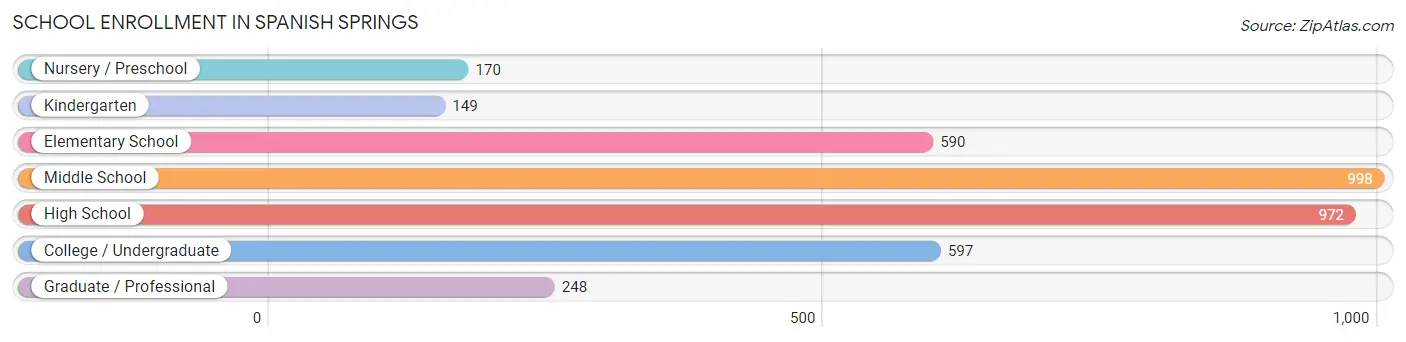
School Enrollment in Spanish Springs
The most common levels of schooling among the 3,724 students in Spanish Springs are middle school (998 | 26.8%), high school (972 | 26.1%), and college / undergraduate (597 | 16.0%).
| School Level | # Students | % Students |
| Nursery / Preschool | 170 | 4.6% |
| Kindergarten | 149 | 4.0% |
| Elementary School | 590 | 15.8% |
| Middle School | 998 | 26.8% |
| High School | 972 | 26.1% |
| College / Undergraduate | 597 | 16.0% |
| Graduate / Professional | 248 | 6.7% |
| Total | 3,724 | 100.0% |
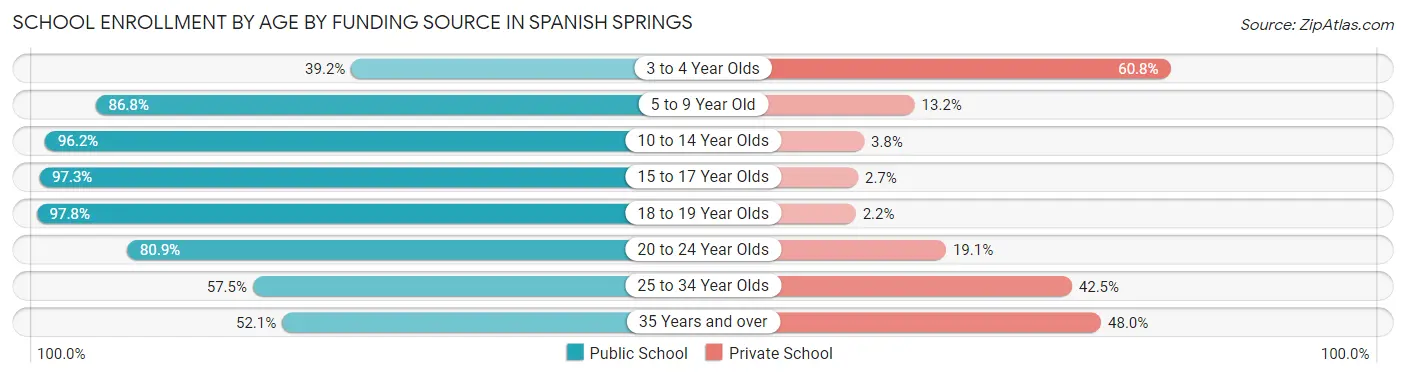
School Enrollment by Age by Funding Source in Spanish Springs
Out of a total of 3,724 students who are enrolled in schools in Spanish Springs, 518 (13.9%) attend a private institution, while the remaining 3,206 (86.1%) are enrolled in public schools. The age group of 3 to 4 year olds has the highest likelihood of being enrolled in private schools, with 73 (60.8% in the age bracket) enrolled. Conversely, the age group of 18 to 19 year olds has the lowest likelihood of being enrolled in a private school, with 131 (97.8% in the age bracket) attending a public institution.
| Age Bracket | Public School | Private School |
| 3 to 4 Year Olds | 47 (39.2%) | 73 (60.8%) |
| 5 to 9 Year Old | 604 (86.8%) | 92 (13.2%) |
| 10 to 14 Year Olds | 1,269 (96.2%) | 50 (3.8%) |
| 15 to 17 Year Olds | 653 (97.3%) | 18 (2.7%) |
| 18 to 19 Year Olds | 131 (97.8%) | 3 (2.2%) |
| 20 to 24 Year Olds | 242 (80.9%) | 57 (19.1%) |
| 25 to 34 Year Olds | 69 (57.5%) | 51 (42.5%) |
| 35 Years and over | 190 (52.0%) | 175 (47.9%) |
| Total | 3,206 (86.1%) | 518 (13.9%) |
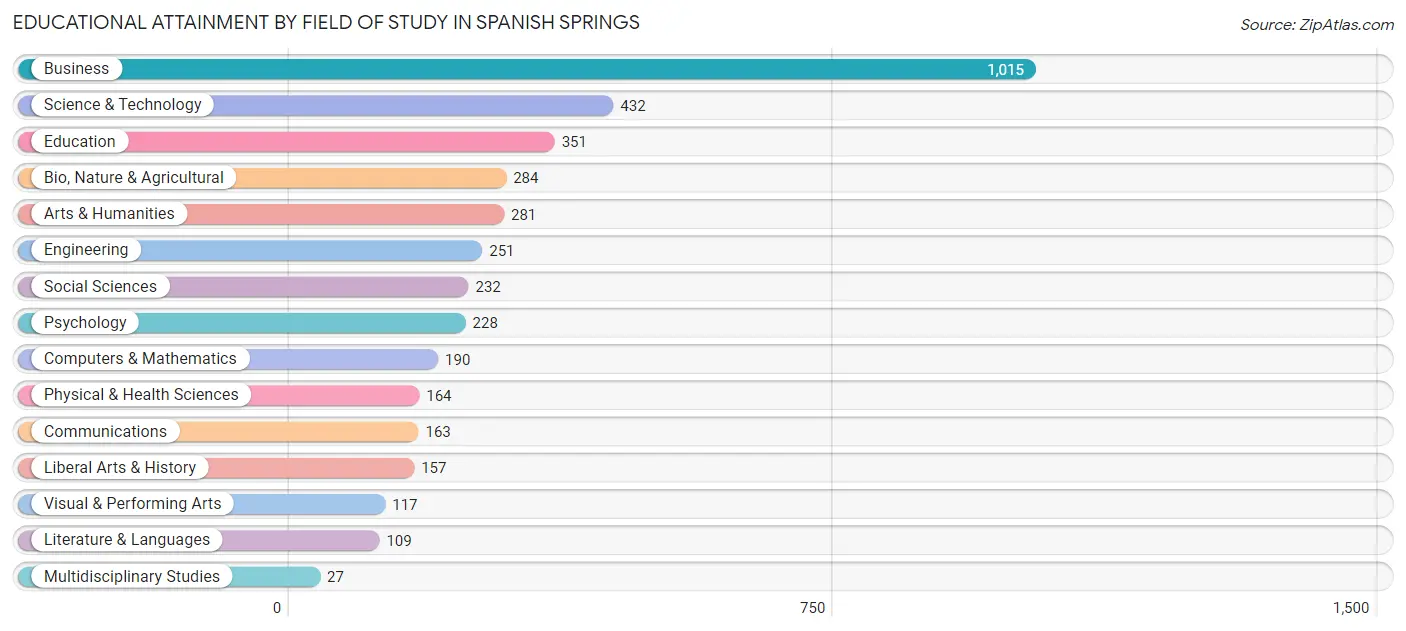
Educational Attainment by Field of Study in Spanish Springs
Business (1,015 | 25.4%), science & technology (432 | 10.8%), education (351 | 8.8%), bio, nature & agricultural (284 | 7.1%), and arts & humanities (281 | 7.0%) are the most common fields of study among 4,001 individuals in Spanish Springs who have obtained a bachelor's degree or higher.
| Field of Study | # Graduates | % Graduates |
| Computers & Mathematics | 190 | 4.8% |
| Bio, Nature & Agricultural | 284 | 7.1% |
| Physical & Health Sciences | 164 | 4.1% |
| Psychology | 228 | 5.7% |
| Social Sciences | 232 | 5.8% |
| Engineering | 251 | 6.3% |
| Multidisciplinary Studies | 27 | 0.7% |
| Science & Technology | 432 | 10.8% |
| Business | 1,015 | 25.4% |
| Education | 351 | 8.8% |
| Literature & Languages | 109 | 2.7% |
| Liberal Arts & History | 157 | 3.9% |
| Visual & Performing Arts | 117 | 2.9% |
| Communications | 163 | 4.1% |
| Arts & Humanities | 281 | 7.0% |
| Total | 4,001 | 100.0% |
Transportation & Commute in Spanish Springs
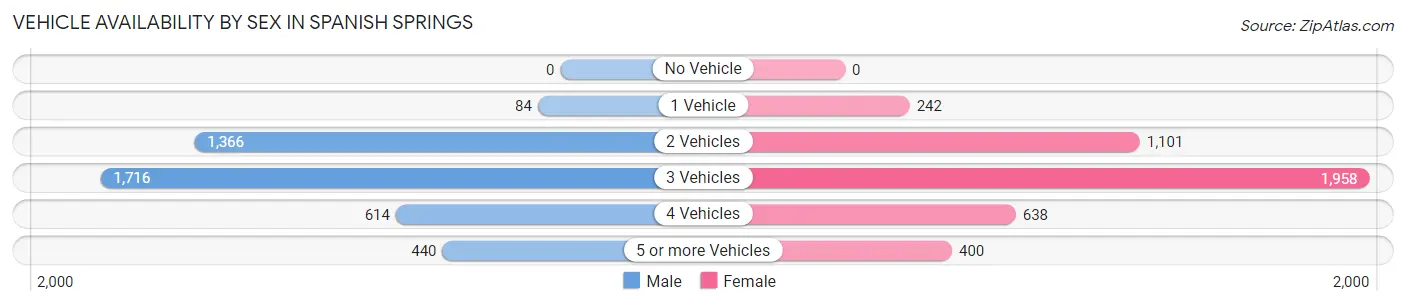
Vehicle Availability by Sex in Spanish Springs
The most prevalent vehicle ownership categories in Spanish Springs are males with 3 vehicles (1,716, accounting for 40.7%) and females with 3 vehicles (1,958, making up 39.6%).
| Vehicles Available | Male | Female |
| No Vehicle | 0 (0.0%) | 0 (0.0%) |
| 1 Vehicle | 84 (2.0%) | 242 (5.6%) |
| 2 Vehicles | 1,366 (32.4%) | 1,101 (25.4%) |
| 3 Vehicles | 1,716 (40.7%) | 1,958 (45.1%) |
| 4 Vehicles | 614 (14.5%) | 638 (14.7%) |
| 5 or more Vehicles | 440 (10.4%) | 400 (9.2%) |
| Total | 4,220 (100.0%) | 4,339 (100.0%) |
Commute Time in Spanish Springs
The most frequently occuring commute durations in Spanish Springs are 30 to 34 minutes (1,876 commuters, 24.2%), 20 to 24 minutes (1,163 commuters, 15.0%), and 25 to 29 minutes (1,027 commuters, 13.3%).
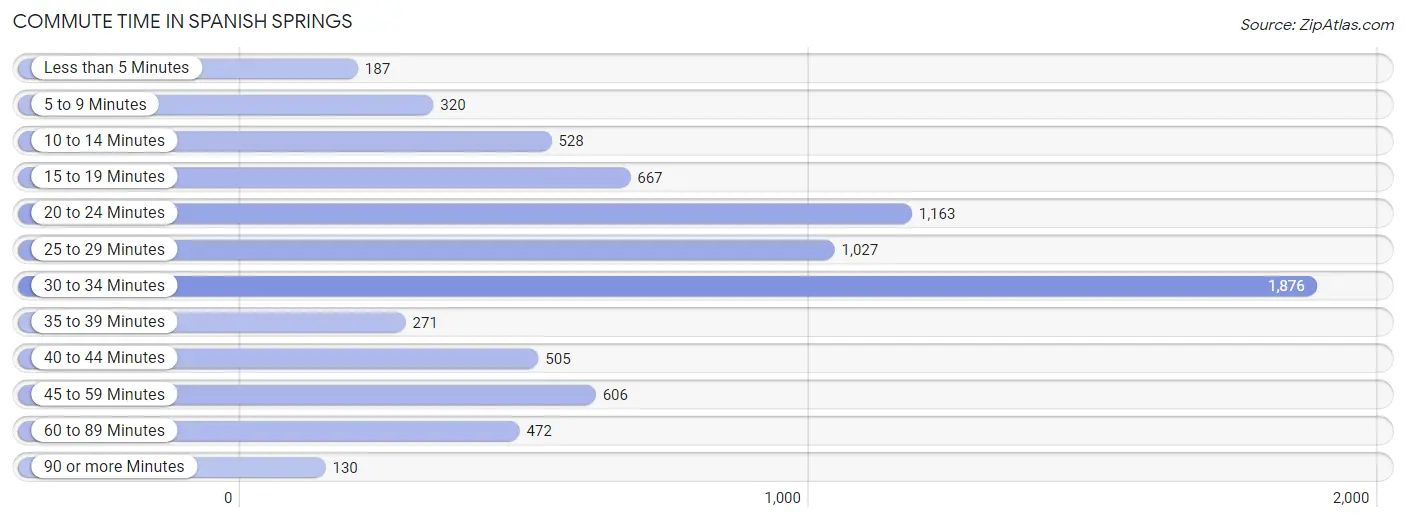
| Commute Time | # Commuters | % Commuters |
| Less than 5 Minutes | 187 | 2.4% |
| 5 to 9 Minutes | 320 | 4.1% |
| 10 to 14 Minutes | 528 | 6.8% |
| 15 to 19 Minutes | 667 | 8.6% |
| 20 to 24 Minutes | 1,163 | 15.0% |
| 25 to 29 Minutes | 1,027 | 13.3% |
| 30 to 34 Minutes | 1,876 | 24.2% |
| 35 to 39 Minutes | 271 | 3.5% |
| 40 to 44 Minutes | 505 | 6.5% |
| 45 to 59 Minutes | 606 | 7.8% |
| 60 to 89 Minutes | 472 | 6.1% |
| 90 or more Minutes | 130 | 1.7% |
Commute Time by Sex in Spanish Springs
The most common commute times in Spanish Springs are 30 to 34 minutes (991 commuters, 25.0%) for males and 30 to 34 minutes (885 commuters, 23.4%) for females.
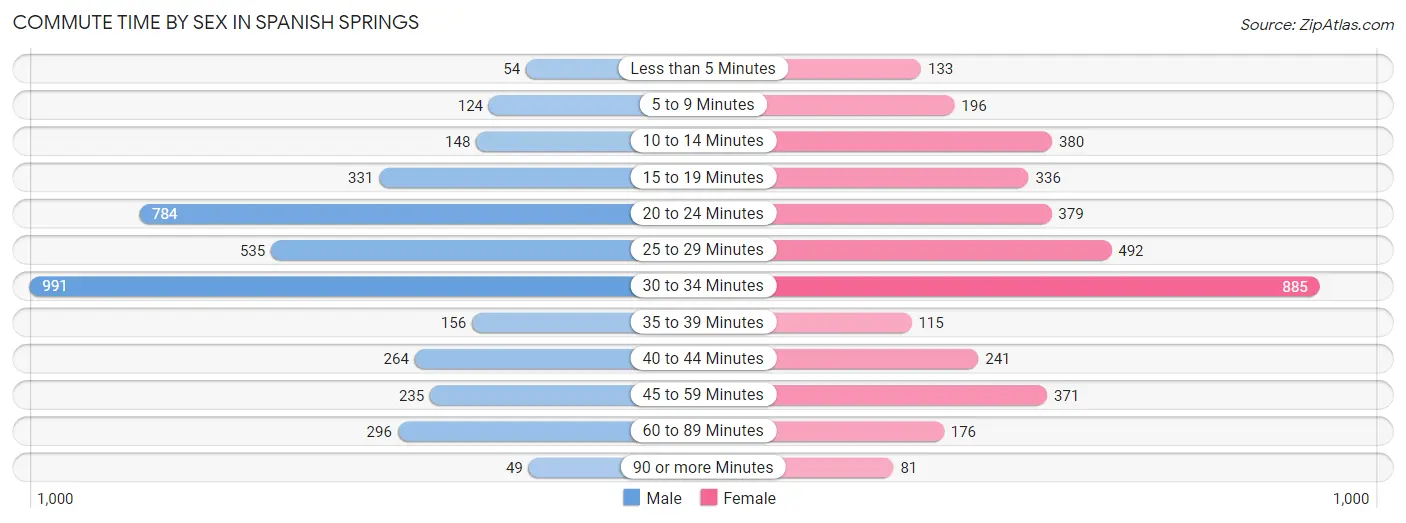
| Commute Time | Male | Female |
| Less than 5 Minutes | 54 (1.4%) | 133 (3.5%) |
| 5 to 9 Minutes | 124 (3.1%) | 196 (5.2%) |
| 10 to 14 Minutes | 148 (3.7%) | 380 (10.0%) |
| 15 to 19 Minutes | 331 (8.3%) | 336 (8.9%) |
| 20 to 24 Minutes | 784 (19.8%) | 379 (10.0%) |
| 25 to 29 Minutes | 535 (13.5%) | 492 (13.0%) |
| 30 to 34 Minutes | 991 (25.0%) | 885 (23.4%) |
| 35 to 39 Minutes | 156 (3.9%) | 115 (3.0%) |
| 40 to 44 Minutes | 264 (6.7%) | 241 (6.4%) |
| 45 to 59 Minutes | 235 (5.9%) | 371 (9.8%) |
| 60 to 89 Minutes | 296 (7.5%) | 176 (4.6%) |
| 90 or more Minutes | 49 (1.2%) | 81 (2.1%) |
Time of Departure to Work by Sex in Spanish Springs
The most frequent times of departure to work in Spanish Springs are 6:30 AM to 6:59 AM (634, 16.0%) for males and 8:00 AM to 8:29 AM (636, 16.8%) for females.
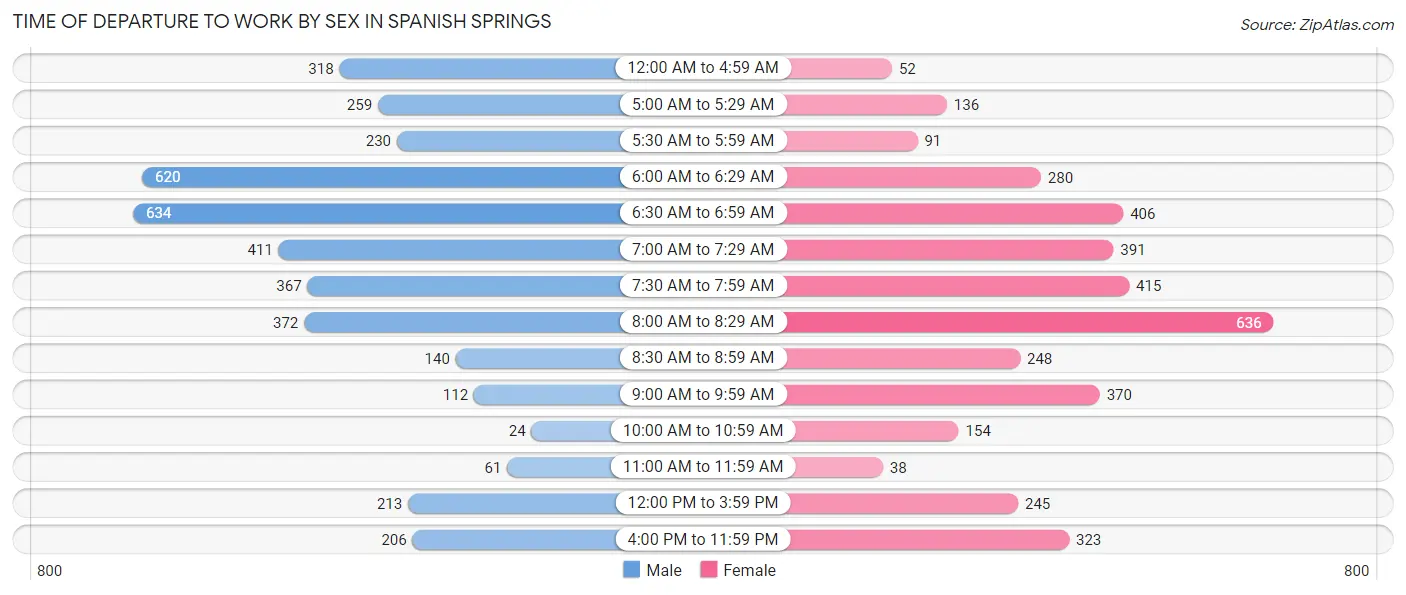
| Time of Departure | Male | Female |
| 12:00 AM to 4:59 AM | 318 (8.0%) | 52 (1.4%) |
| 5:00 AM to 5:29 AM | 259 (6.5%) | 136 (3.6%) |
| 5:30 AM to 5:59 AM | 230 (5.8%) | 91 (2.4%) |
| 6:00 AM to 6:29 AM | 620 (15.6%) | 280 (7.4%) |
| 6:30 AM to 6:59 AM | 634 (16.0%) | 406 (10.7%) |
| 7:00 AM to 7:29 AM | 411 (10.4%) | 391 (10.3%) |
| 7:30 AM to 7:59 AM | 367 (9.2%) | 415 (11.0%) |
| 8:00 AM to 8:29 AM | 372 (9.4%) | 636 (16.8%) |
| 8:30 AM to 8:59 AM | 140 (3.5%) | 248 (6.6%) |
| 9:00 AM to 9:59 AM | 112 (2.8%) | 370 (9.8%) |
| 10:00 AM to 10:59 AM | 24 (0.6%) | 154 (4.1%) |
| 11:00 AM to 11:59 AM | 61 (1.5%) | 38 (1.0%) |
| 12:00 PM to 3:59 PM | 213 (5.4%) | 245 (6.5%) |
| 4:00 PM to 11:59 PM | 206 (5.2%) | 323 (8.5%) |
| Total | 3,967 (100.0%) | 3,785 (100.0%) |
Housing Occupancy in Spanish Springs
Occupancy by Ownership in Spanish Springs
Of the total 6,217 dwellings in Spanish Springs, owner-occupied units account for 5,491 (88.3%), while renter-occupied units make up 726 (11.7%).
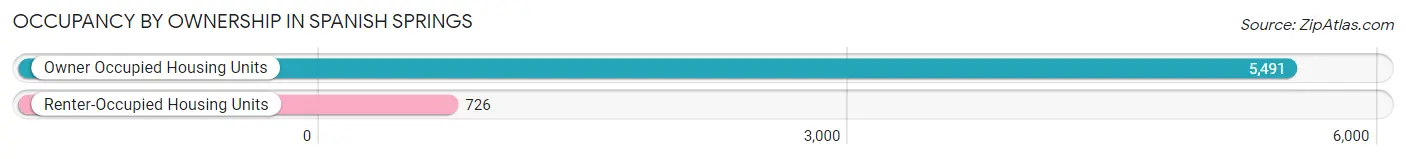
| Occupancy | # Housing Units | % Housing Units |
| Owner Occupied Housing Units | 5,491 | 88.3% |
| Renter-Occupied Housing Units | 726 | 11.7% |
| Total Occupied Housing Units | 6,217 | 100.0% |
Occupancy by Household Size in Spanish Springs
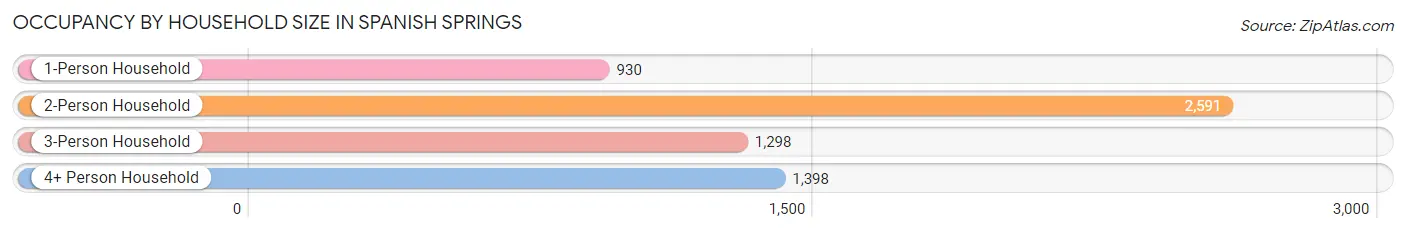
| Household Size | # Housing Units | % Housing Units |
| 1-Person Household | 930 | 15.0% |
| 2-Person Household | 2,591 | 41.7% |
| 3-Person Household | 1,298 | 20.9% |
| 4+ Person Household | 1,398 | 22.5% |
| Total Housing Units | 6,217 | 100.0% |
Occupancy by Ownership by Household Size in Spanish Springs
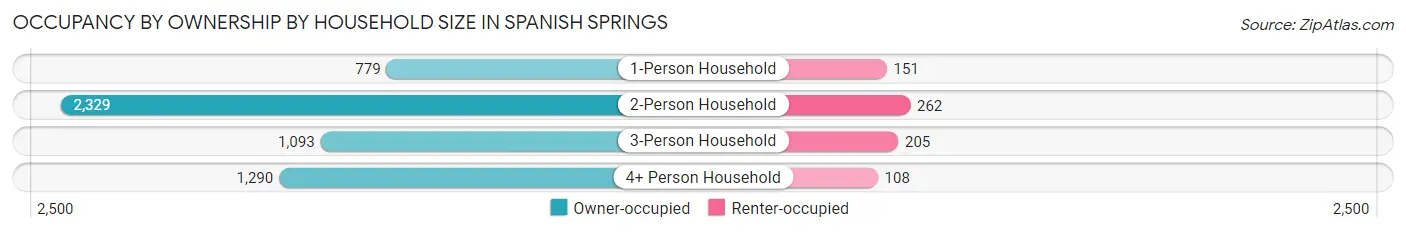
| Household Size | Owner-occupied | Renter-occupied |
| 1-Person Household | 779 (83.8%) | 151 (16.2%) |
| 2-Person Household | 2,329 (89.9%) | 262 (10.1%) |
| 3-Person Household | 1,093 (84.2%) | 205 (15.8%) |
| 4+ Person Household | 1,290 (92.3%) | 108 (7.7%) |
| Total Housing Units | 5,491 (88.3%) | 726 (11.7%) |
Occupancy by Educational Attainment in Spanish Springs
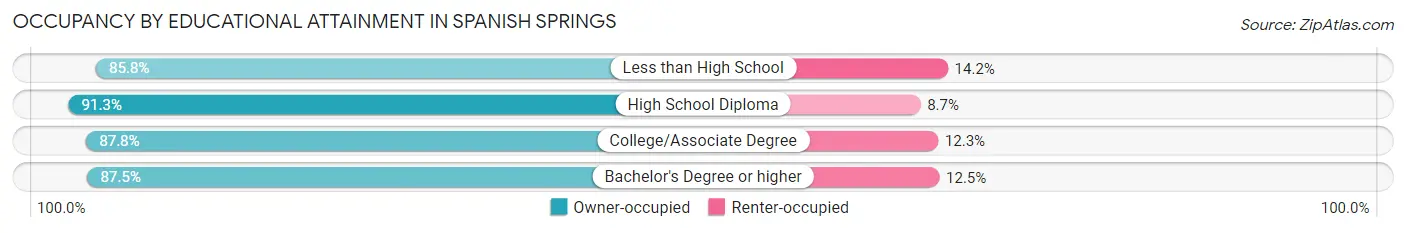
| Household Size | Owner-occupied | Renter-occupied |
| Less than High School | 103 (85.8%) | 17 (14.2%) |
| High School Diploma | 1,108 (91.3%) | 106 (8.7%) |
| College/Associate Degree | 2,471 (87.7%) | 345 (12.2%) |
| Bachelor's Degree or higher | 1,809 (87.5%) | 258 (12.5%) |
Occupancy by Age of Householder in Spanish Springs
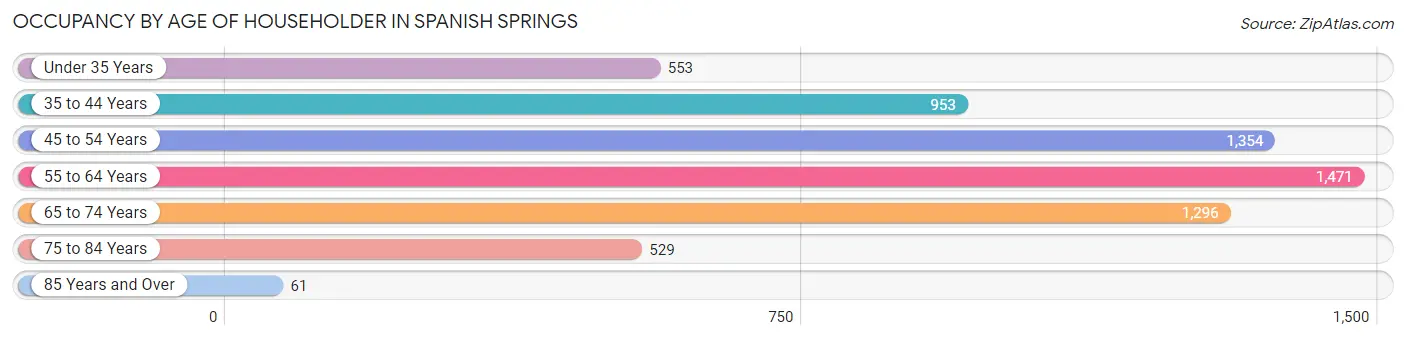
| Age Bracket | # Households | % Households |
| Under 35 Years | 553 | 8.9% |
| 35 to 44 Years | 953 | 15.3% |
| 45 to 54 Years | 1,354 | 21.8% |
| 55 to 64 Years | 1,471 | 23.7% |
| 65 to 74 Years | 1,296 | 20.8% |
| 75 to 84 Years | 529 | 8.5% |
| 85 Years and Over | 61 | 1.0% |
| Total | 6,217 | 100.0% |
Housing Finances in Spanish Springs
Median Income by Occupancy in Spanish Springs
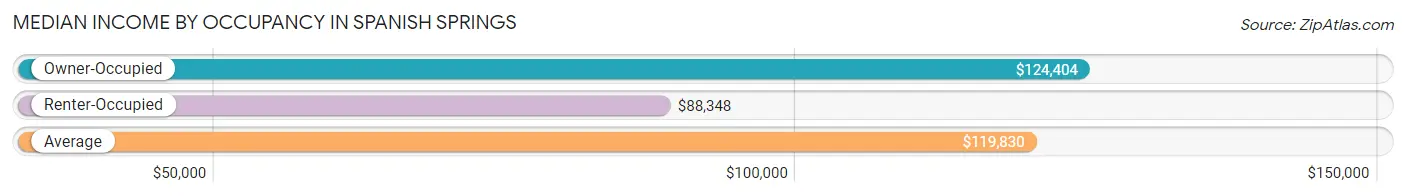
| Occupancy Type | # Households | Median Income |
| Owner-Occupied | 5,491 (88.3%) | $124,404 |
| Renter-Occupied | 726 (11.7%) | $88,348 |
| Average | 6,217 (100.0%) | $119,830 |
Occupancy by Householder Income Bracket in Spanish Springs
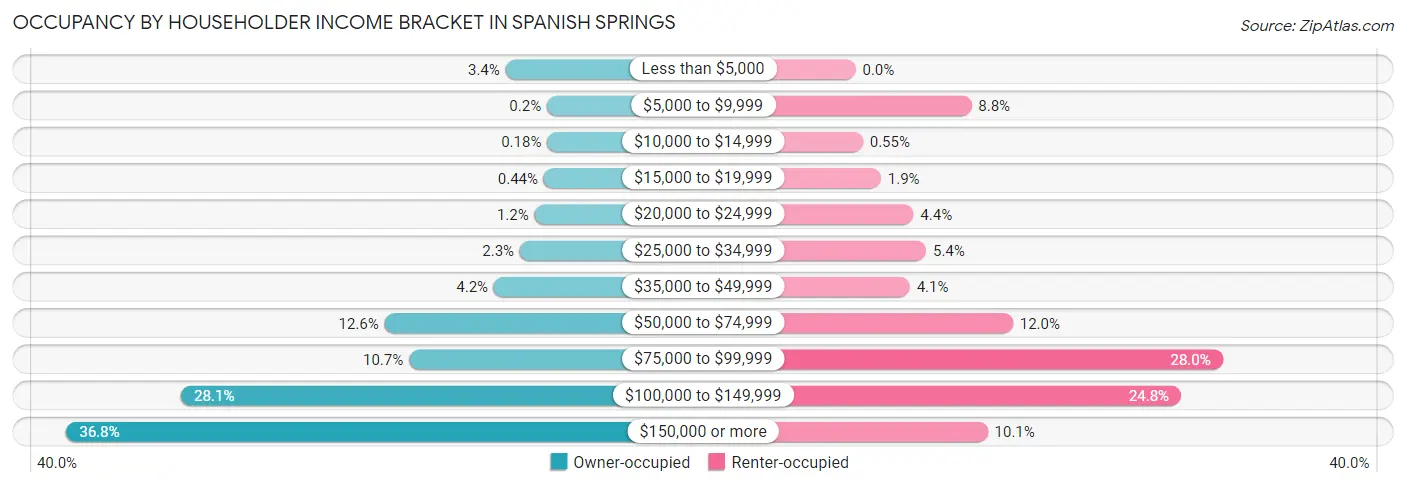
| Income Bracket | Owner-occupied | Renter-occupied |
| Less than $5,000 | 184 (3.4%) | 0 (0.0%) |
| $5,000 to $9,999 | 11 (0.2%) | 64 (8.8%) |
| $10,000 to $14,999 | 10 (0.2%) | 4 (0.5%) |
| $15,000 to $19,999 | 24 (0.4%) | 14 (1.9%) |
| $20,000 to $24,999 | 63 (1.1%) | 32 (4.4%) |
| $25,000 to $34,999 | 124 (2.3%) | 39 (5.4%) |
| $35,000 to $49,999 | 233 (4.2%) | 30 (4.1%) |
| $50,000 to $74,999 | 690 (12.6%) | 87 (12.0%) |
| $75,000 to $99,999 | 588 (10.7%) | 203 (28.0%) |
| $100,000 to $149,999 | 1,542 (28.1%) | 180 (24.8%) |
| $150,000 or more | 2,022 (36.8%) | 73 (10.1%) |
| Total | 5,491 (100.0%) | 726 (100.0%) |
Monthly Housing Cost Tiers in Spanish Springs
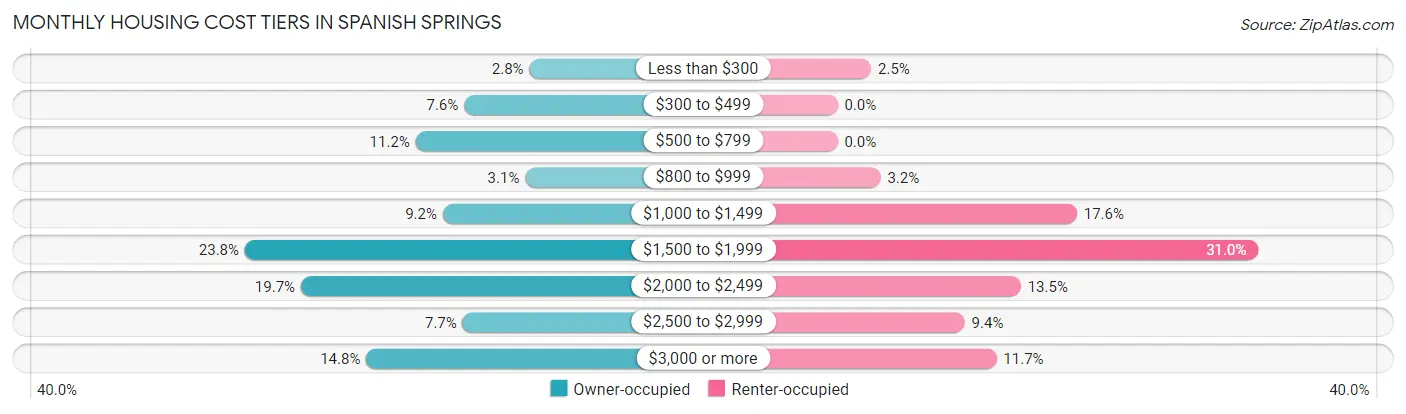
| Monthly Cost | Owner-occupied | Renter-occupied |
| Less than $300 | 155 (2.8%) | 18 (2.5%) |
| $300 to $499 | 419 (7.6%) | 0 (0.0%) |
| $500 to $799 | 615 (11.2%) | 0 (0.0%) |
| $800 to $999 | 172 (3.1%) | 23 (3.2%) |
| $1,000 to $1,499 | 505 (9.2%) | 128 (17.6%) |
| $1,500 to $1,999 | 1,306 (23.8%) | 225 (31.0%) |
| $2,000 to $2,499 | 1,079 (19.7%) | 98 (13.5%) |
| $2,500 to $2,999 | 425 (7.7%) | 68 (9.4%) |
| $3,000 or more | 815 (14.8%) | 85 (11.7%) |
| Total | 5,491 (100.0%) | 726 (100.0%) |
Physical Housing Characteristics in Spanish Springs
Housing Structures in Spanish Springs
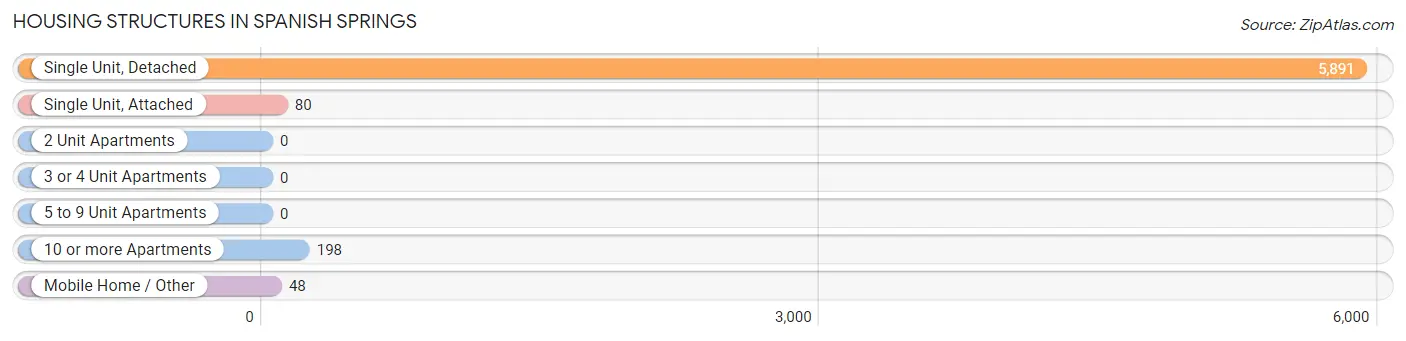
| Structure Type | # Housing Units | % Housing Units |
| Single Unit, Detached | 5,891 | 94.8% |
| Single Unit, Attached | 80 | 1.3% |
| 2 Unit Apartments | 0 | 0.0% |
| 3 or 4 Unit Apartments | 0 | 0.0% |
| 5 to 9 Unit Apartments | 0 | 0.0% |
| 10 or more Apartments | 198 | 3.2% |
| Mobile Home / Other | 48 | 0.8% |
| Total | 6,217 | 100.0% |
Housing Structures by Occupancy in Spanish Springs
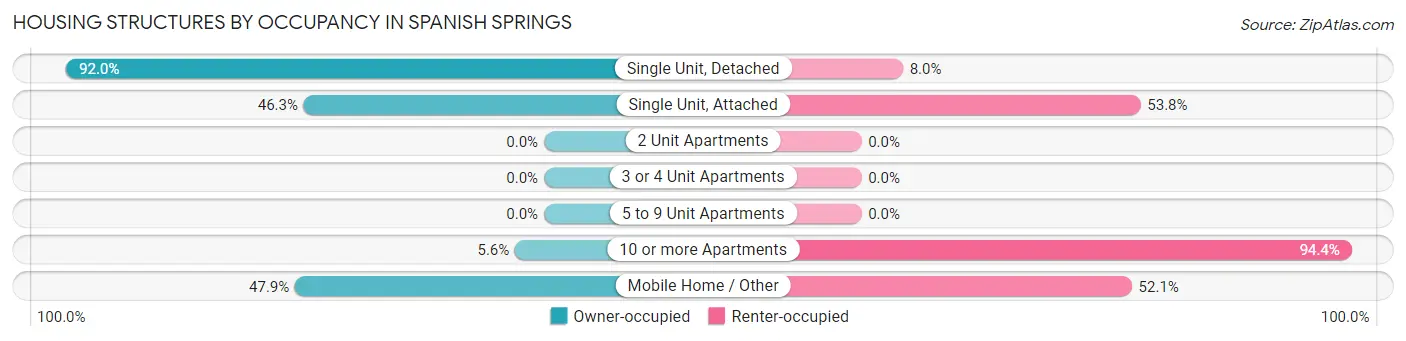
| Structure Type | Owner-occupied | Renter-occupied |
| Single Unit, Detached | 5,420 (92.0%) | 471 (8.0%) |
| Single Unit, Attached | 37 (46.3%) | 43 (53.7%) |
| 2 Unit Apartments | 0 (0.0%) | 0 (0.0%) |
| 3 or 4 Unit Apartments | 0 (0.0%) | 0 (0.0%) |
| 5 to 9 Unit Apartments | 0 (0.0%) | 0 (0.0%) |
| 10 or more Apartments | 11 (5.6%) | 187 (94.4%) |
| Mobile Home / Other | 23 (47.9%) | 25 (52.1%) |
| Total | 5,491 (88.3%) | 726 (11.7%) |
Housing Structures by Number of Rooms in Spanish Springs
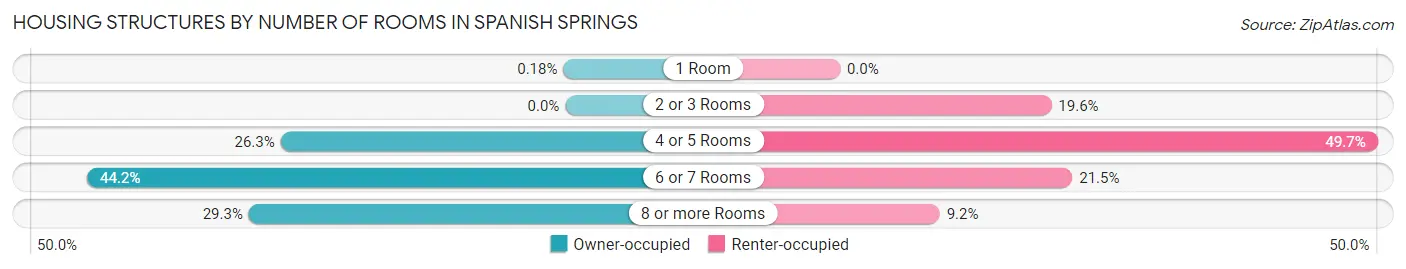
| Number of Rooms | Owner-occupied | Renter-occupied |
| 1 Room | 10 (0.2%) | 0 (0.0%) |
| 2 or 3 Rooms | 0 (0.0%) | 142 (19.6%) |
| 4 or 5 Rooms | 1,446 (26.3%) | 361 (49.7%) |
| 6 or 7 Rooms | 2,428 (44.2%) | 156 (21.5%) |
| 8 or more Rooms | 1,607 (29.3%) | 67 (9.2%) |
| Total | 5,491 (100.0%) | 726 (100.0%) |
Housing Structure by Heating Type in Spanish Springs
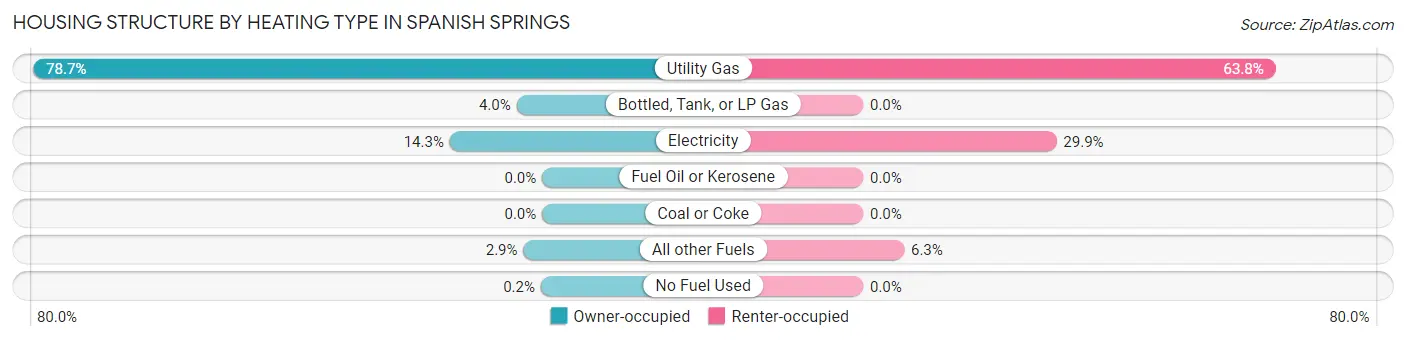
| Heating Type | Owner-occupied | Renter-occupied |
| Utility Gas | 4,320 (78.7%) | 463 (63.8%) |
| Bottled, Tank, or LP Gas | 217 (4.0%) | 0 (0.0%) |
| Electricity | 784 (14.3%) | 217 (29.9%) |
| Fuel Oil or Kerosene | 0 (0.0%) | 0 (0.0%) |
| Coal or Coke | 0 (0.0%) | 0 (0.0%) |
| All other Fuels | 159 (2.9%) | 46 (6.3%) |
| No Fuel Used | 11 (0.2%) | 0 (0.0%) |
| Total | 5,491 (100.0%) | 726 (100.0%) |
Household Vehicle Usage in Spanish Springs
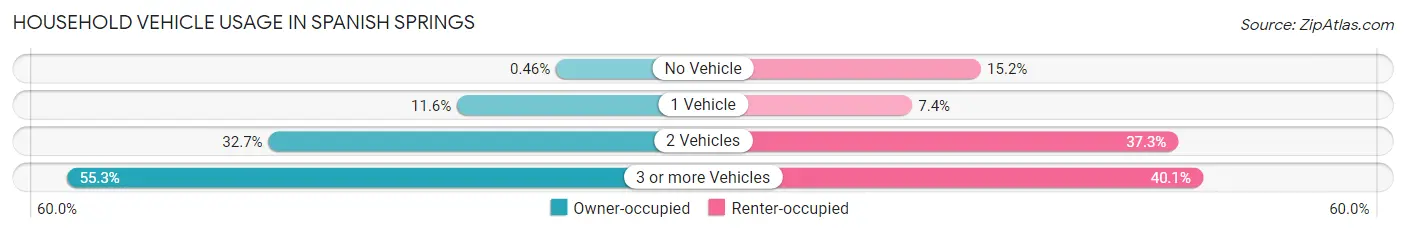
| Vehicles per Household | Owner-occupied | Renter-occupied |
| No Vehicle | 25 (0.5%) | 110 (15.1%) |
| 1 Vehicle | 634 (11.6%) | 54 (7.4%) |
| 2 Vehicles | 1,795 (32.7%) | 271 (37.3%) |
| 3 or more Vehicles | 3,037 (55.3%) | 291 (40.1%) |
| Total | 5,491 (100.0%) | 726 (100.0%) |
Real Estate & Mortgages in Spanish Springs
Real Estate and Mortgage Overview in Spanish Springs
| Characteristic | Without Mortgage | With Mortgage |
| Housing Units | 1,150 | 4,341 |
| Median Property Value | $577,400 | $510,000 |
| Median Household Income | $100,000 | $1,796 |
| Monthly Housing Costs | $553 | $815 |
| Real Estate Taxes | $2,321 | $67 |
Property Value by Mortgage Status in Spanish Springs
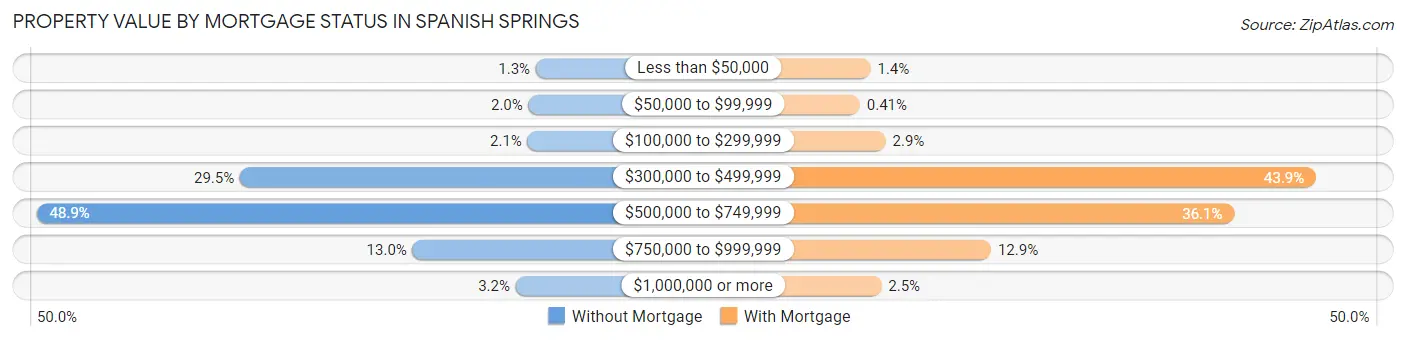
| Property Value | Without Mortgage | With Mortgage |
| Less than $50,000 | 15 (1.3%) | 62 (1.4%) |
| $50,000 to $99,999 | 23 (2.0%) | 18 (0.4%) |
| $100,000 to $299,999 | 24 (2.1%) | 124 (2.9%) |
| $300,000 to $499,999 | 339 (29.5%) | 1,904 (43.9%) |
| $500,000 to $749,999 | 562 (48.9%) | 1,566 (36.1%) |
| $750,000 to $999,999 | 150 (13.0%) | 560 (12.9%) |
| $1,000,000 or more | 37 (3.2%) | 107 (2.5%) |
| Total | 1,150 (100.0%) | 4,341 (100.0%) |
Household Income by Mortgage Status in Spanish Springs
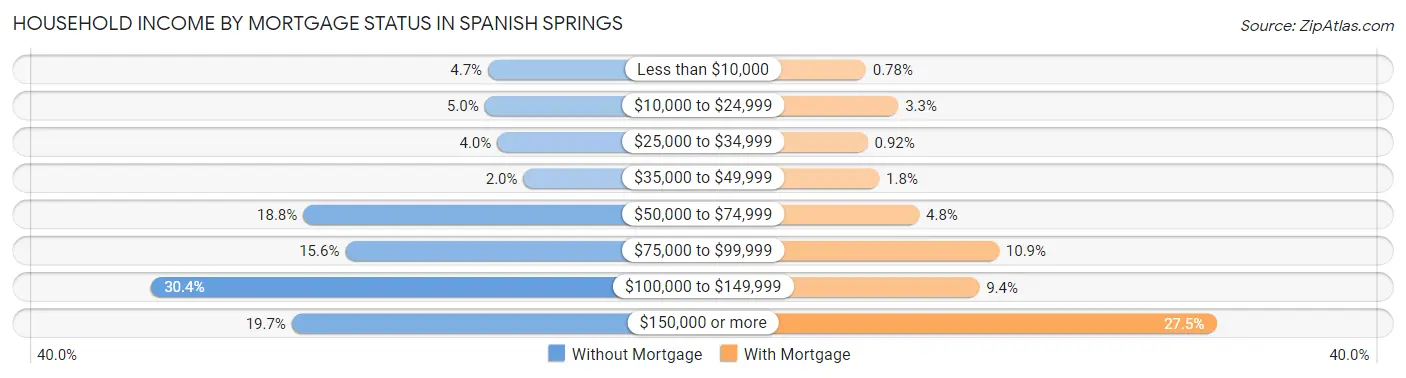
| Household Income | Without Mortgage | With Mortgage |
| Less than $10,000 | 54 (4.7%) | 34 (0.8%) |
| $10,000 to $24,999 | 57 (5.0%) | 141 (3.3%) |
| $25,000 to $34,999 | 46 (4.0%) | 40 (0.9%) |
| $35,000 to $49,999 | 23 (2.0%) | 78 (1.8%) |
| $50,000 to $74,999 | 216 (18.8%) | 210 (4.8%) |
| $75,000 to $99,999 | 179 (15.6%) | 474 (10.9%) |
| $100,000 to $149,999 | 349 (30.3%) | 409 (9.4%) |
| $150,000 or more | 226 (19.7%) | 1,193 (27.5%) |
| Total | 1,150 (100.0%) | 4,341 (100.0%) |
Property Value to Household Income Ratio in Spanish Springs
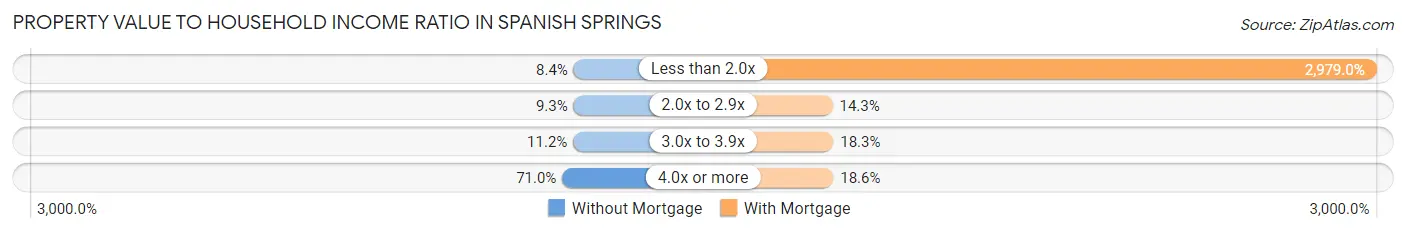
| Value-to-Income Ratio | Without Mortgage | With Mortgage |
| Less than 2.0x | 97 (8.4%) | 129,319 (2,979.0%) |
| 2.0x to 2.9x | 107 (9.3%) | 620 (14.3%) |
| 3.0x to 3.9x | 129 (11.2%) | 793 (18.3%) |
| 4.0x or more | 817 (71.0%) | 807 (18.6%) |
| Total | 1,150 (100.0%) | 4,341 (100.0%) |
Real Estate Taxes by Mortgage Status in Spanish Springs
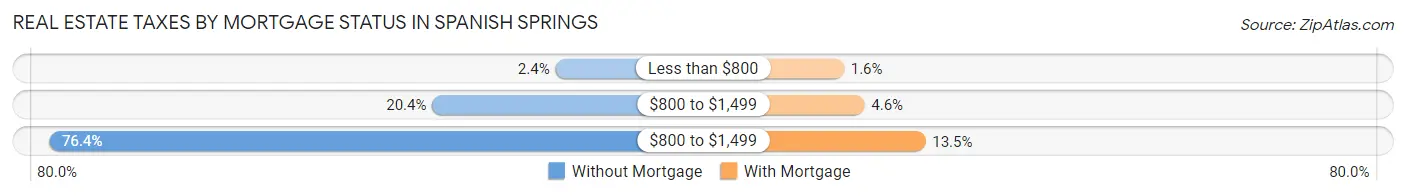
| Property Taxes | Without Mortgage | With Mortgage |
| Less than $800 | 28 (2.4%) | 68 (1.6%) |
| $800 to $1,499 | 235 (20.4%) | 199 (4.6%) |
| $800 to $1,499 | 879 (76.4%) | 585 (13.5%) |
| Total | 1,150 (100.0%) | 4,341 (100.0%) |
Health & Disability in Spanish Springs
Health Insurance Coverage by Age in Spanish Springs
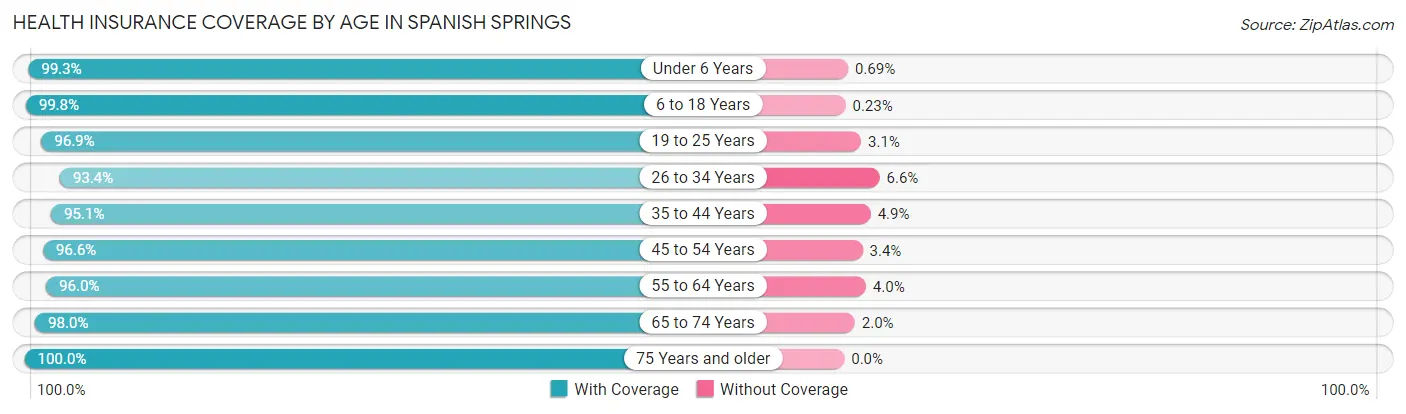
| Age Bracket | With Coverage | Without Coverage |
| Under 6 Years | 861 (99.3%) | 6 (0.7%) |
| 6 to 18 Years | 2,636 (99.8%) | 6 (0.2%) |
| 19 to 25 Years | 804 (96.9%) | 26 (3.1%) |
| 26 to 34 Years | 1,220 (93.4%) | 86 (6.6%) |
| 35 to 44 Years | 1,927 (95.1%) | 100 (4.9%) |
| 45 to 54 Years | 2,543 (96.6%) | 90 (3.4%) |
| 55 to 64 Years | 2,861 (96.0%) | 120 (4.0%) |
| 65 to 74 Years | 2,095 (98.0%) | 42 (2.0%) |
| 75 Years and older | 964 (100.0%) | 0 (0.0%) |
| Total | 15,911 (97.1%) | 476 (2.9%) |
Health Insurance Coverage by Citizenship Status in Spanish Springs
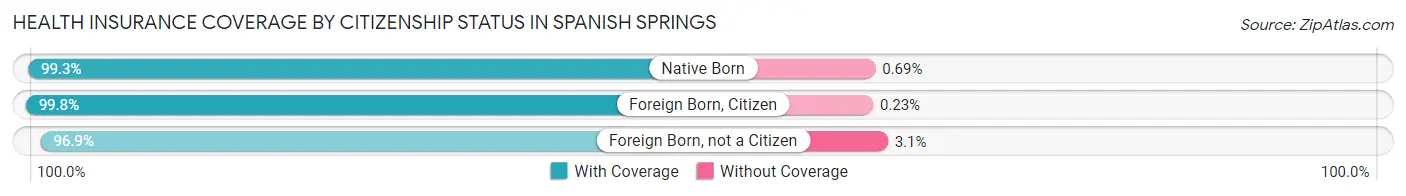
| Citizenship Status | With Coverage | Without Coverage |
| Native Born | 861 (99.3%) | 6 (0.7%) |
| Foreign Born, Citizen | 2,636 (99.8%) | 6 (0.2%) |
| Foreign Born, not a Citizen | 804 (96.9%) | 26 (3.1%) |
Health Insurance Coverage by Household Income in Spanish Springs
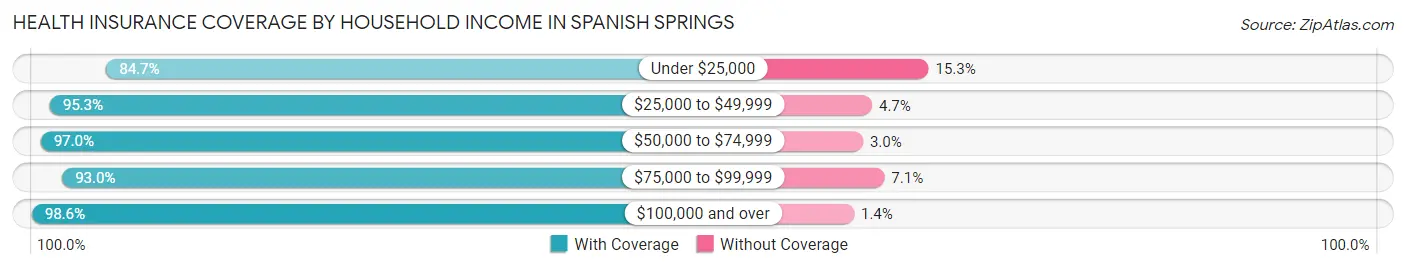
| Household Income | With Coverage | Without Coverage |
| Under $25,000 | 492 (84.7%) | 89 (15.3%) |
| $25,000 to $49,999 | 846 (95.3%) | 42 (4.7%) |
| $50,000 to $74,999 | 1,505 (97.0%) | 47 (3.0%) |
| $75,000 to $99,999 | 1,885 (92.9%) | 143 (7.0%) |
| $100,000 and over | 11,180 (98.6%) | 154 (1.4%) |
Public vs Private Health Insurance Coverage by Age in Spanish Springs
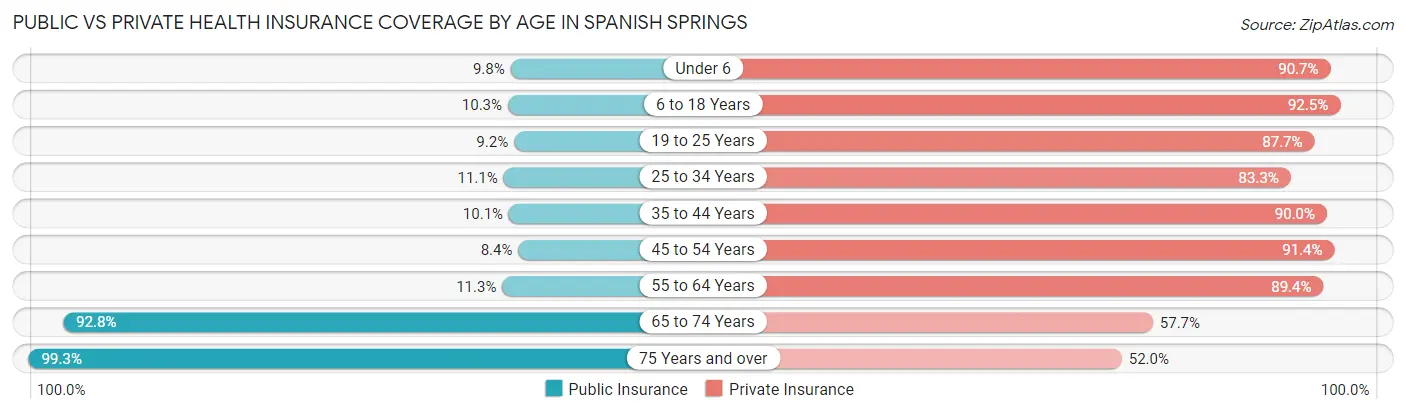
| Age Bracket | Public Insurance | Private Insurance |
| Under 6 | 85 (9.8%) | 786 (90.7%) |
| 6 to 18 Years | 272 (10.3%) | 2,443 (92.5%) |
| 19 to 25 Years | 76 (9.2%) | 728 (87.7%) |
| 25 to 34 Years | 145 (11.1%) | 1,088 (83.3%) |
| 35 to 44 Years | 205 (10.1%) | 1,825 (90.0%) |
| 45 to 54 Years | 220 (8.4%) | 2,407 (91.4%) |
| 55 to 64 Years | 338 (11.3%) | 2,664 (89.4%) |
| 65 to 74 Years | 1,984 (92.8%) | 1,234 (57.7%) |
| 75 Years and over | 957 (99.3%) | 501 (52.0%) |
| Total | 4,282 (26.1%) | 13,676 (83.5%) |
Disability Status by Sex by Age in Spanish Springs
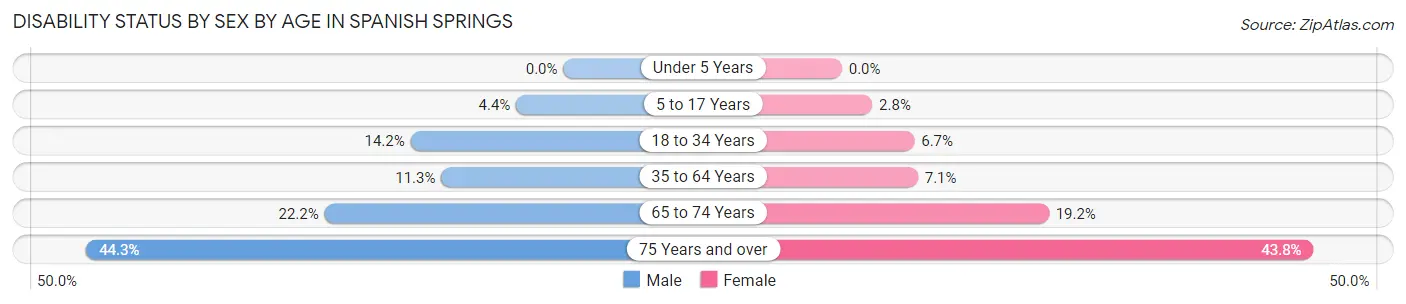
| Age Bracket | Male | Female |
| Under 5 Years | 0 (0.0%) | 0 (0.0%) |
| 5 to 17 Years | 67 (4.4%) | 35 (2.8%) |
| 18 to 34 Years | 131 (14.2%) | 87 (6.7%) |
| 35 to 64 Years | 427 (11.3%) | 273 (7.0%) |
| 65 to 74 Years | 252 (22.2%) | 192 (19.2%) |
| 75 Years and over | 178 (44.3%) | 246 (43.8%) |
Disability Class by Sex by Age in Spanish Springs
Disability Class: Hearing Difficulty
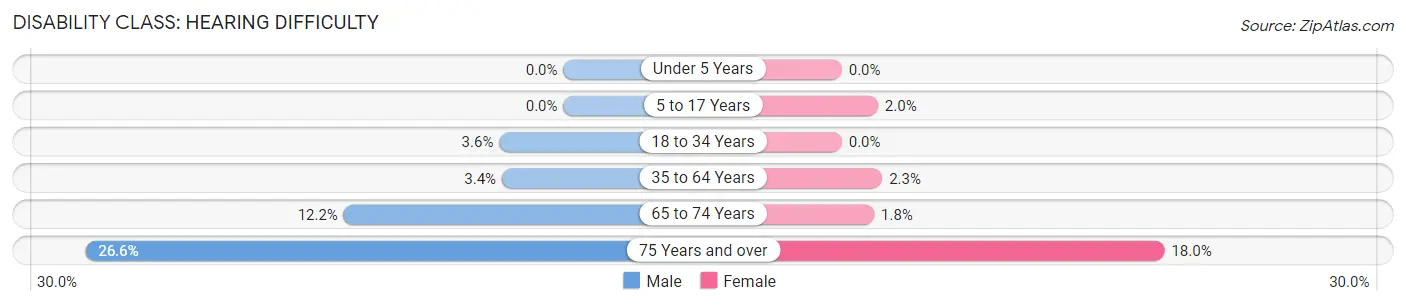
| Age Bracket | Male | Female |
| Under 5 Years | 0 (0.0%) | 0 (0.0%) |
| 5 to 17 Years | 0 (0.0%) | 25 (2.0%) |
| 18 to 34 Years | 33 (3.6%) | 0 (0.0%) |
| 35 to 64 Years | 129 (3.4%) | 87 (2.2%) |
| 65 to 74 Years | 139 (12.2%) | 18 (1.8%) |
| 75 Years and over | 107 (26.6%) | 101 (18.0%) |
Disability Class: Vision Difficulty
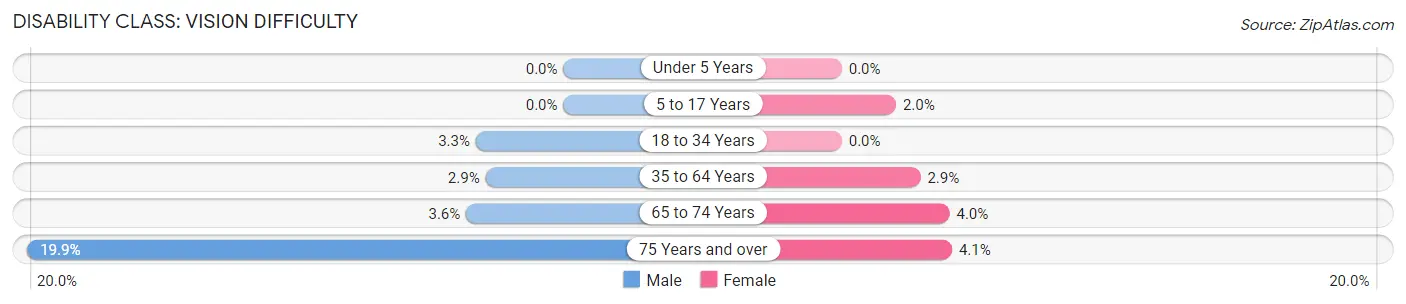
| Age Bracket | Male | Female |
| Under 5 Years | 0 (0.0%) | 0 (0.0%) |
| 5 to 17 Years | 0 (0.0%) | 25 (2.0%) |
| 18 to 34 Years | 30 (3.3%) | 0 (0.0%) |
| 35 to 64 Years | 109 (2.9%) | 113 (2.9%) |
| 65 to 74 Years | 41 (3.6%) | 40 (4.0%) |
| 75 Years and over | 80 (19.9%) | 23 (4.1%) |
Disability Class: Cognitive Difficulty
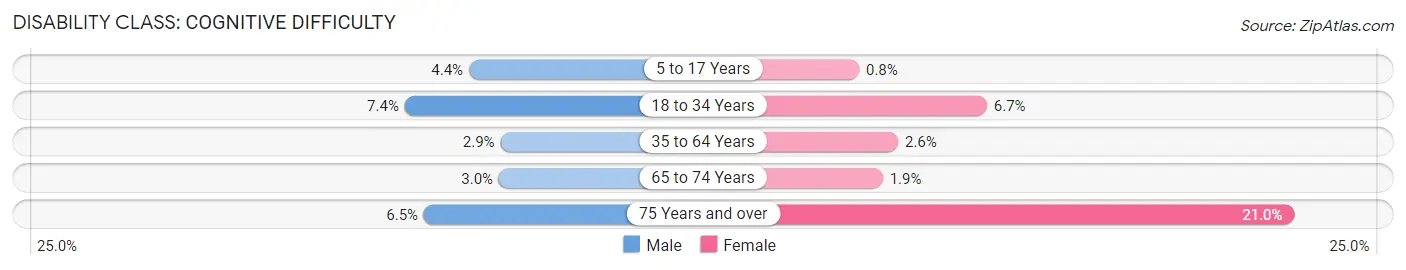
| Age Bracket | Male | Female |
| 5 to 17 Years | 67 (4.4%) | 10 (0.8%) |
| 18 to 34 Years | 68 (7.4%) | 87 (6.7%) |
| 35 to 64 Years | 110 (2.9%) | 101 (2.6%) |
| 65 to 74 Years | 34 (3.0%) | 19 (1.9%) |
| 75 Years and over | 26 (6.5%) | 118 (21.0%) |
Disability Class: Ambulatory Difficulty
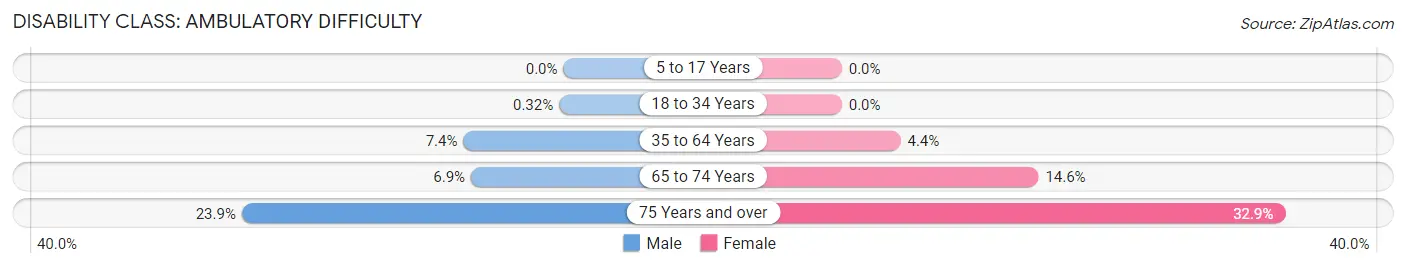
| Age Bracket | Male | Female |
| 5 to 17 Years | 0 (0.0%) | 0 (0.0%) |
| 18 to 34 Years | 3 (0.3%) | 0 (0.0%) |
| 35 to 64 Years | 280 (7.4%) | 169 (4.4%) |
| 65 to 74 Years | 78 (6.9%) | 146 (14.6%) |
| 75 Years and over | 96 (23.9%) | 185 (32.9%) |
Disability Class: Self-Care Difficulty
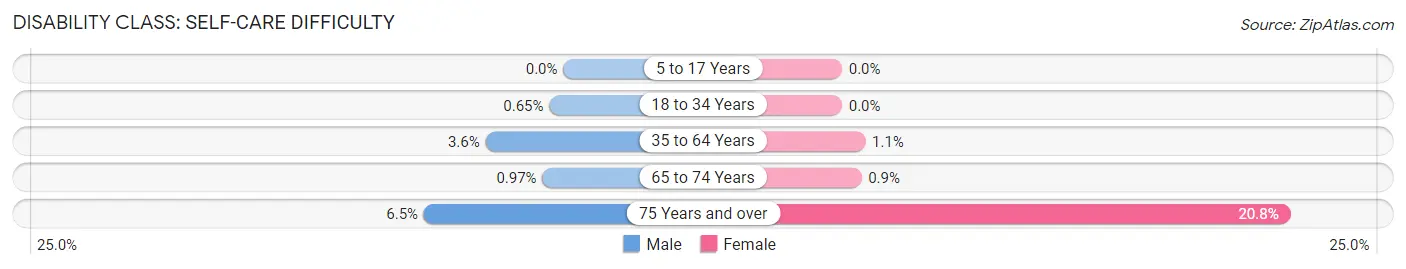
| Age Bracket | Male | Female |
| 5 to 17 Years | 0 (0.0%) | 0 (0.0%) |
| 18 to 34 Years | 6 (0.6%) | 0 (0.0%) |
| 35 to 64 Years | 136 (3.6%) | 42 (1.1%) |
| 65 to 74 Years | 11 (1.0%) | 9 (0.9%) |
| 75 Years and over | 26 (6.5%) | 117 (20.8%) |
Technology Access in Spanish Springs
Computing Device Access in Spanish Springs
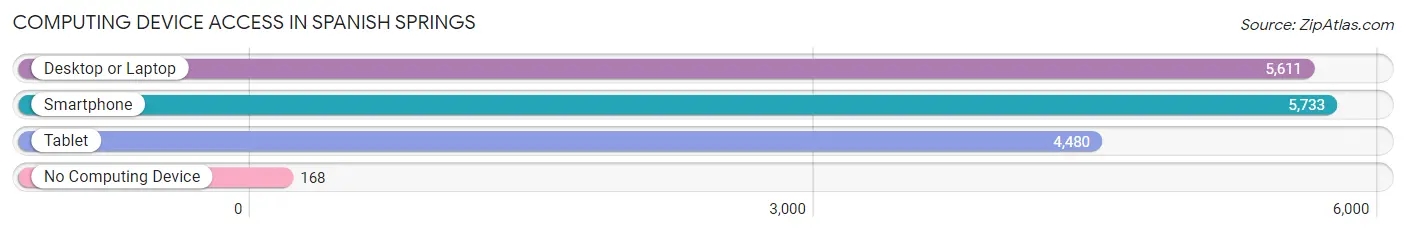
| Device Type | # Households | % Households |
| Desktop or Laptop | 5,611 | 90.2% |
| Smartphone | 5,733 | 92.2% |
| Tablet | 4,480 | 72.1% |
| No Computing Device | 168 | 2.7% |
| Total | 6,217 | 100.0% |
Internet Access in Spanish Springs
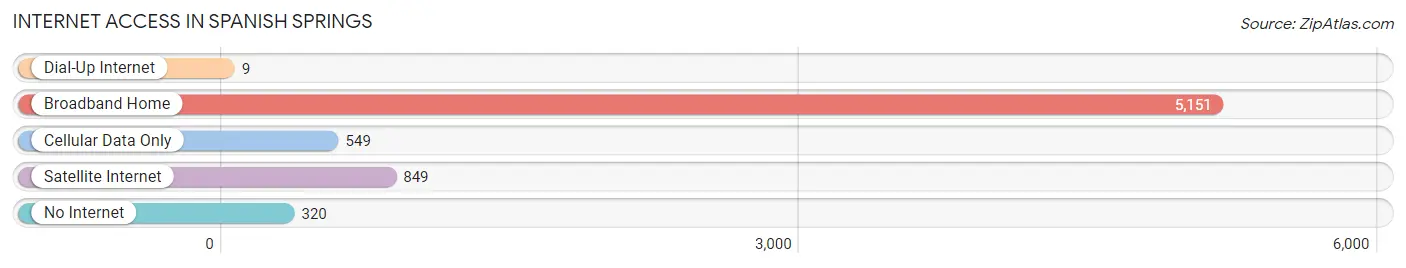
| Internet Type | # Households | % Households |
| Dial-Up Internet | 9 | 0.1% |
| Broadband Home | 5,151 | 82.9% |
| Cellular Data Only | 549 | 8.8% |
| Satellite Internet | 849 | 13.7% |
| No Internet | 320 | 5.1% |
| Total | 6,217 | 100.0% |
Spanish Springs Summary
History
Spanish Springs is a census-designated place (CDP) located in Washoe County, Nevada, United States. It is a suburb of Reno and is part of the Reno–Sparks Metropolitan Statistical Area. The population was 24,926 at the 2010 census.
Spanish Springs was originally inhabited by the Washoe people, who were the first inhabitants of the area. The Washoe people were hunter-gatherers who lived in the area for thousands of years before the arrival of European settlers.
The first European settlers arrived in the area in the late 19th century. The area was originally known as "Rancho San Rafael" and was owned by a Spanish-American rancher named Rafael Martinez. The area was later renamed "Spanish Springs" in honor of Martinez and his Spanish heritage.
Geography
Spanish Springs is located in Washoe County, Nevada, United States. It is a suburb of Reno and is part of the Reno–Sparks Metropolitan Statistical Area. The CDP has a total area of 11.3 square miles (29.3 km2), all of which is land.
The terrain of Spanish Springs is mostly flat, with some rolling hills. The area is located in the Sierra Nevada mountain range and is surrounded by the Truckee Meadows. The area is also home to several small lakes and ponds, including Spanish Springs Lake.
Economy
Spanish Springs is a rapidly growing suburb of Reno, and its economy is largely based on the service industry. The area is home to several large employers, including the University of Nevada, Reno, the Reno-Sparks Convention and Visitors Authority, and the Reno-Tahoe International Airport.
The area is also home to several retail stores, restaurants, and other businesses. The area is also home to several large employers, including the University of Nevada, Reno, the Reno-Sparks Convention and Visitors Authority, and the Reno-Tahoe International Airport.
Demographics
As of the 2010 census, there were 24,926 people, 8,945 households, and 6,845 families residing in the CDP. The population density was 2,196.3 people per square mile (846.2/km2). There were 9,945 housing units at an average density of 876.3 per square mile (338.2/km2). The racial makeup of the CDP was 79.2% White, 4.2% African American, 0.9% Native American, 5.2% Asian, 0.2% Pacific Islander, 6.3% from other races, and 4.0% from two or more races. Hispanic or Latino of any race were 16.7% of the population.
There were 8,945 households, out of which 37.2% had children under the age of 18 living with them, 57.2% were married couples living together, 11.2% had a female householder with no husband present, and 26.2% were non-families. 19.7% of all households were made up of individuals, and 5.2% had someone living alone who was 65 years of age or older. The average household size was 2.76 and the average family size was 3.17.
In the CDP, the population was spread out, with 27.2% under the age of 18, 8.2% from 18 to 24, 30.2% from 25 to 44, 25.2% from 45 to 64, and 9.2% who were 65 years of age or older. The median age was 36 years. For every 100 females, there were 97.2 males. For every 100 females age 18 and over, there were 94.2 males.
The median income for a household in the CDP was $60,945, and the median income for a family was $67,945. Males had a median income of $50,945 versus $35,945 for females. The per capita income for the CDP was $25,945. About 4.2% of families and 6.2% of the population were below the poverty line, including 8.2% of those under age 18 and 4.2% of those age 65 or over.
Common Questions
What is Per Capita Income in Spanish Springs?
Per Capita income in Spanish Springs is $54,854.
What is the Median Family Income in Spanish Springs?
Median Family Income in Spanish Springs is $126,843.
What is the Median Household income in Spanish Springs?
Median Household Income in Spanish Springs is $119,830.
What is Income or Wage Gap in Spanish Springs?
Income or Wage Gap in Spanish Springs is 28.0%.
Women in Spanish Springs earn 72.0 cents for every dollar earned by a man.
What is Inequality or Gini Index in Spanish Springs?
Inequality or Gini Index in Spanish Springs is 0.39.
What is the Total Population of Spanish Springs?
Total Population of Spanish Springs is 16,418.
What is the Total Male Population of Spanish Springs?
Total Male Population of Spanish Springs is 8,130.
What is the Total Female Population of Spanish Springs?
Total Female Population of Spanish Springs is 8,288.
What is the Ratio of Males per 100 Females in Spanish Springs?
There are 98.09 Males per 100 Females in Spanish Springs.
What is the Ratio of Females per 100 Males in Spanish Springs?
There are 101.94 Females per 100 Males in Spanish Springs.
What is the Median Population Age in Spanish Springs?
Median Population Age in Spanish Springs is 46.7 Years.
What is the Average Family Size in Spanish Springs
Average Family Size in Spanish Springs is 2.9 People.
What is the Average Household Size in Spanish Springs
Average Household Size in Spanish Springs is 2.6 People.
How Large is the Labor Force in Spanish Springs?
There are 8,968 People in the Labor Forcein in Spanish Springs.
What is the Percentage of People in the Labor Force in Spanish Springs?
66.3% of People are in the Labor Force in Spanish Springs.
What is the Unemployment Rate in Spanish Springs?
Unemployment Rate in Spanish Springs is 3.2%.