Yerington, NV Map & Demographics
Yerington Map
Yerington Overview
$29,476
PER CAPITA INCOME
$53,075
AVG FAMILY INCOME
$41,600
AVG HOUSEHOLD INCOME
36.1%
WAGE / INCOME GAP [ % ]
63.9¢/ $1
WAGE / INCOME GAP [ $ ]
0.47
INEQUALITY / GINI INDEX
3,108
TOTAL POPULATION
1,640
MALE POPULATION
1,468
FEMALE POPULATION
111.72
MALES / 100 FEMALES
89.51
FEMALES / 100 MALES
55.3
MEDIAN AGE
2.8
AVG FAMILY SIZE
2.0
AVG HOUSEHOLD SIZE
1,117
LABOR FORCE [ PEOPLE ]
41.9%
PERCENT IN LABOR FORCE
5.1%
UNEMPLOYMENT RATE
Yerington Zip Codes
Yerington Area Codes
Income in Yerington
Income Overview in Yerington
Per Capita Income in Yerington is $29,476, while median incomes of families and households are $53,075 and $41,600 respectively.
| Characteristic | Number | Measure |
| Per Capita Income | 3,108 | $29,476 |
| Median Family Income | 762 | $53,075 |
| Mean Family Income | 762 | $55,913 |
| Median Household Income | 1,487 | $41,600 |
| Mean Household Income | 1,487 | $58,032 |
| Income Deficit | 762 | $0 |
| Wage / Income Gap (%) | 3,108 | 36.07% |
| Wage / Income Gap ($) | 3,108 | 63.93¢ per $1 |
| Gini / Inequality Index | 3,108 | 0.47 |
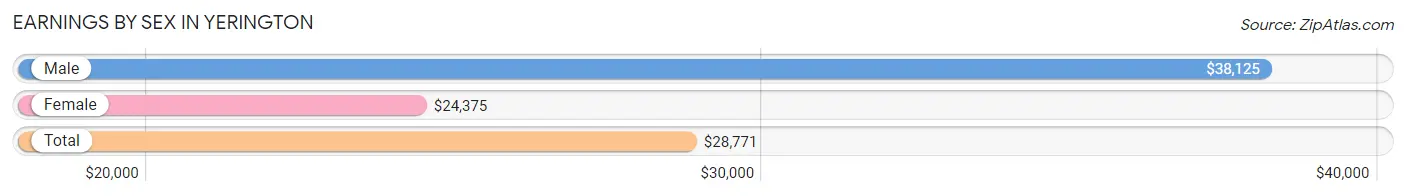
Earnings by Sex in Yerington
Average Earnings in Yerington are $28,771, $38,125 for men and $24,375 for women, a difference of 36.1%.
| Sex | Number | Average Earnings |
| Male | 783 (64.5%) | $38,125 |
| Female | 430 (35.4%) | $24,375 |
| Total | 1,213 (100.0%) | $28,771 |
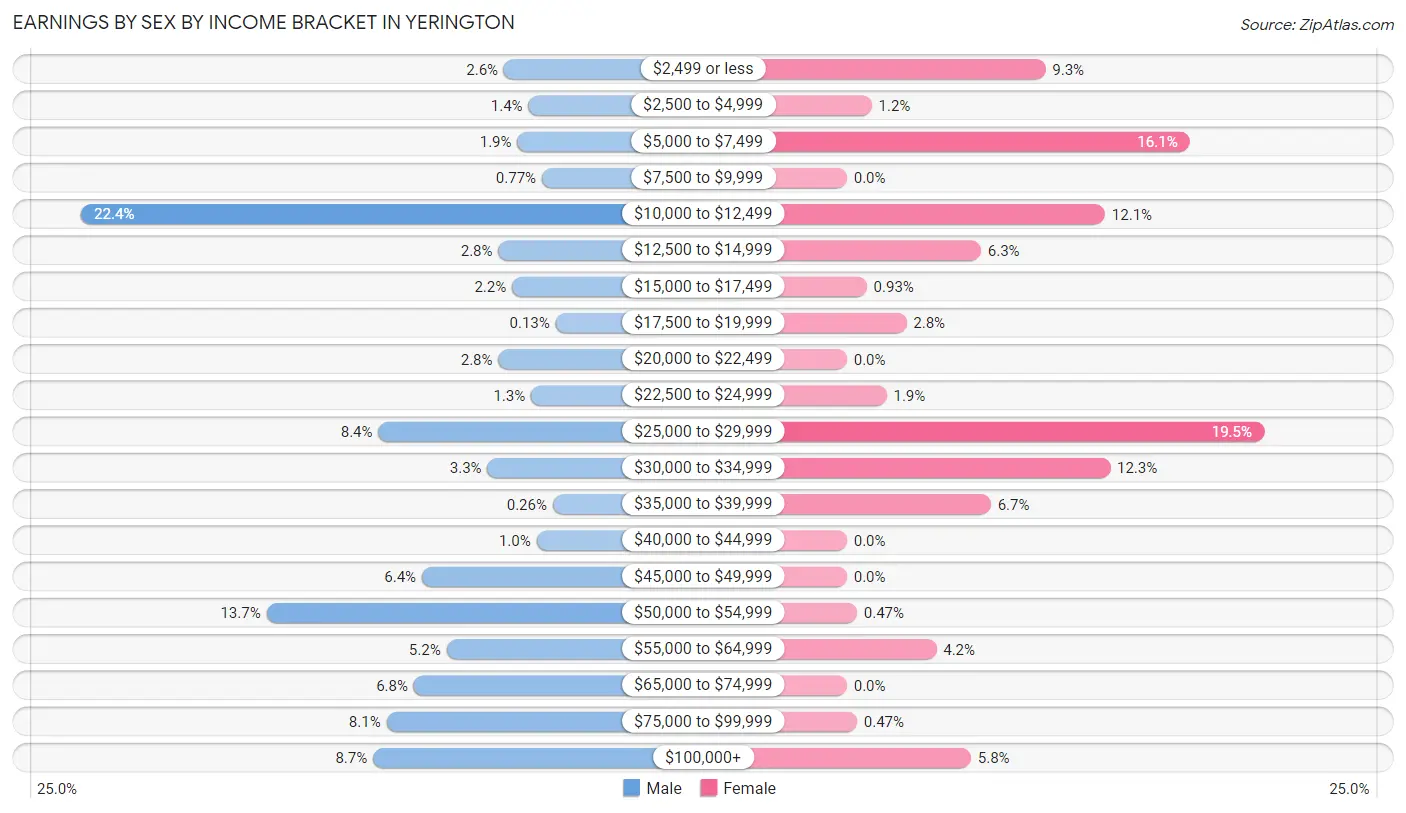
Earnings by Sex by Income Bracket in Yerington
The most common earnings brackets in Yerington are $10,000 to $12,499 for men (175 | 22.4%) and $25,000 to $29,999 for women (84 | 19.5%).
| Income | Male | Female |
| $2,499 or less | 20 (2.5%) | 40 (9.3%) |
| $2,500 to $4,999 | 11 (1.4%) | 5 (1.2%) |
| $5,000 to $7,499 | 15 (1.9%) | 69 (16.1%) |
| $7,500 to $9,999 | 6 (0.8%) | 0 (0.0%) |
| $10,000 to $12,499 | 175 (22.4%) | 52 (12.1%) |
| $12,500 to $14,999 | 22 (2.8%) | 27 (6.3%) |
| $15,000 to $17,499 | 17 (2.2%) | 4 (0.9%) |
| $17,500 to $19,999 | 1 (0.1%) | 12 (2.8%) |
| $20,000 to $22,499 | 22 (2.8%) | 0 (0.0%) |
| $22,500 to $24,999 | 10 (1.3%) | 8 (1.9%) |
| $25,000 to $29,999 | 66 (8.4%) | 84 (19.5%) |
| $30,000 to $34,999 | 26 (3.3%) | 53 (12.3%) |
| $35,000 to $39,999 | 2 (0.3%) | 29 (6.7%) |
| $40,000 to $44,999 | 8 (1.0%) | 0 (0.0%) |
| $45,000 to $49,999 | 50 (6.4%) | 0 (0.0%) |
| $50,000 to $54,999 | 107 (13.7%) | 2 (0.5%) |
| $55,000 to $64,999 | 41 (5.2%) | 18 (4.2%) |
| $65,000 to $74,999 | 53 (6.8%) | 0 (0.0%) |
| $75,000 to $99,999 | 63 (8.1%) | 2 (0.5%) |
| $100,000+ | 68 (8.7%) | 25 (5.8%) |
| Total | 783 (100.0%) | 430 (100.0%) |
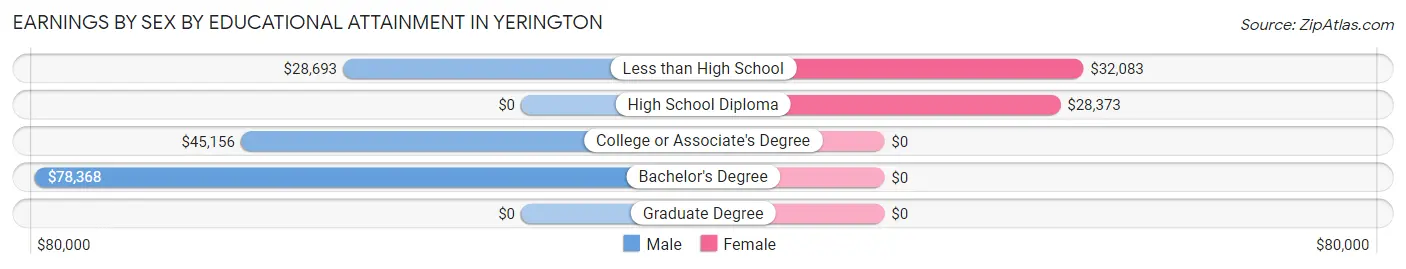
Earnings by Sex by Educational Attainment in Yerington
| Educational Attainment | Male Income | Female Income |
| Less than High School | $28,693 | $32,083 |
| High School Diploma | - | - |
| College or Associate's Degree | $45,156 | $0 |
| Bachelor's Degree | $78,368 | $0 |
| Graduate Degree | - | - |
| Total | $52,578 | $0 |
Family Income in Yerington
Family Income Brackets in Yerington
According to the Yerington family income data, there are 300 families falling into the $50,000 to $74,999 income range, which is the most common income bracket and makes up 39.4% of all families.
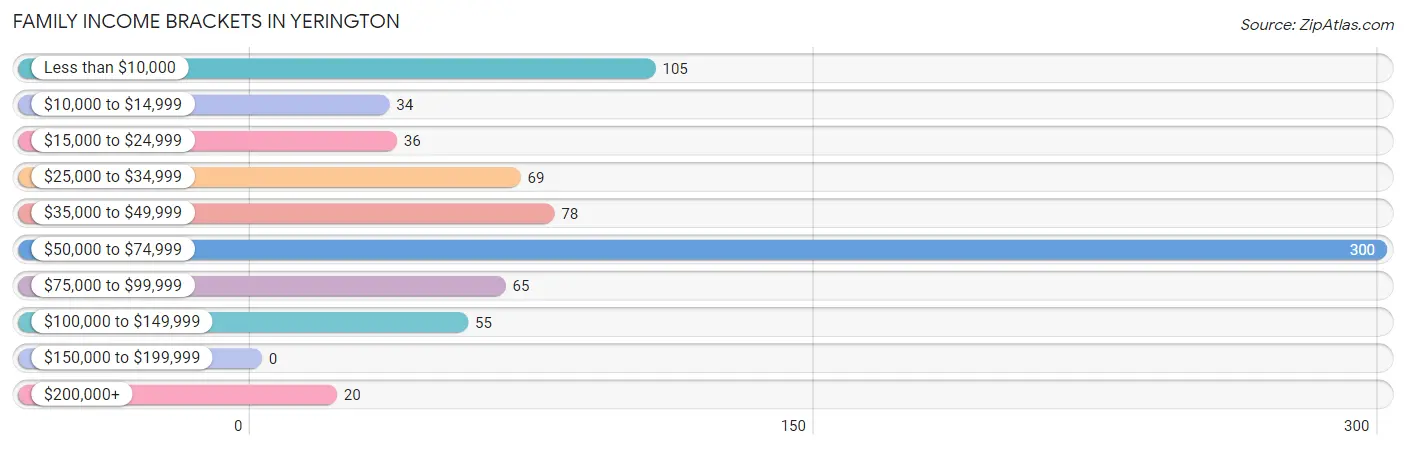
| Income Bracket | # Families | % Families |
| Less than $10,000 | 105 | 13.8% |
| $10,000 to $14,999 | 34 | 4.5% |
| $15,000 to $24,999 | 36 | 4.7% |
| $25,000 to $34,999 | 69 | 9.1% |
| $35,000 to $49,999 | 78 | 10.2% |
| $50,000 to $74,999 | 300 | 39.4% |
| $75,000 to $99,999 | 65 | 8.5% |
| $100,000 to $149,999 | 55 | 7.2% |
| $150,000 to $199,999 | 0 | 0.0% |
| $200,000+ | 20 | 2.6% |
Family Income by Famaliy Size in Yerington
2-person families (357 | 46.9%) account for the highest median family income in Yerington with $63,781 per family, while 2-person families (357 | 46.9%) have the highest median income of $31,890 per family member.
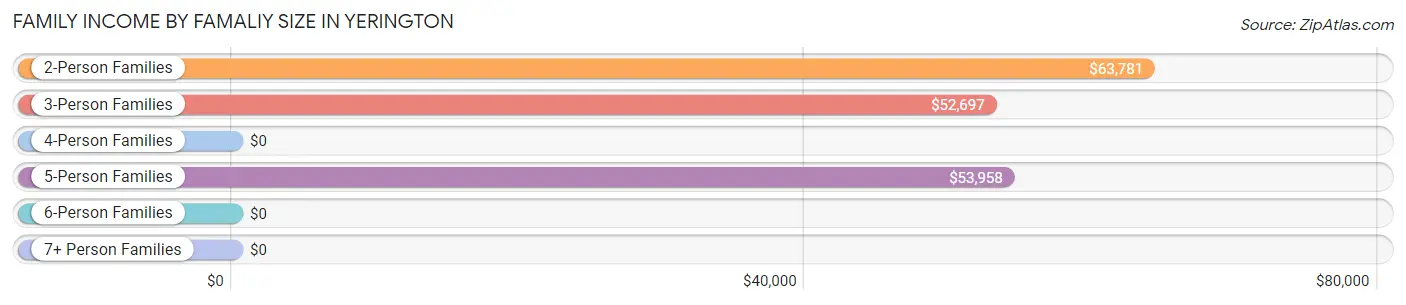
| Income Bracket | # Families | Median Income |
| 2-Person Families | 357 (46.9%) | $63,781 |
| 3-Person Families | 251 (32.9%) | $52,697 |
| 4-Person Families | 99 (13.0%) | $0 |
| 5-Person Families | 27 (3.5%) | $53,958 |
| 6-Person Families | 28 (3.7%) | $0 |
| 7+ Person Families | 0 (0.0%) | $0 |
| Total | 762 (100.0%) | $53,075 |
Family Income by Number of Earners in Yerington
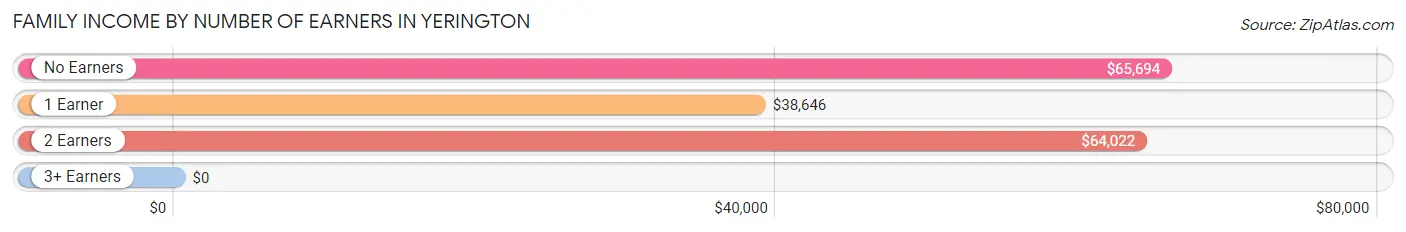
| Number of Earners | # Families | Median Income |
| No Earners | 224 (29.4%) | $65,694 |
| 1 Earner | 390 (51.2%) | $38,646 |
| 2 Earners | 144 (18.9%) | $64,022 |
| 3+ Earners | 4 (0.5%) | $0 |
| Total | 762 (100.0%) | $53,075 |
Household Income in Yerington
Household Income Brackets in Yerington
With 421 households falling in the category, the $50,000 to $74,999 income range is the most frequent in Yerington, accounting for 28.3% of all households. In contrast, only 19 households (1.3%) fall into the $150,000 to $199,999 income bracket, making it the least populous group.
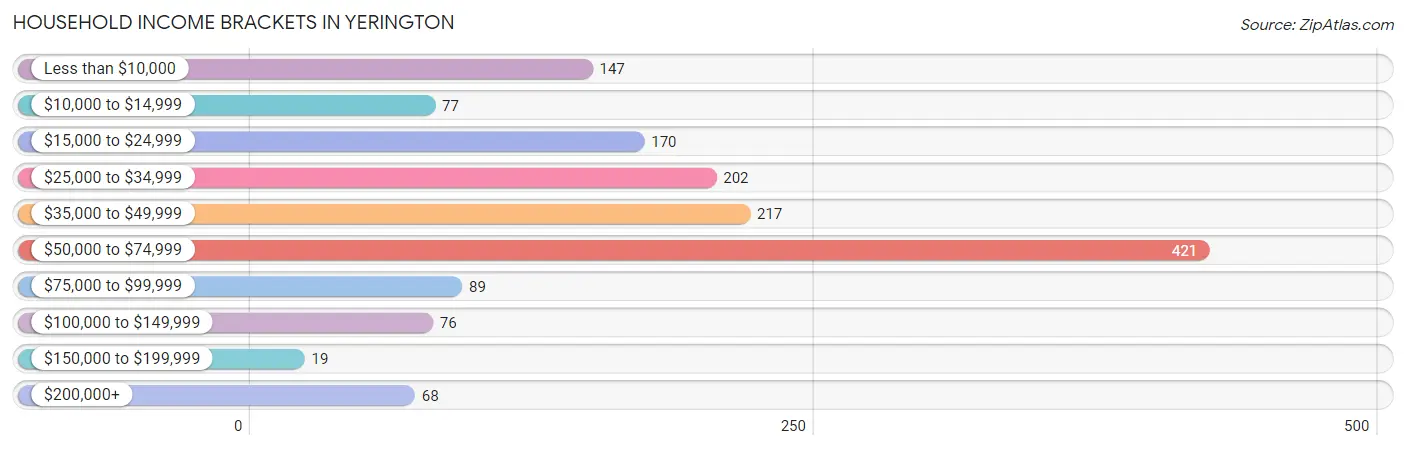
| Income Bracket | # Households | % Households |
| Less than $10,000 | 147 | 9.9% |
| $10,000 to $14,999 | 77 | 5.2% |
| $15,000 to $24,999 | 170 | 11.4% |
| $25,000 to $34,999 | 202 | 13.6% |
| $35,000 to $49,999 | 217 | 14.6% |
| $50,000 to $74,999 | 421 | 28.3% |
| $75,000 to $99,999 | 89 | 6.0% |
| $100,000 to $149,999 | 76 | 5.1% |
| $150,000 to $199,999 | 19 | 1.3% |
| $200,000+ | 68 | 4.6% |
Household Income by Householder Age in Yerington
The median household income in Yerington is $41,600, with the highest median household income of $70,472 found in the 45 to 64 years age bracket for the primary householder. A total of 315 households (21.2%) fall into this category. Meanwhile, the 15 to 24 years age bracket for the primary householder has the lowest median household income of $27,120, with 47 households (3.2%) in this group.
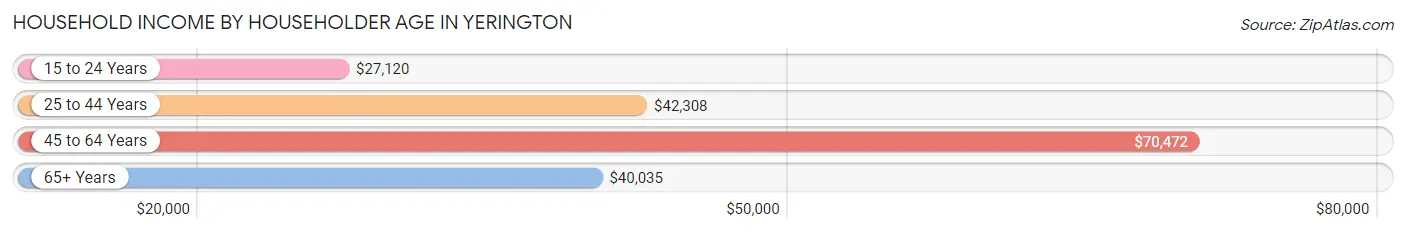
| Income Bracket | # Households | Median Income |
| 15 to 24 Years | 47 (3.2%) | $27,120 |
| 25 to 44 Years | 300 (20.2%) | $42,308 |
| 45 to 64 Years | 315 (21.2%) | $70,472 |
| 65+ Years | 825 (55.5%) | $40,035 |
| Total | 1,487 (100.0%) | $41,600 |
Poverty in Yerington
Income Below Poverty by Sex and Age in Yerington
With 12.8% poverty level for males and 27.5% for females among the residents of Yerington, 6 to 11 year old males and under 5 year old females are the most vulnerable to poverty, with 58 males (36.2%) and 27 females (100.0%) in their respective age groups living below the poverty level.
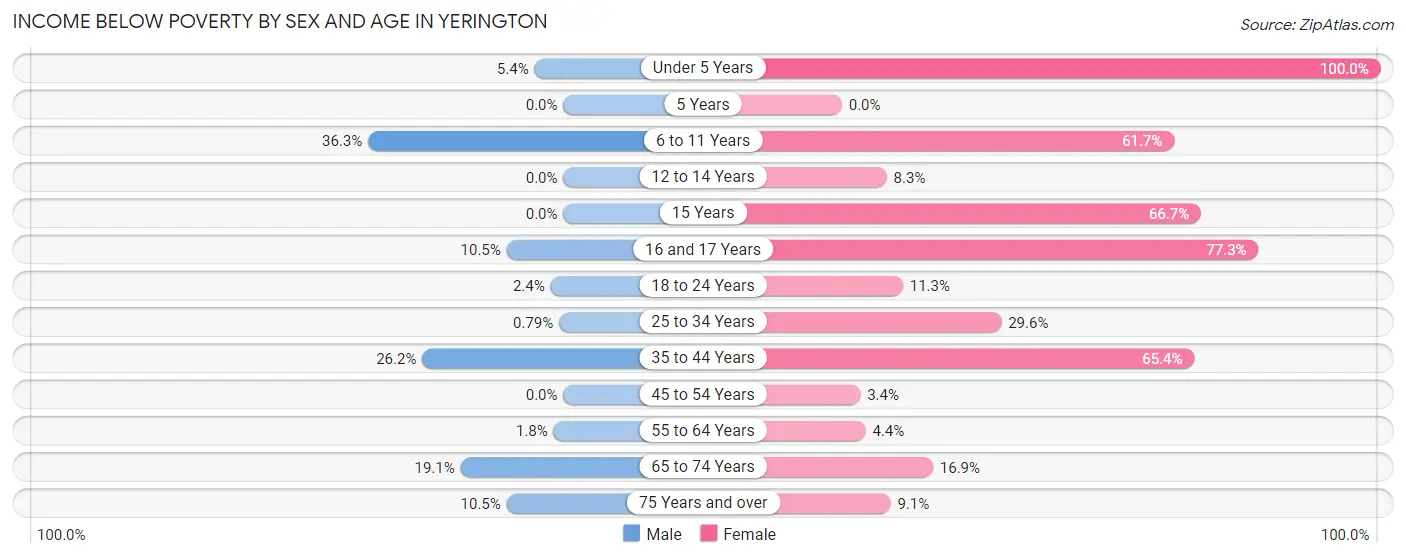
| Age Bracket | Male | Female |
| Under 5 Years | 3 (5.4%) | 27 (100.0%) |
| 5 Years | 0 (0.0%) | 0 (0.0%) |
| 6 to 11 Years | 58 (36.2%) | 87 (61.7%) |
| 12 to 14 Years | 0 (0.0%) | 3 (8.3%) |
| 15 Years | 0 (0.0%) | 4 (66.7%) |
| 16 and 17 Years | 6 (10.5%) | 58 (77.3%) |
| 18 to 24 Years | 4 (2.4%) | 6 (11.3%) |
| 25 to 34 Years | 1 (0.8%) | 29 (29.6%) |
| 35 to 44 Years | 22 (26.2%) | 89 (65.4%) |
| 45 to 54 Years | 0 (0.0%) | 4 (3.4%) |
| 55 to 64 Years | 3 (1.8%) | 7 (4.4%) |
| 65 to 74 Years | 83 (19.1%) | 60 (16.9%) |
| 75 Years and over | 22 (10.5%) | 19 (9.0%) |
| Total | 202 (12.8%) | 393 (27.5%) |
Income Above Poverty by Sex and Age in Yerington
According to the poverty statistics in Yerington, males aged 45 to 54 years and females aged 5 years are the age groups that are most secure financially, with 100.0% of males and 100.0% of females in these age groups living above the poverty line.
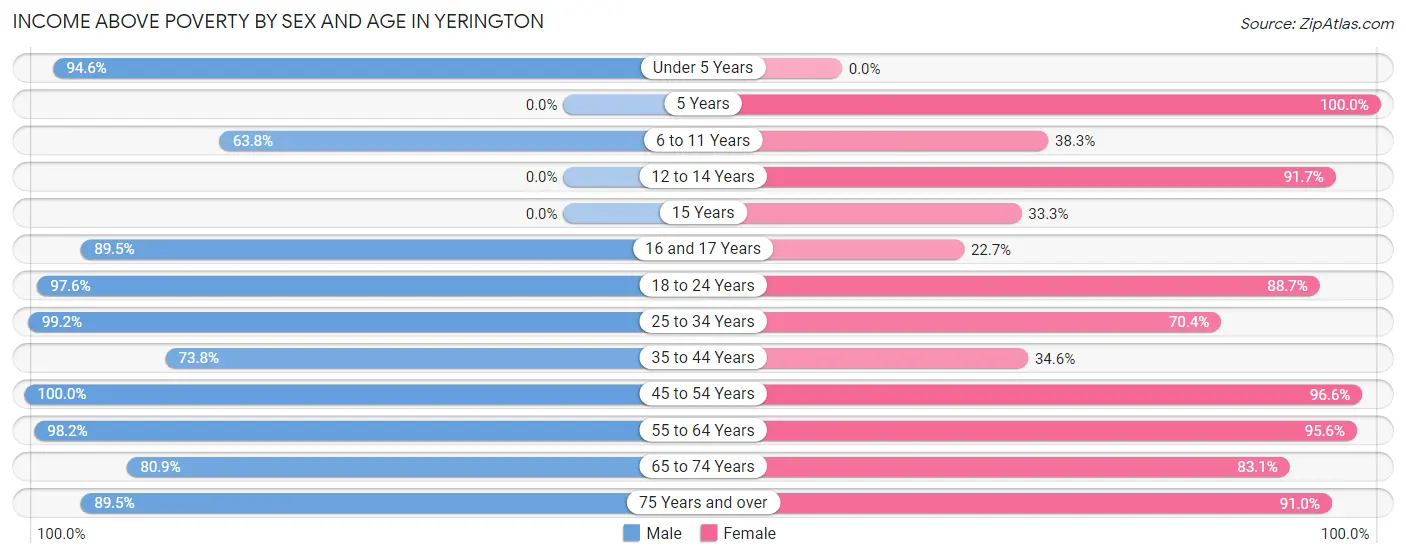
| Age Bracket | Male | Female |
| Under 5 Years | 53 (94.6%) | 0 (0.0%) |
| 5 Years | 0 (0.0%) | 16 (100.0%) |
| 6 to 11 Years | 102 (63.7%) | 54 (38.3%) |
| 12 to 14 Years | 0 (0.0%) | 33 (91.7%) |
| 15 Years | 0 (0.0%) | 2 (33.3%) |
| 16 and 17 Years | 51 (89.5%) | 17 (22.7%) |
| 18 to 24 Years | 165 (97.6%) | 47 (88.7%) |
| 25 to 34 Years | 126 (99.2%) | 69 (70.4%) |
| 35 to 44 Years | 62 (73.8%) | 47 (34.6%) |
| 45 to 54 Years | 110 (100.0%) | 113 (96.6%) |
| 55 to 64 Years | 163 (98.2%) | 152 (95.6%) |
| 65 to 74 Years | 352 (80.9%) | 295 (83.1%) |
| 75 Years and over | 187 (89.5%) | 191 (90.9%) |
| Total | 1,371 (87.2%) | 1,036 (72.5%) |
Income Below Poverty Among Married-Couple Families in Yerington
The poverty statistics for married-couple families in Yerington show that 7.1% or 33 of the total 464 families live below the poverty line. Families with no children have the highest poverty rate of 8.0%, comprising of 33 families. On the other hand, families with 1 or 2 children have the lowest poverty rate of 0.0%, which includes 0 families.
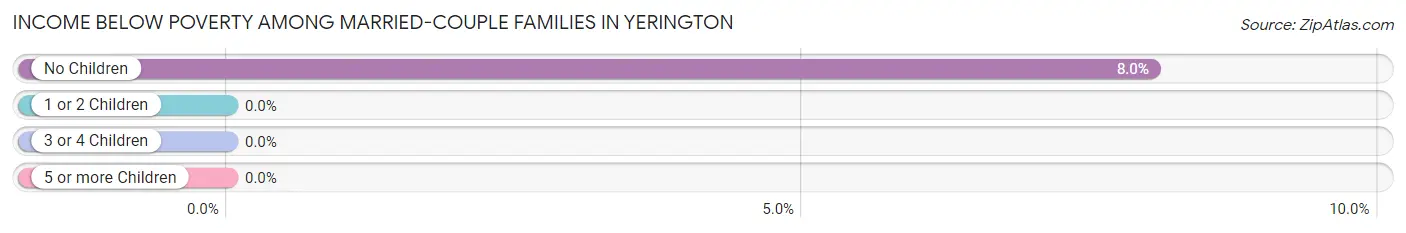
| Children | Above Poverty | Below Poverty |
| No Children | 378 (92.0%) | 33 (8.0%) |
| 1 or 2 Children | 23 (100.0%) | 0 (0.0%) |
| 3 or 4 Children | 30 (100.0%) | 0 (0.0%) |
| 5 or more Children | 0 (0.0%) | 0 (0.0%) |
| Total | 431 (92.9%) | 33 (7.1%) |
Income Below Poverty Among Single-Parent Households in Yerington
According to the poverty data in Yerington, 15.8% or 24 single-father households and 75.3% or 110 single-mother households are living below the poverty line. Among single-father households, those with no children have the highest poverty rate, with 22 households (84.6%) experiencing poverty. Likewise, among single-mother households, those with 3 or 4 children have the highest poverty rate, with 66 households (98.5%) falling below the poverty line.
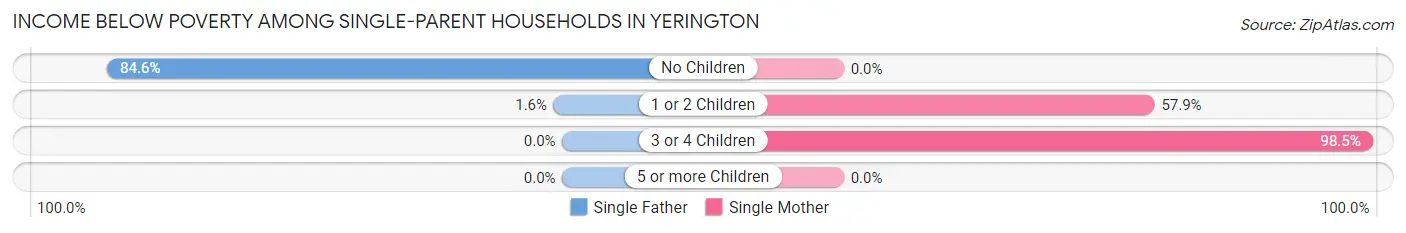
| Children | Single Father | Single Mother |
| No Children | 22 (84.6%) | 0 (0.0%) |
| 1 or 2 Children | 2 (1.6%) | 44 (57.9%) |
| 3 or 4 Children | 0 (0.0%) | 66 (98.5%) |
| 5 or more Children | 0 (0.0%) | 0 (0.0%) |
| Total | 24 (15.8%) | 110 (75.3%) |
Income Below Poverty Among Married-Couple vs Single-Parent Households in Yerington
The poverty data for Yerington shows that 33 of the married-couple family households (7.1%) and 134 of the single-parent households (45.0%) are living below the poverty level. Within the married-couple family households, those with no children have the highest poverty rate, with 33 households (8.0%) falling below the poverty line. Among the single-parent households, those with 3 or 4 children have the highest poverty rate, with 66 household (97.1%) living below poverty.
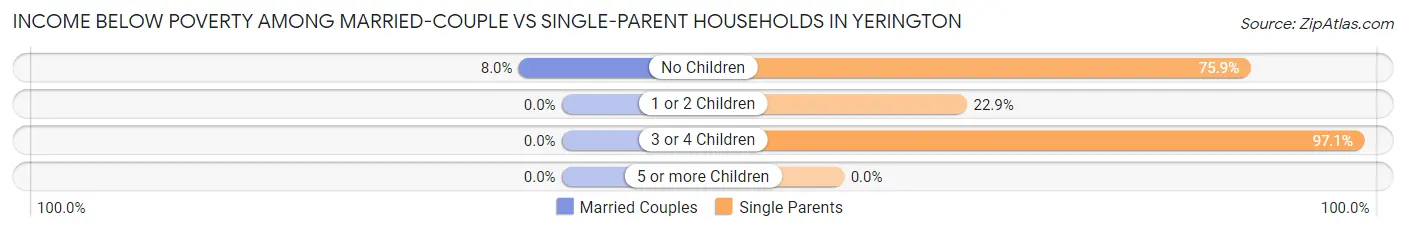
| Children | Married-Couple Families | Single-Parent Households |
| No Children | 33 (8.0%) | 22 (75.9%) |
| 1 or 2 Children | 0 (0.0%) | 46 (22.9%) |
| 3 or 4 Children | 0 (0.0%) | 66 (97.1%) |
| 5 or more Children | 0 (0.0%) | 0 (0.0%) |
| Total | 33 (7.1%) | 134 (45.0%) |
Race in Yerington
The most populous races in Yerington are White / Caucasian (2,203 | 70.9%), Hispanic or Latino (854 | 27.5%), and Some other Race (412 | 13.3%).
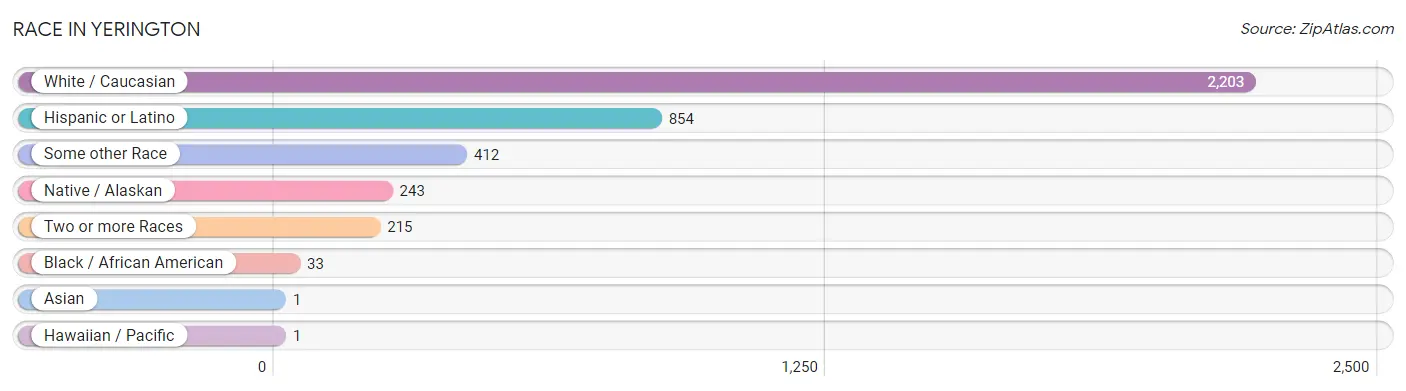
| Race | # Population | % Population |
| Asian | 1 | 0.0% |
| Black / African American | 33 | 1.1% |
| Hawaiian / Pacific | 1 | 0.0% |
| Hispanic or Latino | 854 | 27.5% |
| Native / Alaskan | 243 | 7.8% |
| White / Caucasian | 2,203 | 70.9% |
| Two or more Races | 215 | 6.9% |
| Some other Race | 412 | 13.3% |
| Total | 3,108 | 100.0% |
Ancestry in Yerington
The most populous ancestries reported in Yerington are German (735 | 23.6%), Mexican (667 | 21.5%), Irish (304 | 9.8%), Italian (285 | 9.2%), and Russian (233 | 7.5%), together accounting for 71.6% of all Yerington residents.
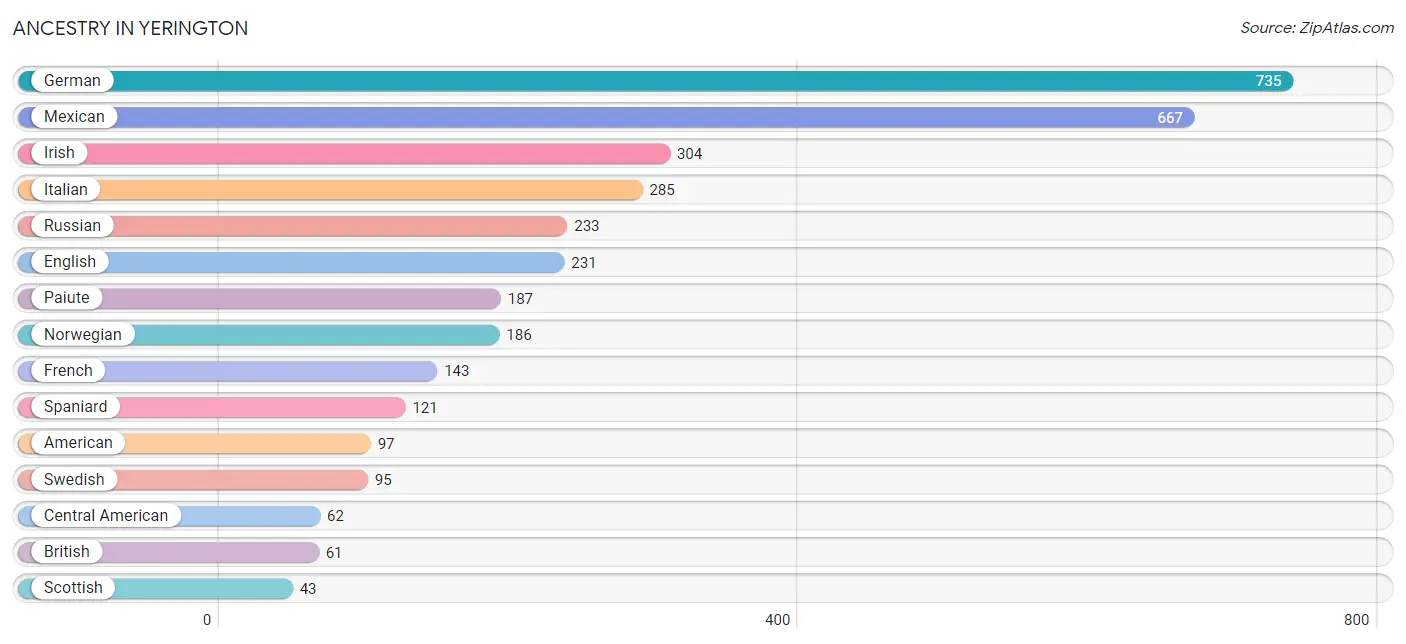
| Ancestry | # Population | % Population |
| American | 97 | 3.1% |
| British | 61 | 2.0% |
| Central American | 62 | 2.0% |
| Cherokee | 29 | 0.9% |
| Czech | 18 | 0.6% |
| Danish | 20 | 0.6% |
| English | 231 | 7.4% |
| European | 18 | 0.6% |
| Finnish | 16 | 0.5% |
| French | 143 | 4.6% |
| French Canadian | 21 | 0.7% |
| German | 735 | 23.6% |
| Guatemalan | 36 | 1.2% |
| Irish | 304 | 9.8% |
| Italian | 285 | 9.2% |
| Mexican | 667 | 21.5% |
| Mexican American Indian | 28 | 0.9% |
| Native Hawaiian | 41 | 1.3% |
| Navajo | 4 | 0.1% |
| Norwegian | 186 | 6.0% |
| Paiute | 187 | 6.0% |
| Pakistani | 2 | 0.1% |
| Polish | 27 | 0.9% |
| Portuguese | 30 | 1.0% |
| Russian | 233 | 7.5% |
| Scotch-Irish | 41 | 1.3% |
| Scottish | 43 | 1.4% |
| Shoshone | 2 | 0.1% |
| Spaniard | 121 | 3.9% |
| Swedish | 95 | 3.1% |
| Swiss | 32 | 1.0% |
| Tongan | 10 | 0.3% | View All 32 Rows |
Immigrants in Yerington
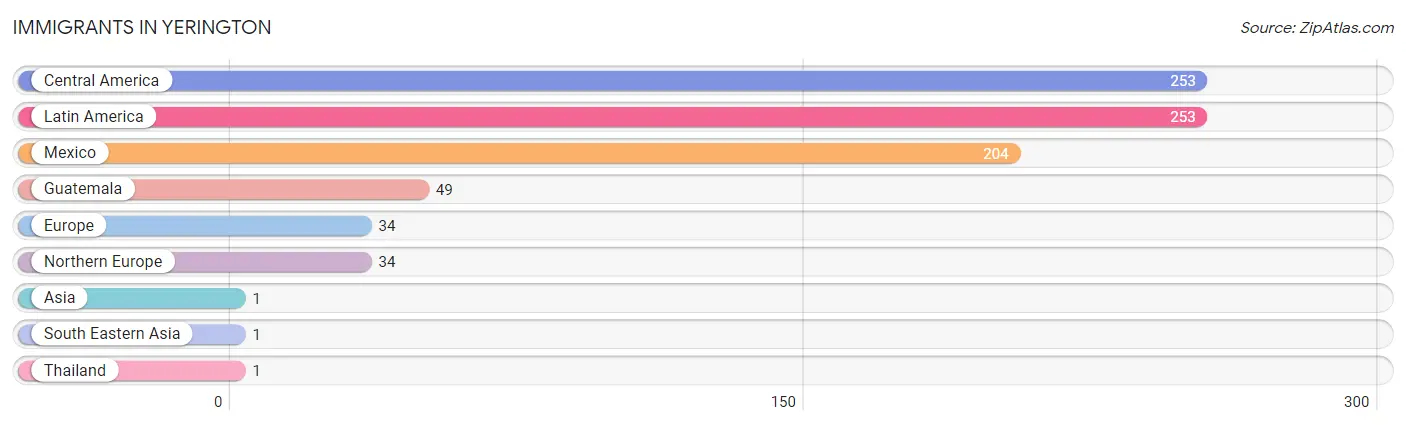
The most numerous immigrant groups reported in Yerington came from Central America (253 | 8.1%), Latin America (253 | 8.1%), Mexico (204 | 6.6%), Guatemala (49 | 1.6%), and Europe (34 | 1.1%), together accounting for 25.5% of all Yerington residents.
| Immigration Origin | # Population | % Population |
| Asia | 1 | 0.0% |
| Central America | 253 | 8.1% |
| Europe | 34 | 1.1% |
| Guatemala | 49 | 1.6% |
| Latin America | 253 | 8.1% |
| Mexico | 204 | 6.6% |
| Northern Europe | 34 | 1.1% |
| South Eastern Asia | 1 | 0.0% |
| Thailand | 1 | 0.0% | View All 9 Rows |
Sex and Age in Yerington
Sex and Age in Yerington
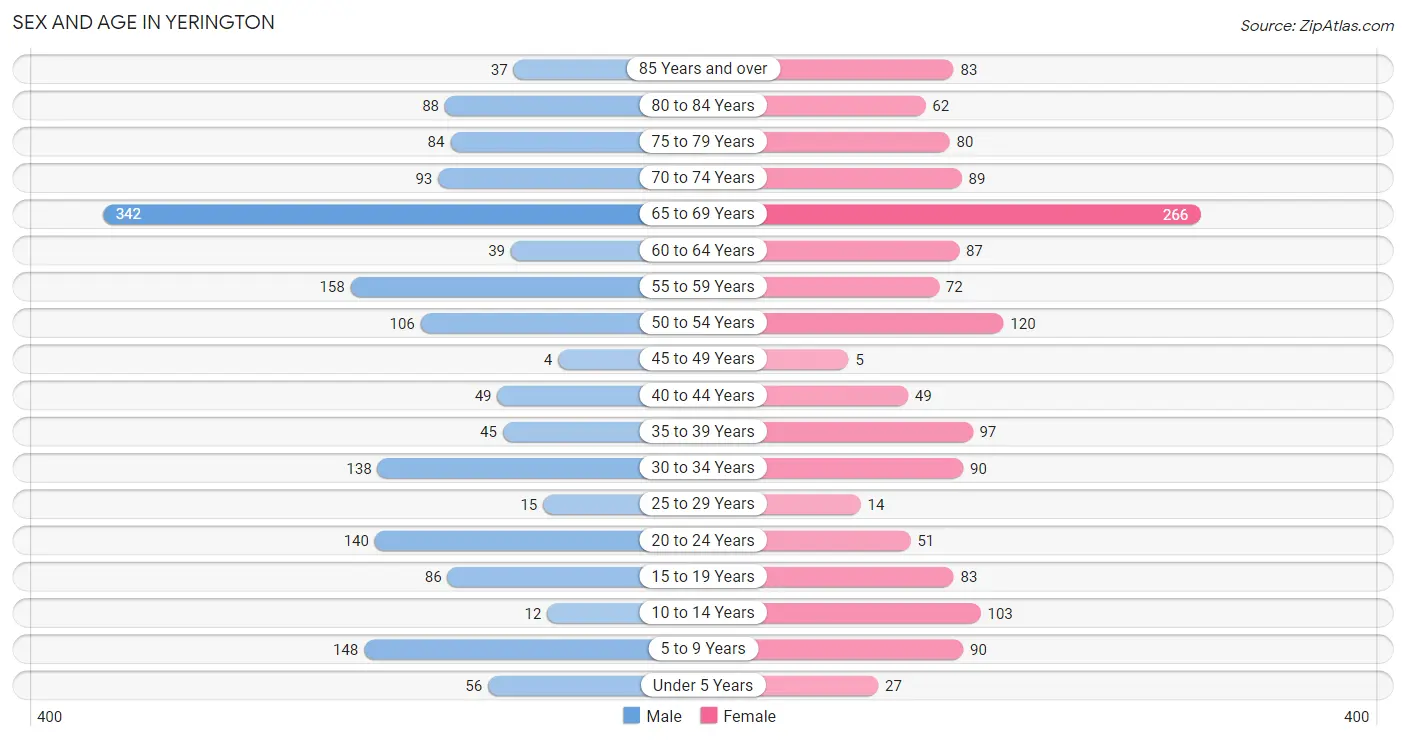
The most populous age groups in Yerington are 65 to 69 Years (342 | 20.8%) for men and 65 to 69 Years (266 | 18.1%) for women.
| Age Bracket | Male | Female |
| Under 5 Years | 56 (3.4%) | 27 (1.8%) |
| 5 to 9 Years | 148 (9.0%) | 90 (6.1%) |
| 10 to 14 Years | 12 (0.7%) | 103 (7.0%) |
| 15 to 19 Years | 86 (5.2%) | 83 (5.7%) |
| 20 to 24 Years | 140 (8.5%) | 51 (3.5%) |
| 25 to 29 Years | 15 (0.9%) | 14 (0.9%) |
| 30 to 34 Years | 138 (8.4%) | 90 (6.1%) |
| 35 to 39 Years | 45 (2.7%) | 97 (6.6%) |
| 40 to 44 Years | 49 (3.0%) | 49 (3.3%) |
| 45 to 49 Years | 4 (0.2%) | 5 (0.3%) |
| 50 to 54 Years | 106 (6.5%) | 120 (8.2%) |
| 55 to 59 Years | 158 (9.6%) | 72 (4.9%) |
| 60 to 64 Years | 39 (2.4%) | 87 (5.9%) |
| 65 to 69 Years | 342 (20.8%) | 266 (18.1%) |
| 70 to 74 Years | 93 (5.7%) | 89 (6.1%) |
| 75 to 79 Years | 84 (5.1%) | 80 (5.4%) |
| 80 to 84 Years | 88 (5.4%) | 62 (4.2%) |
| 85 Years and over | 37 (2.3%) | 83 (5.7%) |
| Total | 1,640 (100.0%) | 1,468 (100.0%) |
Families and Households in Yerington
Median Family Size in Yerington
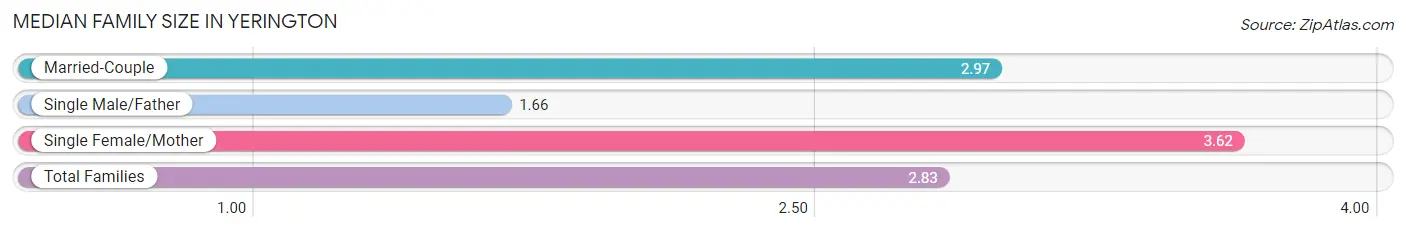
The median family size in Yerington is 2.83 persons per family, with single female/mother families (146 | 19.2%) accounting for the largest median family size of 3.62 persons per family. On the other hand, single male/father families (152 | 20.0%) represent the smallest median family size with 1.66 persons per family.
| Family Type | # Families | Family Size |
| Married-Couple | 464 (60.9%) | 2.97 |
| Single Male/Father | 152 (20.0%) | 1.66 |
| Single Female/Mother | 146 (19.2%) | 3.62 |
| Total Families | 762 (100.0%) | 2.83 |
Median Household Size in Yerington
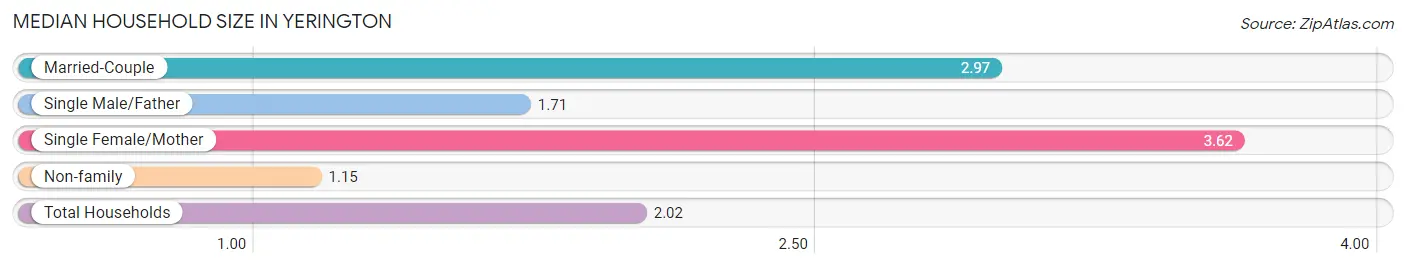
The median household size in Yerington is 2.02 persons per household, with single female/mother households (146 | 9.8%) accounting for the largest median household size of 3.62 persons per household. non-family households (725 | 48.8%) represent the smallest median household size with 1.15 persons per household.
| Household Type | # Households | Household Size |
| Married-Couple | 464 (31.2%) | 2.97 |
| Single Male/Father | 152 (10.2%) | 1.71 |
| Single Female/Mother | 146 (9.8%) | 3.62 |
| Non-family | 725 (48.8%) | 1.15 |
| Total Households | 1,487 (100.0%) | 2.02 |
Household Size by Marriage Status in Yerington
Out of a total of 1,487 households in Yerington, 762 (51.2%) are family households, while 725 (48.8%) are nonfamily households. The most numerous type of family households are 2-person households, comprising 356, and the most common type of nonfamily households are 1-person households, comprising 663.
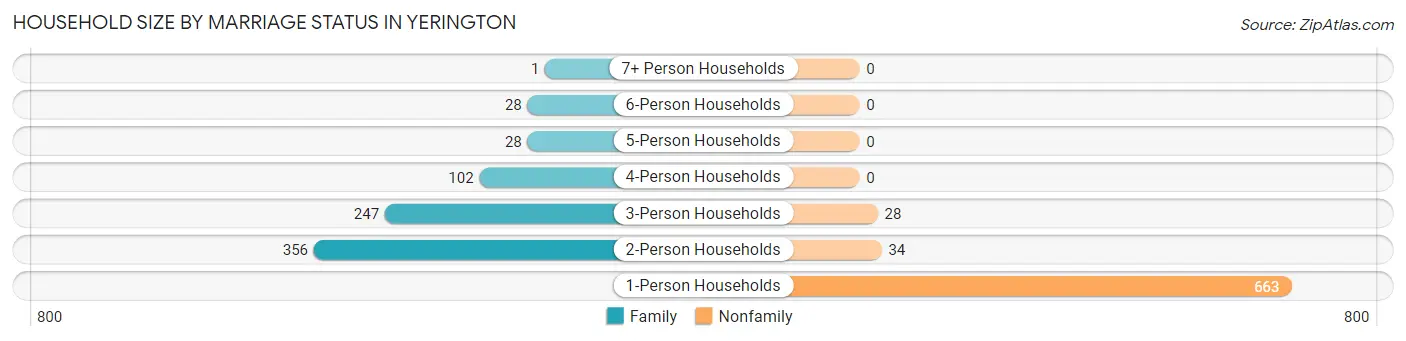
| Household Size | Family Households | Nonfamily Households |
| 1-Person Households | - | 663 (44.6%) |
| 2-Person Households | 356 (23.9%) | 34 (2.3%) |
| 3-Person Households | 247 (16.6%) | 28 (1.9%) |
| 4-Person Households | 102 (6.9%) | 0 (0.0%) |
| 5-Person Households | 28 (1.9%) | 0 (0.0%) |
| 6-Person Households | 28 (1.9%) | 0 (0.0%) |
| 7+ Person Households | 1 (0.1%) | 0 (0.0%) |
| Total | 762 (51.2%) | 725 (48.8%) |
Female Fertility in Yerington
Fertility by Age in Yerington
Average fertility rate in Yerington is 18.0 births per 1,000 women. Women in the age bracket of 20 to 34 years have the highest fertility rate with 45.0 births per 1,000 women. Women in the age bracket of 20 to 34 years acount for 100.0% of all women with births.
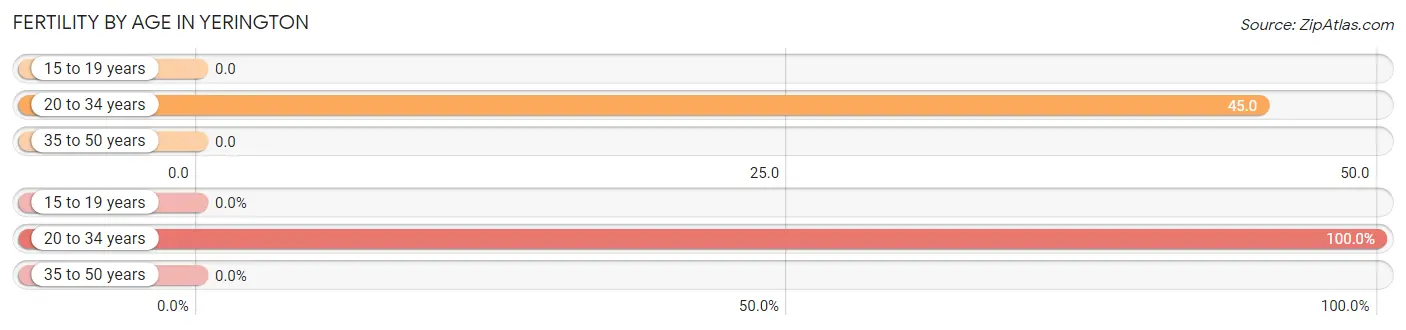
| Age Bracket | Women with Births | Births / 1,000 Women |
| 15 to 19 years | 0 (0.0%) | 0.0 |
| 20 to 34 years | 7 (100.0%) | 45.0 |
| 35 to 50 years | 0 (0.0%) | 0.0 |
| Total | 7 (100.0%) | 18.0 |
Fertility by Age by Marriage Status in Yerington
42.9% of women with births (7) in Yerington are married. The highest percentage of unmarried women with births falls into 20 to 34 years age bracket with 57.1% of them unmarried at the time of birth, while the lowest percentage of unmarried women with births belong to 20 to 34 years age bracket with 57.1% of them unmarried.
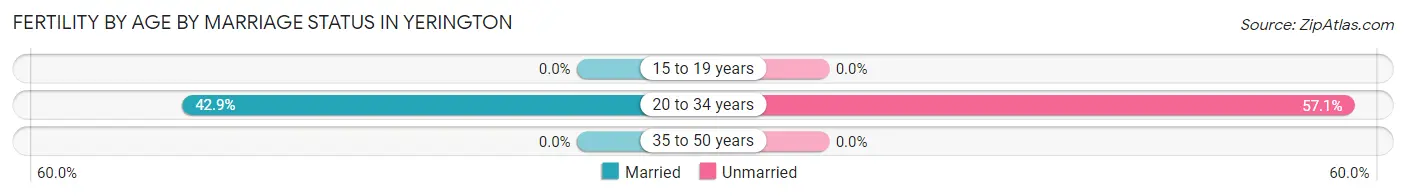
| Age Bracket | Married | Unmarried |
| 15 to 19 years | 0 (0.0%) | 0 (0.0%) |
| 20 to 34 years | 3 (42.9%) | 4 (57.1%) |
| 35 to 50 years | 0 (0.0%) | 0 (0.0%) |
| Total | 3 (42.9%) | 4 (57.1%) |
Fertility by Education in Yerington
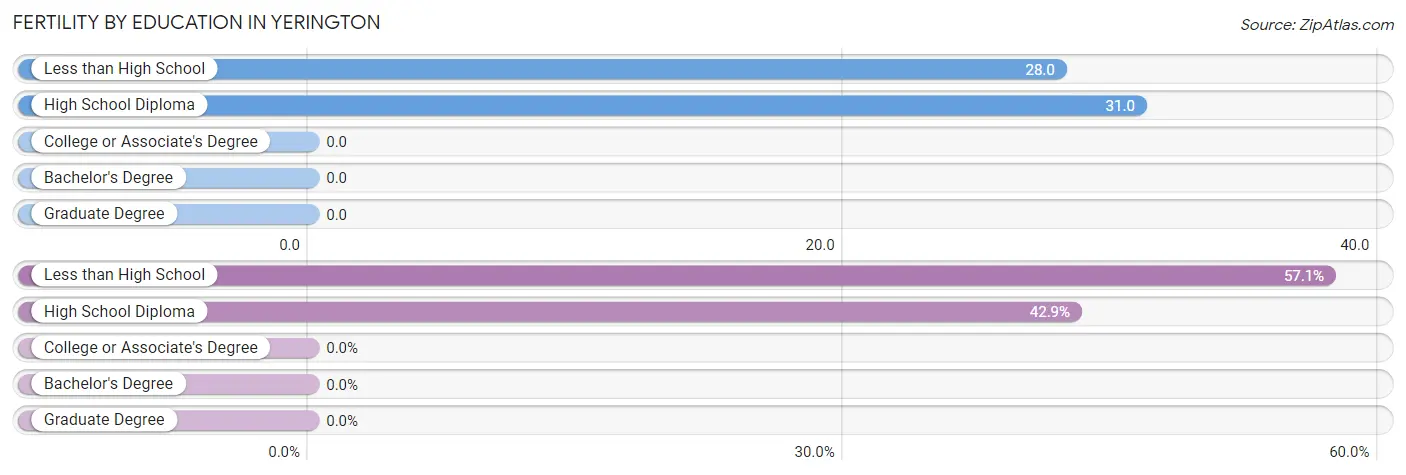
| Educational Attainment | Women with Births | Births / 1,000 Women |
| Less than High School | 4 (57.1%) | 28.0 |
| High School Diploma | 3 (42.9%) | 31.0 |
| College or Associate's Degree | 0 (0.0%) | 0.0 |
| Bachelor's Degree | 0 (0.0%) | 0.0 |
| Graduate Degree | 0 (0.0%) | 0.0 |
| Total | 7 (100.0%) | 18.0 |
Fertility by Education by Marriage Status in Yerington
57.1% of women with births in Yerington are unmarried. Women with the educational attainment of high school diploma are most likely to be married with 100.0% of them married at childbirth, while women with the educational attainment of less than high school are least likely to be married with 100.0% of them unmarried at childbirth.
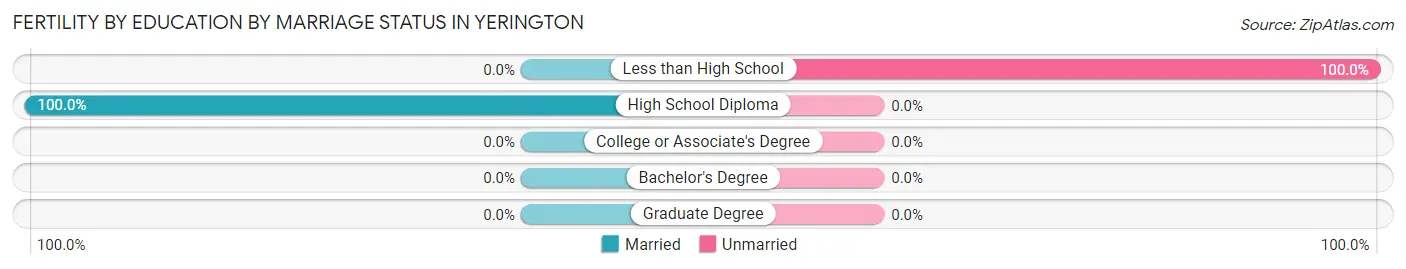
| Educational Attainment | Married | Unmarried |
| Less than High School | 0 (0.0%) | 4 (100.0%) |
| High School Diploma | 3 (100.0%) | 0 (0.0%) |
| College or Associate's Degree | 0 (0.0%) | 0 (0.0%) |
| Bachelor's Degree | 0 (0.0%) | 0 (0.0%) |
| Graduate Degree | 0 (0.0%) | 0 (0.0%) |
| Total | 3 (42.9%) | 4 (57.1%) |
Employment Characteristics in Yerington
Employment by Class of Employer in Yerington
Among the 1,052 employed individuals in Yerington, private company employees (750 | 71.3%), local government employees (204 | 19.4%), and federal government employees (43 | 4.1%) make up the most common classes of employment.
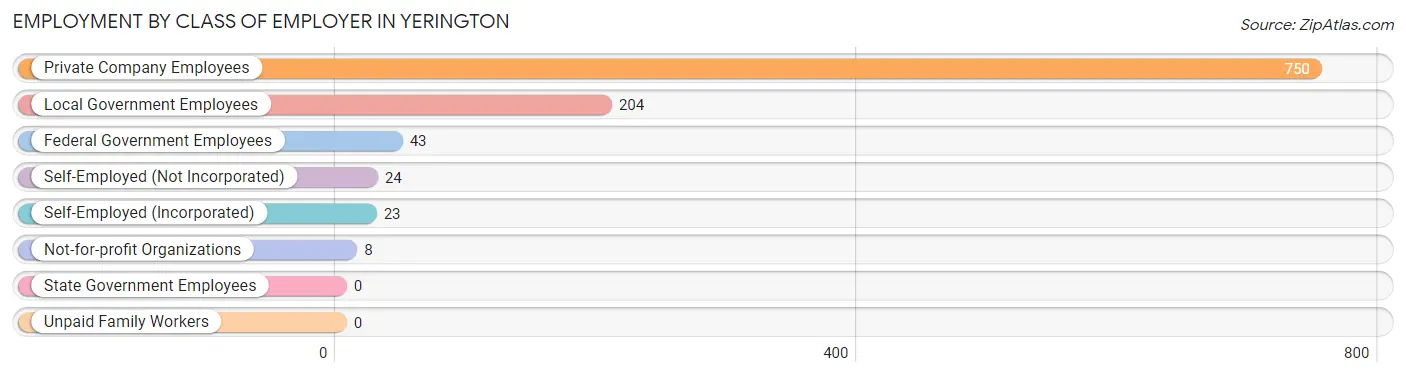
| Employer Class | # Employees | % Employees |
| Private Company Employees | 750 | 71.3% |
| Self-Employed (Incorporated) | 23 | 2.2% |
| Self-Employed (Not Incorporated) | 24 | 2.3% |
| Not-for-profit Organizations | 8 | 0.8% |
| Local Government Employees | 204 | 19.4% |
| State Government Employees | 0 | 0.0% |
| Federal Government Employees | 43 | 4.1% |
| Unpaid Family Workers | 0 | 0.0% |
| Total | 1,052 | 100.0% |
Employment Status by Age in Yerington
According to the labor force statistics for Yerington, out of the total population over 16 years of age (2,666), 41.9% or 1,117 individuals are in the labor force, with 5.1% or 57 of them unemployed. The age group with the highest labor force participation rate is 20 to 24 years, with 95.8% or 183 individuals in the labor force. Within the labor force, the 16 to 19 years age range has the highest percentage of unemployed individuals, with 68.0% or 34 of them being unemployed.
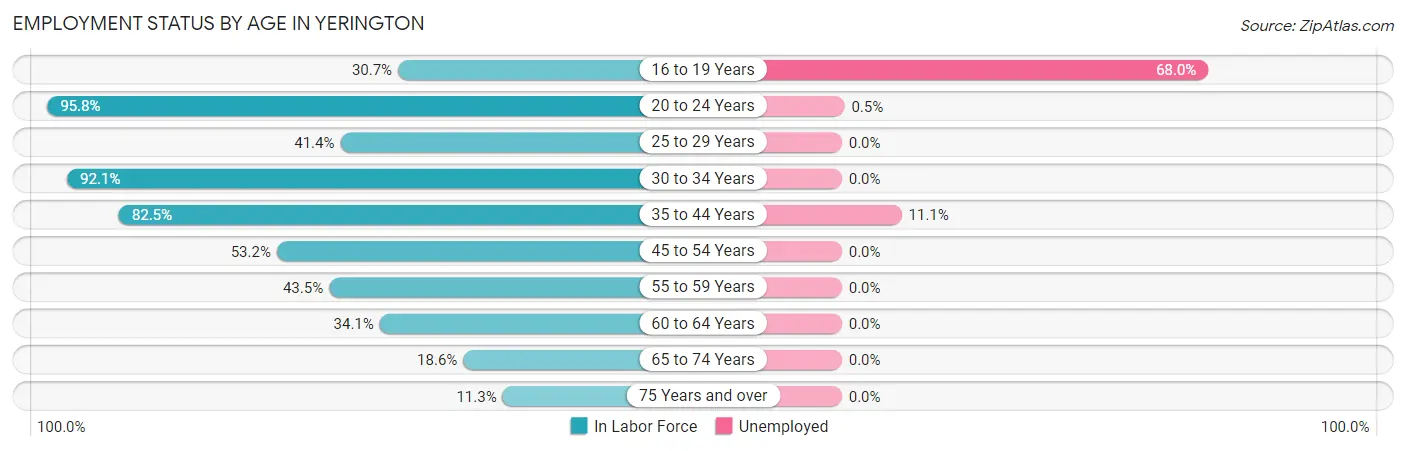
| Age Bracket | In Labor Force | Unemployed |
| 16 to 19 Years | 50 (30.7%) | 34 (68.0%) |
| 20 to 24 Years | 183 (95.8%) | 1 (0.5%) |
| 25 to 29 Years | 12 (41.4%) | 0 (0.0%) |
| 30 to 34 Years | 210 (92.1%) | 0 (0.0%) |
| 35 to 44 Years | 198 (82.5%) | 22 (11.1%) |
| 45 to 54 Years | 125 (53.2%) | 0 (0.0%) |
| 55 to 59 Years | 100 (43.5%) | 0 (0.0%) |
| 60 to 64 Years | 43 (34.1%) | 0 (0.0%) |
| 65 to 74 Years | 147 (18.6%) | 0 (0.0%) |
| 75 Years and over | 49 (11.3%) | 0 (0.0%) |
| Total | 1,117 (41.9%) | 57 (5.1%) |
Employment Status by Educational Attainment in Yerington
According to labor force statistics for Yerington, 63.2% of individuals (688) out of the total population between 25 and 64 years of age (1,088) are in the labor force, with 3.2% or 22 of them being unemployed. The group with the highest labor force participation rate are those with the educational attainment of bachelor's degree or higher, with 75.8% or 204 individuals in the labor force. Within the labor force, individuals with high school diploma education have the highest percentage of unemployment, with 17.9% or 22 of them being unemployed.
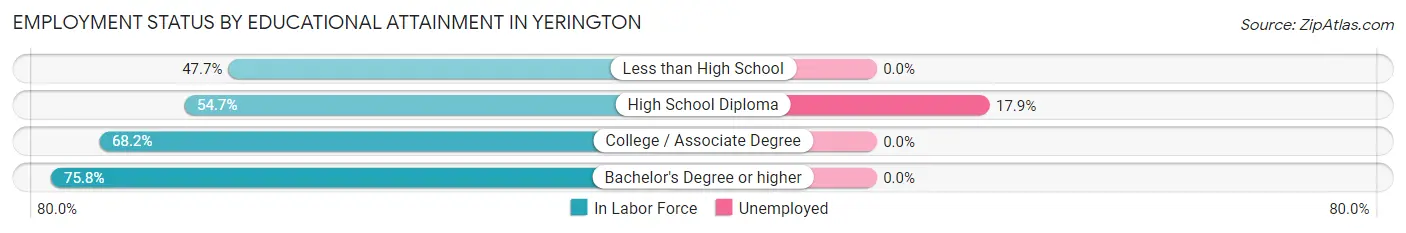
| Educational Attainment | In Labor Force | Unemployed |
| Less than High School | 102 (47.7%) | 0 (0.0%) |
| High School Diploma | 123 (54.7%) | 40 (17.9%) |
| College / Associate Degree | 259 (68.2%) | 0 (0.0%) |
| Bachelor's Degree or higher | 204 (75.8%) | 0 (0.0%) |
| Total | 688 (63.2%) | 35 (3.2%) |
Employment Occupations by Sex in Yerington
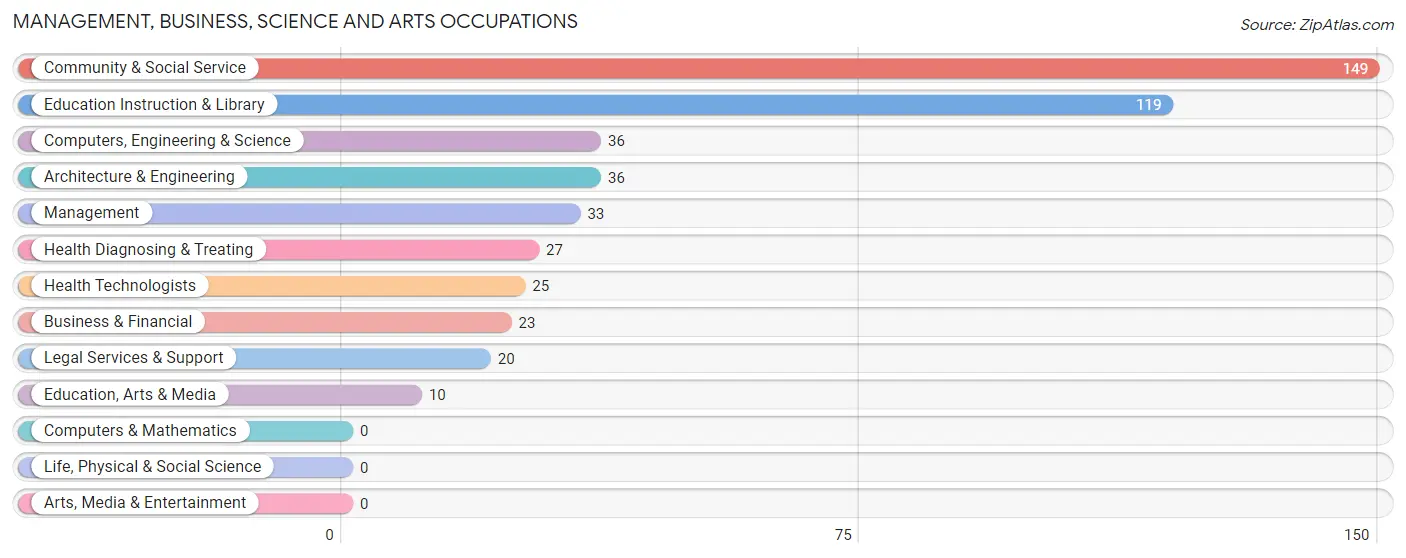
Management, Business, Science and Arts Occupations
The most common Management, Business, Science and Arts occupations in Yerington are Community & Social Service (149 | 14.1%), Education Instruction & Library (119 | 11.2%), Computers, Engineering & Science (36 | 3.4%), Architecture & Engineering (36 | 3.4%), and Management (33 | 3.1%).
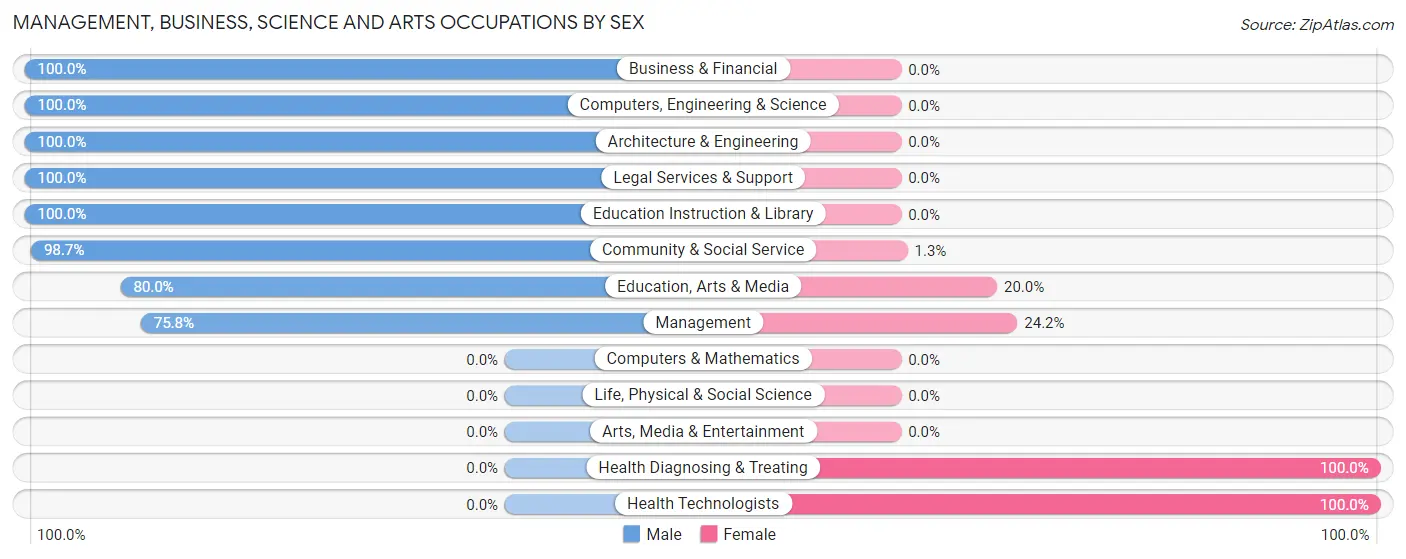
Management, Business, Science and Arts Occupations by Sex
Within the Management, Business, Science and Arts occupations in Yerington, the most male-oriented occupations are Business & Financial (100.0%), Computers, Engineering & Science (100.0%), and Architecture & Engineering (100.0%), while the most female-oriented occupations are Health Diagnosing & Treating (100.0%), Health Technologists (100.0%), and Management (24.2%).
| Occupation | Male | Female |
| Management | 25 (75.8%) | 8 (24.2%) |
| Business & Financial | 23 (100.0%) | 0 (0.0%) |
| Computers, Engineering & Science | 36 (100.0%) | 0 (0.0%) |
| Computers & Mathematics | 0 (0.0%) | 0 (0.0%) |
| Architecture & Engineering | 36 (100.0%) | 0 (0.0%) |
| Life, Physical & Social Science | 0 (0.0%) | 0 (0.0%) |
| Community & Social Service | 147 (98.7%) | 2 (1.3%) |
| Education, Arts & Media | 8 (80.0%) | 2 (20.0%) |
| Legal Services & Support | 20 (100.0%) | 0 (0.0%) |
| Education Instruction & Library | 119 (100.0%) | 0 (0.0%) |
| Arts, Media & Entertainment | 0 (0.0%) | 0 (0.0%) |
| Health Diagnosing & Treating | 0 (0.0%) | 27 (100.0%) |
| Health Technologists | 0 (0.0%) | 25 (100.0%) |
| Total (Category) | 231 (86.2%) | 37 (13.8%) |
| Total (Overall) | 693 (65.4%) | 367 (34.6%) |
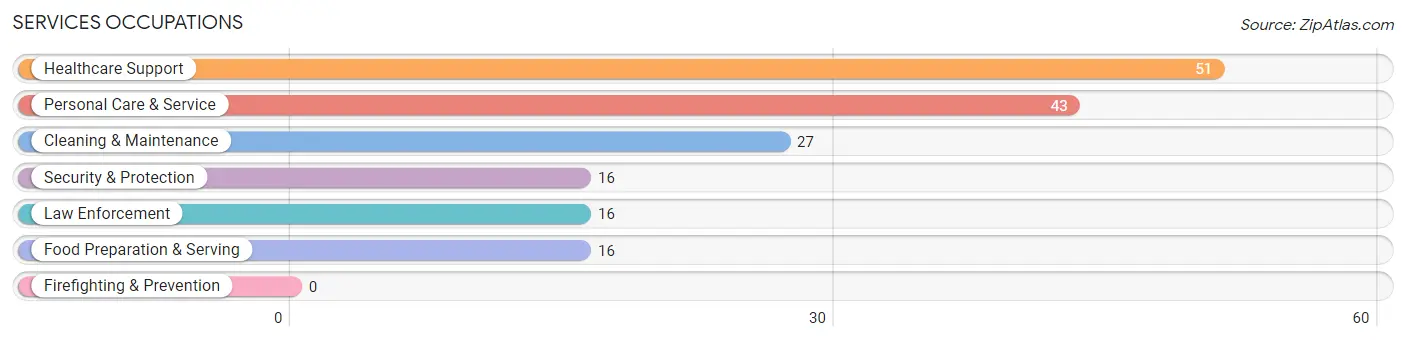
Services Occupations
The most common Services occupations in Yerington are Healthcare Support (51 | 4.8%), Personal Care & Service (43 | 4.1%), Cleaning & Maintenance (27 | 2.5%), Security & Protection (16 | 1.5%), and Law Enforcement (16 | 1.5%).
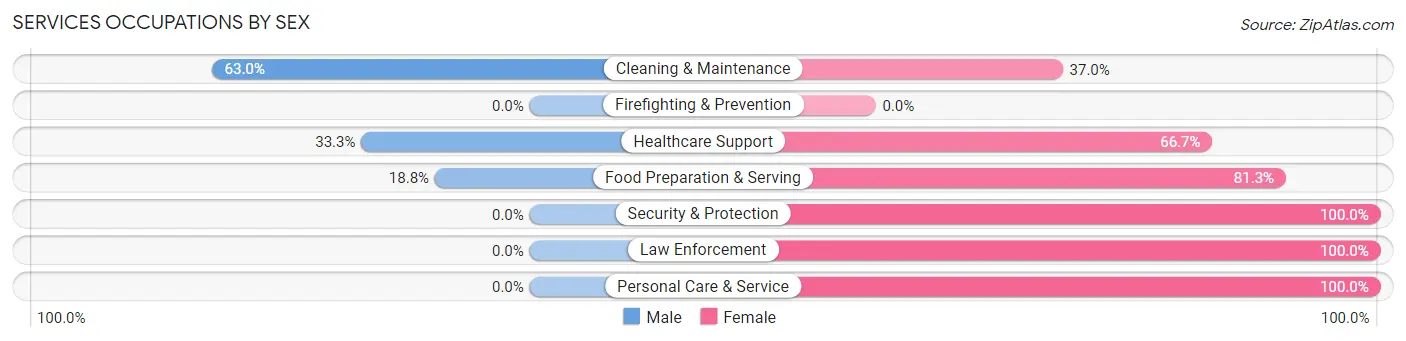
Services Occupations by Sex
Within the Services occupations in Yerington, the most male-oriented occupations are Cleaning & Maintenance (63.0%), Healthcare Support (33.3%), and Food Preparation & Serving (18.8%), while the most female-oriented occupations are Security & Protection (100.0%), Law Enforcement (100.0%), and Personal Care & Service (100.0%).
| Occupation | Male | Female |
| Healthcare Support | 17 (33.3%) | 34 (66.7%) |
| Security & Protection | 0 (0.0%) | 16 (100.0%) |
| Firefighting & Prevention | 0 (0.0%) | 0 (0.0%) |
| Law Enforcement | 0 (0.0%) | 16 (100.0%) |
| Food Preparation & Serving | 3 (18.8%) | 13 (81.2%) |
| Cleaning & Maintenance | 17 (63.0%) | 10 (37.0%) |
| Personal Care & Service | 0 (0.0%) | 43 (100.0%) |
| Total (Category) | 37 (24.2%) | 116 (75.8%) |
| Total (Overall) | 693 (65.4%) | 367 (34.6%) |
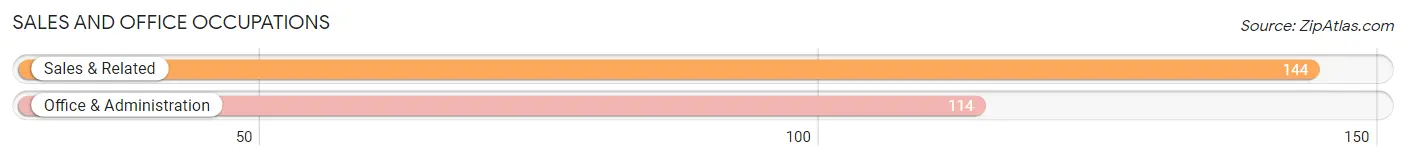
Sales and Office Occupations
The most common Sales and Office occupations in Yerington are Sales & Related (144 | 13.6%), and Office & Administration (114 | 10.7%).
Sales and Office Occupations by Sex
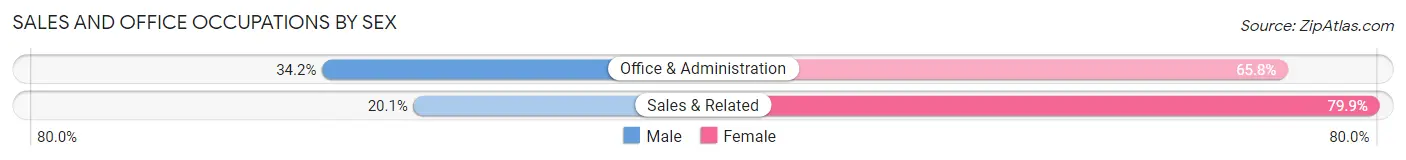
| Occupation | Male | Female |
| Sales & Related | 29 (20.1%) | 115 (79.9%) |
| Office & Administration | 39 (34.2%) | 75 (65.8%) |
| Total (Category) | 68 (26.4%) | 190 (73.6%) |
| Total (Overall) | 693 (65.4%) | 367 (34.6%) |
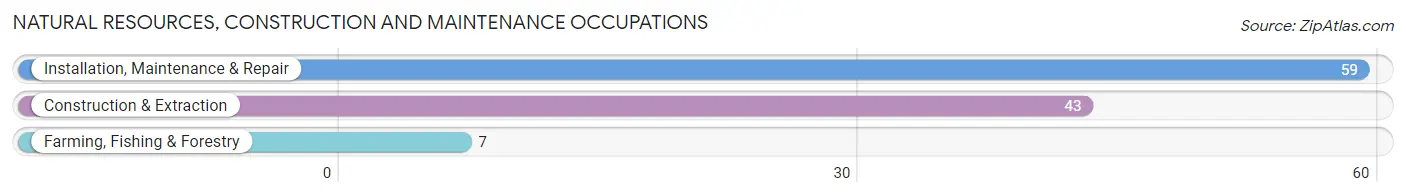
Natural Resources, Construction and Maintenance Occupations
The most common Natural Resources, Construction and Maintenance occupations in Yerington are Installation, Maintenance & Repair (59 | 5.6%), Construction & Extraction (43 | 4.1%), and Farming, Fishing & Forestry (7 | 0.7%).
Natural Resources, Construction and Maintenance Occupations by Sex
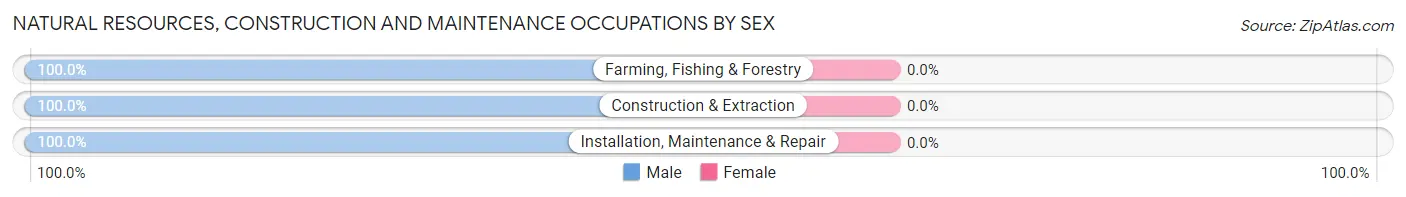
| Occupation | Male | Female |
| Farming, Fishing & Forestry | 7 (100.0%) | 0 (0.0%) |
| Construction & Extraction | 43 (100.0%) | 0 (0.0%) |
| Installation, Maintenance & Repair | 59 (100.0%) | 0 (0.0%) |
| Total (Category) | 109 (100.0%) | 0 (0.0%) |
| Total (Overall) | 693 (65.4%) | 367 (34.6%) |
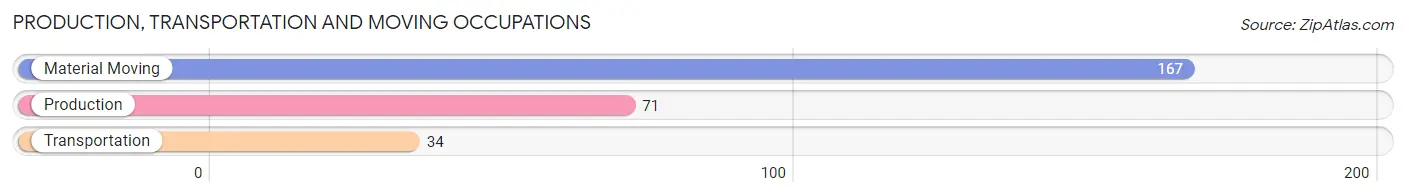
Production, Transportation and Moving Occupations
The most common Production, Transportation and Moving occupations in Yerington are Material Moving (167 | 15.8%), Production (71 | 6.7%), and Transportation (34 | 3.2%).
Production, Transportation and Moving Occupations by Sex
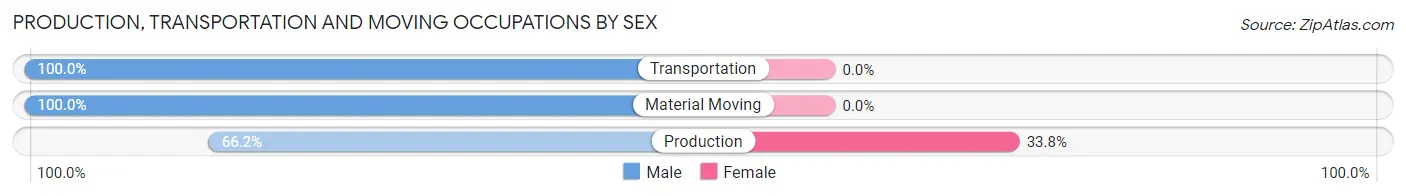
| Occupation | Male | Female |
| Production | 47 (66.2%) | 24 (33.8%) |
| Transportation | 34 (100.0%) | 0 (0.0%) |
| Material Moving | 167 (100.0%) | 0 (0.0%) |
| Total (Category) | 248 (91.2%) | 24 (8.8%) |
| Total (Overall) | 693 (65.4%) | 367 (34.6%) |
Employment Industries by Sex in Yerington
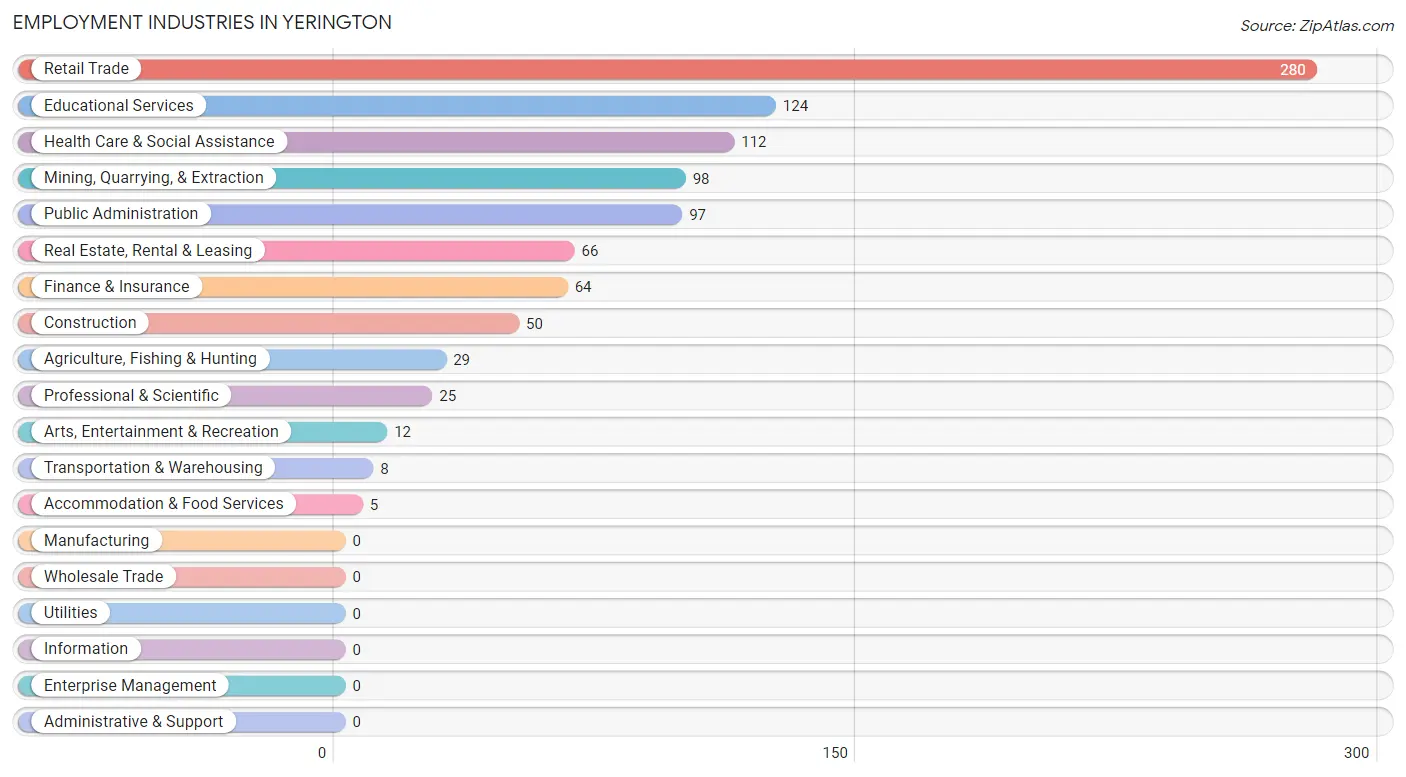
Employment Industries in Yerington
The major employment industries in Yerington include Retail Trade (280 | 26.4%), Educational Services (124 | 11.7%), Health Care & Social Assistance (112 | 10.6%), Mining, Quarrying, & Extraction (98 | 9.2%), and Public Administration (97 | 9.1%).
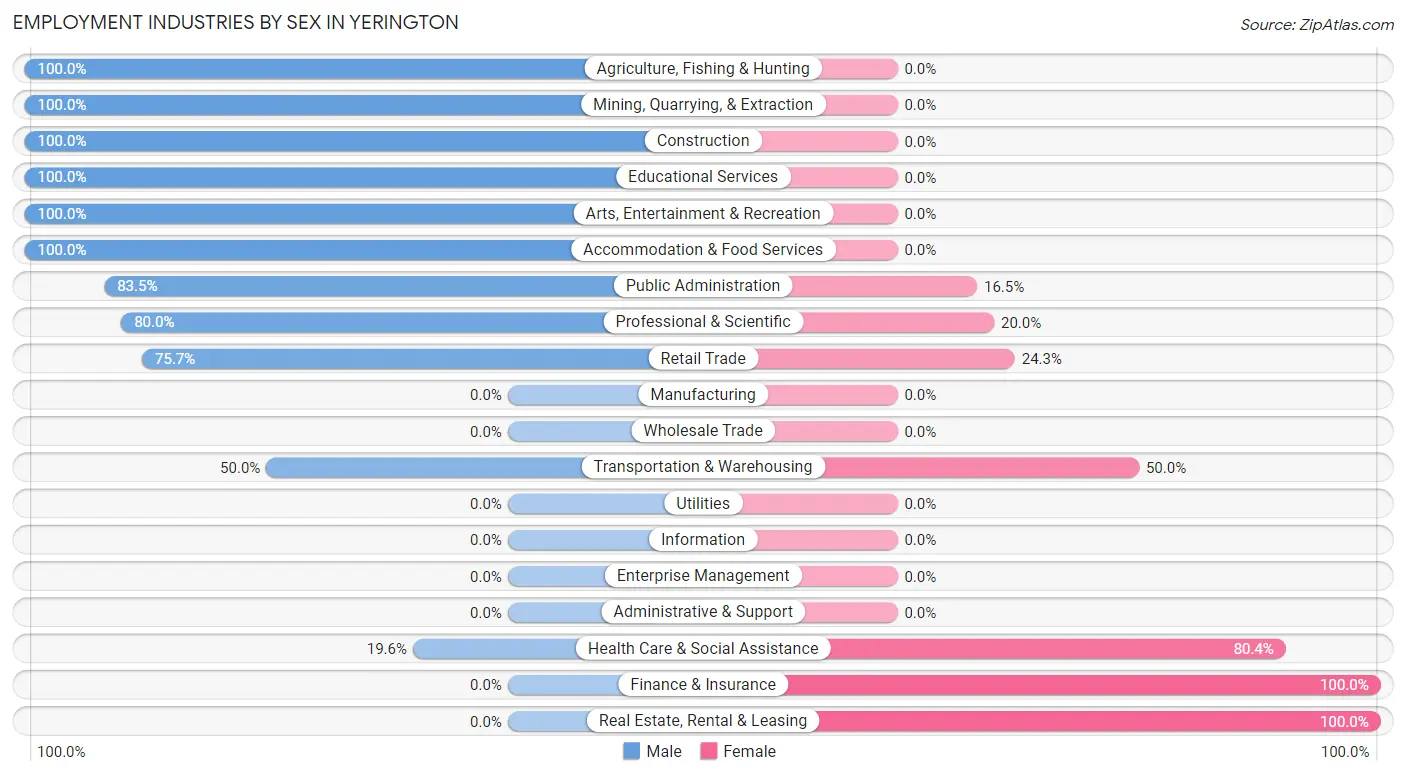
Employment Industries by Sex in Yerington
The Yerington industries that see more men than women are Agriculture, Fishing & Hunting (100.0%), Mining, Quarrying, & Extraction (100.0%), and Construction (100.0%), whereas the industries that tend to have a higher number of women are Finance & Insurance (100.0%), Real Estate, Rental & Leasing (100.0%), and Health Care & Social Assistance (80.4%).
| Industry | Male | Female |
| Agriculture, Fishing & Hunting | 29 (100.0%) | 0 (0.0%) |
| Mining, Quarrying, & Extraction | 98 (100.0%) | 0 (0.0%) |
| Construction | 50 (100.0%) | 0 (0.0%) |
| Manufacturing | 0 (0.0%) | 0 (0.0%) |
| Wholesale Trade | 0 (0.0%) | 0 (0.0%) |
| Retail Trade | 212 (75.7%) | 68 (24.3%) |
| Transportation & Warehousing | 4 (50.0%) | 4 (50.0%) |
| Utilities | 0 (0.0%) | 0 (0.0%) |
| Information | 0 (0.0%) | 0 (0.0%) |
| Finance & Insurance | 0 (0.0%) | 64 (100.0%) |
| Real Estate, Rental & Leasing | 0 (0.0%) | 66 (100.0%) |
| Professional & Scientific | 20 (80.0%) | 5 (20.0%) |
| Enterprise Management | 0 (0.0%) | 0 (0.0%) |
| Administrative & Support | 0 (0.0%) | 0 (0.0%) |
| Educational Services | 124 (100.0%) | 0 (0.0%) |
| Health Care & Social Assistance | 22 (19.6%) | 90 (80.4%) |
| Arts, Entertainment & Recreation | 12 (100.0%) | 0 (0.0%) |
| Accommodation & Food Services | 5 (100.0%) | 0 (0.0%) |
| Public Administration | 81 (83.5%) | 16 (16.5%) |
| Total | 693 (65.4%) | 367 (34.6%) |
Education in Yerington
School Enrollment in Yerington
The most common levels of schooling among the 529 students in Yerington are elementary school (250 | 47.3%), high school (177 | 33.5%), and middle school (39 | 7.4%).
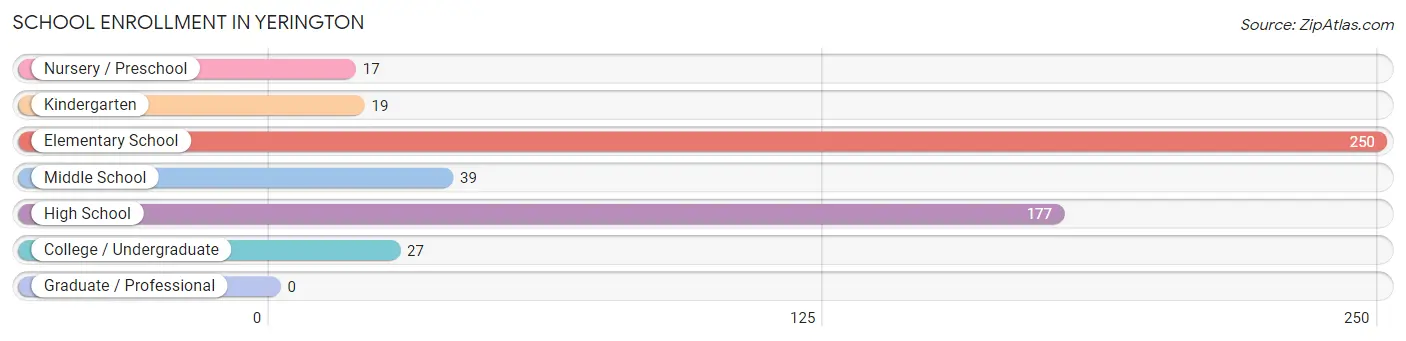
| School Level | # Students | % Students |
| Nursery / Preschool | 17 | 3.2% |
| Kindergarten | 19 | 3.6% |
| Elementary School | 250 | 47.3% |
| Middle School | 39 | 7.4% |
| High School | 177 | 33.5% |
| College / Undergraduate | 27 | 5.1% |
| Graduate / Professional | 0 | 0.0% |
| Total | 529 | 100.0% |
School Enrollment by Age by Funding Source in Yerington
Out of a total of 529 students who are enrolled in schools in Yerington, 12 (2.3%) attend a private institution, while the remaining 517 (97.7%) are enrolled in public schools. The age group of 25 to 34 year olds has the highest likelihood of being enrolled in private schools, with 6 (66.7% in the age bracket) enrolled. Conversely, the age group of 3 to 4 year olds has the lowest likelihood of being enrolled in a private school, with 1 (100.0% in the age bracket) attending a public institution.
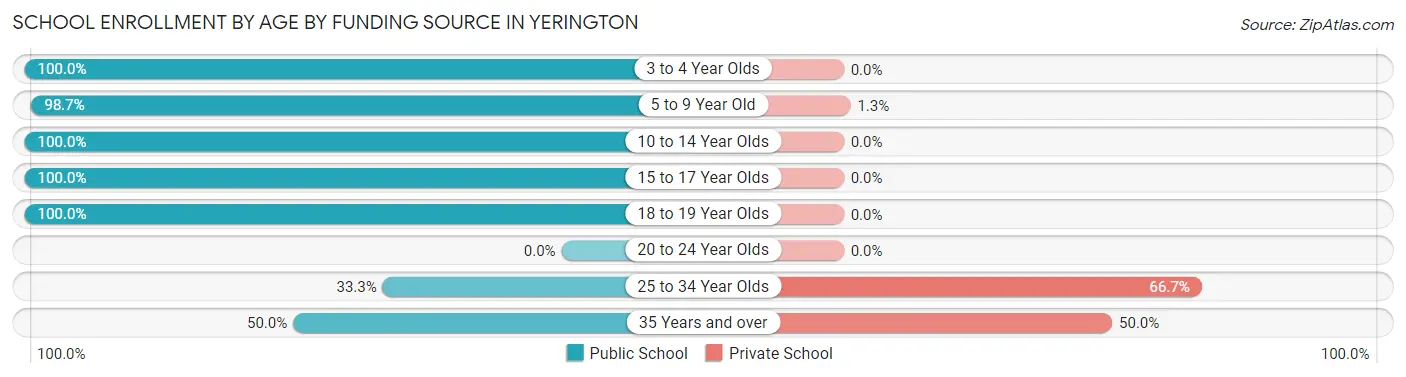
| Age Bracket | Public School | Private School |
| 3 to 4 Year Olds | 1 (100.0%) | 0 (0.0%) |
| 5 to 9 Year Old | 235 (98.7%) | 3 (1.3%) |
| 10 to 14 Year Olds | 115 (100.0%) | 0 (0.0%) |
| 15 to 17 Year Olds | 136 (100.0%) | 0 (0.0%) |
| 18 to 19 Year Olds | 24 (100.0%) | 0 (0.0%) |
| 20 to 24 Year Olds | 0 (0.0%) | 0 (0.0%) |
| 25 to 34 Year Olds | 3 (33.3%) | 6 (66.7%) |
| 35 Years and over | 3 (50.0%) | 3 (50.0%) |
| Total | 517 (97.7%) | 12 (2.3%) |
Educational Attainment by Field of Study in Yerington
Bio, nature & agricultural (107 | 27.8%), arts & humanities (68 | 17.7%), business (59 | 15.3%), education (54 | 14.0%), and engineering (42 | 10.9%) are the most common fields of study among 385 individuals in Yerington who have obtained a bachelor's degree or higher.
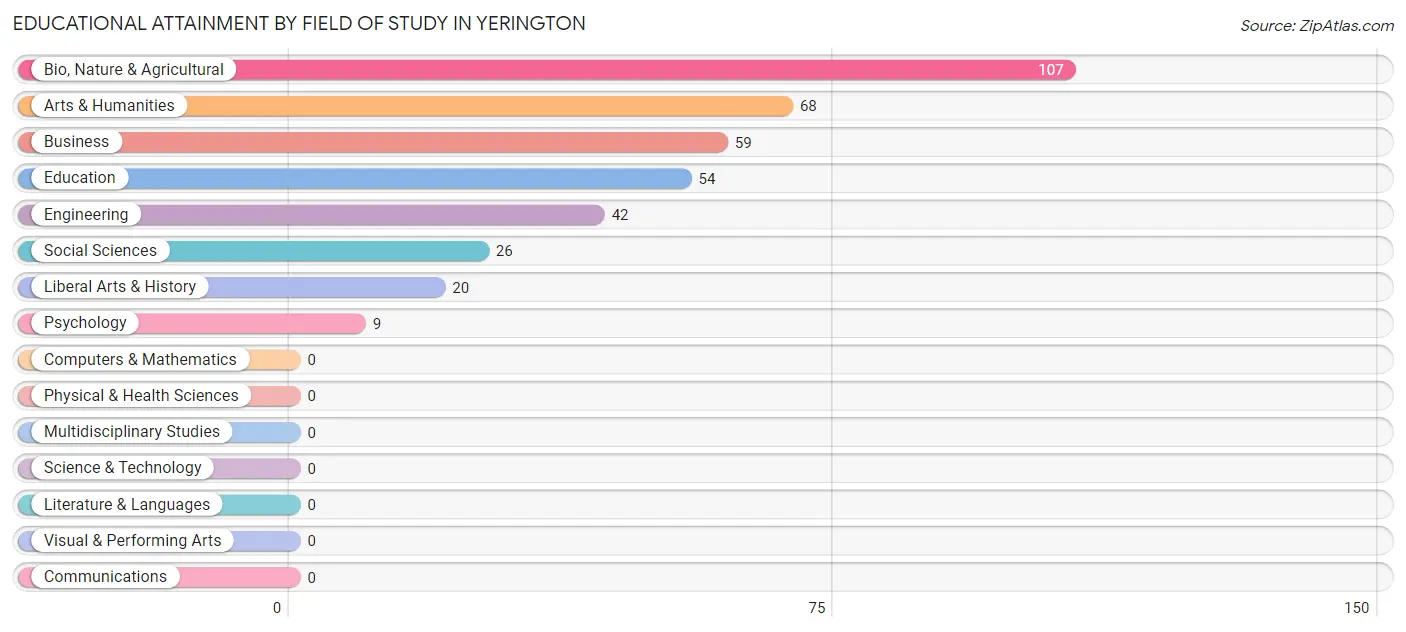
| Field of Study | # Graduates | % Graduates |
| Computers & Mathematics | 0 | 0.0% |
| Bio, Nature & Agricultural | 107 | 27.8% |
| Physical & Health Sciences | 0 | 0.0% |
| Psychology | 9 | 2.3% |
| Social Sciences | 26 | 6.8% |
| Engineering | 42 | 10.9% |
| Multidisciplinary Studies | 0 | 0.0% |
| Science & Technology | 0 | 0.0% |
| Business | 59 | 15.3% |
| Education | 54 | 14.0% |
| Literature & Languages | 0 | 0.0% |
| Liberal Arts & History | 20 | 5.2% |
| Visual & Performing Arts | 0 | 0.0% |
| Communications | 0 | 0.0% |
| Arts & Humanities | 68 | 17.7% |
| Total | 385 | 100.0% |
Transportation & Commute in Yerington
Vehicle Availability by Sex in Yerington
The most prevalent vehicle ownership categories in Yerington are males with 1 vehicle (358, accounting for 51.7%) and females with 1 vehicle (84, making up 99.7%).
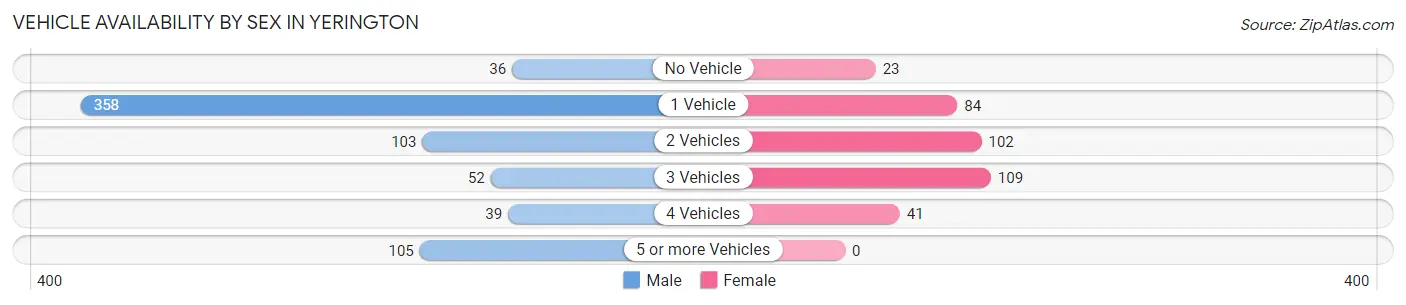
| Vehicles Available | Male | Female |
| No Vehicle | 36 (5.2%) | 23 (6.4%) |
| 1 Vehicle | 358 (51.7%) | 84 (23.4%) |
| 2 Vehicles | 103 (14.9%) | 102 (28.4%) |
| 3 Vehicles | 52 (7.5%) | 109 (30.4%) |
| 4 Vehicles | 39 (5.6%) | 41 (11.4%) |
| 5 or more Vehicles | 105 (15.1%) | 0 (0.0%) |
| Total | 693 (100.0%) | 359 (100.0%) |
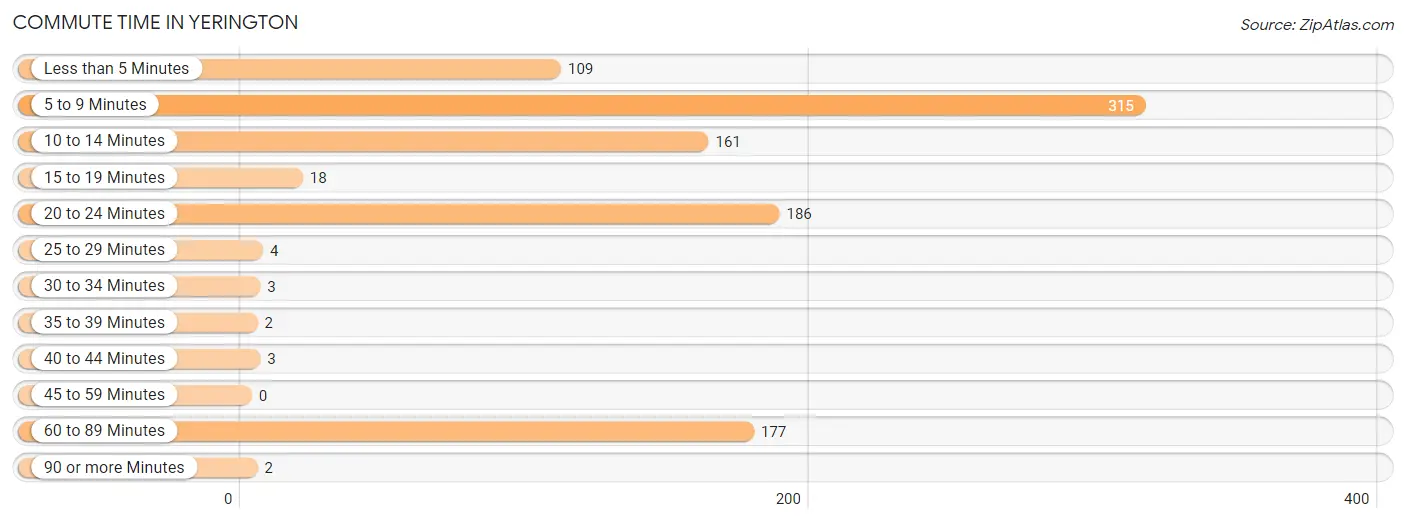
Commute Time in Yerington
The most frequently occuring commute durations in Yerington are 5 to 9 minutes (315 commuters, 32.1%), 20 to 24 minutes (186 commuters, 19.0%), and 60 to 89 minutes (177 commuters, 18.1%).
| Commute Time | # Commuters | % Commuters |
| Less than 5 Minutes | 109 | 11.1% |
| 5 to 9 Minutes | 315 | 32.1% |
| 10 to 14 Minutes | 161 | 16.4% |
| 15 to 19 Minutes | 18 | 1.8% |
| 20 to 24 Minutes | 186 | 19.0% |
| 25 to 29 Minutes | 4 | 0.4% |
| 30 to 34 Minutes | 3 | 0.3% |
| 35 to 39 Minutes | 2 | 0.2% |
| 40 to 44 Minutes | 3 | 0.3% |
| 45 to 59 Minutes | 0 | 0.0% |
| 60 to 89 Minutes | 177 | 18.1% |
| 90 or more Minutes | 2 | 0.2% |
Commute Time by Sex in Yerington
The most common commute times in Yerington are 20 to 24 minutes (186 commuters, 27.6%) for males and 5 to 9 minutes (150 commuters, 49.2%) for females.
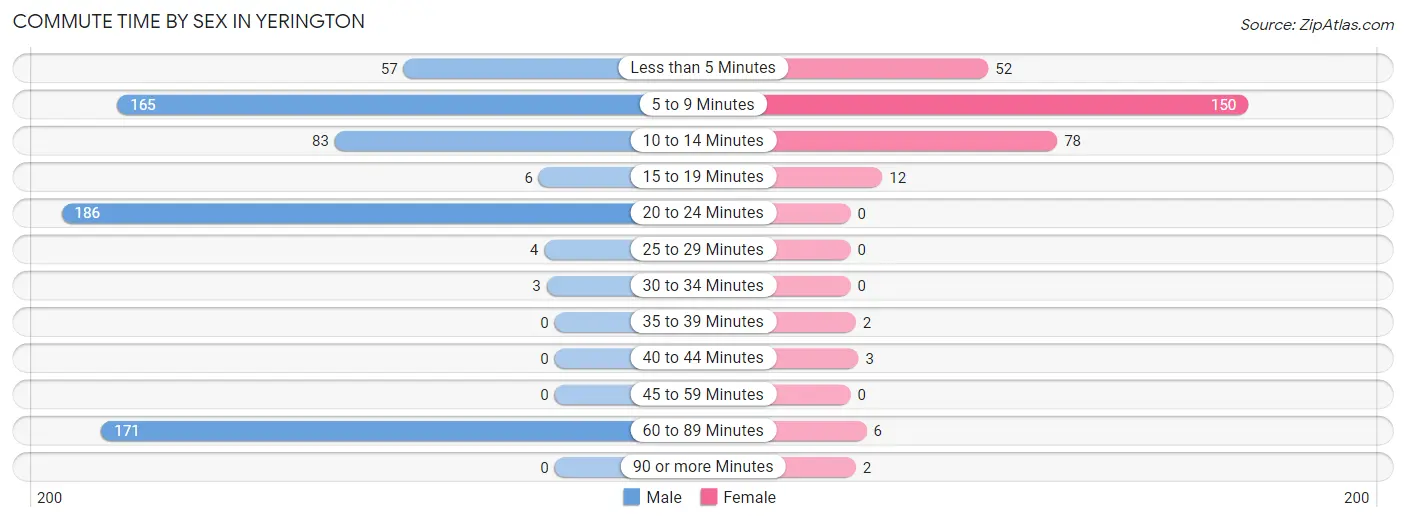
| Commute Time | Male | Female |
| Less than 5 Minutes | 57 (8.4%) | 52 (17.1%) |
| 5 to 9 Minutes | 165 (24.4%) | 150 (49.2%) |
| 10 to 14 Minutes | 83 (12.3%) | 78 (25.6%) |
| 15 to 19 Minutes | 6 (0.9%) | 12 (3.9%) |
| 20 to 24 Minutes | 186 (27.6%) | 0 (0.0%) |
| 25 to 29 Minutes | 4 (0.6%) | 0 (0.0%) |
| 30 to 34 Minutes | 3 (0.4%) | 0 (0.0%) |
| 35 to 39 Minutes | 0 (0.0%) | 2 (0.7%) |
| 40 to 44 Minutes | 0 (0.0%) | 3 (1.0%) |
| 45 to 59 Minutes | 0 (0.0%) | 0 (0.0%) |
| 60 to 89 Minutes | 171 (25.3%) | 6 (2.0%) |
| 90 or more Minutes | 0 (0.0%) | 2 (0.7%) |
Time of Departure to Work by Sex in Yerington
The most frequent times of departure to work in Yerington are 4:00 PM to 11:59 PM (179, 26.5%) for males and 9:00 AM to 9:59 AM (89, 29.2%) for females.
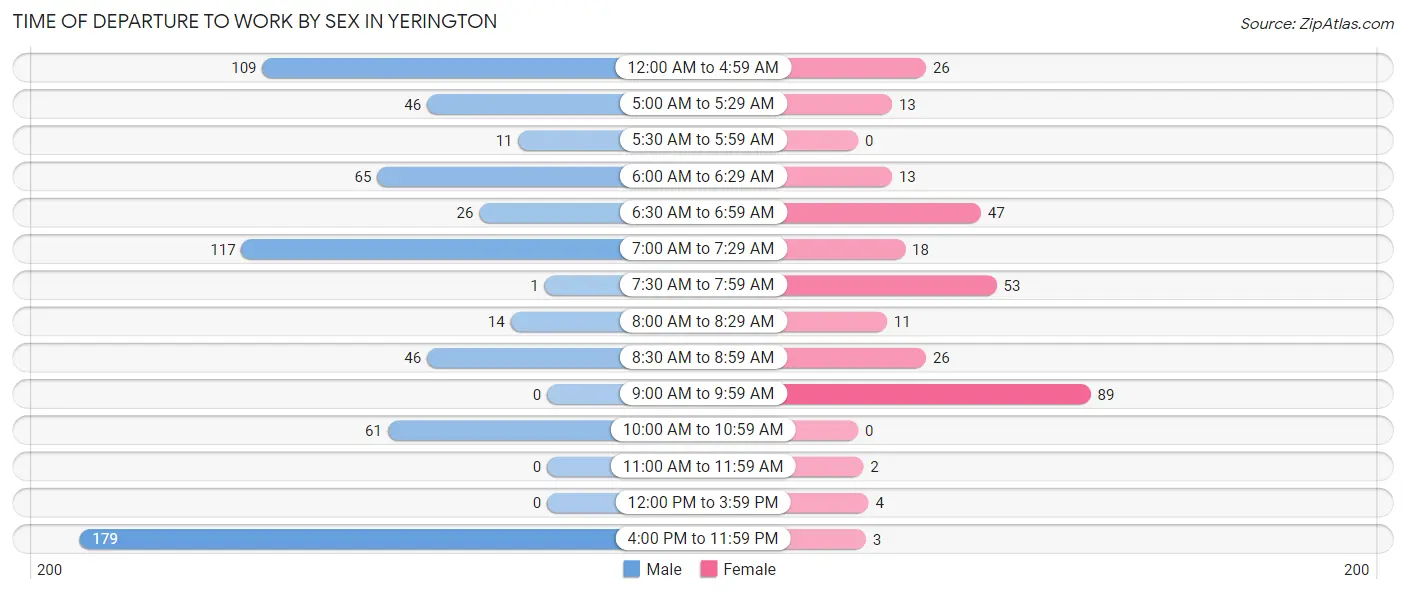
| Time of Departure | Male | Female |
| 12:00 AM to 4:59 AM | 109 (16.2%) | 26 (8.5%) |
| 5:00 AM to 5:29 AM | 46 (6.8%) | 13 (4.3%) |
| 5:30 AM to 5:59 AM | 11 (1.6%) | 0 (0.0%) |
| 6:00 AM to 6:29 AM | 65 (9.6%) | 13 (4.3%) |
| 6:30 AM to 6:59 AM | 26 (3.8%) | 47 (15.4%) |
| 7:00 AM to 7:29 AM | 117 (17.3%) | 18 (5.9%) |
| 7:30 AM to 7:59 AM | 1 (0.2%) | 53 (17.4%) |
| 8:00 AM to 8:29 AM | 14 (2.1%) | 11 (3.6%) |
| 8:30 AM to 8:59 AM | 46 (6.8%) | 26 (8.5%) |
| 9:00 AM to 9:59 AM | 0 (0.0%) | 89 (29.2%) |
| 10:00 AM to 10:59 AM | 61 (9.0%) | 0 (0.0%) |
| 11:00 AM to 11:59 AM | 0 (0.0%) | 2 (0.7%) |
| 12:00 PM to 3:59 PM | 0 (0.0%) | 4 (1.3%) |
| 4:00 PM to 11:59 PM | 179 (26.5%) | 3 (1.0%) |
| Total | 675 (100.0%) | 305 (100.0%) |
Housing Occupancy in Yerington
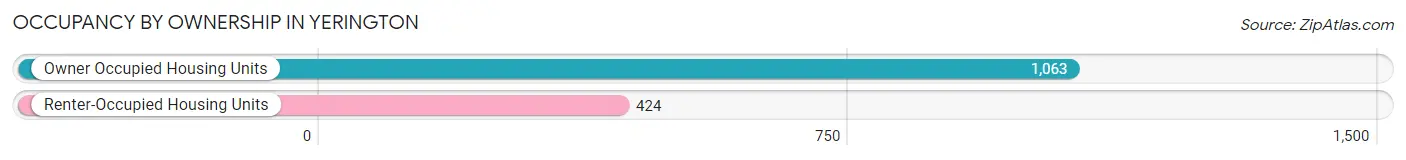
Occupancy by Ownership in Yerington
Of the total 1,487 dwellings in Yerington, owner-occupied units account for 1,063 (71.5%), while renter-occupied units make up 424 (28.5%).
| Occupancy | # Housing Units | % Housing Units |
| Owner Occupied Housing Units | 1,063 | 71.5% |
| Renter-Occupied Housing Units | 424 | 28.5% |
| Total Occupied Housing Units | 1,487 | 100.0% |
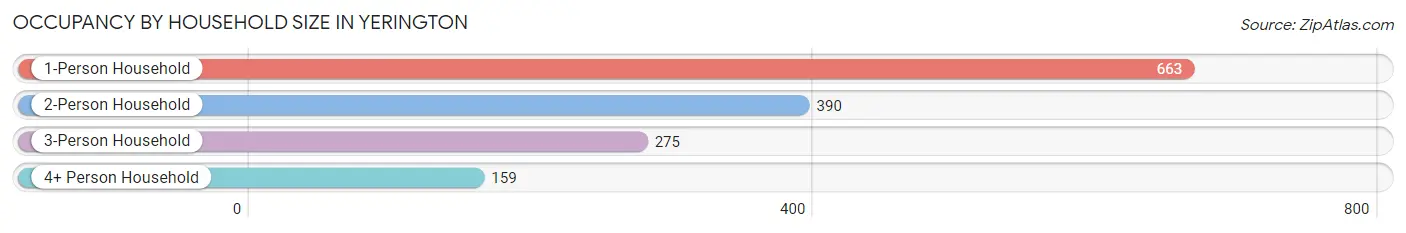
Occupancy by Household Size in Yerington
| Household Size | # Housing Units | % Housing Units |
| 1-Person Household | 663 | 44.6% |
| 2-Person Household | 390 | 26.2% |
| 3-Person Household | 275 | 18.5% |
| 4+ Person Household | 159 | 10.7% |
| Total Housing Units | 1,487 | 100.0% |
Occupancy by Ownership by Household Size in Yerington
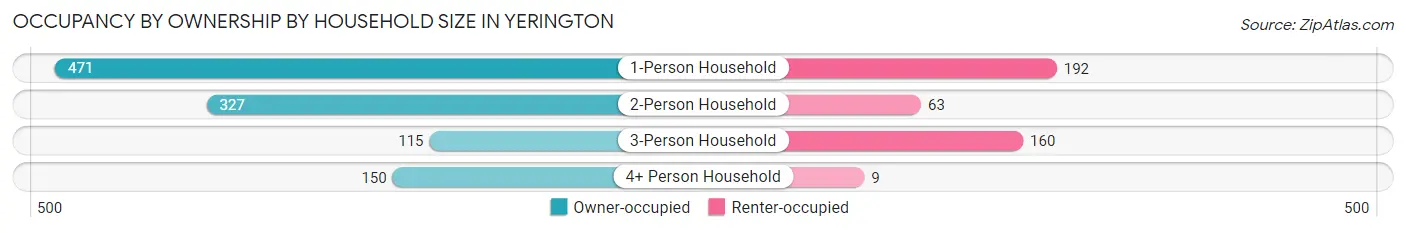
| Household Size | Owner-occupied | Renter-occupied |
| 1-Person Household | 471 (71.0%) | 192 (29.0%) |
| 2-Person Household | 327 (83.9%) | 63 (16.2%) |
| 3-Person Household | 115 (41.8%) | 160 (58.2%) |
| 4+ Person Household | 150 (94.3%) | 9 (5.7%) |
| Total Housing Units | 1,063 (71.5%) | 424 (28.5%) |
Occupancy by Educational Attainment in Yerington
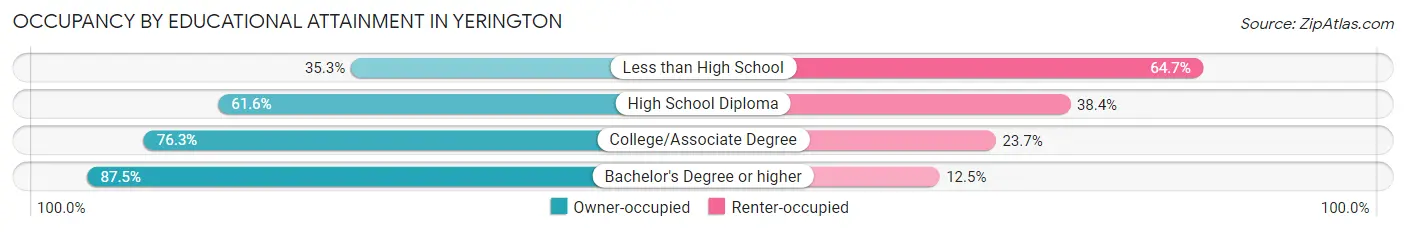
| Household Size | Owner-occupied | Renter-occupied |
| Less than High School | 42 (35.3%) | 77 (64.7%) |
| High School Diploma | 250 (61.6%) | 156 (38.4%) |
| College/Associate Degree | 484 (76.3%) | 150 (23.7%) |
| Bachelor's Degree or higher | 287 (87.5%) | 41 (12.5%) |
Occupancy by Age of Householder in Yerington
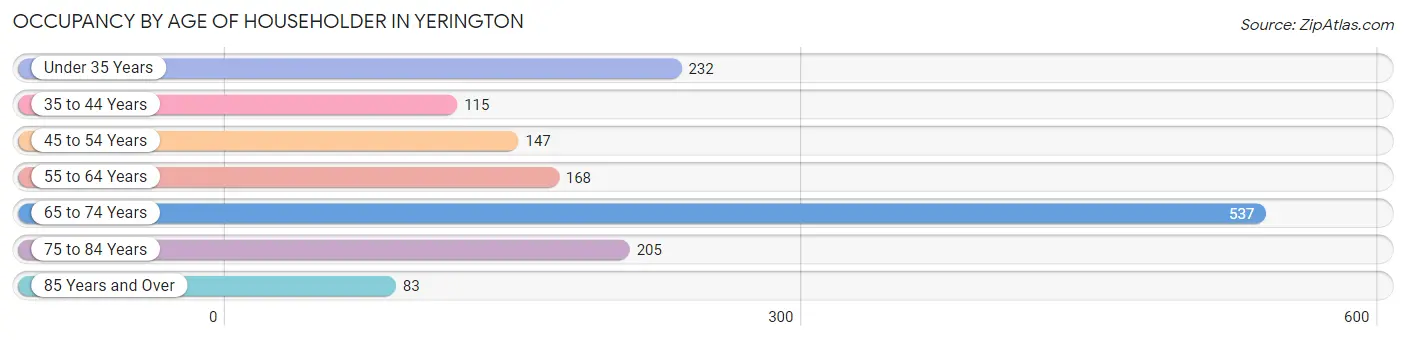
| Age Bracket | # Households | % Households |
| Under 35 Years | 232 | 15.6% |
| 35 to 44 Years | 115 | 7.7% |
| 45 to 54 Years | 147 | 9.9% |
| 55 to 64 Years | 168 | 11.3% |
| 65 to 74 Years | 537 | 36.1% |
| 75 to 84 Years | 205 | 13.8% |
| 85 Years and Over | 83 | 5.6% |
| Total | 1,487 | 100.0% |
Housing Finances in Yerington
Median Income by Occupancy in Yerington
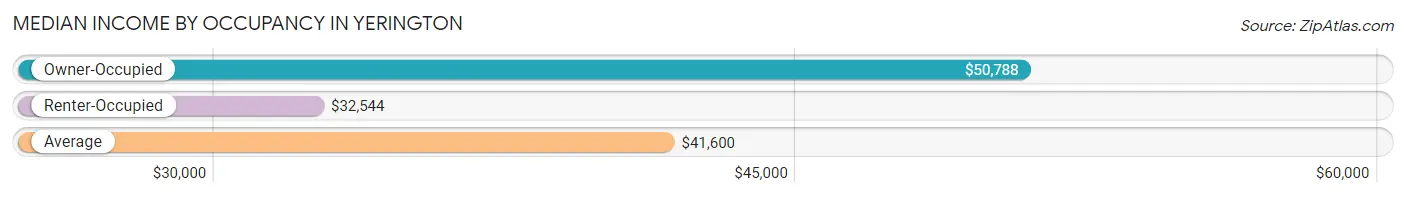
| Occupancy Type | # Households | Median Income |
| Owner-Occupied | 1,063 (71.5%) | $50,788 |
| Renter-Occupied | 424 (28.5%) | $32,544 |
| Average | 1,487 (100.0%) | $41,600 |
Occupancy by Householder Income Bracket in Yerington
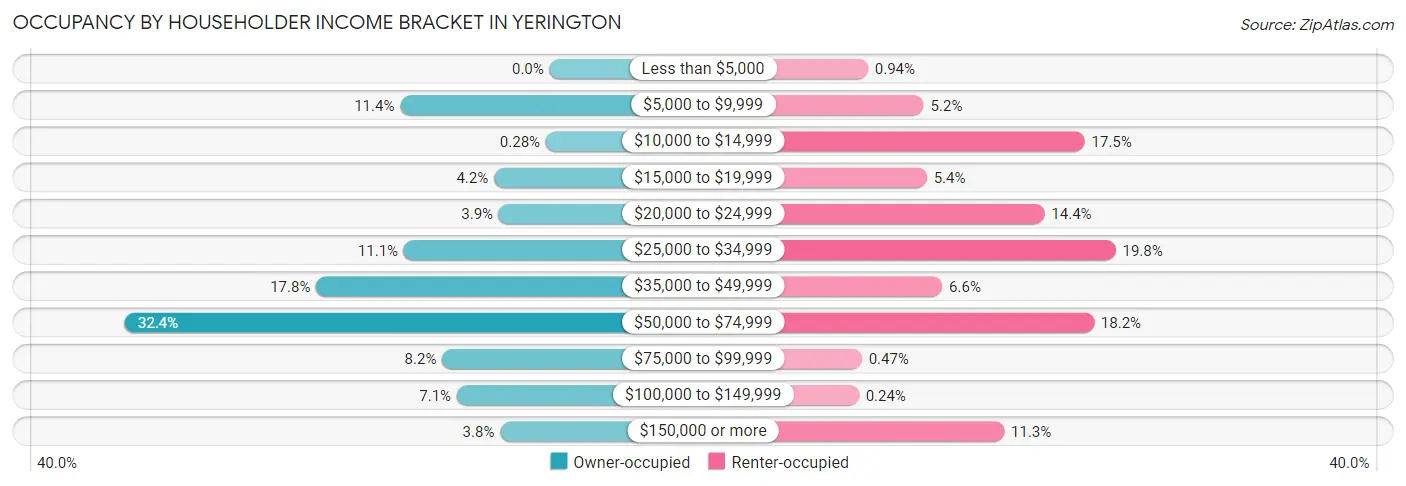
| Income Bracket | Owner-occupied | Renter-occupied |
| Less than $5,000 | 0 (0.0%) | 4 (0.9%) |
| $5,000 to $9,999 | 121 (11.4%) | 22 (5.2%) |
| $10,000 to $14,999 | 3 (0.3%) | 74 (17.4%) |
| $15,000 to $19,999 | 45 (4.2%) | 23 (5.4%) |
| $20,000 to $24,999 | 41 (3.9%) | 61 (14.4%) |
| $25,000 to $34,999 | 118 (11.1%) | 84 (19.8%) |
| $35,000 to $49,999 | 189 (17.8%) | 28 (6.6%) |
| $50,000 to $74,999 | 344 (32.4%) | 77 (18.2%) |
| $75,000 to $99,999 | 87 (8.2%) | 2 (0.5%) |
| $100,000 to $149,999 | 75 (7.1%) | 1 (0.2%) |
| $150,000 or more | 40 (3.8%) | 48 (11.3%) |
| Total | 1,063 (100.0%) | 424 (100.0%) |
Monthly Housing Cost Tiers in Yerington
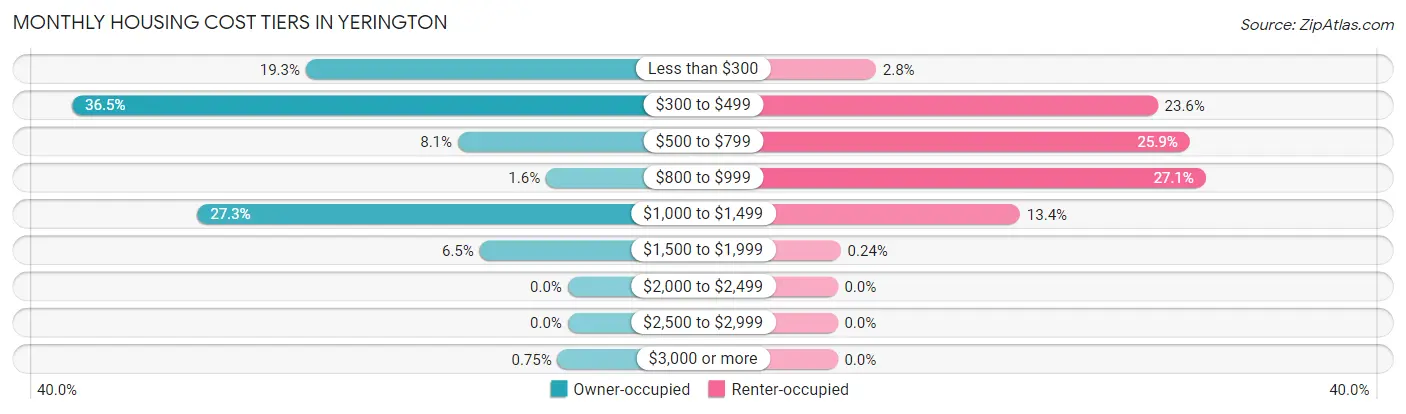
| Monthly Cost | Owner-occupied | Renter-occupied |
| Less than $300 | 205 (19.3%) | 12 (2.8%) |
| $300 to $499 | 388 (36.5%) | 100 (23.6%) |
| $500 to $799 | 86 (8.1%) | 110 (25.9%) |
| $800 to $999 | 17 (1.6%) | 115 (27.1%) |
| $1,000 to $1,499 | 290 (27.3%) | 57 (13.4%) |
| $1,500 to $1,999 | 69 (6.5%) | 1 (0.2%) |
| $2,000 to $2,499 | 0 (0.0%) | 0 (0.0%) |
| $2,500 to $2,999 | 0 (0.0%) | 0 (0.0%) |
| $3,000 or more | 8 (0.7%) | 0 (0.0%) |
| Total | 1,063 (100.0%) | 424 (100.0%) |
Physical Housing Characteristics in Yerington
Housing Structures in Yerington
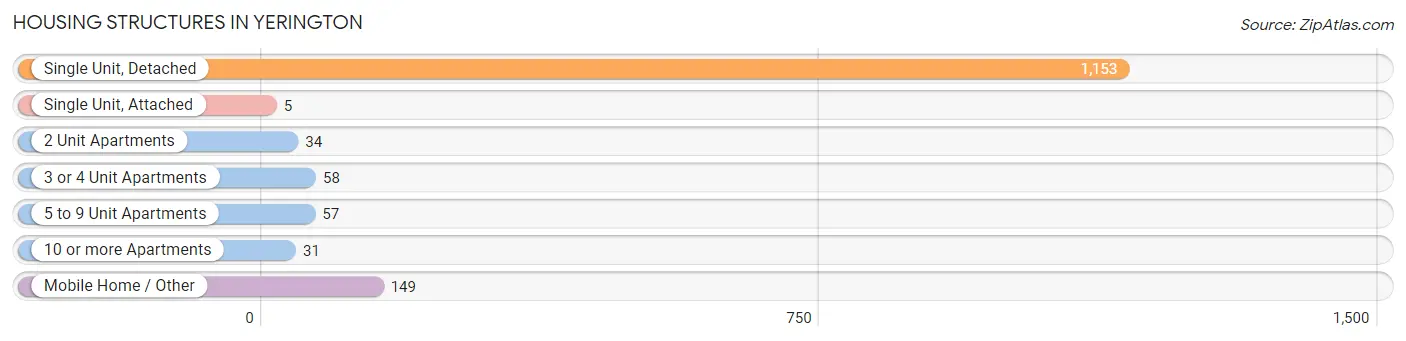
| Structure Type | # Housing Units | % Housing Units |
| Single Unit, Detached | 1,153 | 77.5% |
| Single Unit, Attached | 5 | 0.3% |
| 2 Unit Apartments | 34 | 2.3% |
| 3 or 4 Unit Apartments | 58 | 3.9% |
| 5 to 9 Unit Apartments | 57 | 3.8% |
| 10 or more Apartments | 31 | 2.1% |
| Mobile Home / Other | 149 | 10.0% |
| Total | 1,487 | 100.0% |
Housing Structures by Occupancy in Yerington
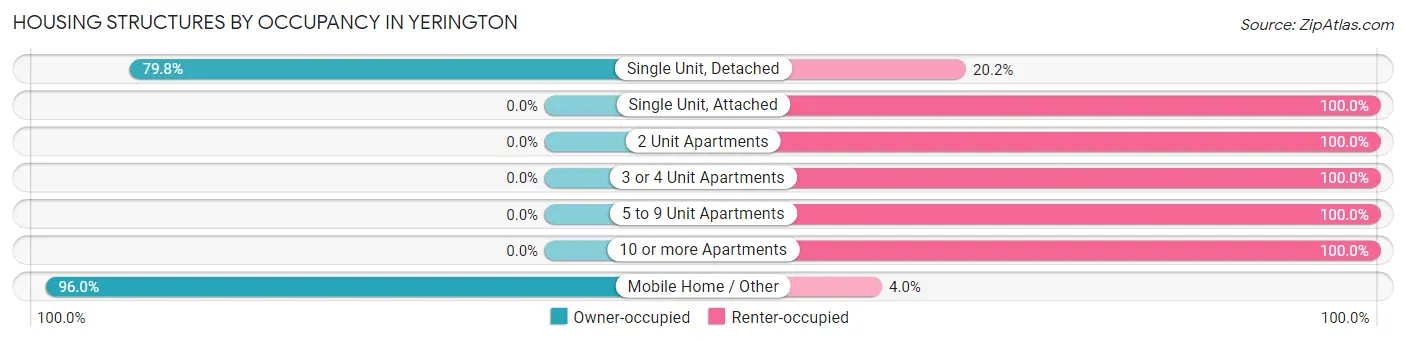
| Structure Type | Owner-occupied | Renter-occupied |
| Single Unit, Detached | 920 (79.8%) | 233 (20.2%) |
| Single Unit, Attached | 0 (0.0%) | 5 (100.0%) |
| 2 Unit Apartments | 0 (0.0%) | 34 (100.0%) |
| 3 or 4 Unit Apartments | 0 (0.0%) | 58 (100.0%) |
| 5 to 9 Unit Apartments | 0 (0.0%) | 57 (100.0%) |
| 10 or more Apartments | 0 (0.0%) | 31 (100.0%) |
| Mobile Home / Other | 143 (96.0%) | 6 (4.0%) |
| Total | 1,063 (71.5%) | 424 (28.5%) |
Housing Structures by Number of Rooms in Yerington
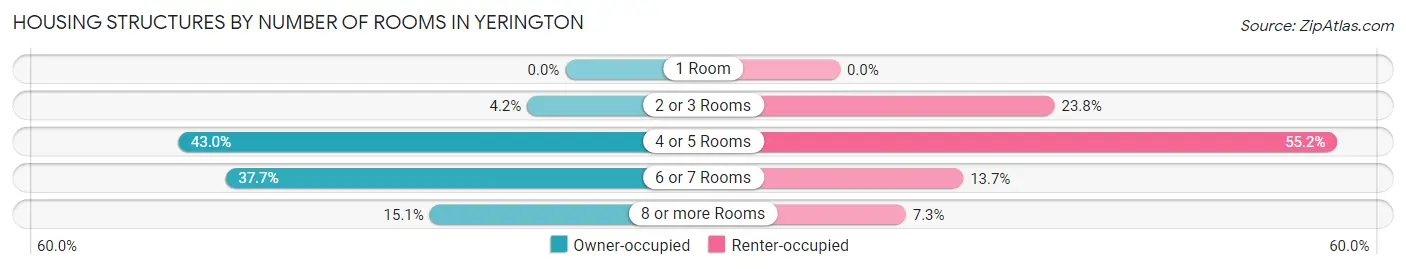
| Number of Rooms | Owner-occupied | Renter-occupied |
| 1 Room | 0 (0.0%) | 0 (0.0%) |
| 2 or 3 Rooms | 45 (4.2%) | 101 (23.8%) |
| 4 or 5 Rooms | 457 (43.0%) | 234 (55.2%) |
| 6 or 7 Rooms | 401 (37.7%) | 58 (13.7%) |
| 8 or more Rooms | 160 (15.0%) | 31 (7.3%) |
| Total | 1,063 (100.0%) | 424 (100.0%) |
Housing Structure by Heating Type in Yerington
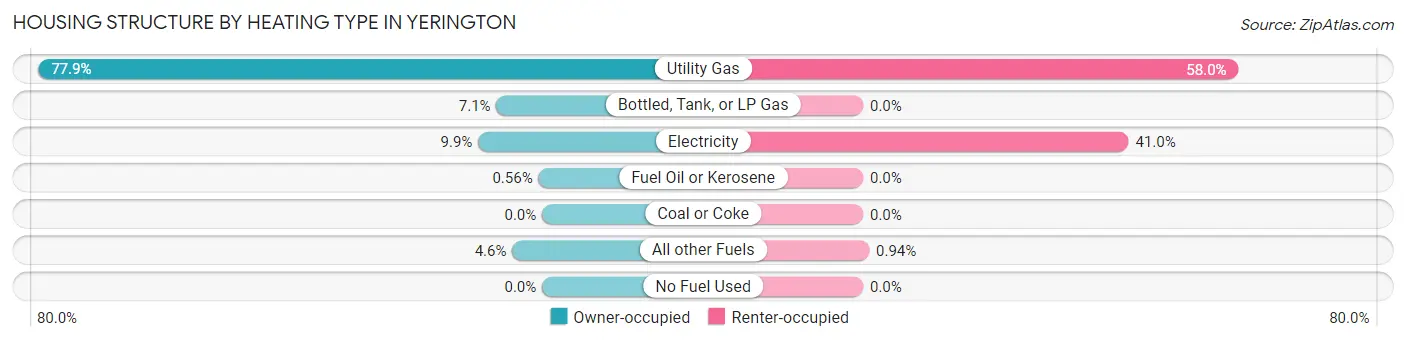
| Heating Type | Owner-occupied | Renter-occupied |
| Utility Gas | 828 (77.9%) | 246 (58.0%) |
| Bottled, Tank, or LP Gas | 75 (7.1%) | 0 (0.0%) |
| Electricity | 105 (9.9%) | 174 (41.0%) |
| Fuel Oil or Kerosene | 6 (0.6%) | 0 (0.0%) |
| Coal or Coke | 0 (0.0%) | 0 (0.0%) |
| All other Fuels | 49 (4.6%) | 4 (0.9%) |
| No Fuel Used | 0 (0.0%) | 0 (0.0%) |
| Total | 1,063 (100.0%) | 424 (100.0%) |
Household Vehicle Usage in Yerington
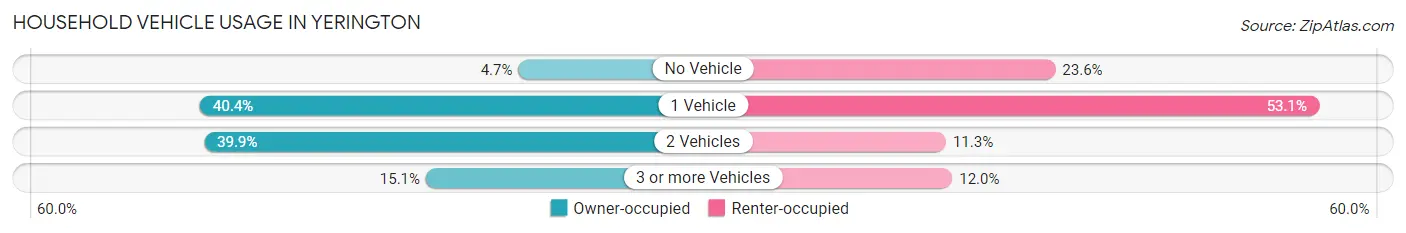
| Vehicles per Household | Owner-occupied | Renter-occupied |
| No Vehicle | 50 (4.7%) | 100 (23.6%) |
| 1 Vehicle | 429 (40.4%) | 225 (53.1%) |
| 2 Vehicles | 424 (39.9%) | 48 (11.3%) |
| 3 or more Vehicles | 160 (15.0%) | 51 (12.0%) |
| Total | 1,063 (100.0%) | 424 (100.0%) |
Real Estate & Mortgages in Yerington
Real Estate and Mortgage Overview in Yerington
| Characteristic | Without Mortgage | With Mortgage |
| Housing Units | 654 | 409 |
| Median Property Value | $137,500 | $269,900 |
| Median Household Income | $41,344 | $0 |
| Monthly Housing Costs | $337 | $8 |
| Real Estate Taxes | $728 | $3 |
Property Value by Mortgage Status in Yerington
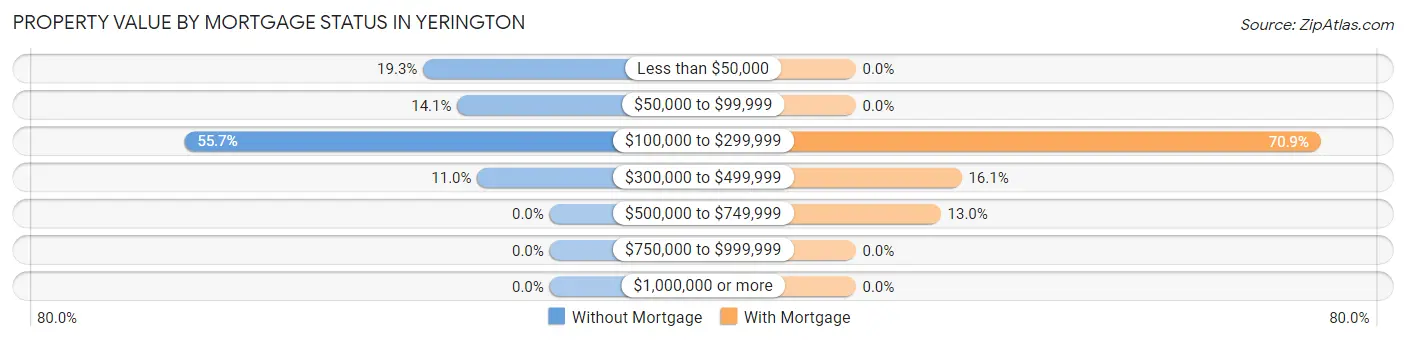
| Property Value | Without Mortgage | With Mortgage |
| Less than $50,000 | 126 (19.3%) | 0 (0.0%) |
| $50,000 to $99,999 | 92 (14.1%) | 0 (0.0%) |
| $100,000 to $299,999 | 364 (55.7%) | 290 (70.9%) |
| $300,000 to $499,999 | 72 (11.0%) | 66 (16.1%) |
| $500,000 to $749,999 | 0 (0.0%) | 53 (13.0%) |
| $750,000 to $999,999 | 0 (0.0%) | 0 (0.0%) |
| $1,000,000 or more | 0 (0.0%) | 0 (0.0%) |
| Total | 654 (100.0%) | 409 (100.0%) |
Household Income by Mortgage Status in Yerington
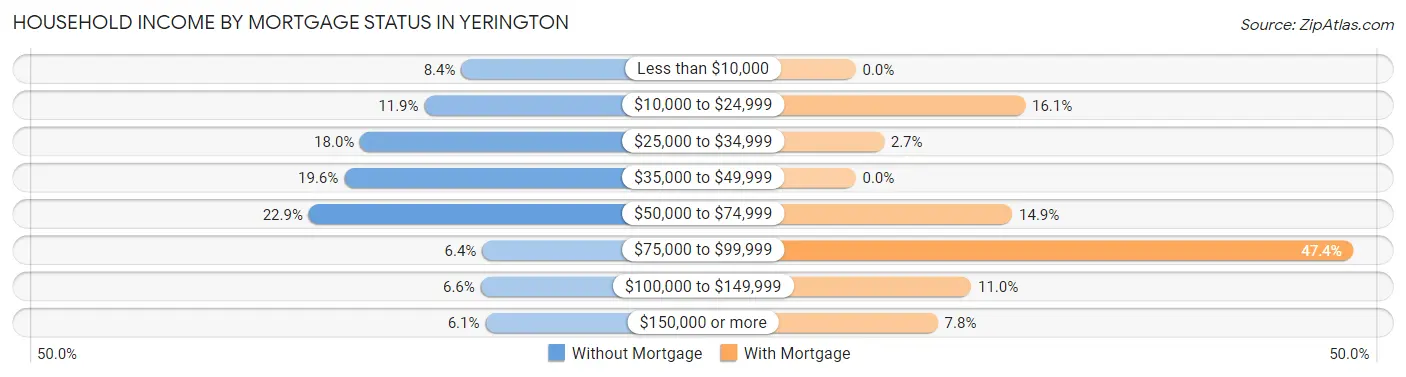
| Household Income | Without Mortgage | With Mortgage |
| Less than $10,000 | 55 (8.4%) | 0 (0.0%) |
| $10,000 to $24,999 | 78 (11.9%) | 66 (16.1%) |
| $25,000 to $34,999 | 118 (18.0%) | 11 (2.7%) |
| $35,000 to $49,999 | 128 (19.6%) | 0 (0.0%) |
| $50,000 to $74,999 | 150 (22.9%) | 61 (14.9%) |
| $75,000 to $99,999 | 42 (6.4%) | 194 (47.4%) |
| $100,000 to $149,999 | 43 (6.6%) | 45 (11.0%) |
| $150,000 or more | 40 (6.1%) | 32 (7.8%) |
| Total | 654 (100.0%) | 409 (100.0%) |
Property Value to Household Income Ratio in Yerington
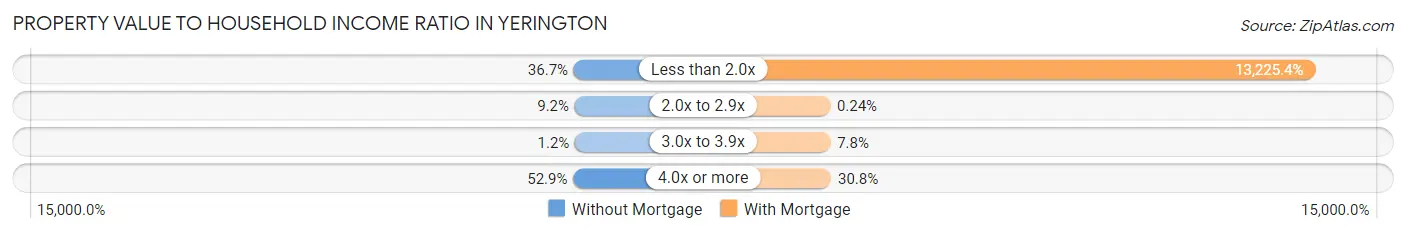
| Value-to-Income Ratio | Without Mortgage | With Mortgage |
| Less than 2.0x | 240 (36.7%) | 54,092 (13,225.4%) |
| 2.0x to 2.9x | 60 (9.2%) | 1 (0.2%) |
| 3.0x to 3.9x | 8 (1.2%) | 32 (7.8%) |
| 4.0x or more | 346 (52.9%) | 126 (30.8%) |
| Total | 654 (100.0%) | 409 (100.0%) |
Real Estate Taxes by Mortgage Status in Yerington
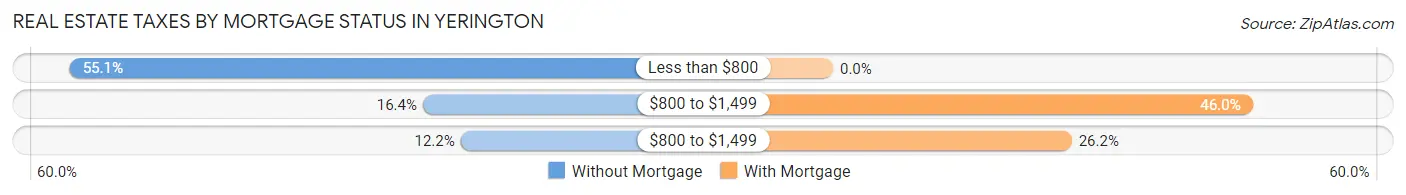
| Property Taxes | Without Mortgage | With Mortgage |
| Less than $800 | 360 (55.0%) | 0 (0.0%) |
| $800 to $1,499 | 107 (16.4%) | 188 (46.0%) |
| $800 to $1,499 | 80 (12.2%) | 107 (26.2%) |
| Total | 654 (100.0%) | 409 (100.0%) |
Health & Disability in Yerington
Health Insurance Coverage by Age in Yerington
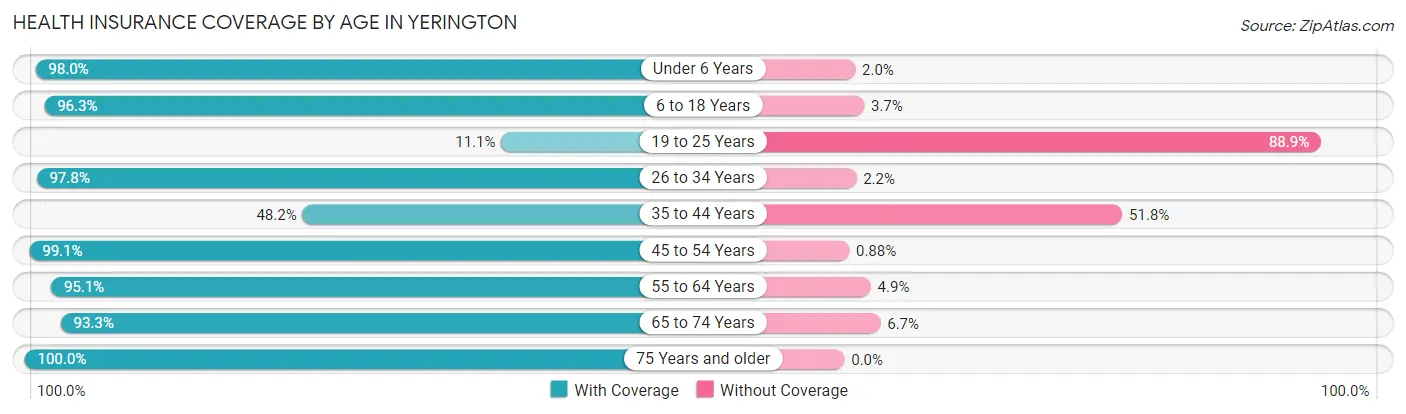
| Age Bracket | With Coverage | Without Coverage |
| Under 6 Years | 97 (98.0%) | 2 (2.0%) |
| 6 to 18 Years | 472 (96.3%) | 18 (3.7%) |
| 19 to 25 Years | 23 (11.1%) | 184 (88.9%) |
| 26 to 34 Years | 220 (97.8%) | 5 (2.2%) |
| 35 to 44 Years | 106 (48.2%) | 114 (51.8%) |
| 45 to 54 Years | 225 (99.1%) | 2 (0.9%) |
| 55 to 64 Years | 309 (95.1%) | 16 (4.9%) |
| 65 to 74 Years | 737 (93.3%) | 53 (6.7%) |
| 75 Years and older | 419 (100.0%) | 0 (0.0%) |
| Total | 2,608 (86.9%) | 394 (13.1%) |
Health Insurance Coverage by Citizenship Status in Yerington
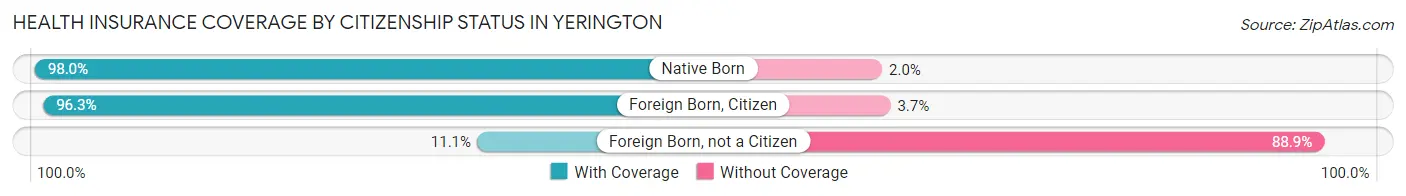
| Citizenship Status | With Coverage | Without Coverage |
| Native Born | 97 (98.0%) | 2 (2.0%) |
| Foreign Born, Citizen | 472 (96.3%) | 18 (3.7%) |
| Foreign Born, not a Citizen | 23 (11.1%) | 184 (88.9%) |
Health Insurance Coverage by Household Income in Yerington
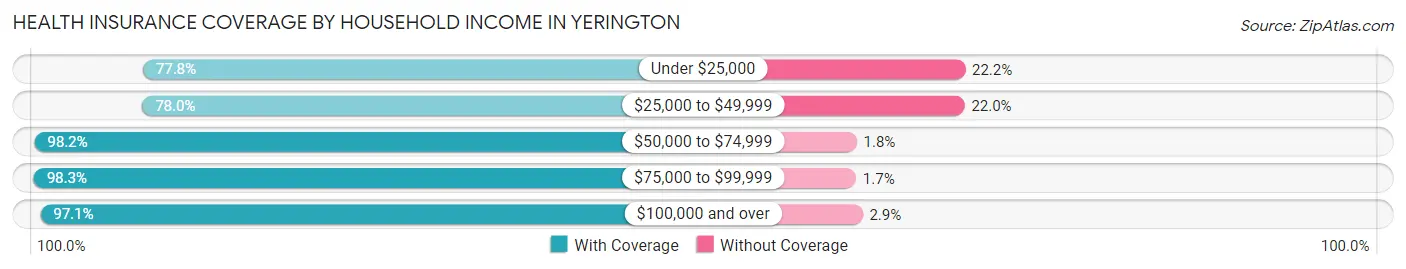
| Household Income | With Coverage | Without Coverage |
| Under $25,000 | 562 (77.8%) | 160 (22.2%) |
| $25,000 to $49,999 | 725 (78.0%) | 205 (22.0%) |
| $50,000 to $74,999 | 753 (98.2%) | 14 (1.8%) |
| $75,000 to $99,999 | 172 (98.3%) | 3 (1.7%) |
| $100,000 and over | 396 (97.1%) | 12 (2.9%) |
Public vs Private Health Insurance Coverage by Age in Yerington
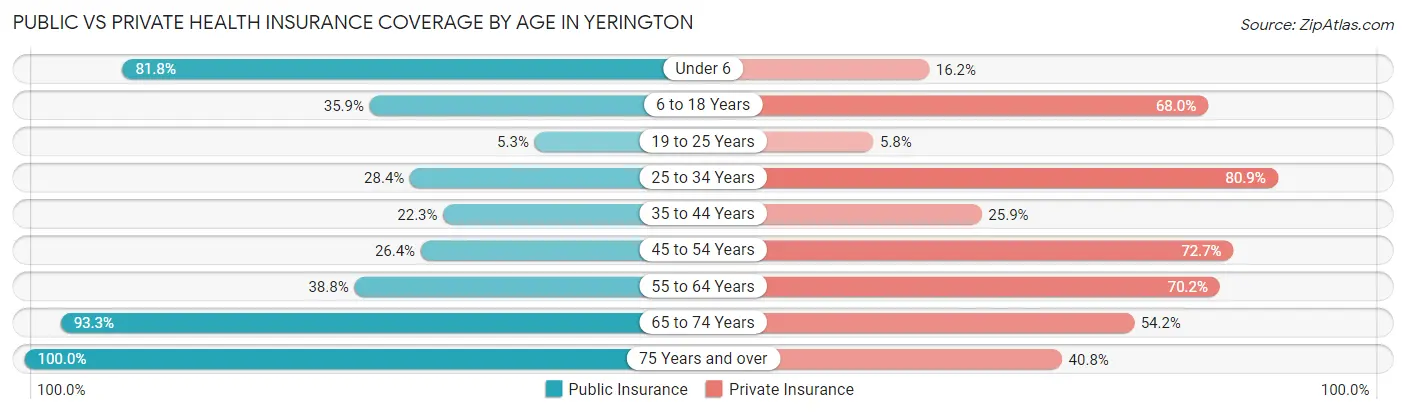
| Age Bracket | Public Insurance | Private Insurance |
| Under 6 | 81 (81.8%) | 16 (16.2%) |
| 6 to 18 Years | 176 (35.9%) | 333 (68.0%) |
| 19 to 25 Years | 11 (5.3%) | 12 (5.8%) |
| 25 to 34 Years | 64 (28.4%) | 182 (80.9%) |
| 35 to 44 Years | 49 (22.3%) | 57 (25.9%) |
| 45 to 54 Years | 60 (26.4%) | 165 (72.7%) |
| 55 to 64 Years | 126 (38.8%) | 228 (70.2%) |
| 65 to 74 Years | 737 (93.3%) | 428 (54.2%) |
| 75 Years and over | 419 (100.0%) | 171 (40.8%) |
| Total | 1,723 (57.4%) | 1,592 (53.0%) |
Disability Status by Sex by Age in Yerington
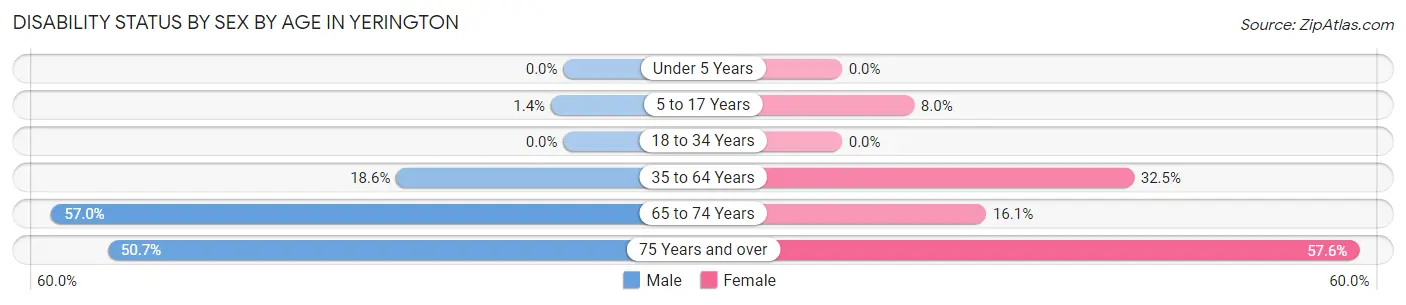
| Age Bracket | Male | Female |
| Under 5 Years | 0 (0.0%) | 0 (0.0%) |
| 5 to 17 Years | 3 (1.4%) | 22 (8.0%) |
| 18 to 34 Years | 0 (0.0%) | 0 (0.0%) |
| 35 to 64 Years | 67 (18.6%) | 134 (32.5%) |
| 65 to 74 Years | 248 (57.0%) | 57 (16.1%) |
| 75 Years and over | 106 (50.7%) | 121 (57.6%) |
Disability Class by Sex by Age in Yerington
Disability Class: Hearing Difficulty
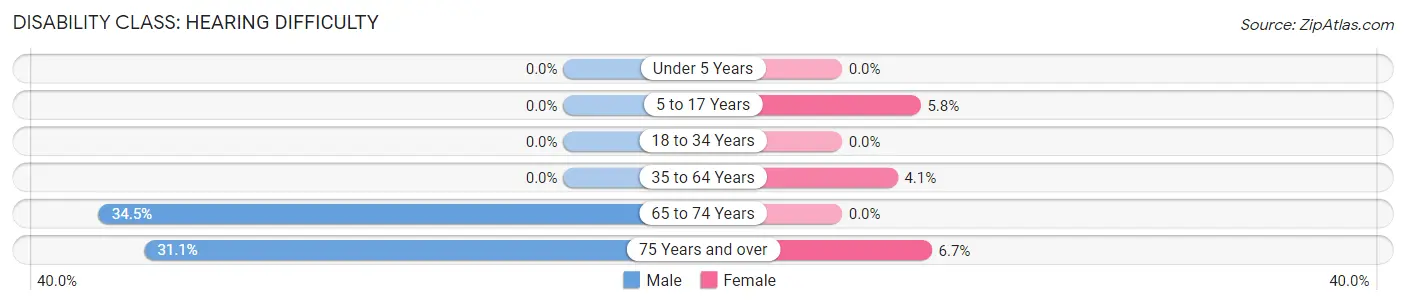
| Age Bracket | Male | Female |
| Under 5 Years | 0 (0.0%) | 0 (0.0%) |
| 5 to 17 Years | 0 (0.0%) | 16 (5.8%) |
| 18 to 34 Years | 0 (0.0%) | 0 (0.0%) |
| 35 to 64 Years | 0 (0.0%) | 17 (4.1%) |
| 65 to 74 Years | 150 (34.5%) | 0 (0.0%) |
| 75 Years and over | 65 (31.1%) | 14 (6.7%) |
Disability Class: Vision Difficulty
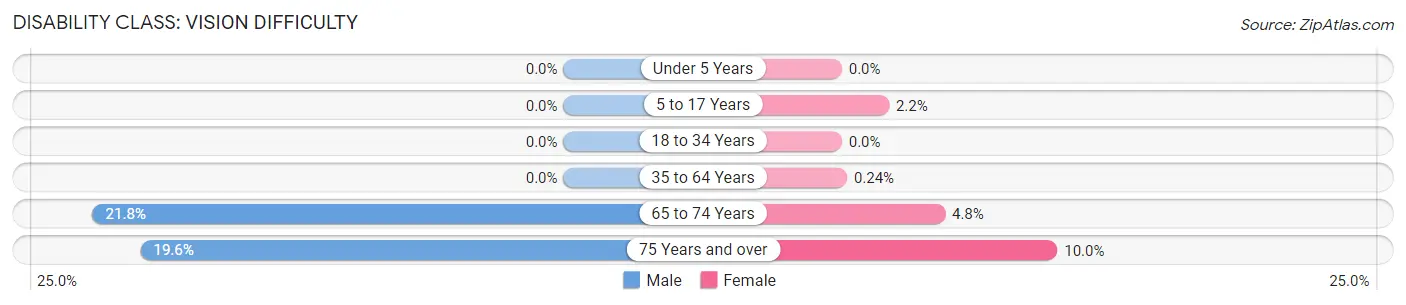
| Age Bracket | Male | Female |
| Under 5 Years | 0 (0.0%) | 0 (0.0%) |
| 5 to 17 Years | 0 (0.0%) | 6 (2.2%) |
| 18 to 34 Years | 0 (0.0%) | 0 (0.0%) |
| 35 to 64 Years | 0 (0.0%) | 1 (0.2%) |
| 65 to 74 Years | 95 (21.8%) | 17 (4.8%) |
| 75 Years and over | 41 (19.6%) | 21 (10.0%) |
Disability Class: Cognitive Difficulty
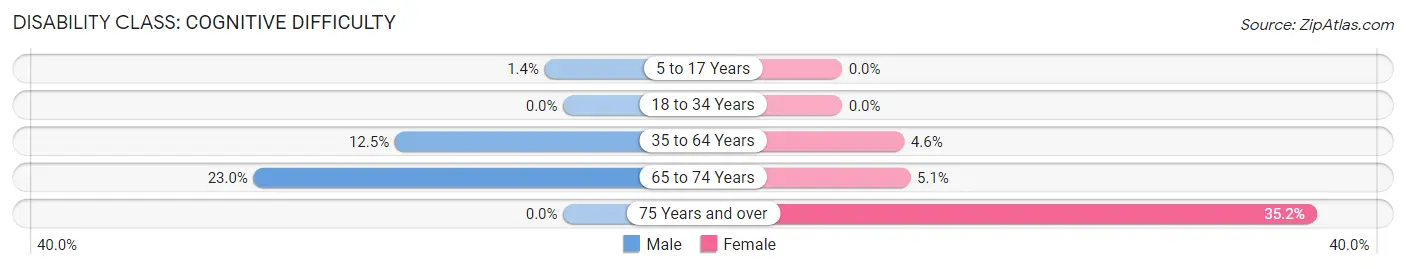
| Age Bracket | Male | Female |
| 5 to 17 Years | 3 (1.4%) | 0 (0.0%) |
| 18 to 34 Years | 0 (0.0%) | 0 (0.0%) |
| 35 to 64 Years | 45 (12.5%) | 19 (4.6%) |
| 65 to 74 Years | 100 (23.0%) | 18 (5.1%) |
| 75 Years and over | 0 (0.0%) | 74 (35.2%) |
Disability Class: Ambulatory Difficulty
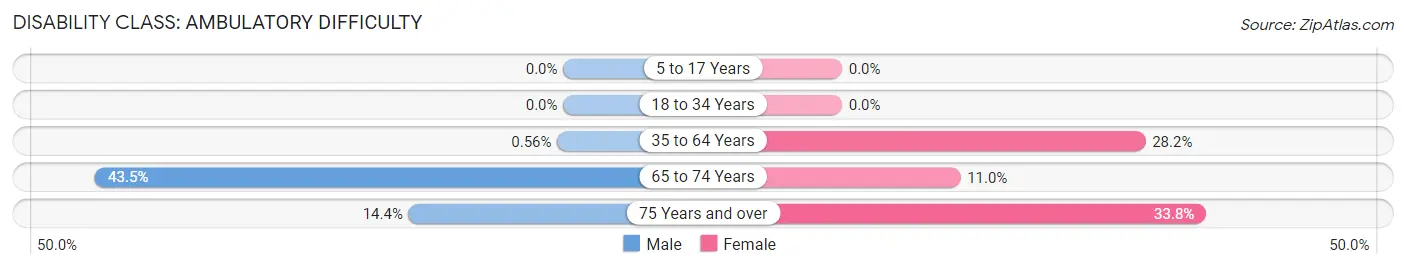
| Age Bracket | Male | Female |
| 5 to 17 Years | 0 (0.0%) | 0 (0.0%) |
| 18 to 34 Years | 0 (0.0%) | 0 (0.0%) |
| 35 to 64 Years | 2 (0.6%) | 116 (28.2%) |
| 65 to 74 Years | 189 (43.4%) | 39 (11.0%) |
| 75 Years and over | 30 (14.3%) | 71 (33.8%) |
Disability Class: Self-Care Difficulty
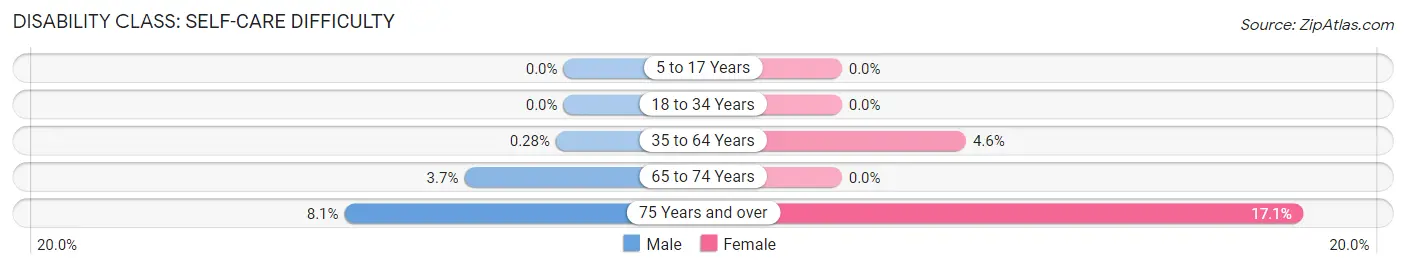
| Age Bracket | Male | Female |
| 5 to 17 Years | 0 (0.0%) | 0 (0.0%) |
| 18 to 34 Years | 0 (0.0%) | 0 (0.0%) |
| 35 to 64 Years | 1 (0.3%) | 19 (4.6%) |
| 65 to 74 Years | 16 (3.7%) | 0 (0.0%) |
| 75 Years and over | 17 (8.1%) | 36 (17.1%) |
Technology Access in Yerington
Computing Device Access in Yerington
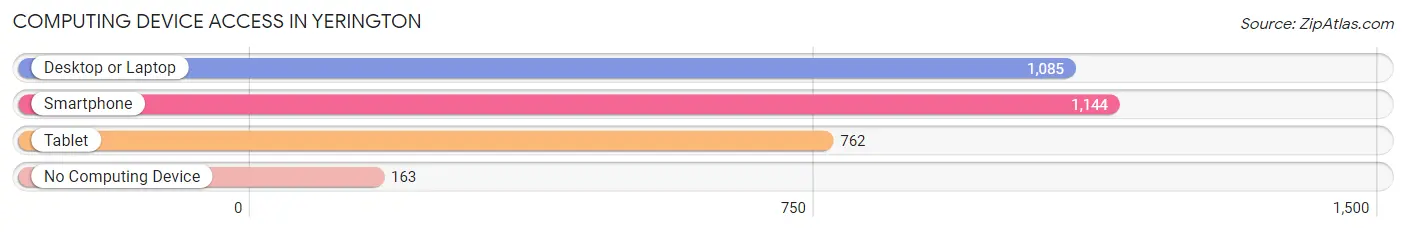
| Device Type | # Households | % Households |
| Desktop or Laptop | 1,085 | 73.0% |
| Smartphone | 1,144 | 76.9% |
| Tablet | 762 | 51.2% |
| No Computing Device | 163 | 11.0% |
| Total | 1,487 | 100.0% |
Internet Access in Yerington
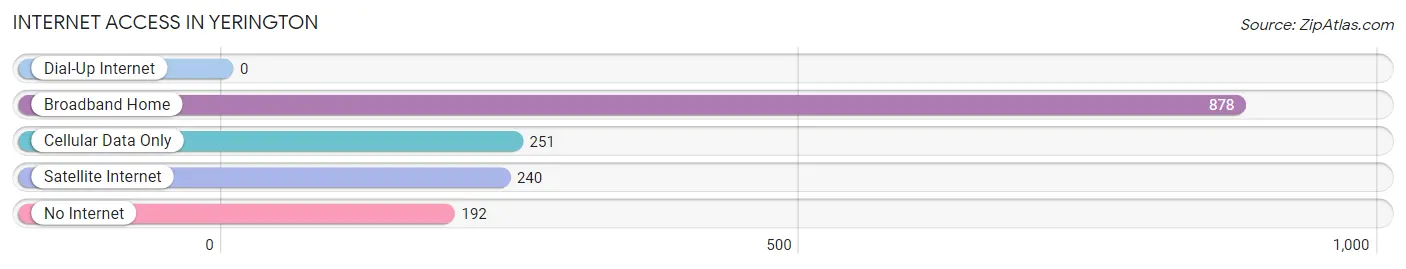
| Internet Type | # Households | % Households |
| Dial-Up Internet | 0 | 0.0% |
| Broadband Home | 878 | 59.1% |
| Cellular Data Only | 251 | 16.9% |
| Satellite Internet | 240 | 16.1% |
| No Internet | 192 | 12.9% |
| Total | 1,487 | 100.0% |
Yerington Summary
Yerington is a small city located in the western part of Nevada, in Lyon County. It is situated at the junction of U.S. Route 95 and Nevada State Route 208, about 50 miles southeast of Reno. The city has a population of about 3,000 people and is the county seat of Lyon County.
History
Yerington was founded in 1864 by John Yerington, a rancher and miner who had moved to the area from California. He established a ranch and a trading post, and the town was named after him. The town grew slowly, and by the early 1900s, it had become a center for mining and ranching.
In the early 20th century, Yerington was a major stop on the Tonopah and Tidewater Railroad, which connected the town to the mining towns of Tonopah and Goldfield. The railroad also connected Yerington to the larger cities of Reno and Las Vegas.
In the 1950s, Yerington began to experience a period of growth and development. The town was incorporated in 1953, and the population grew to over 3,000 by the end of the decade.
Geography
Yerington is located in the western part of Nevada, in Lyon County. It is situated at the junction of U.S. Route 95 and Nevada State Route 208, about 50 miles southeast of Reno. The city is located in the Mason Valley, which is part of the Great Basin Desert. The city is surrounded by mountains, including the Pine Nut Mountains to the east and the Wassuk Range to the west.
The climate in Yerington is semi-arid, with hot summers and mild winters. The average annual temperature is about 60°F, and the average annual precipitation is about 6 inches.
Economy
Yerington’s economy is largely based on agriculture and mining. The city is home to several large agricultural operations, including the Mason Valley Poultry Farm and the Yerington Livestock Company. The city is also home to several mining operations, including the Yerington Mine and the Yerington Copper Mine.
The city is also home to several manufacturing companies, including the Yerington Manufacturing Company and the Yerington Plastics Company. The city is also home to several retail stores, restaurants, and other businesses.
Demographics
As of the 2010 census, Yerington had a population of 3,040. The racial makeup of the city was 79.3% White, 0.7% African American, 1.2% Native American, 0.7% Asian, 0.1% Pacific Islander, 15.2% from other races, and 3.0% from two or more races. Hispanic or Latino of any race were 24.3% of the population.
The median income for a household in Yerington was $37,917, and the median income for a family was $45,938. The per capita income for the city was $17,945. About 17.2% of families and 21.2% of the population were below the poverty line, including 28.3% of those under age 18 and 10.2% of those age 65 or over.
Common Questions
What is Per Capita Income in Yerington?
Per Capita income in Yerington is $29,476.
What is the Median Family Income in Yerington?
Median Family Income in Yerington is $53,075.
What is the Median Household income in Yerington?
Median Household Income in Yerington is $41,600.
What is Income or Wage Gap in Yerington?
Income or Wage Gap in Yerington is 36.1%.
Women in Yerington earn 63.9 cents for every dollar earned by a man.
What is Inequality or Gini Index in Yerington?
Inequality or Gini Index in Yerington is 0.47.
What is the Total Population of Yerington?
Total Population of Yerington is 3,108.
What is the Total Male Population of Yerington?
Total Male Population of Yerington is 1,640.
What is the Total Female Population of Yerington?
Total Female Population of Yerington is 1,468.
What is the Ratio of Males per 100 Females in Yerington?
There are 111.72 Males per 100 Females in Yerington.
What is the Ratio of Females per 100 Males in Yerington?
There are 89.51 Females per 100 Males in Yerington.
What is the Median Population Age in Yerington?
Median Population Age in Yerington is 55.3 Years.
What is the Average Family Size in Yerington
Average Family Size in Yerington is 2.8 People.
What is the Average Household Size in Yerington
Average Household Size in Yerington is 2.0 People.
How Large is the Labor Force in Yerington?
There are 1,117 People in the Labor Forcein in Yerington.
What is the Percentage of People in the Labor Force in Yerington?
41.9% of People are in the Labor Force in Yerington.
What is the Unemployment Rate in Yerington?
Unemployment Rate in Yerington is 5.1%.