Stagecoach, NV Map & Demographics
Stagecoach Map
Stagecoach Overview
$67,802
PER CAPITA INCOME
$85,909
AVG FAMILY INCOME
$68,417
AVG HOUSEHOLD INCOME
17.7%
WAGE / INCOME GAP [ % ]
82.3¢/ $1
WAGE / INCOME GAP [ $ ]
0.55
INEQUALITY / GINI INDEX
1,904
TOTAL POPULATION
972
MALE POPULATION
932
FEMALE POPULATION
104.29
MALES / 100 FEMALES
95.88
FEMALES / 100 MALES
53.1
MEDIAN AGE
2.5
AVG FAMILY SIZE
2.3
AVG HOUSEHOLD SIZE
898
LABOR FORCE [ PEOPLE ]
51.7%
PERCENT IN LABOR FORCE
7.6%
UNEMPLOYMENT RATE
Stagecoach Area Codes
Income in Stagecoach
Income Overview in Stagecoach
Per Capita Income in Stagecoach is $67,802, while median incomes of families and households are $85,909 and $68,417 respectively.
| Characteristic | Number | Measure |
| Per Capita Income | 1,904 | $67,802 |
| Median Family Income | 590 | $85,909 |
| Mean Family Income | 590 | $149,707 |
| Median Household Income | 825 | $68,417 |
| Mean Household Income | 825 | $122,152 |
| Income Deficit | 590 | $0 |
| Wage / Income Gap (%) | 1,904 | 17.70% |
| Wage / Income Gap ($) | 1,904 | 82.30¢ per $1 |
| Gini / Inequality Index | 1,904 | 0.55 |
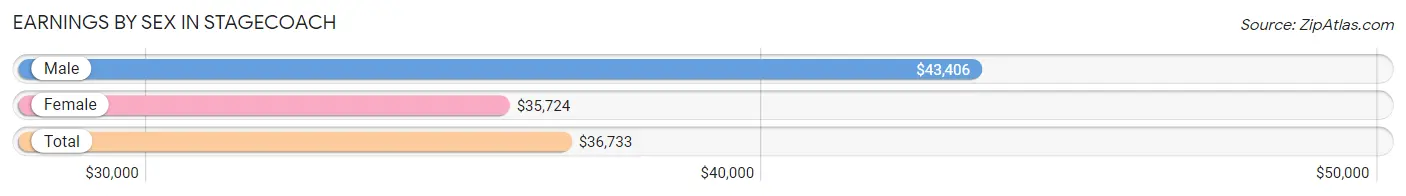
Earnings by Sex in Stagecoach
Average Earnings in Stagecoach are $36,733, $43,406 for men and $35,724 for women, a difference of 17.7%.
| Sex | Number | Average Earnings |
| Male | 487 (52.2%) | $43,406 |
| Female | 445 (47.7%) | $35,724 |
| Total | 932 (100.0%) | $36,733 |
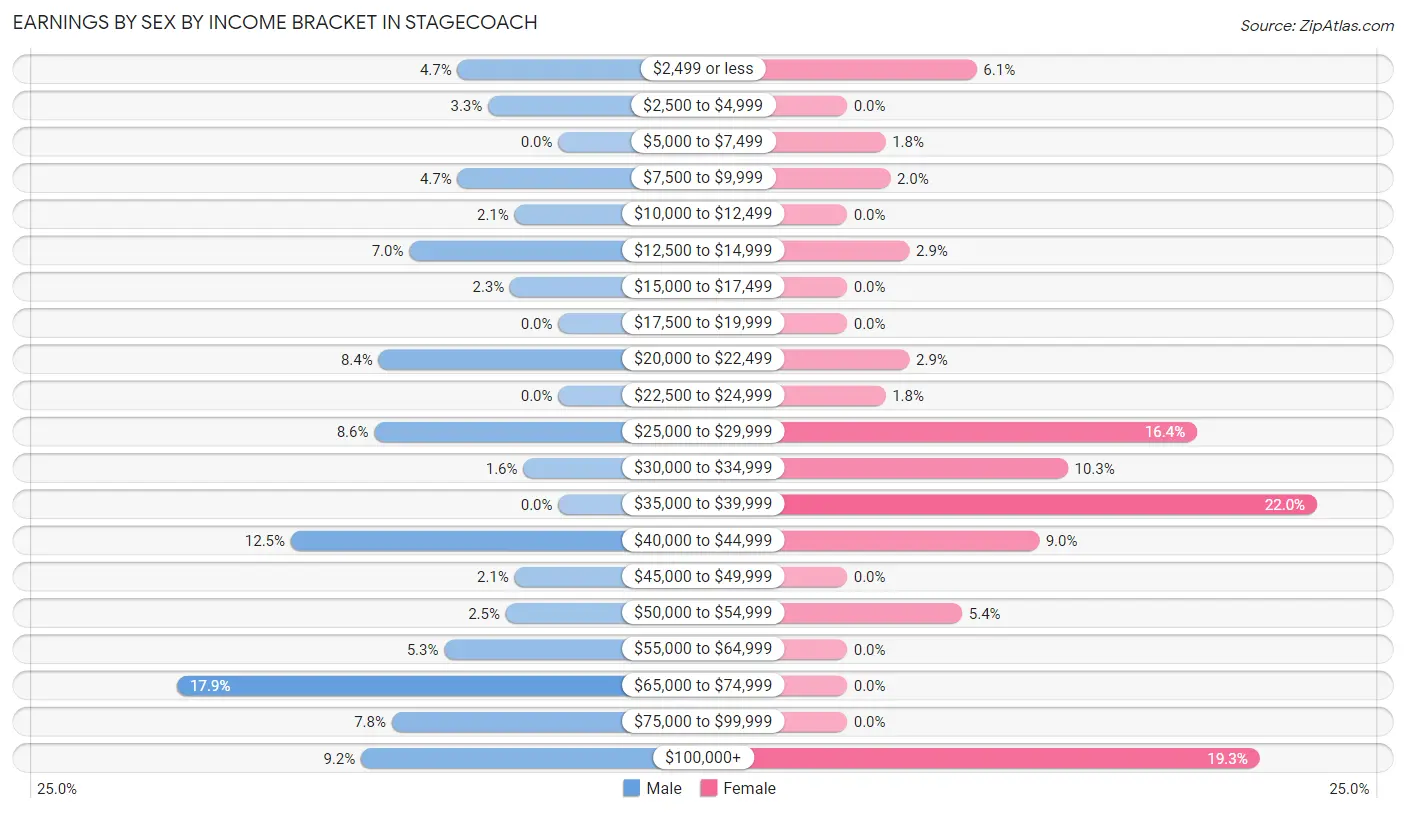
Earnings by Sex by Income Bracket in Stagecoach
The most common earnings brackets in Stagecoach are $65,000 to $74,999 for men (87 | 17.9%) and $35,000 to $39,999 for women (98 | 22.0%).
| Income | Male | Female |
| $2,499 or less | 23 (4.7%) | 27 (6.1%) |
| $2,500 to $4,999 | 16 (3.3%) | 0 (0.0%) |
| $5,000 to $7,499 | 0 (0.0%) | 8 (1.8%) |
| $7,500 to $9,999 | 23 (4.7%) | 9 (2.0%) |
| $10,000 to $12,499 | 10 (2.1%) | 0 (0.0%) |
| $12,500 to $14,999 | 34 (7.0%) | 13 (2.9%) |
| $15,000 to $17,499 | 11 (2.3%) | 0 (0.0%) |
| $17,500 to $19,999 | 0 (0.0%) | 0 (0.0%) |
| $20,000 to $22,499 | 41 (8.4%) | 13 (2.9%) |
| $22,500 to $24,999 | 0 (0.0%) | 8 (1.8%) |
| $25,000 to $29,999 | 42 (8.6%) | 73 (16.4%) |
| $30,000 to $34,999 | 8 (1.6%) | 46 (10.3%) |
| $35,000 to $39,999 | 0 (0.0%) | 98 (22.0%) |
| $40,000 to $44,999 | 61 (12.5%) | 40 (9.0%) |
| $45,000 to $49,999 | 10 (2.1%) | 0 (0.0%) |
| $50,000 to $54,999 | 12 (2.5%) | 24 (5.4%) |
| $55,000 to $64,999 | 26 (5.3%) | 0 (0.0%) |
| $65,000 to $74,999 | 87 (17.9%) | 0 (0.0%) |
| $75,000 to $99,999 | 38 (7.8%) | 0 (0.0%) |
| $100,000+ | 45 (9.2%) | 86 (19.3%) |
| Total | 487 (100.0%) | 445 (100.0%) |
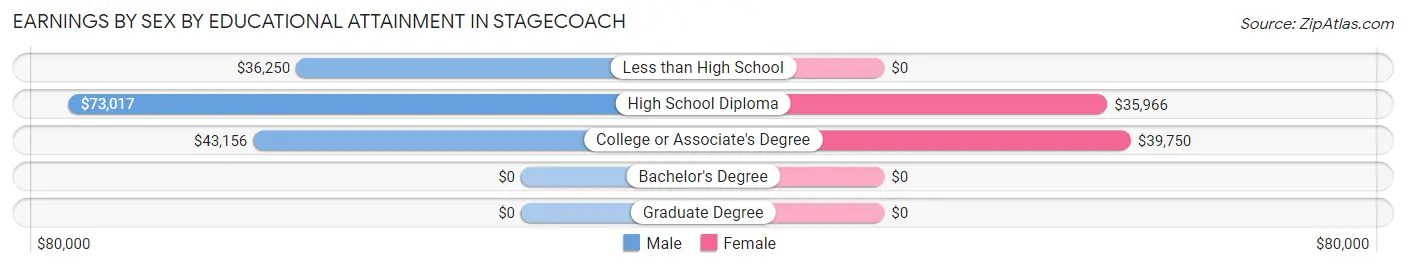
Earnings by Sex by Educational Attainment in Stagecoach
Average earnings in Stagecoach are $44,750 for men and $35,724 for women, a difference of 20.2%. Men with an educational attainment of high school diploma enjoy the highest average annual earnings of $73,017, while those with less than high school education earn the least with $36,250. Women with an educational attainment of college or associate's degree earn the most with the average annual earnings of $39,750, while those with high school diploma education have the smallest earnings of $35,966.
| Educational Attainment | Male Income | Female Income |
| Less than High School | $36,250 | $0 |
| High School Diploma | $73,017 | $35,966 |
| College or Associate's Degree | $43,156 | $39,750 |
| Bachelor's Degree | - | - |
| Graduate Degree | - | - |
| Total | $44,750 | $35,724 |
Family Income in Stagecoach
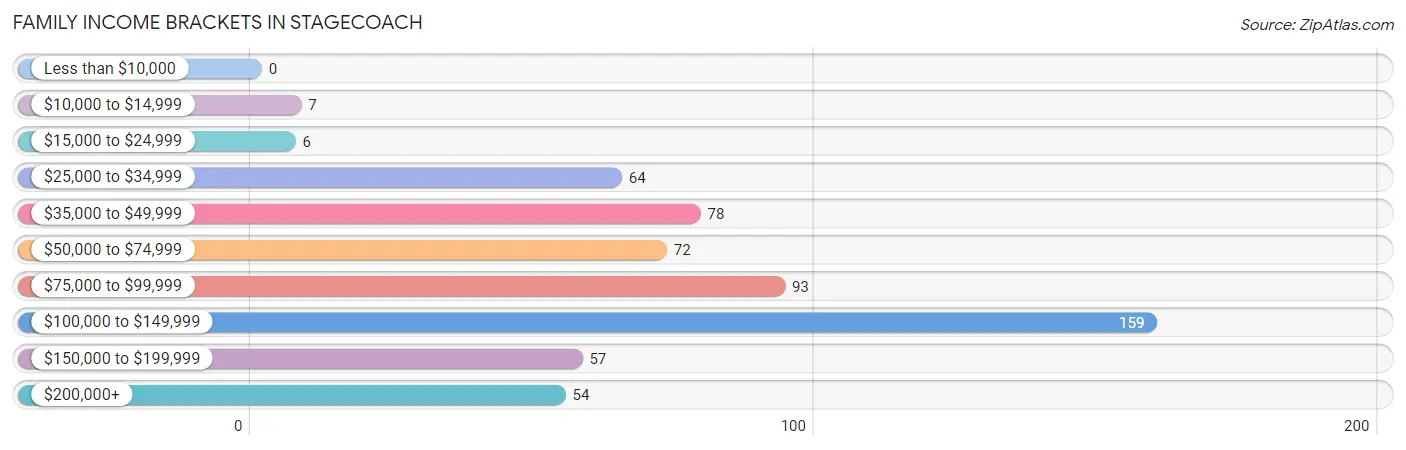
Family Income Brackets in Stagecoach
According to the Stagecoach family income data, there are 159 families falling into the $100,000 to $149,999 income range, which is the most common income bracket and makes up 27.0% of all families.
| Income Bracket | # Families | % Families |
| Less than $10,000 | 0 | 0.0% |
| $10,000 to $14,999 | 7 | 1.2% |
| $15,000 to $24,999 | 6 | 1.0% |
| $25,000 to $34,999 | 64 | 10.8% |
| $35,000 to $49,999 | 78 | 13.2% |
| $50,000 to $74,999 | 72 | 12.2% |
| $75,000 to $99,999 | 93 | 15.8% |
| $100,000 to $149,999 | 159 | 26.9% |
| $150,000 to $199,999 | 57 | 9.7% |
| $200,000+ | 54 | 9.2% |
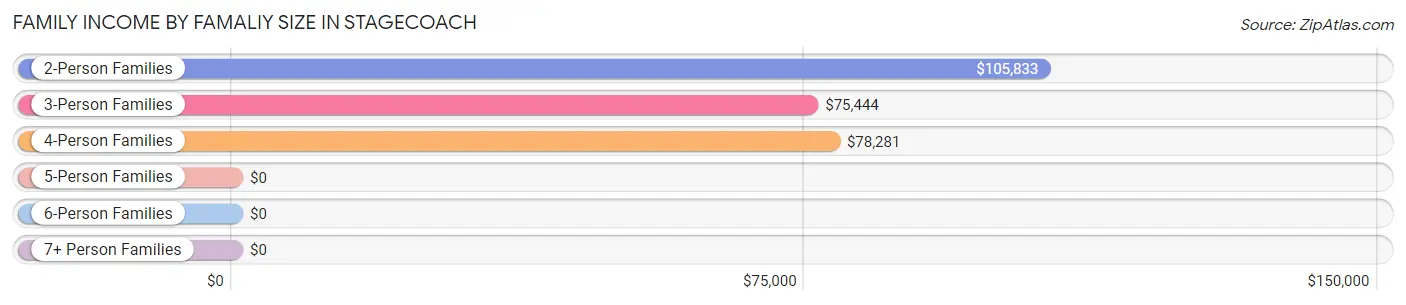
Family Income by Famaliy Size in Stagecoach
2-person families (446 | 75.6%) account for the highest median family income in Stagecoach with $105,833 per family, while 2-person families (446 | 75.6%) have the highest median income of $52,916 per family member.
| Income Bracket | # Families | Median Income |
| 2-Person Families | 446 (75.6%) | $105,833 |
| 3-Person Families | 85 (14.4%) | $75,444 |
| 4-Person Families | 39 (6.6%) | $78,281 |
| 5-Person Families | 20 (3.4%) | $0 |
| 6-Person Families | 0 (0.0%) | $0 |
| 7+ Person Families | 0 (0.0%) | $0 |
| Total | 590 (100.0%) | $85,909 |
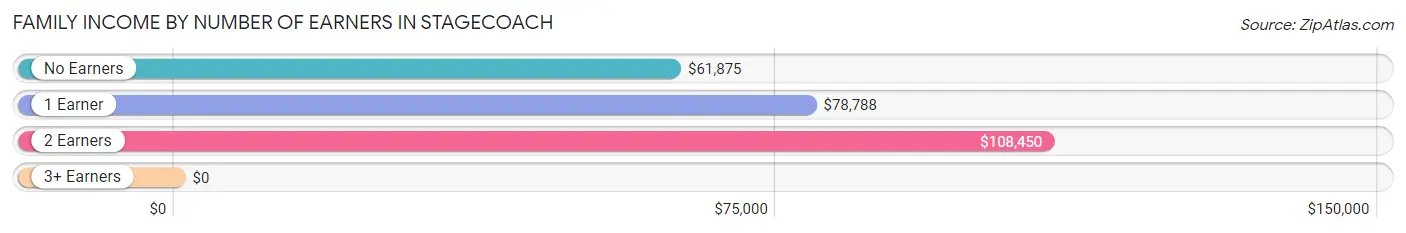
Family Income by Number of Earners in Stagecoach
| Number of Earners | # Families | Median Income |
| No Earners | 122 (20.7%) | $61,875 |
| 1 Earner | 280 (47.5%) | $78,788 |
| 2 Earners | 179 (30.3%) | $108,450 |
| 3+ Earners | 9 (1.5%) | $0 |
| Total | 590 (100.0%) | $85,909 |
Household Income in Stagecoach
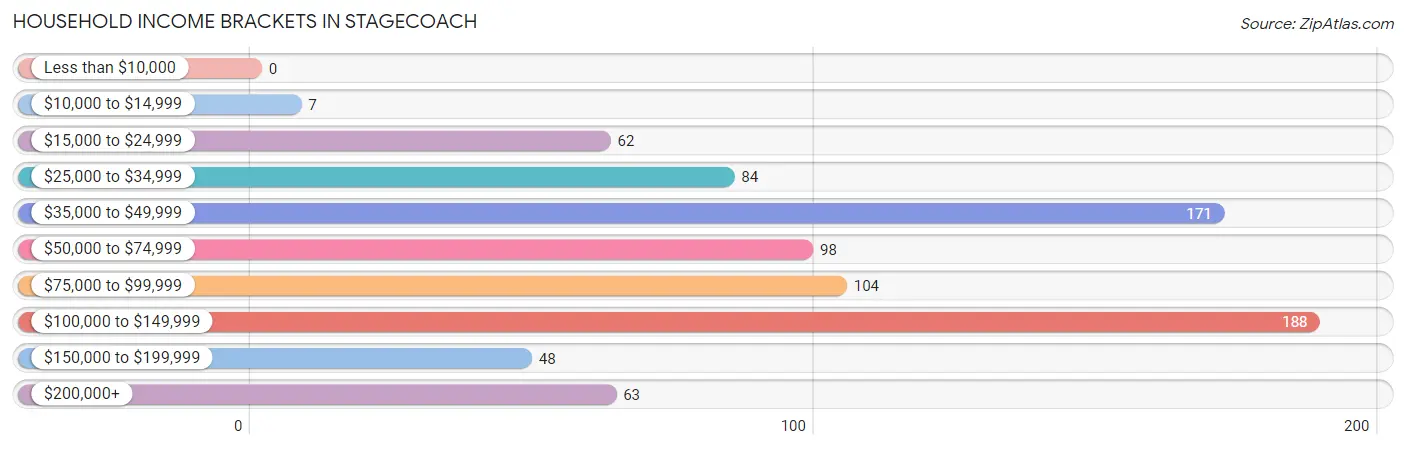
Household Income Brackets in Stagecoach
With 188 households falling in the category, the $100,000 to $149,999 income range is the most frequent in Stagecoach, accounting for 22.8% of all households.
| Income Bracket | # Households | % Households |
| Less than $10,000 | 0 | 0.0% |
| $10,000 to $14,999 | 7 | 0.8% |
| $15,000 to $24,999 | 62 | 7.5% |
| $25,000 to $34,999 | 84 | 10.2% |
| $35,000 to $49,999 | 171 | 20.7% |
| $50,000 to $74,999 | 98 | 11.9% |
| $75,000 to $99,999 | 104 | 12.6% |
| $100,000 to $149,999 | 188 | 22.8% |
| $150,000 to $199,999 | 48 | 5.8% |
| $200,000+ | 63 | 7.6% |
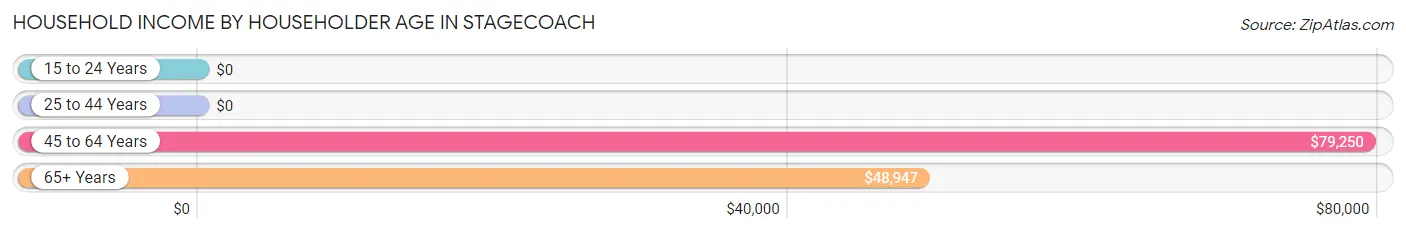
Household Income by Householder Age in Stagecoach
The median household income in Stagecoach is $68,417, with the highest median household income of $79,250 found in the 45 to 64 years age bracket for the primary householder. A total of 287 households (34.8%) fall into this category. Meanwhile, the 15 to 24 years age bracket for the primary householder has the lowest median household income of $0, with 12 households (1.5%) in this group.
| Income Bracket | # Households | Median Income |
| 15 to 24 Years | 12 (1.5%) | $0 |
| 25 to 44 Years | 258 (31.3%) | $0 |
| 45 to 64 Years | 287 (34.8%) | $79,250 |
| 65+ Years | 268 (32.5%) | $48,947 |
| Total | 825 (100.0%) | $68,417 |
Poverty in Stagecoach
Income Below Poverty by Sex and Age in Stagecoach
With 13.3% poverty level for males and 9.4% for females among the residents of Stagecoach, 18 to 24 year old males and 35 to 44 year old females are the most vulnerable to poverty, with 35 males (52.2%) and 53 females (36.3%) in their respective age groups living below the poverty level.
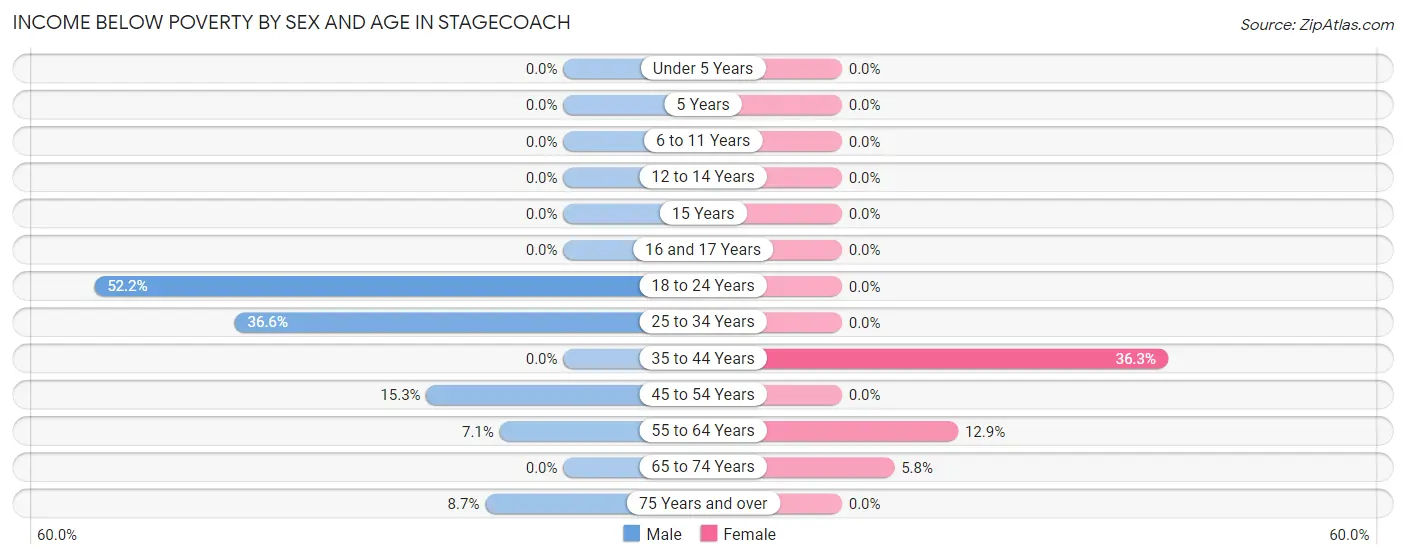
| Age Bracket | Male | Female |
| Under 5 Years | 0 (0.0%) | 0 (0.0%) |
| 5 Years | 0 (0.0%) | 0 (0.0%) |
| 6 to 11 Years | 0 (0.0%) | 0 (0.0%) |
| 12 to 14 Years | 0 (0.0%) | 0 (0.0%) |
| 15 Years | 0 (0.0%) | 0 (0.0%) |
| 16 and 17 Years | 0 (0.0%) | 0 (0.0%) |
| 18 to 24 Years | 35 (52.2%) | 0 (0.0%) |
| 25 to 34 Years | 67 (36.6%) | 0 (0.0%) |
| 35 to 44 Years | 0 (0.0%) | 53 (36.3%) |
| 45 to 54 Years | 9 (15.2%) | 0 (0.0%) |
| 55 to 64 Years | 12 (7.1%) | 26 (12.9%) |
| 65 to 74 Years | 0 (0.0%) | 9 (5.8%) |
| 75 Years and over | 6 (8.7%) | 0 (0.0%) |
| Total | 129 (13.3%) | 88 (9.4%) |
Income Above Poverty by Sex and Age in Stagecoach
According to the poverty statistics in Stagecoach, males aged under 5 years and females aged 6 to 11 years are the age groups that are most secure financially, with 100.0% of males and 100.0% of females in these age groups living above the poverty line.
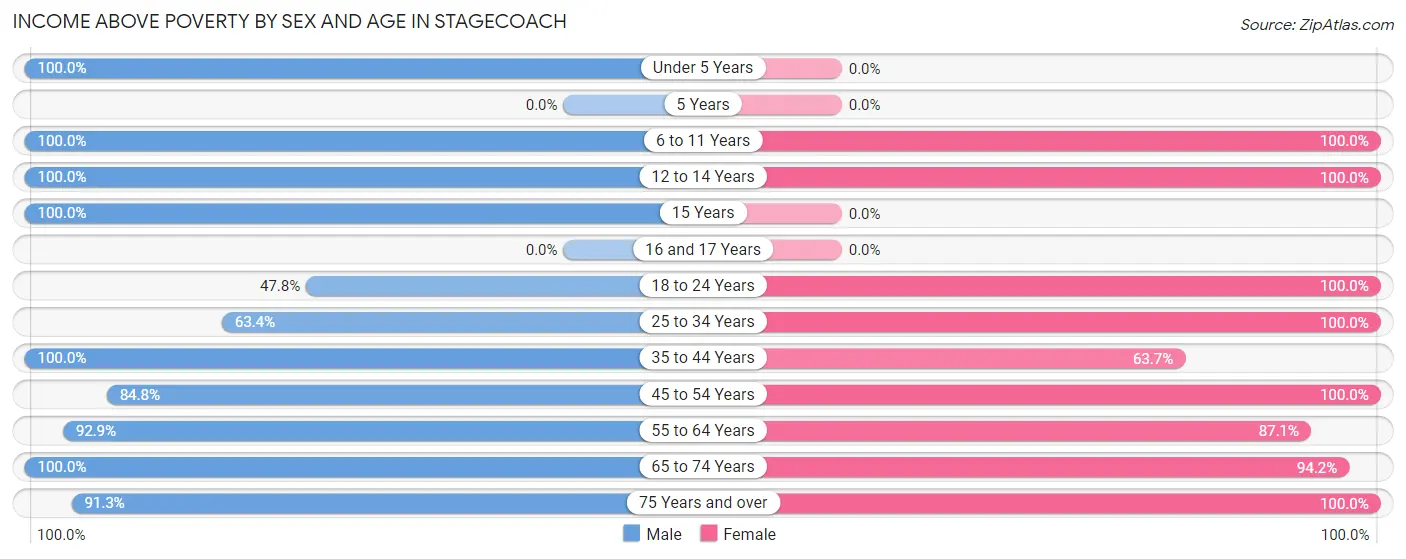
| Age Bracket | Male | Female |
| Under 5 Years | 15 (100.0%) | 0 (0.0%) |
| 5 Years | 0 (0.0%) | 0 (0.0%) |
| 6 to 11 Years | 49 (100.0%) | 34 (100.0%) |
| 12 to 14 Years | 16 (100.0%) | 13 (100.0%) |
| 15 Years | 41 (100.0%) | 0 (0.0%) |
| 16 and 17 Years | 0 (0.0%) | 0 (0.0%) |
| 18 to 24 Years | 32 (47.8%) | 26 (100.0%) |
| 25 to 34 Years | 116 (63.4%) | 163 (100.0%) |
| 35 to 44 Years | 155 (100.0%) | 93 (63.7%) |
| 45 to 54 Years | 50 (84.8%) | 75 (100.0%) |
| 55 to 64 Years | 157 (92.9%) | 175 (87.1%) |
| 65 to 74 Years | 149 (100.0%) | 145 (94.2%) |
| 75 Years and over | 63 (91.3%) | 120 (100.0%) |
| Total | 843 (86.7%) | 844 (90.6%) |
Income Below Poverty Among Married-Couple Families in Stagecoach
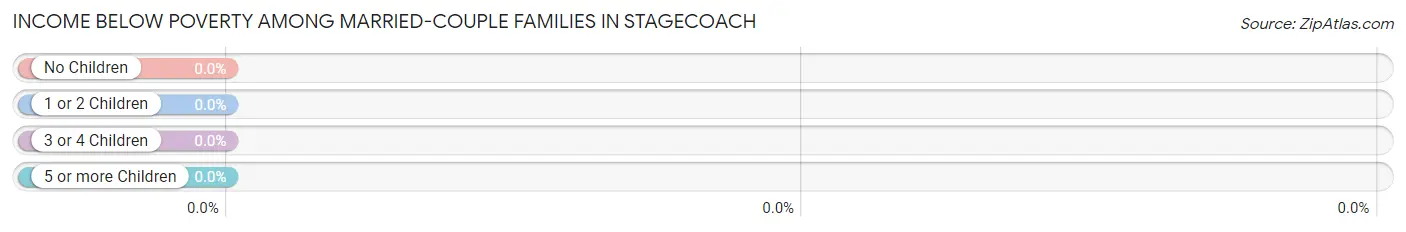
| Children | Above Poverty | Below Poverty |
| No Children | 402 (100.0%) | 0 (0.0%) |
| 1 or 2 Children | 22 (100.0%) | 0 (0.0%) |
| 3 or 4 Children | 20 (100.0%) | 0 (0.0%) |
| 5 or more Children | 0 (0.0%) | 0 (0.0%) |
| Total | 444 (100.0%) | 0 (0.0%) |
Income Below Poverty Among Single-Parent Households in Stagecoach
According to the poverty data in Stagecoach, 18.2% or 6 single-father households and 6.2% or 7 single-mother households are living below the poverty line. Among single-father households, those with no children have the highest poverty rate, with 6 households (33.3%) experiencing poverty. Likewise, among single-mother households, those with no children have the highest poverty rate, with 7 households (7.3%) falling below the poverty line.
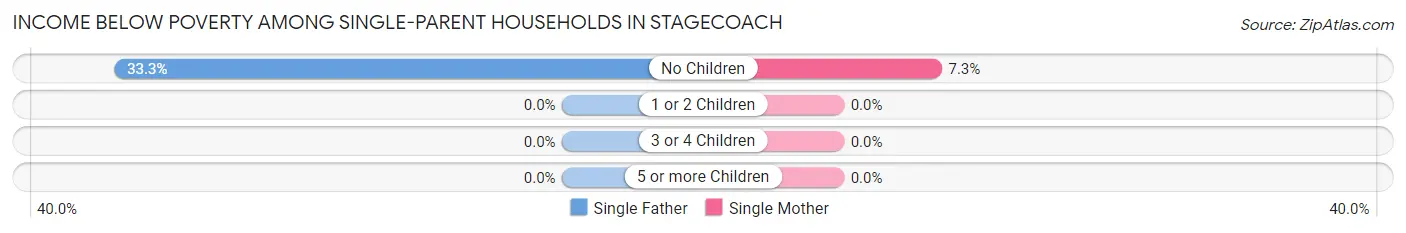
| Children | Single Father | Single Mother |
| No Children | 6 (33.3%) | 7 (7.3%) |
| 1 or 2 Children | 0 (0.0%) | 0 (0.0%) |
| 3 or 4 Children | 0 (0.0%) | 0 (0.0%) |
| 5 or more Children | 0 (0.0%) | 0 (0.0%) |
| Total | 6 (18.2%) | 7 (6.2%) |
Income Below Poverty Among Married-Couple vs Single-Parent Households in Stagecoach
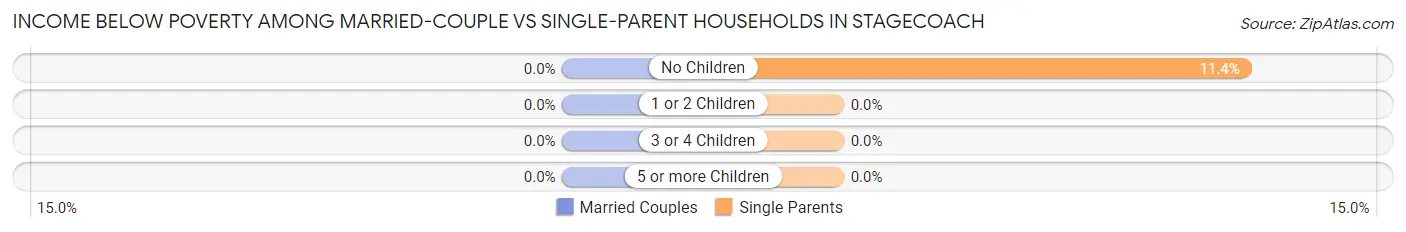
| Children | Married-Couple Families | Single-Parent Households |
| No Children | 0 (0.0%) | 13 (11.4%) |
| 1 or 2 Children | 0 (0.0%) | 0 (0.0%) |
| 3 or 4 Children | 0 (0.0%) | 0 (0.0%) |
| 5 or more Children | 0 (0.0%) | 0 (0.0%) |
| Total | 0 (0.0%) | 13 (8.9%) |
Race in Stagecoach
The most populous races in Stagecoach are White / Caucasian (1,706 | 89.6%), Hispanic or Latino (162 | 8.5%), and Some other Race (128 | 6.7%).
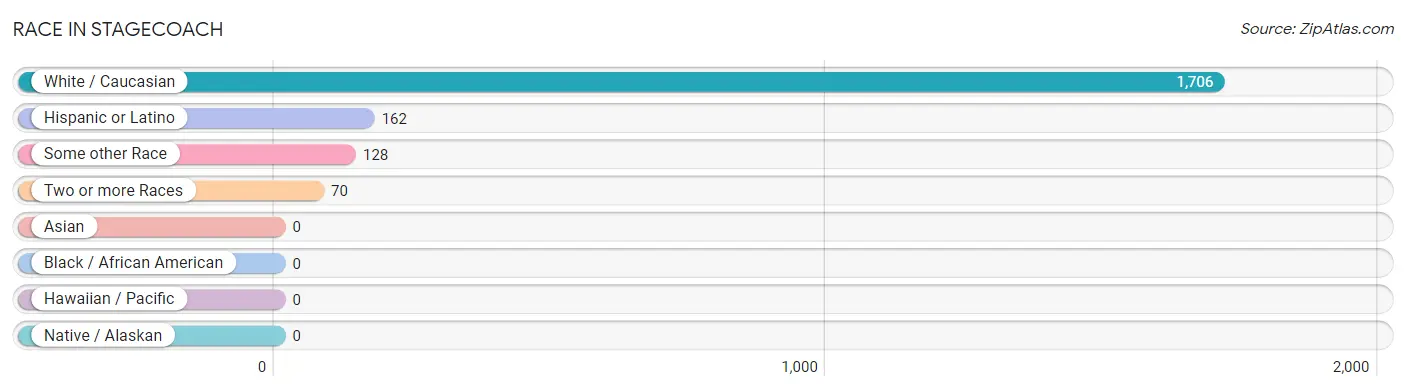
| Race | # Population | % Population |
| Asian | 0 | 0.0% |
| Black / African American | 0 | 0.0% |
| Hawaiian / Pacific | 0 | 0.0% |
| Hispanic or Latino | 162 | 8.5% |
| Native / Alaskan | 0 | 0.0% |
| White / Caucasian | 1,706 | 89.6% |
| Two or more Races | 70 | 3.7% |
| Some other Race | 128 | 6.7% |
| Total | 1,904 | 100.0% |
Ancestry in Stagecoach
The most populous ancestries reported in Stagecoach are English (274 | 14.4%), German (267 | 14.0%), Irish (206 | 10.8%), American (140 | 7.3%), and Mexican (134 | 7.0%), together accounting for 53.6% of all Stagecoach residents.
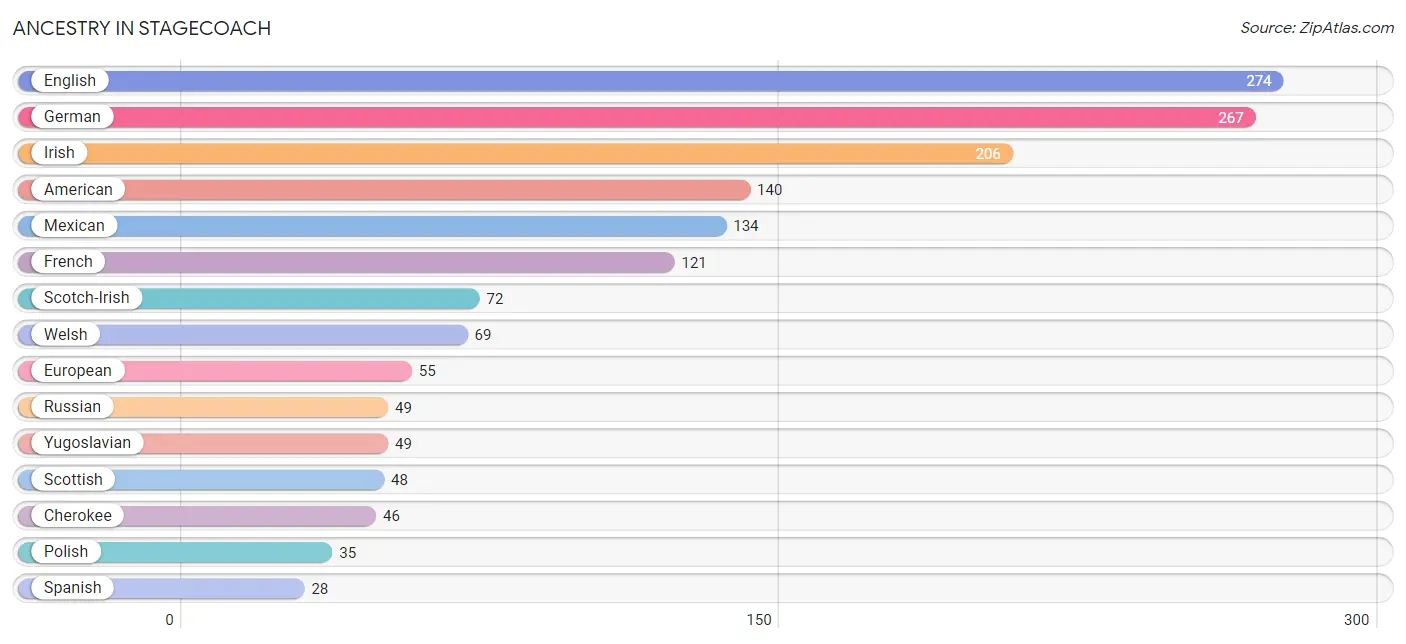
| Ancestry | # Population | % Population |
| American | 140 | 7.3% |
| British | 20 | 1.1% |
| Cherokee | 46 | 2.4% |
| Czech | 15 | 0.8% |
| Danish | 9 | 0.5% |
| Dutch | 20 | 1.1% |
| Eastern European | 26 | 1.4% |
| English | 274 | 14.4% |
| European | 55 | 2.9% |
| French | 121 | 6.4% |
| French Canadian | 8 | 0.4% |
| German | 267 | 14.0% |
| Irish | 206 | 10.8% |
| Italian | 25 | 1.3% |
| Mexican | 134 | 7.0% |
| Northern European | 18 | 0.9% |
| Norwegian | 26 | 1.4% |
| Polish | 35 | 1.8% |
| Portuguese | 26 | 1.4% |
| Russian | 49 | 2.6% |
| Scotch-Irish | 72 | 3.8% |
| Scottish | 48 | 2.5% |
| Spanish | 28 | 1.5% |
| Swedish | 10 | 0.5% |
| Welsh | 69 | 3.6% |
| Yugoslavian | 49 | 2.6% | View All 26 Rows |
Immigrants in Stagecoach
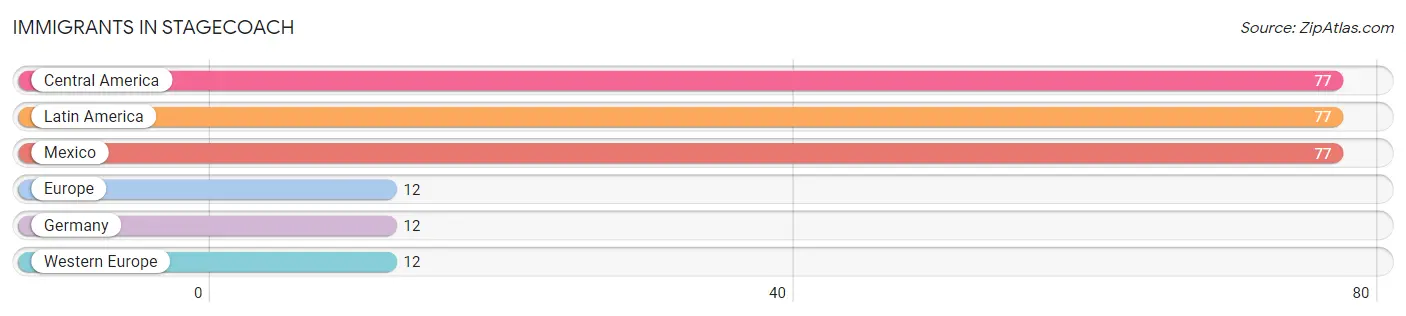
The most numerous immigrant groups reported in Stagecoach came from Central America (77 | 4.0%), Latin America (77 | 4.0%), Mexico (77 | 4.0%), Europe (12 | 0.6%), and Germany (12 | 0.6%), together accounting for 13.4% of all Stagecoach residents.
| Immigration Origin | # Population | % Population |
| Central America | 77 | 4.0% |
| Europe | 12 | 0.6% |
| Germany | 12 | 0.6% |
| Latin America | 77 | 4.0% |
| Mexico | 77 | 4.0% |
| Western Europe | 12 | 0.6% | View All 6 Rows |
Sex and Age in Stagecoach
Sex and Age in Stagecoach
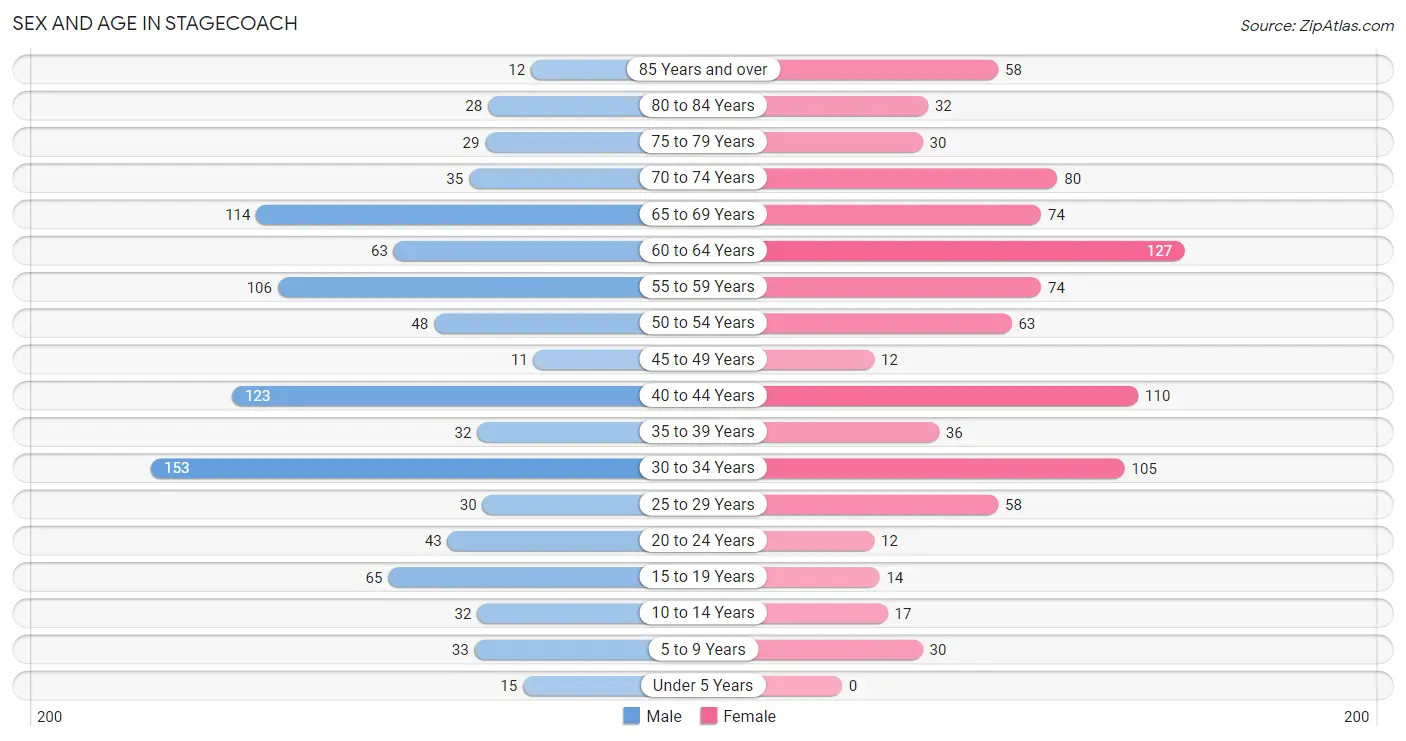
The most populous age groups in Stagecoach are 30 to 34 Years (153 | 15.7%) for men and 60 to 64 Years (127 | 13.6%) for women.
| Age Bracket | Male | Female |
| Under 5 Years | 15 (1.5%) | 0 (0.0%) |
| 5 to 9 Years | 33 (3.4%) | 30 (3.2%) |
| 10 to 14 Years | 32 (3.3%) | 17 (1.8%) |
| 15 to 19 Years | 65 (6.7%) | 14 (1.5%) |
| 20 to 24 Years | 43 (4.4%) | 12 (1.3%) |
| 25 to 29 Years | 30 (3.1%) | 58 (6.2%) |
| 30 to 34 Years | 153 (15.7%) | 105 (11.3%) |
| 35 to 39 Years | 32 (3.3%) | 36 (3.9%) |
| 40 to 44 Years | 123 (12.7%) | 110 (11.8%) |
| 45 to 49 Years | 11 (1.1%) | 12 (1.3%) |
| 50 to 54 Years | 48 (4.9%) | 63 (6.8%) |
| 55 to 59 Years | 106 (10.9%) | 74 (7.9%) |
| 60 to 64 Years | 63 (6.5%) | 127 (13.6%) |
| 65 to 69 Years | 114 (11.7%) | 74 (7.9%) |
| 70 to 74 Years | 35 (3.6%) | 80 (8.6%) |
| 75 to 79 Years | 29 (3.0%) | 30 (3.2%) |
| 80 to 84 Years | 28 (2.9%) | 32 (3.4%) |
| 85 Years and over | 12 (1.2%) | 58 (6.2%) |
| Total | 972 (100.0%) | 932 (100.0%) |
Families and Households in Stagecoach
Median Family Size in Stagecoach
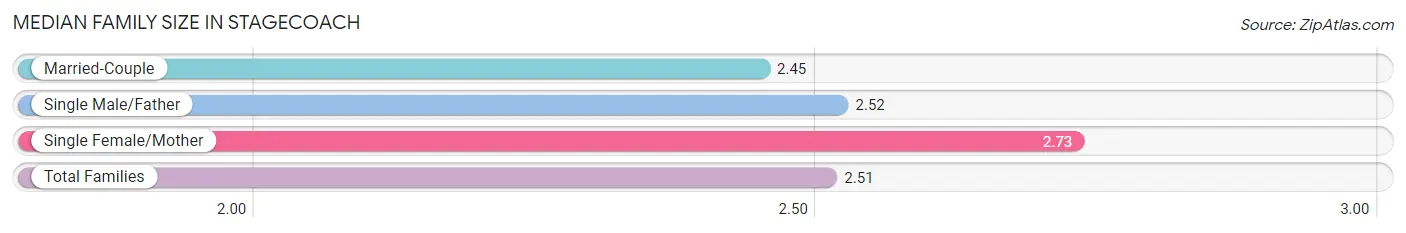
The median family size in Stagecoach is 2.51 persons per family, with single female/mother families (113 | 19.2%) accounting for the largest median family size of 2.73 persons per family. On the other hand, married-couple families (444 | 75.2%) represent the smallest median family size with 2.45 persons per family.
| Family Type | # Families | Family Size |
| Married-Couple | 444 (75.2%) | 2.45 |
| Single Male/Father | 33 (5.6%) | 2.52 |
| Single Female/Mother | 113 (19.2%) | 2.73 |
| Total Families | 590 (100.0%) | 2.51 |
Median Household Size in Stagecoach
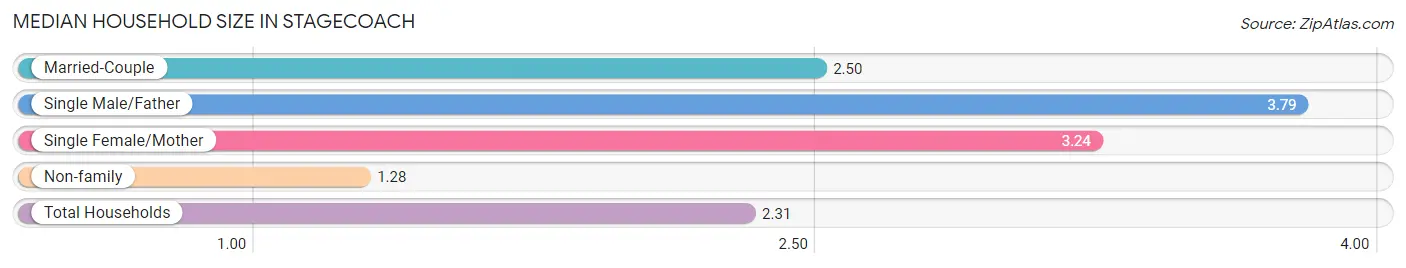
The median household size in Stagecoach is 2.31 persons per household, with single male/father households (33 | 4.0%) accounting for the largest median household size of 3.79 persons per household. non-family households (235 | 28.5%) represent the smallest median household size with 1.28 persons per household.
| Household Type | # Households | Household Size |
| Married-Couple | 444 (53.8%) | 2.50 |
| Single Male/Father | 33 (4.0%) | 3.79 |
| Single Female/Mother | 113 (13.7%) | 3.24 |
| Non-family | 235 (28.5%) | 1.28 |
| Total Households | 825 (100.0%) | 2.31 |
Household Size by Marriage Status in Stagecoach
Out of a total of 825 households in Stagecoach, 590 (71.5%) are family households, while 235 (28.5%) are nonfamily households. The most numerous type of family households are 2-person households, comprising 398, and the most common type of nonfamily households are 1-person households, comprising 163.
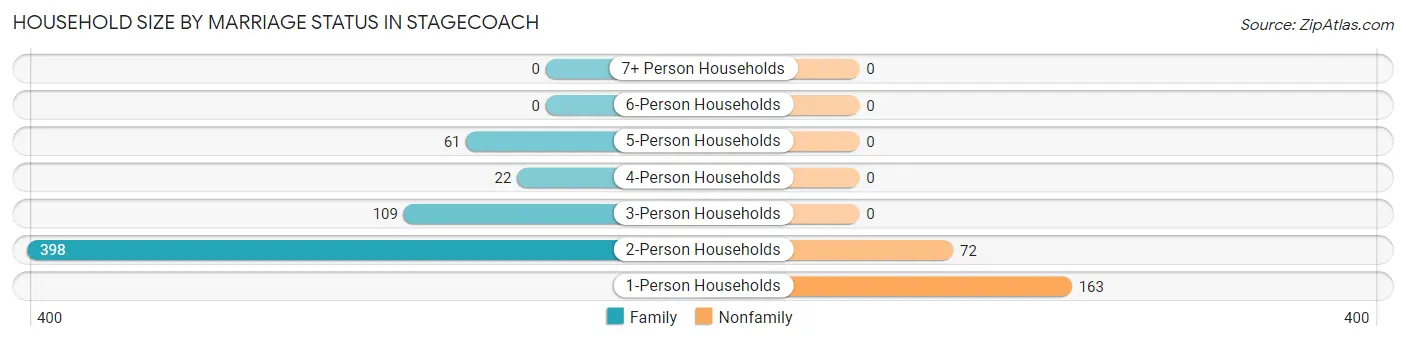
| Household Size | Family Households | Nonfamily Households |
| 1-Person Households | - | 163 (19.8%) |
| 2-Person Households | 398 (48.2%) | 72 (8.7%) |
| 3-Person Households | 109 (13.2%) | 0 (0.0%) |
| 4-Person Households | 22 (2.7%) | 0 (0.0%) |
| 5-Person Households | 61 (7.4%) | 0 (0.0%) |
| 6-Person Households | 0 (0.0%) | 0 (0.0%) |
| 7+ Person Households | 0 (0.0%) | 0 (0.0%) |
| Total | 590 (71.5%) | 235 (28.5%) |
Female Fertility in Stagecoach
Fertility by Age in Stagecoach
| Age Bracket | Women with Births | Births / 1,000 Women |
| 15 to 19 years | 0 (0.0%) | 0.0 |
| 20 to 34 years | 0 (0.0%) | 0.0 |
| 35 to 50 years | 0 (0.0%) | 0.0 |
| Total | 0 (0.0%) | 0.0 |
Fertility by Age by Marriage Status in Stagecoach
| Age Bracket | Married | Unmarried |
| 15 to 19 years | 0 (0.0%) | 0 (0.0%) |
| 20 to 34 years | 0 (0.0%) | 0 (0.0%) |
| 35 to 50 years | 0 (0.0%) | 0 (0.0%) |
| Total | 0 (0.0%) | 0 (0.0%) |
Fertility by Education in Stagecoach
| Educational Attainment | Women with Births | Births / 1,000 Women |
| Less than High School | 0 (0.0%) | 0.0 |
| High School Diploma | 0 (0.0%) | 0.0 |
| College or Associate's Degree | 0 (0.0%) | 0.0 |
| Bachelor's Degree | 0 (0.0%) | 0.0 |
| Graduate Degree | 0 (0.0%) | 0.0 |
| Total | 0 (0.0%) | 0.0 |
Fertility by Education by Marriage Status in Stagecoach
| Educational Attainment | Married | Unmarried |
| Less than High School | 0 (0.0%) | 0 (0.0%) |
| High School Diploma | 0 (0.0%) | 0 (0.0%) |
| College or Associate's Degree | 0 (0.0%) | 0 (0.0%) |
| Bachelor's Degree | 0 (0.0%) | 0 (0.0%) |
| Graduate Degree | 0 (0.0%) | 0 (0.0%) |
| Total | 0 (0.0%) | 0 (0.0%) |
Employment Characteristics in Stagecoach
Employment by Class of Employer in Stagecoach
Among the 830 employed individuals in Stagecoach, private company employees (626 | 75.4%), local government employees (130 | 15.7%), and state government employees (30 | 3.6%) make up the most common classes of employment.
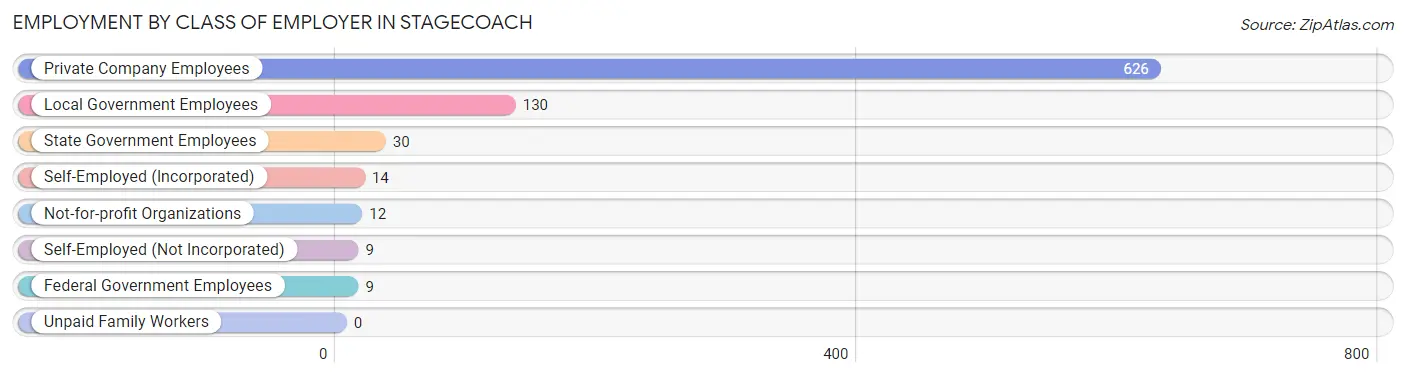
| Employer Class | # Employees | % Employees |
| Private Company Employees | 626 | 75.4% |
| Self-Employed (Incorporated) | 14 | 1.7% |
| Self-Employed (Not Incorporated) | 9 | 1.1% |
| Not-for-profit Organizations | 12 | 1.5% |
| Local Government Employees | 130 | 15.7% |
| State Government Employees | 30 | 3.6% |
| Federal Government Employees | 9 | 1.1% |
| Unpaid Family Workers | 0 | 0.0% |
| Total | 830 | 100.0% |
Employment Status by Age in Stagecoach
According to the labor force statistics for Stagecoach, out of the total population over 16 years of age (1,736), 51.7% or 898 individuals are in the labor force, with 7.6% or 68 of them unemployed. The age group with the highest labor force participation rate is 45 to 54 years, with 91.8% or 123 individuals in the labor force. Within the labor force, the 20 to 24 years age range has the highest percentage of unemployed individuals, with 25.6% or 11 of them being unemployed.
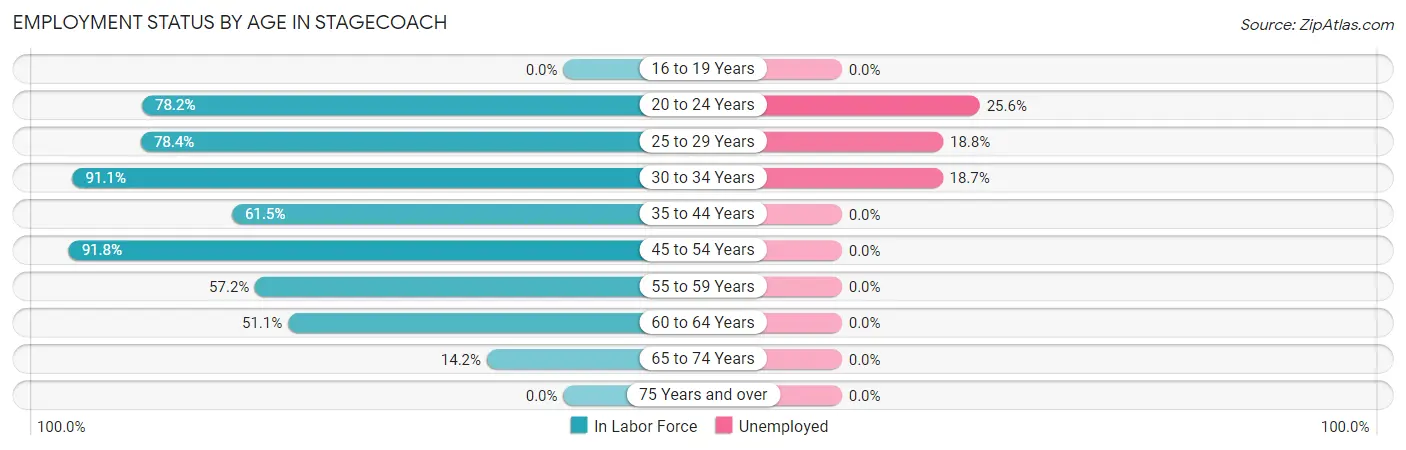
| Age Bracket | In Labor Force | Unemployed |
| 16 to 19 Years | 0 (0.0%) | 0 (0.0%) |
| 20 to 24 Years | 43 (78.2%) | 11 (25.6%) |
| 25 to 29 Years | 69 (78.4%) | 13 (18.8%) |
| 30 to 34 Years | 235 (91.1%) | 44 (18.7%) |
| 35 to 44 Years | 185 (61.5%) | 0 (0.0%) |
| 45 to 54 Years | 123 (91.8%) | 0 (0.0%) |
| 55 to 59 Years | 103 (57.2%) | 0 (0.0%) |
| 60 to 64 Years | 97 (51.1%) | 0 (0.0%) |
| 65 to 74 Years | 43 (14.2%) | 0 (0.0%) |
| 75 Years and over | 0 (0.0%) | 0 (0.0%) |
| Total | 898 (51.7%) | 68 (7.6%) |
Employment Status by Educational Attainment in Stagecoach
According to labor force statistics for Stagecoach, 70.5% of individuals (811) out of the total population between 25 and 64 years of age (1,151) are in the labor force, with 7.0% or 57 of them being unemployed. The group with the highest labor force participation rate are those with the educational attainment of college / associate degree, with 80.0% or 349 individuals in the labor force. Within the labor force, individuals with college / associate degree education have the highest percentage of unemployment, with 16.3% or 57 of them being unemployed.
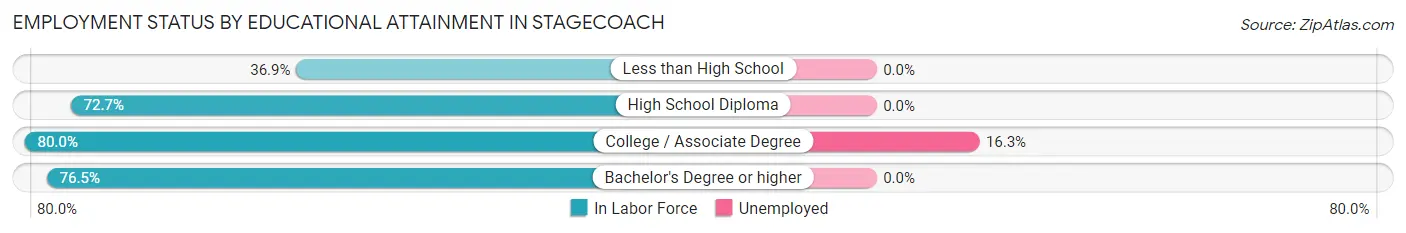
| Educational Attainment | In Labor Force | Unemployed |
| Less than High School | 62 (36.9%) | 0 (0.0%) |
| High School Diploma | 336 (72.7%) | 0 (0.0%) |
| College / Associate Degree | 349 (80.0%) | 71 (16.3%) |
| Bachelor's Degree or higher | 65 (76.5%) | 0 (0.0%) |
| Total | 811 (70.5%) | 81 (7.0%) |
Employment Occupations by Sex in Stagecoach
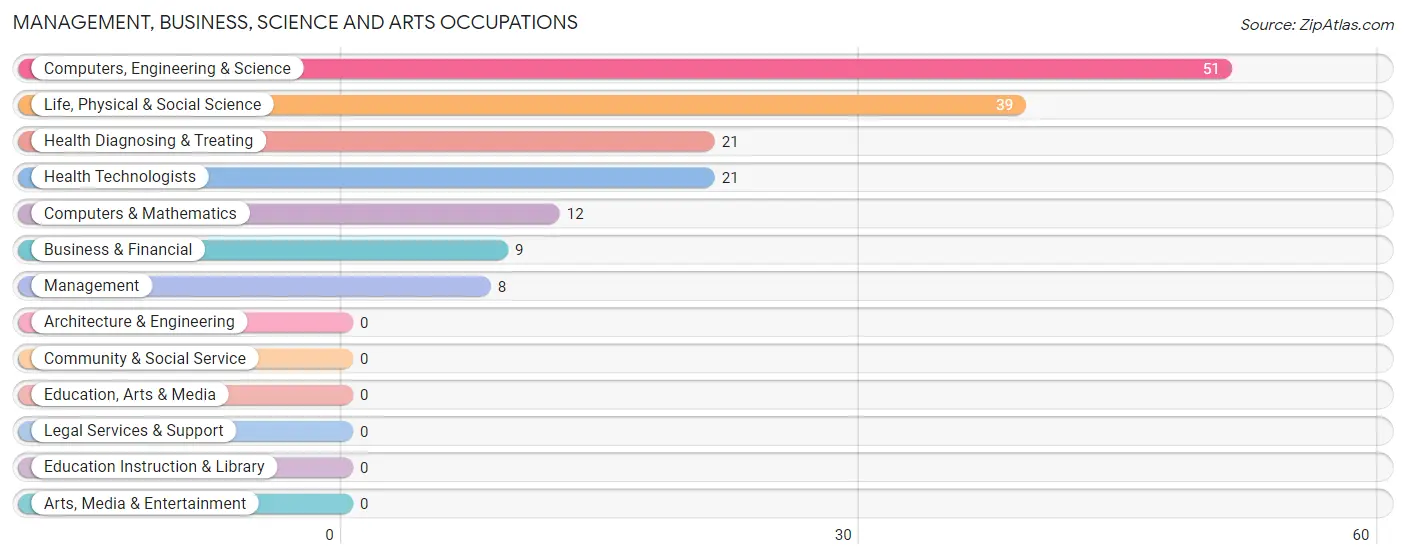
Management, Business, Science and Arts Occupations
The most common Management, Business, Science and Arts occupations in Stagecoach are Computers, Engineering & Science (51 | 6.1%), Life, Physical & Social Science (39 | 4.7%), Health Diagnosing & Treating (21 | 2.5%), Health Technologists (21 | 2.5%), and Computers & Mathematics (12 | 1.5%).
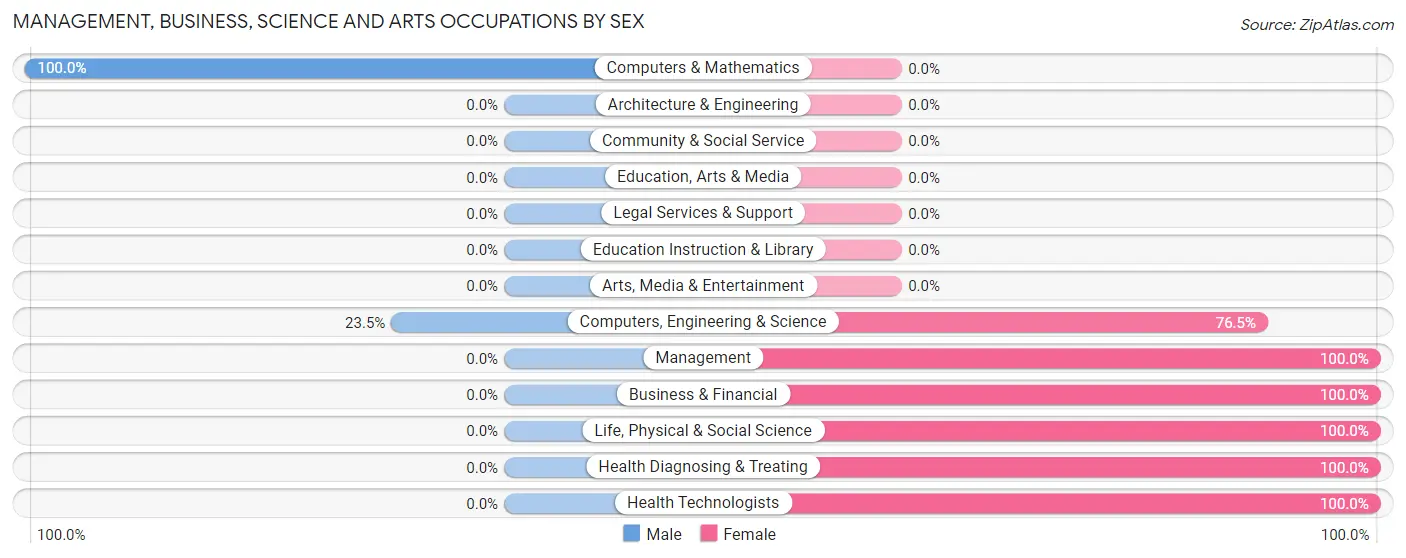
Management, Business, Science and Arts Occupations by Sex
Within the Management, Business, Science and Arts occupations in Stagecoach, the most male-oriented occupations are Computers & Mathematics (100.0%), and Computers, Engineering & Science (23.5%), while the most female-oriented occupations are Management (100.0%), Business & Financial (100.0%), and Life, Physical & Social Science (100.0%).
| Occupation | Male | Female |
| Management | 0 (0.0%) | 8 (100.0%) |
| Business & Financial | 0 (0.0%) | 9 (100.0%) |
| Computers, Engineering & Science | 12 (23.5%) | 39 (76.5%) |
| Computers & Mathematics | 12 (100.0%) | 0 (0.0%) |
| Architecture & Engineering | 0 (0.0%) | 0 (0.0%) |
| Life, Physical & Social Science | 0 (0.0%) | 39 (100.0%) |
| Community & Social Service | 0 (0.0%) | 0 (0.0%) |
| Education, Arts & Media | 0 (0.0%) | 0 (0.0%) |
| Legal Services & Support | 0 (0.0%) | 0 (0.0%) |
| Education Instruction & Library | 0 (0.0%) | 0 (0.0%) |
| Arts, Media & Entertainment | 0 (0.0%) | 0 (0.0%) |
| Health Diagnosing & Treating | 0 (0.0%) | 21 (100.0%) |
| Health Technologists | 0 (0.0%) | 21 (100.0%) |
| Total (Category) | 12 (13.5%) | 77 (86.5%) |
| Total (Overall) | 441 (53.1%) | 389 (46.9%) |
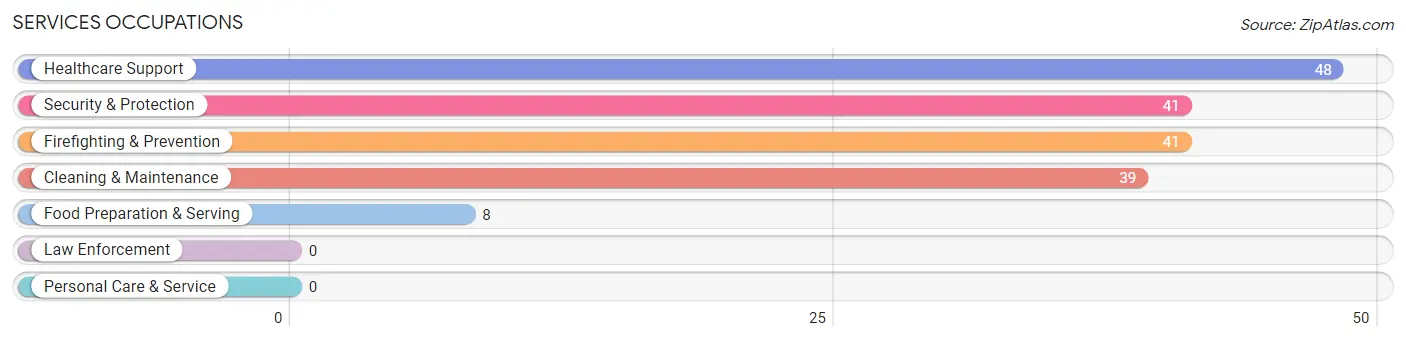
Services Occupations
The most common Services occupations in Stagecoach are Healthcare Support (48 | 5.8%), Security & Protection (41 | 4.9%), Firefighting & Prevention (41 | 4.9%), Cleaning & Maintenance (39 | 4.7%), and Food Preparation & Serving (8 | 1.0%).
Services Occupations by Sex
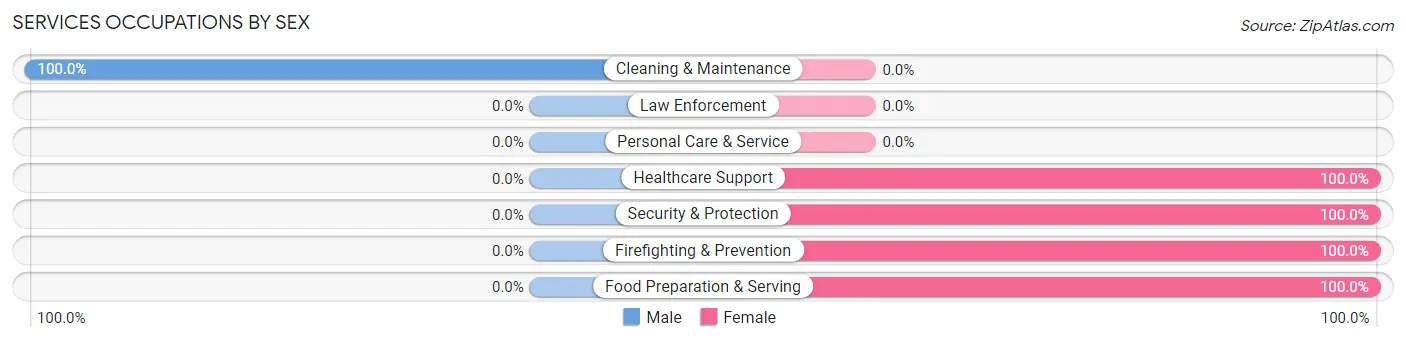
| Occupation | Male | Female |
| Healthcare Support | 0 (0.0%) | 48 (100.0%) |
| Security & Protection | 0 (0.0%) | 41 (100.0%) |
| Firefighting & Prevention | 0 (0.0%) | 41 (100.0%) |
| Law Enforcement | 0 (0.0%) | 0 (0.0%) |
| Food Preparation & Serving | 0 (0.0%) | 8 (100.0%) |
| Cleaning & Maintenance | 39 (100.0%) | 0 (0.0%) |
| Personal Care & Service | 0 (0.0%) | 0 (0.0%) |
| Total (Category) | 39 (28.7%) | 97 (71.3%) |
| Total (Overall) | 441 (53.1%) | 389 (46.9%) |
Sales and Office Occupations
The most common Sales and Office occupations in Stagecoach are Office & Administration (172 | 20.7%), and Sales & Related (20 | 2.4%).

Sales and Office Occupations by Sex

| Occupation | Male | Female |
| Sales & Related | 11 (55.0%) | 9 (45.0%) |
| Office & Administration | 0 (0.0%) | 172 (100.0%) |
| Total (Category) | 11 (5.7%) | 181 (94.3%) |
| Total (Overall) | 441 (53.1%) | 389 (46.9%) |
Natural Resources, Construction and Maintenance Occupations
The most common Natural Resources, Construction and Maintenance occupations in Stagecoach are Construction & Extraction (195 | 23.5%), and Installation, Maintenance & Repair (25 | 3.0%).

Natural Resources, Construction and Maintenance Occupations by Sex

| Occupation | Male | Female |
| Farming, Fishing & Forestry | 0 (0.0%) | 0 (0.0%) |
| Construction & Extraction | 195 (100.0%) | 0 (0.0%) |
| Installation, Maintenance & Repair | 25 (100.0%) | 0 (0.0%) |
| Total (Category) | 220 (100.0%) | 0 (0.0%) |
| Total (Overall) | 441 (53.1%) | 389 (46.9%) |
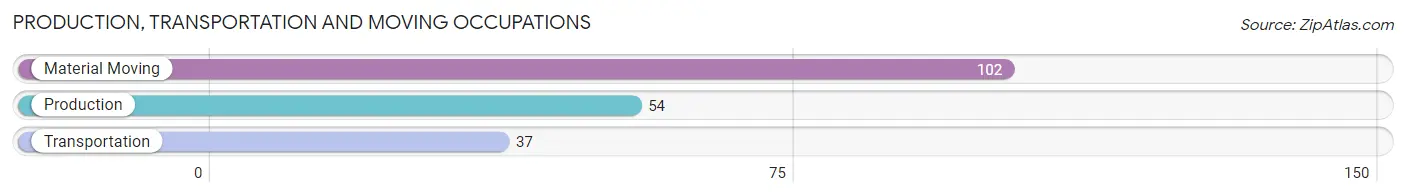
Production, Transportation and Moving Occupations
The most common Production, Transportation and Moving occupations in Stagecoach are Material Moving (102 | 12.3%), Production (54 | 6.5%), and Transportation (37 | 4.5%).
Production, Transportation and Moving Occupations by Sex
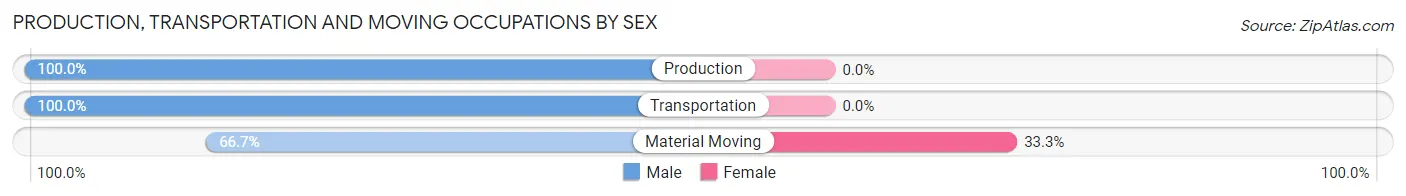
| Occupation | Male | Female |
| Production | 54 (100.0%) | 0 (0.0%) |
| Transportation | 37 (100.0%) | 0 (0.0%) |
| Material Moving | 68 (66.7%) | 34 (33.3%) |
| Total (Category) | 159 (82.4%) | 34 (17.6%) |
| Total (Overall) | 441 (53.1%) | 389 (46.9%) |
Employment Industries by Sex in Stagecoach
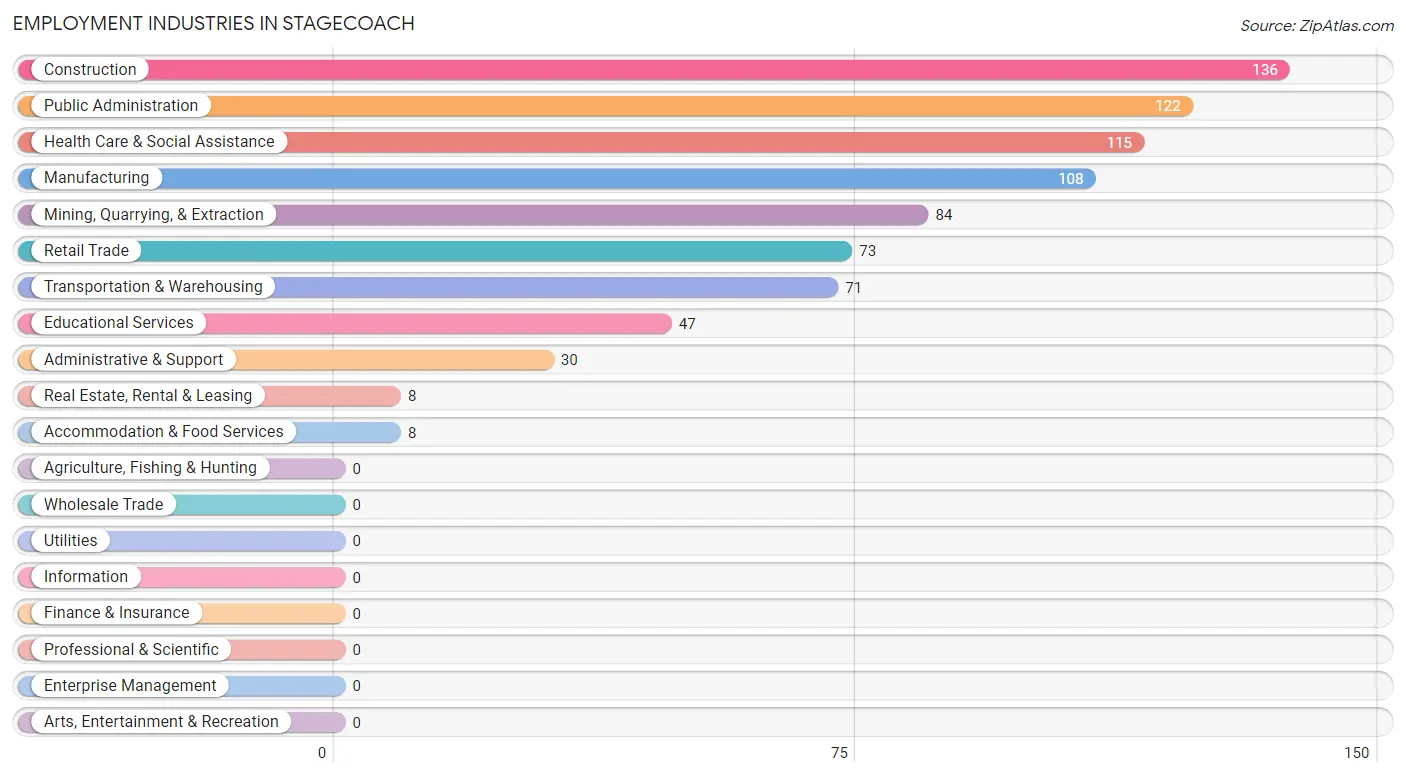
Employment Industries in Stagecoach
The major employment industries in Stagecoach include Construction (136 | 16.4%), Public Administration (122 | 14.7%), Health Care & Social Assistance (115 | 13.9%), Manufacturing (108 | 13.0%), and Mining, Quarrying, & Extraction (84 | 10.1%).
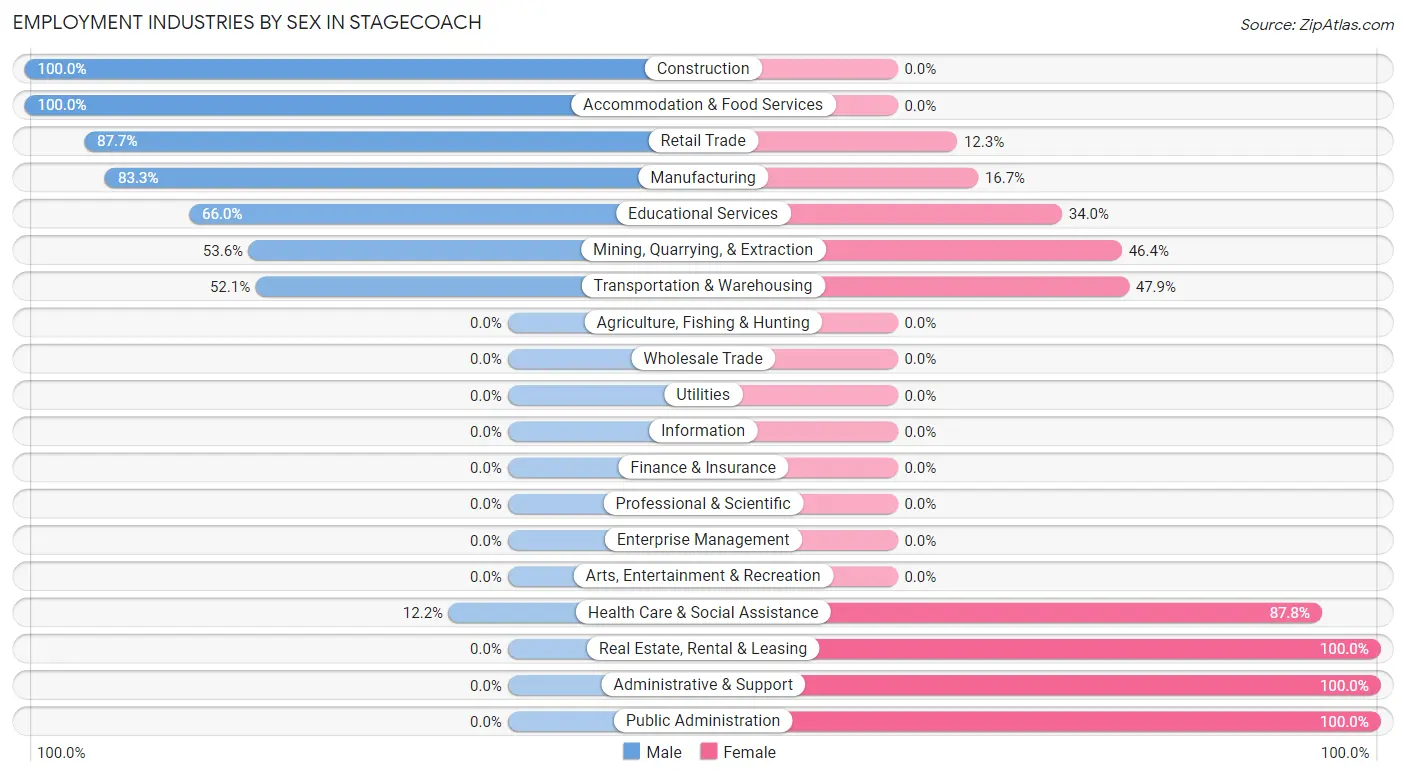
Employment Industries by Sex in Stagecoach
The Stagecoach industries that see more men than women are Construction (100.0%), Accommodation & Food Services (100.0%), and Retail Trade (87.7%), whereas the industries that tend to have a higher number of women are Real Estate, Rental & Leasing (100.0%), Administrative & Support (100.0%), and Public Administration (100.0%).
| Industry | Male | Female |
| Agriculture, Fishing & Hunting | 0 (0.0%) | 0 (0.0%) |
| Mining, Quarrying, & Extraction | 45 (53.6%) | 39 (46.4%) |
| Construction | 136 (100.0%) | 0 (0.0%) |
| Manufacturing | 90 (83.3%) | 18 (16.7%) |
| Wholesale Trade | 0 (0.0%) | 0 (0.0%) |
| Retail Trade | 64 (87.7%) | 9 (12.3%) |
| Transportation & Warehousing | 37 (52.1%) | 34 (47.9%) |
| Utilities | 0 (0.0%) | 0 (0.0%) |
| Information | 0 (0.0%) | 0 (0.0%) |
| Finance & Insurance | 0 (0.0%) | 0 (0.0%) |
| Real Estate, Rental & Leasing | 0 (0.0%) | 8 (100.0%) |
| Professional & Scientific | 0 (0.0%) | 0 (0.0%) |
| Enterprise Management | 0 (0.0%) | 0 (0.0%) |
| Administrative & Support | 0 (0.0%) | 30 (100.0%) |
| Educational Services | 31 (66.0%) | 16 (34.0%) |
| Health Care & Social Assistance | 14 (12.2%) | 101 (87.8%) |
| Arts, Entertainment & Recreation | 0 (0.0%) | 0 (0.0%) |
| Accommodation & Food Services | 8 (100.0%) | 0 (0.0%) |
| Public Administration | 0 (0.0%) | 122 (100.0%) |
| Total | 441 (53.1%) | 389 (46.9%) |
Education in Stagecoach
School Enrollment in Stagecoach
The most common levels of schooling among the 223 students in Stagecoach are elementary school (83 | 37.2%), high school (69 | 30.9%), and middle school (44 | 19.7%).
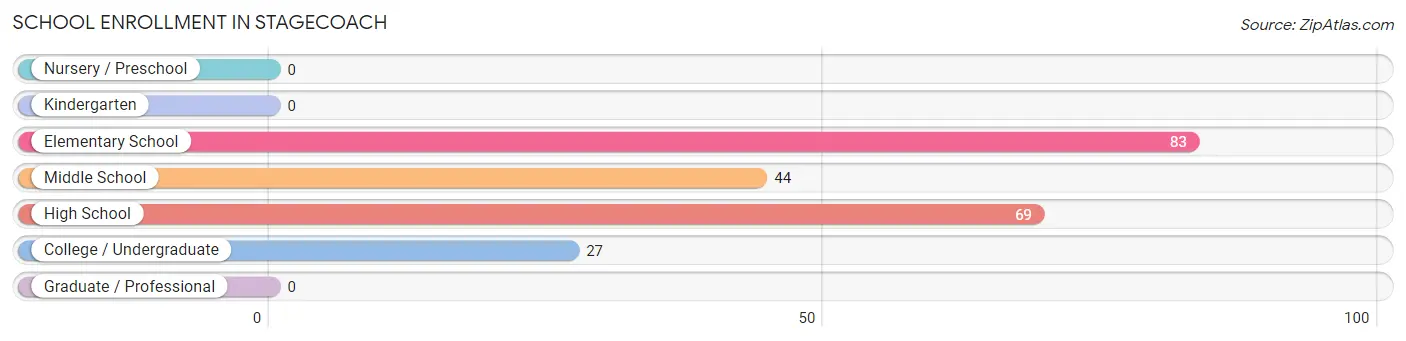
| School Level | # Students | % Students |
| Nursery / Preschool | 0 | 0.0% |
| Kindergarten | 0 | 0.0% |
| Elementary School | 83 | 37.2% |
| Middle School | 44 | 19.7% |
| High School | 69 | 30.9% |
| College / Undergraduate | 27 | 12.1% |
| Graduate / Professional | 0 | 0.0% |
| Total | 223 | 100.0% |
School Enrollment by Age by Funding Source in Stagecoach
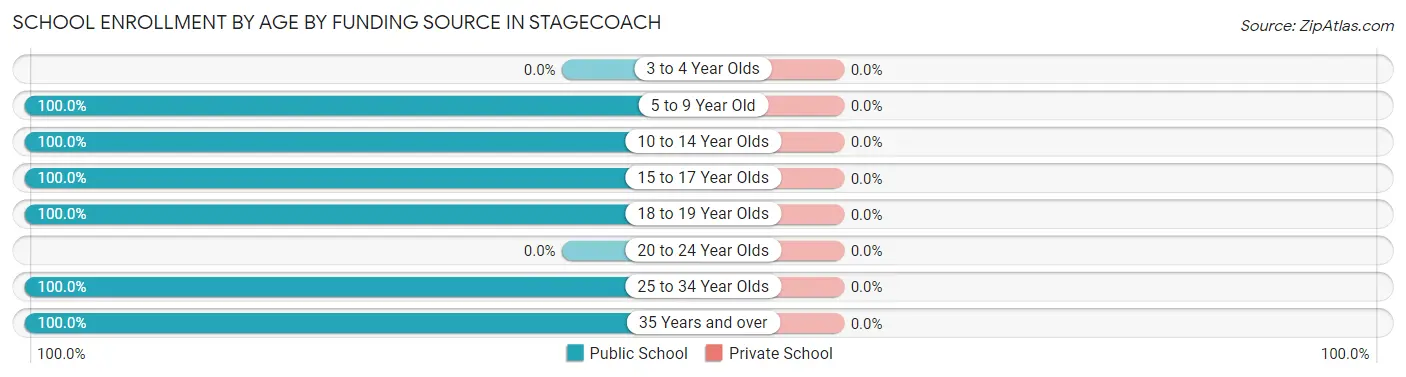
| Age Bracket | Public School | Private School |
| 3 to 4 Year Olds | 0 (0.0%) | 0 (0.0%) |
| 5 to 9 Year Old | 63 (100.0%) | 0 (0.0%) |
| 10 to 14 Year Olds | 49 (100.0%) | 0 (0.0%) |
| 15 to 17 Year Olds | 41 (100.0%) | 0 (0.0%) |
| 18 to 19 Year Olds | 24 (100.0%) | 0 (0.0%) |
| 20 to 24 Year Olds | 0 (0.0%) | 0 (0.0%) |
| 25 to 34 Year Olds | 19 (100.0%) | 0 (0.0%) |
| 35 Years and over | 27 (100.0%) | 0 (0.0%) |
| Total | 223 (100.0%) | 0 (0.0%) |
Educational Attainment by Field of Study in Stagecoach
Computers & mathematics (36 | 21.6%), liberal arts & history (31 | 18.6%), science & technology (27 | 16.2%), psychology (23 | 13.8%), and education (15 | 9.0%) are the most common fields of study among 167 individuals in Stagecoach who have obtained a bachelor's degree or higher.
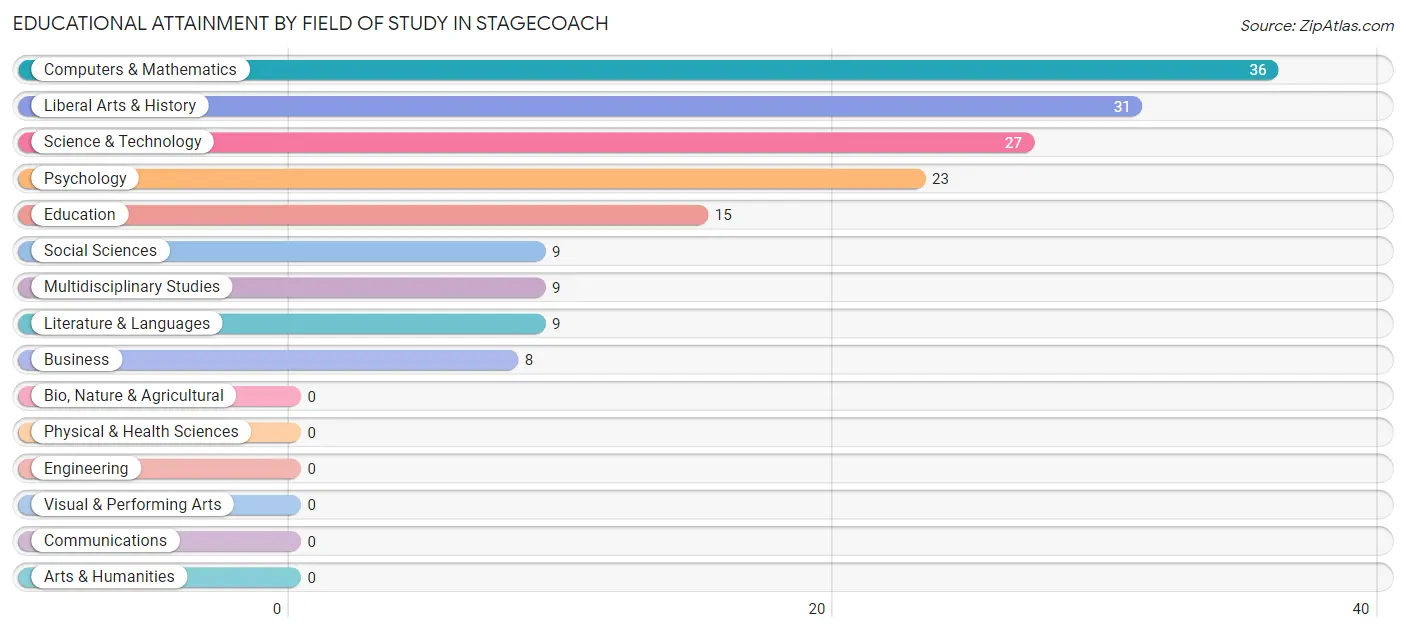
| Field of Study | # Graduates | % Graduates |
| Computers & Mathematics | 36 | 21.6% |
| Bio, Nature & Agricultural | 0 | 0.0% |
| Physical & Health Sciences | 0 | 0.0% |
| Psychology | 23 | 13.8% |
| Social Sciences | 9 | 5.4% |
| Engineering | 0 | 0.0% |
| Multidisciplinary Studies | 9 | 5.4% |
| Science & Technology | 27 | 16.2% |
| Business | 8 | 4.8% |
| Education | 15 | 9.0% |
| Literature & Languages | 9 | 5.4% |
| Liberal Arts & History | 31 | 18.6% |
| Visual & Performing Arts | 0 | 0.0% |
| Communications | 0 | 0.0% |
| Arts & Humanities | 0 | 0.0% |
| Total | 167 | 100.0% |
Transportation & Commute in Stagecoach
Vehicle Availability by Sex in Stagecoach
The most prevalent vehicle ownership categories in Stagecoach are males with 3 vehicles (233, accounting for 52.8%) and females with 3 vehicles (211, making up 59.9%).
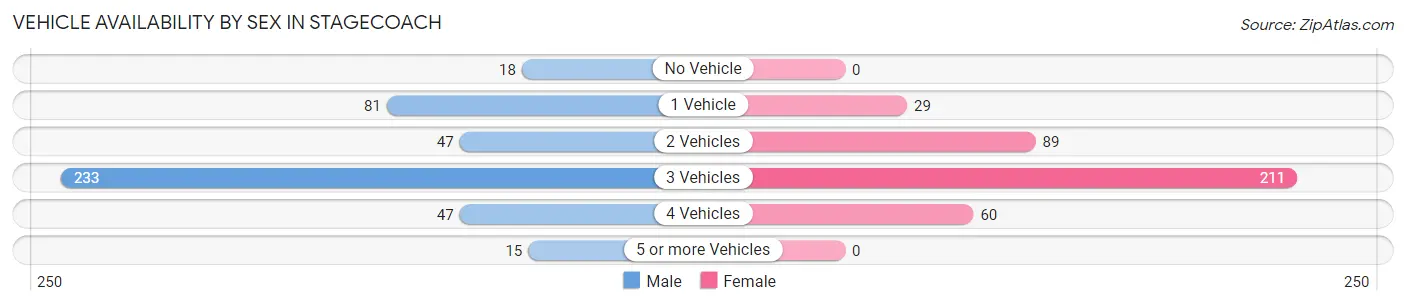
| Vehicles Available | Male | Female |
| No Vehicle | 18 (4.1%) | 0 (0.0%) |
| 1 Vehicle | 81 (18.4%) | 29 (7.5%) |
| 2 Vehicles | 47 (10.7%) | 89 (22.9%) |
| 3 Vehicles | 233 (52.8%) | 211 (54.2%) |
| 4 Vehicles | 47 (10.7%) | 60 (15.4%) |
| 5 or more Vehicles | 15 (3.4%) | 0 (0.0%) |
| Total | 441 (100.0%) | 389 (100.0%) |
Commute Time in Stagecoach
The most frequently occuring commute durations in Stagecoach are 20 to 24 minutes (128 commuters, 15.7%), 10 to 14 minutes (114 commuters, 13.9%), and 45 to 59 minutes (111 commuters, 13.6%).
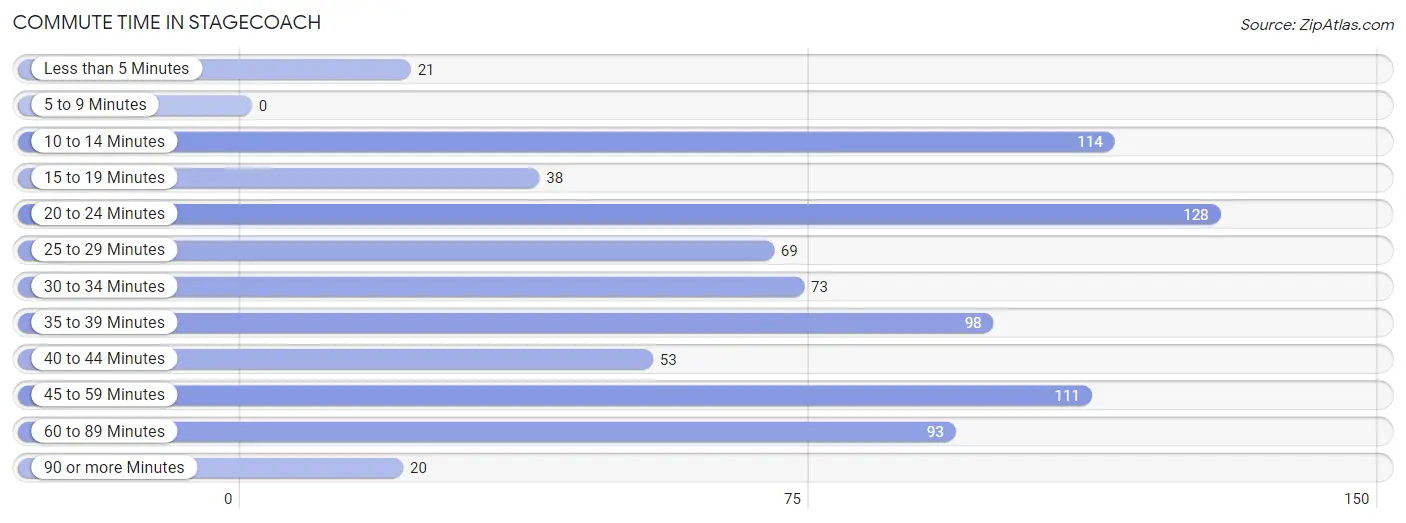
| Commute Time | # Commuters | % Commuters |
| Less than 5 Minutes | 21 | 2.6% |
| 5 to 9 Minutes | 0 | 0.0% |
| 10 to 14 Minutes | 114 | 13.9% |
| 15 to 19 Minutes | 38 | 4.6% |
| 20 to 24 Minutes | 128 | 15.7% |
| 25 to 29 Minutes | 69 | 8.4% |
| 30 to 34 Minutes | 73 | 8.9% |
| 35 to 39 Minutes | 98 | 12.0% |
| 40 to 44 Minutes | 53 | 6.5% |
| 45 to 59 Minutes | 111 | 13.6% |
| 60 to 89 Minutes | 93 | 11.4% |
| 90 or more Minutes | 20 | 2.4% |
Commute Time by Sex in Stagecoach
The most common commute times in Stagecoach are 10 to 14 minutes (106 commuters, 24.7%) for males and 20 to 24 minutes (96 commuters, 24.7%) for females.
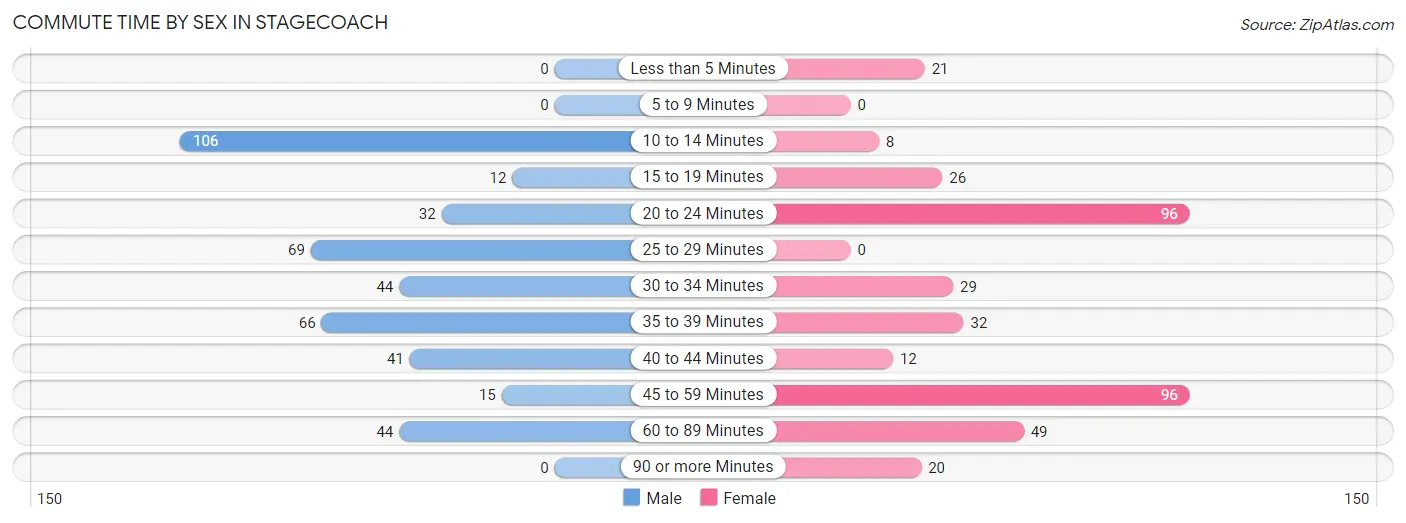
| Commute Time | Male | Female |
| Less than 5 Minutes | 0 (0.0%) | 21 (5.4%) |
| 5 to 9 Minutes | 0 (0.0%) | 0 (0.0%) |
| 10 to 14 Minutes | 106 (24.7%) | 8 (2.1%) |
| 15 to 19 Minutes | 12 (2.8%) | 26 (6.7%) |
| 20 to 24 Minutes | 32 (7.5%) | 96 (24.7%) |
| 25 to 29 Minutes | 69 (16.1%) | 0 (0.0%) |
| 30 to 34 Minutes | 44 (10.3%) | 29 (7.5%) |
| 35 to 39 Minutes | 66 (15.4%) | 32 (8.2%) |
| 40 to 44 Minutes | 41 (9.6%) | 12 (3.1%) |
| 45 to 59 Minutes | 15 (3.5%) | 96 (24.7%) |
| 60 to 89 Minutes | 44 (10.3%) | 49 (12.6%) |
| 90 or more Minutes | 0 (0.0%) | 20 (5.1%) |
Time of Departure to Work by Sex in Stagecoach
The most frequent times of departure to work in Stagecoach are 12:00 AM to 4:59 AM (119, 27.7%) for males and 7:30 AM to 7:59 AM (166, 42.7%) for females.
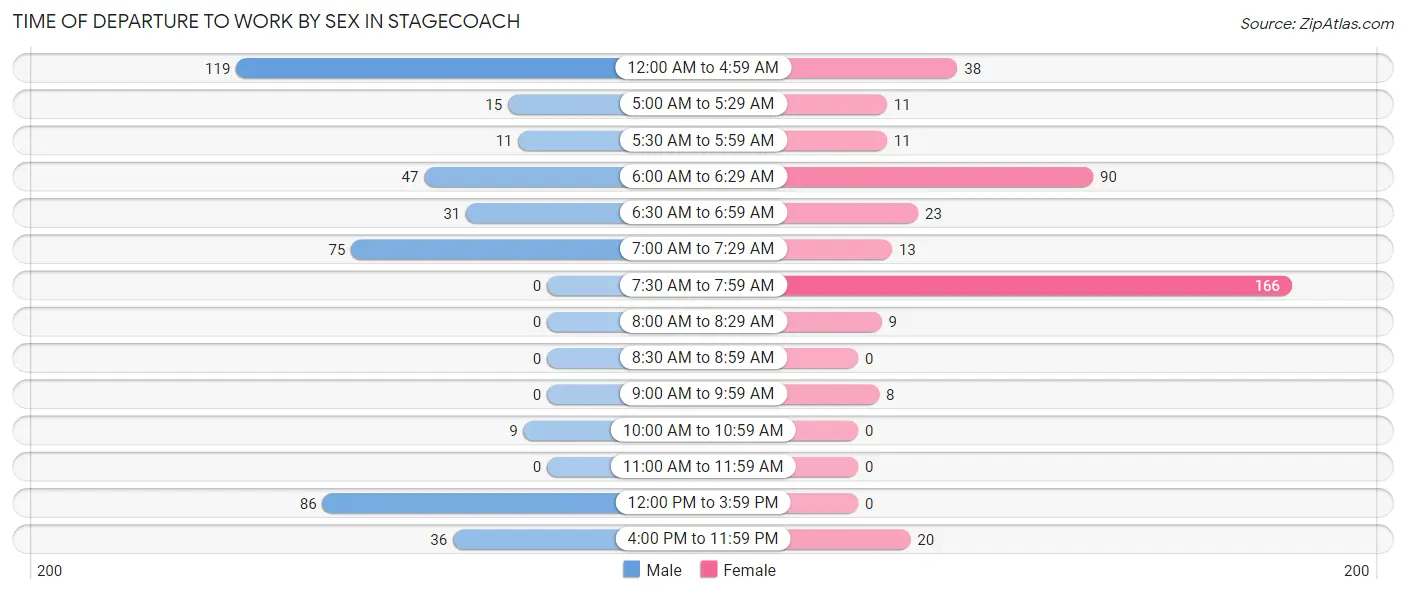
| Time of Departure | Male | Female |
| 12:00 AM to 4:59 AM | 119 (27.7%) | 38 (9.8%) |
| 5:00 AM to 5:29 AM | 15 (3.5%) | 11 (2.8%) |
| 5:30 AM to 5:59 AM | 11 (2.6%) | 11 (2.8%) |
| 6:00 AM to 6:29 AM | 47 (11.0%) | 90 (23.1%) |
| 6:30 AM to 6:59 AM | 31 (7.2%) | 23 (5.9%) |
| 7:00 AM to 7:29 AM | 75 (17.5%) | 13 (3.3%) |
| 7:30 AM to 7:59 AM | 0 (0.0%) | 166 (42.7%) |
| 8:00 AM to 8:29 AM | 0 (0.0%) | 9 (2.3%) |
| 8:30 AM to 8:59 AM | 0 (0.0%) | 0 (0.0%) |
| 9:00 AM to 9:59 AM | 0 (0.0%) | 8 (2.1%) |
| 10:00 AM to 10:59 AM | 9 (2.1%) | 0 (0.0%) |
| 11:00 AM to 11:59 AM | 0 (0.0%) | 0 (0.0%) |
| 12:00 PM to 3:59 PM | 86 (20.1%) | 0 (0.0%) |
| 4:00 PM to 11:59 PM | 36 (8.4%) | 20 (5.1%) |
| Total | 429 (100.0%) | 389 (100.0%) |
Housing Occupancy in Stagecoach
Occupancy by Ownership in Stagecoach
Of the total 825 dwellings in Stagecoach, owner-occupied units account for 759 (92.0%), while renter-occupied units make up 66 (8.0%).
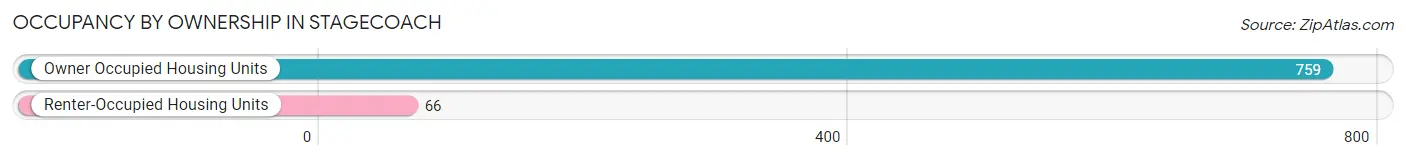
| Occupancy | # Housing Units | % Housing Units |
| Owner Occupied Housing Units | 759 | 92.0% |
| Renter-Occupied Housing Units | 66 | 8.0% |
| Total Occupied Housing Units | 825 | 100.0% |
Occupancy by Household Size in Stagecoach
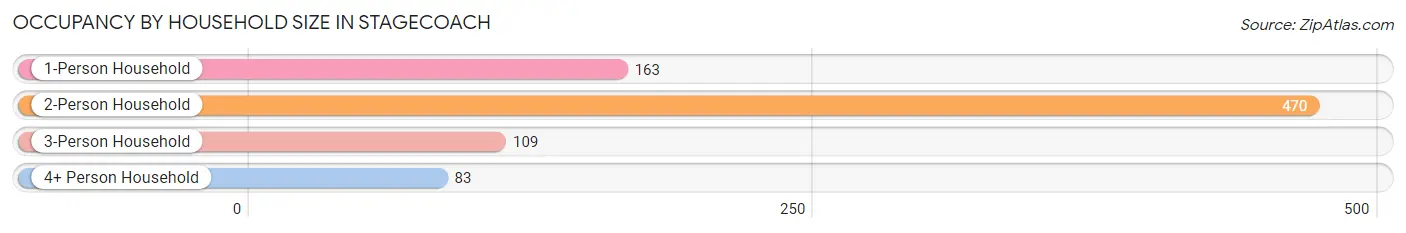
| Household Size | # Housing Units | % Housing Units |
| 1-Person Household | 163 | 19.8% |
| 2-Person Household | 470 | 57.0% |
| 3-Person Household | 109 | 13.2% |
| 4+ Person Household | 83 | 10.1% |
| Total Housing Units | 825 | 100.0% |
Occupancy by Ownership by Household Size in Stagecoach
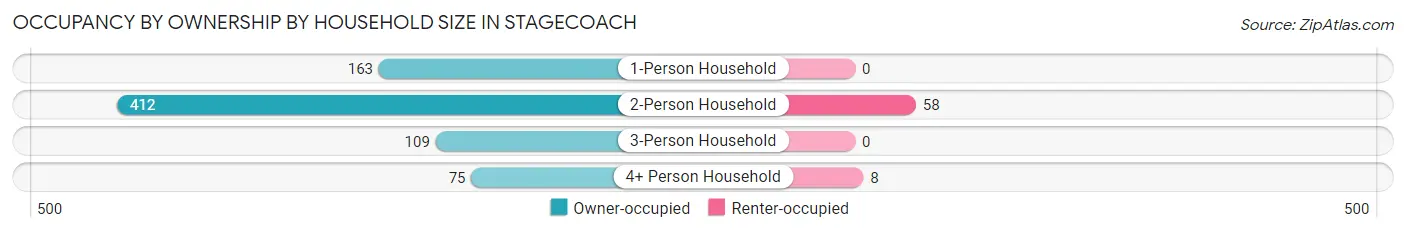
| Household Size | Owner-occupied | Renter-occupied |
| 1-Person Household | 163 (100.0%) | 0 (0.0%) |
| 2-Person Household | 412 (87.7%) | 58 (12.3%) |
| 3-Person Household | 109 (100.0%) | 0 (0.0%) |
| 4+ Person Household | 75 (90.4%) | 8 (9.6%) |
| Total Housing Units | 759 (92.0%) | 66 (8.0%) |
Occupancy by Educational Attainment in Stagecoach
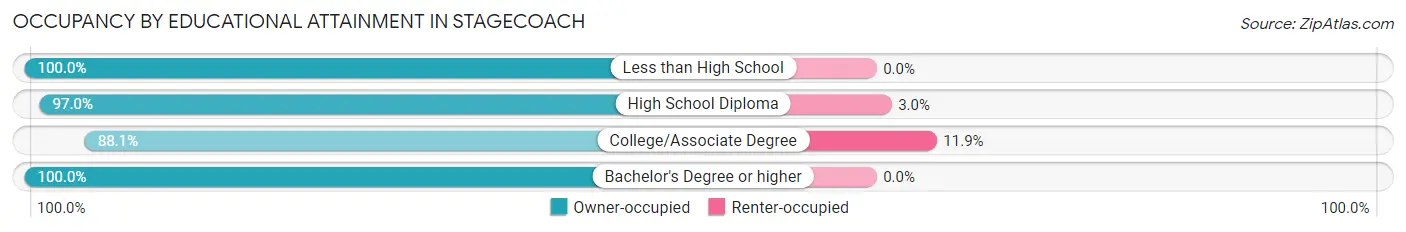
| Household Size | Owner-occupied | Renter-occupied |
| Less than High School | 16 (100.0%) | 0 (0.0%) |
| High School Diploma | 228 (97.0%) | 7 (3.0%) |
| College/Associate Degree | 435 (88.1%) | 59 (11.9%) |
| Bachelor's Degree or higher | 80 (100.0%) | 0 (0.0%) |
Occupancy by Age of Householder in Stagecoach
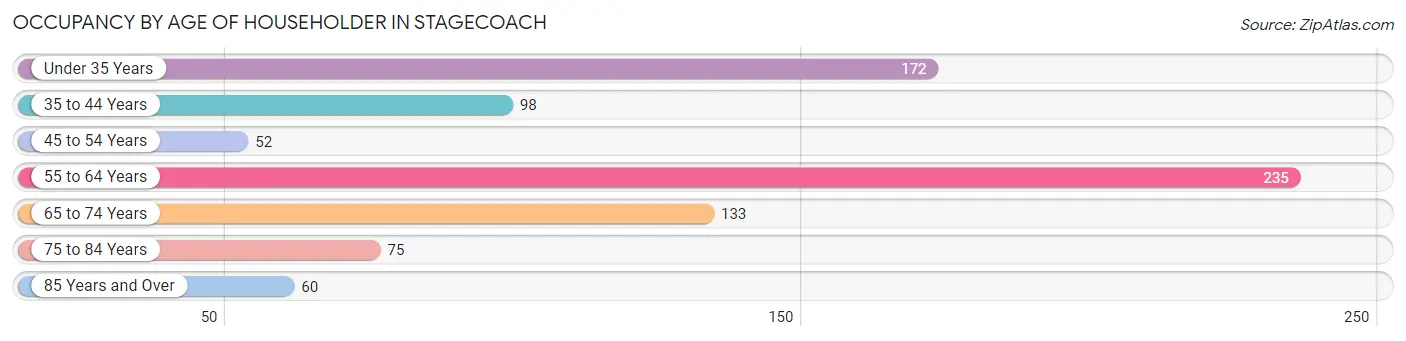
| Age Bracket | # Households | % Households |
| Under 35 Years | 172 | 20.8% |
| 35 to 44 Years | 98 | 11.9% |
| 45 to 54 Years | 52 | 6.3% |
| 55 to 64 Years | 235 | 28.5% |
| 65 to 74 Years | 133 | 16.1% |
| 75 to 84 Years | 75 | 9.1% |
| 85 Years and Over | 60 | 7.3% |
| Total | 825 | 100.0% |
Housing Finances in Stagecoach
Median Income by Occupancy in Stagecoach
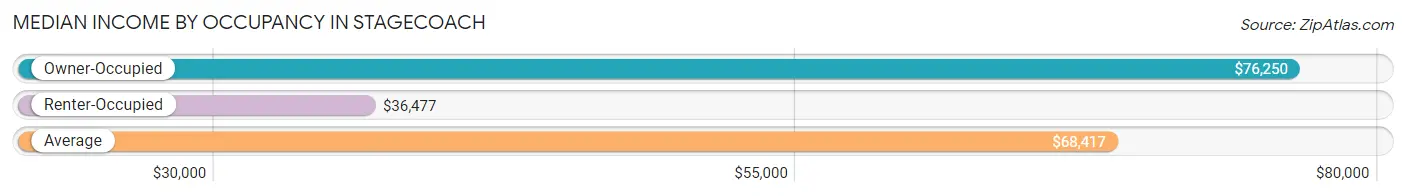
| Occupancy Type | # Households | Median Income |
| Owner-Occupied | 759 (92.0%) | $76,250 |
| Renter-Occupied | 66 (8.0%) | $36,477 |
| Average | 825 (100.0%) | $68,417 |
Occupancy by Householder Income Bracket in Stagecoach
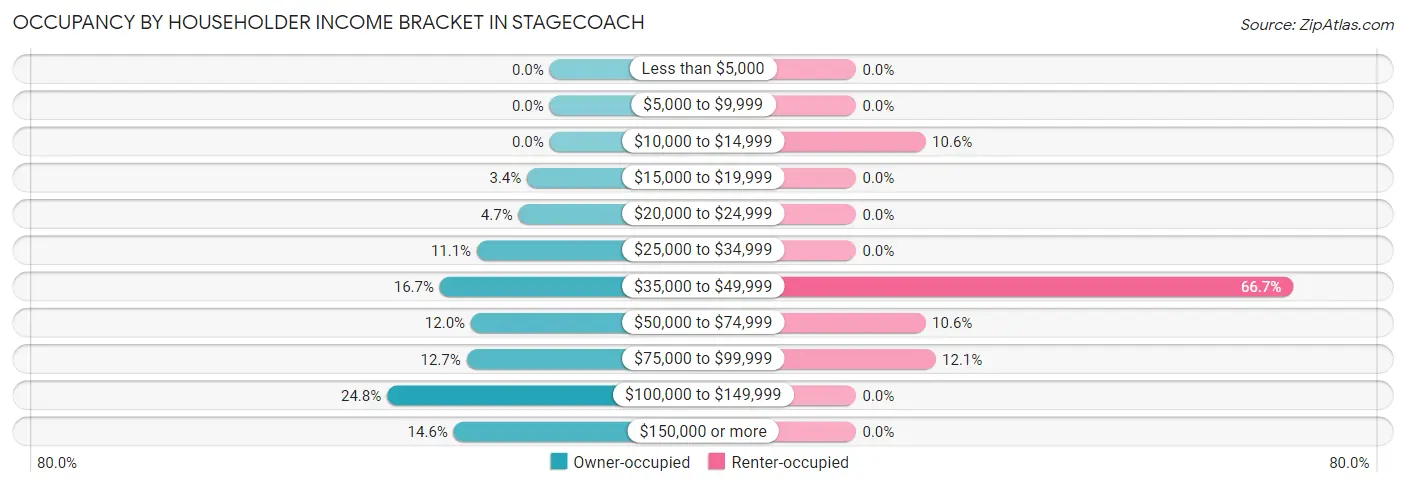
| Income Bracket | Owner-occupied | Renter-occupied |
| Less than $5,000 | 0 (0.0%) | 0 (0.0%) |
| $5,000 to $9,999 | 0 (0.0%) | 0 (0.0%) |
| $10,000 to $14,999 | 0 (0.0%) | 7 (10.6%) |
| $15,000 to $19,999 | 26 (3.4%) | 0 (0.0%) |
| $20,000 to $24,999 | 36 (4.7%) | 0 (0.0%) |
| $25,000 to $34,999 | 84 (11.1%) | 0 (0.0%) |
| $35,000 to $49,999 | 127 (16.7%) | 44 (66.7%) |
| $50,000 to $74,999 | 91 (12.0%) | 7 (10.6%) |
| $75,000 to $99,999 | 96 (12.7%) | 8 (12.1%) |
| $100,000 to $149,999 | 188 (24.8%) | 0 (0.0%) |
| $150,000 or more | 111 (14.6%) | 0 (0.0%) |
| Total | 759 (100.0%) | 66 (100.0%) |
Monthly Housing Cost Tiers in Stagecoach
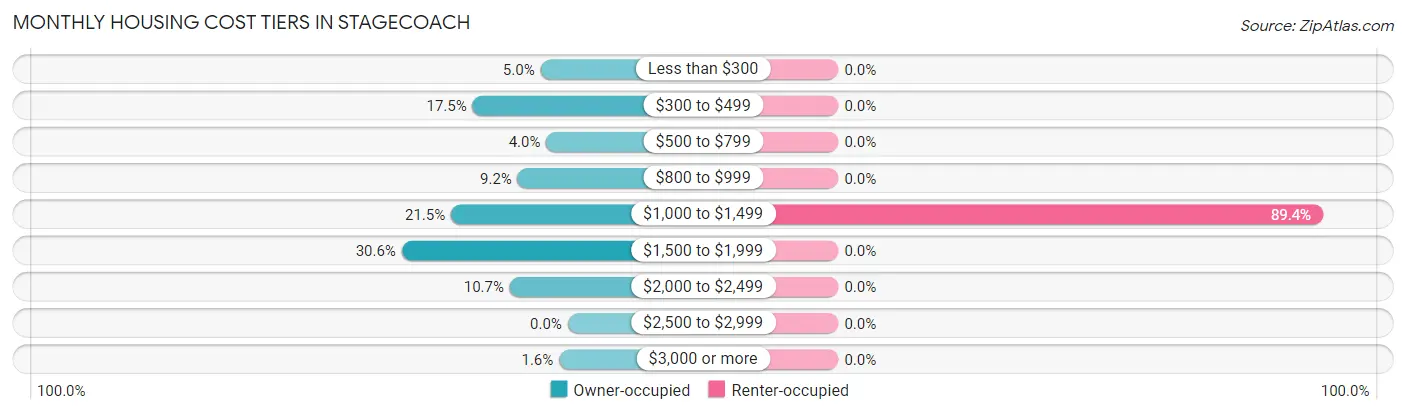
| Monthly Cost | Owner-occupied | Renter-occupied |
| Less than $300 | 38 (5.0%) | 0 (0.0%) |
| $300 to $499 | 133 (17.5%) | 0 (0.0%) |
| $500 to $799 | 30 (4.0%) | 0 (0.0%) |
| $800 to $999 | 70 (9.2%) | 0 (0.0%) |
| $1,000 to $1,499 | 163 (21.5%) | 59 (89.4%) |
| $1,500 to $1,999 | 232 (30.6%) | 0 (0.0%) |
| $2,000 to $2,499 | 81 (10.7%) | 0 (0.0%) |
| $2,500 to $2,999 | 0 (0.0%) | 0 (0.0%) |
| $3,000 or more | 12 (1.6%) | 0 (0.0%) |
| Total | 759 (100.0%) | 66 (100.0%) |
Physical Housing Characteristics in Stagecoach
Housing Structures in Stagecoach
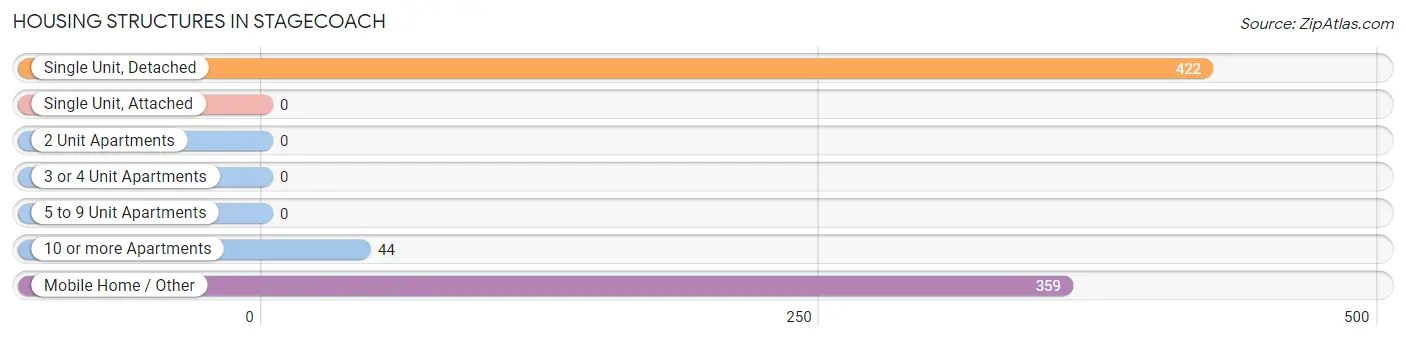
| Structure Type | # Housing Units | % Housing Units |
| Single Unit, Detached | 422 | 51.1% |
| Single Unit, Attached | 0 | 0.0% |
| 2 Unit Apartments | 0 | 0.0% |
| 3 or 4 Unit Apartments | 0 | 0.0% |
| 5 to 9 Unit Apartments | 0 | 0.0% |
| 10 or more Apartments | 44 | 5.3% |
| Mobile Home / Other | 359 | 43.5% |
| Total | 825 | 100.0% |
Housing Structures by Occupancy in Stagecoach
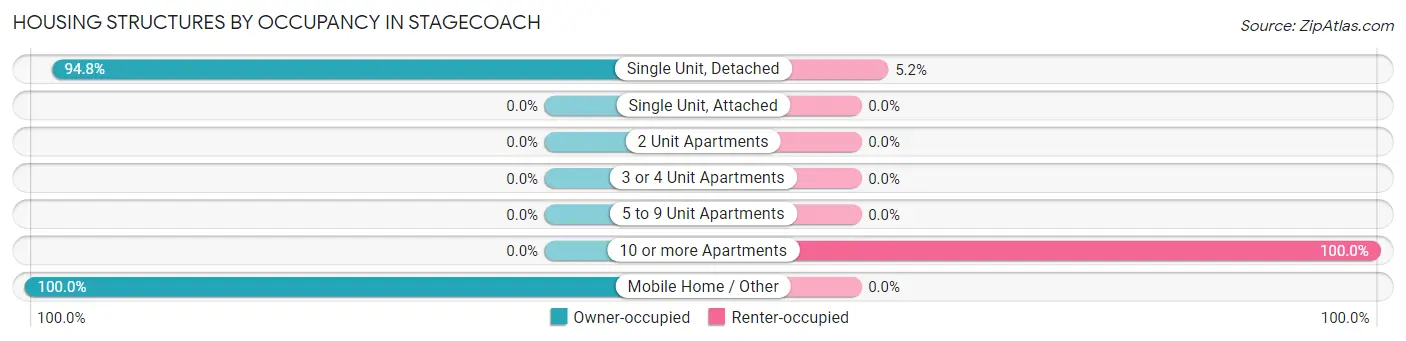
| Structure Type | Owner-occupied | Renter-occupied |
| Single Unit, Detached | 400 (94.8%) | 22 (5.2%) |
| Single Unit, Attached | 0 (0.0%) | 0 (0.0%) |
| 2 Unit Apartments | 0 (0.0%) | 0 (0.0%) |
| 3 or 4 Unit Apartments | 0 (0.0%) | 0 (0.0%) |
| 5 to 9 Unit Apartments | 0 (0.0%) | 0 (0.0%) |
| 10 or more Apartments | 0 (0.0%) | 44 (100.0%) |
| Mobile Home / Other | 359 (100.0%) | 0 (0.0%) |
| Total | 759 (92.0%) | 66 (8.0%) |
Housing Structures by Number of Rooms in Stagecoach
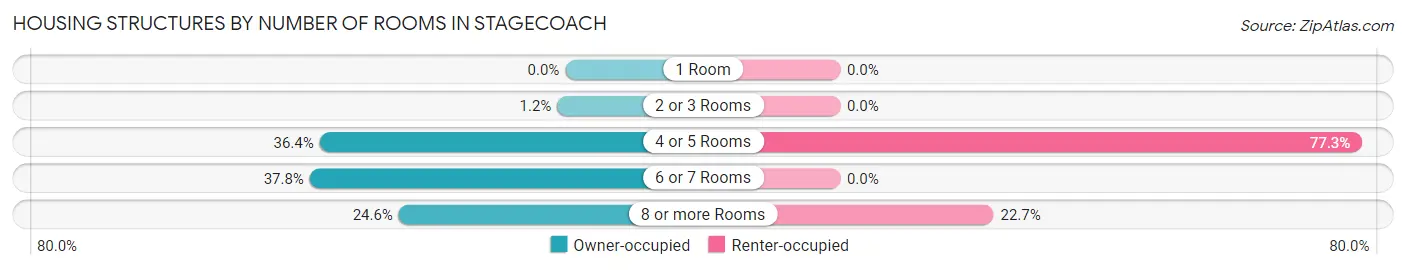
| Number of Rooms | Owner-occupied | Renter-occupied |
| 1 Room | 0 (0.0%) | 0 (0.0%) |
| 2 or 3 Rooms | 9 (1.2%) | 0 (0.0%) |
| 4 or 5 Rooms | 276 (36.4%) | 51 (77.3%) |
| 6 or 7 Rooms | 287 (37.8%) | 0 (0.0%) |
| 8 or more Rooms | 187 (24.6%) | 15 (22.7%) |
| Total | 759 (100.0%) | 66 (100.0%) |
Housing Structure by Heating Type in Stagecoach
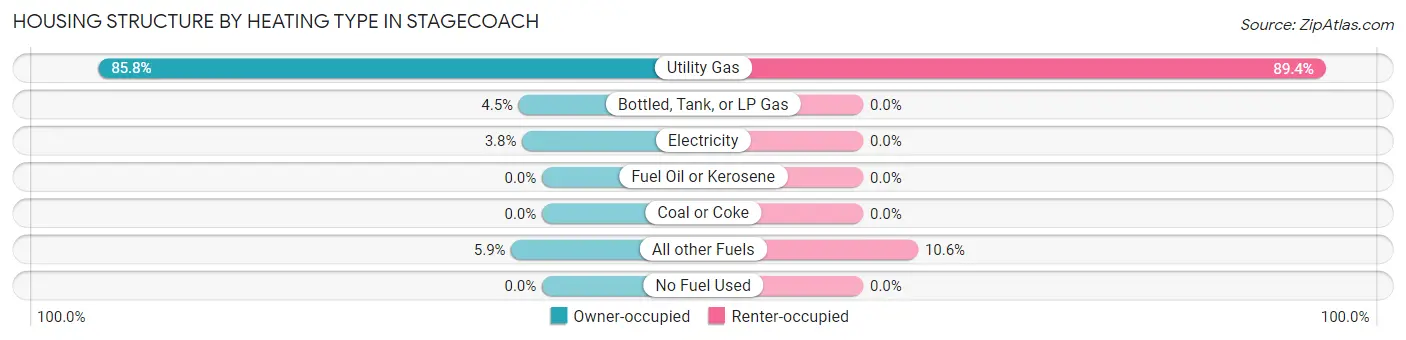
| Heating Type | Owner-occupied | Renter-occupied |
| Utility Gas | 651 (85.8%) | 59 (89.4%) |
| Bottled, Tank, or LP Gas | 34 (4.5%) | 0 (0.0%) |
| Electricity | 29 (3.8%) | 0 (0.0%) |
| Fuel Oil or Kerosene | 0 (0.0%) | 0 (0.0%) |
| Coal or Coke | 0 (0.0%) | 0 (0.0%) |
| All other Fuels | 45 (5.9%) | 7 (10.6%) |
| No Fuel Used | 0 (0.0%) | 0 (0.0%) |
| Total | 759 (100.0%) | 66 (100.0%) |
Household Vehicle Usage in Stagecoach
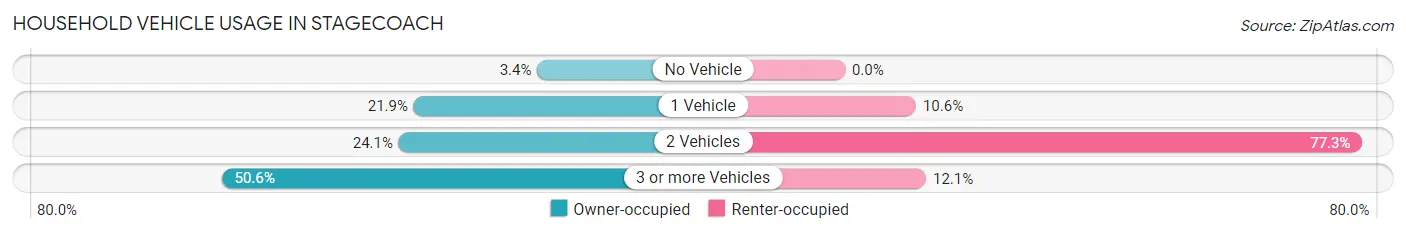
| Vehicles per Household | Owner-occupied | Renter-occupied |
| No Vehicle | 26 (3.4%) | 0 (0.0%) |
| 1 Vehicle | 166 (21.9%) | 7 (10.6%) |
| 2 Vehicles | 183 (24.1%) | 51 (77.3%) |
| 3 or more Vehicles | 384 (50.6%) | 8 (12.1%) |
| Total | 759 (100.0%) | 66 (100.0%) |
Real Estate & Mortgages in Stagecoach
Real Estate and Mortgage Overview in Stagecoach
| Characteristic | Without Mortgage | With Mortgage |
| Housing Units | 243 | 516 |
| Median Property Value | $222,900 | $284,500 |
| Median Household Income | $77,750 | $24 |
| Monthly Housing Costs | $433 | $0 |
| Real Estate Taxes | $740 | $101 |
Property Value by Mortgage Status in Stagecoach
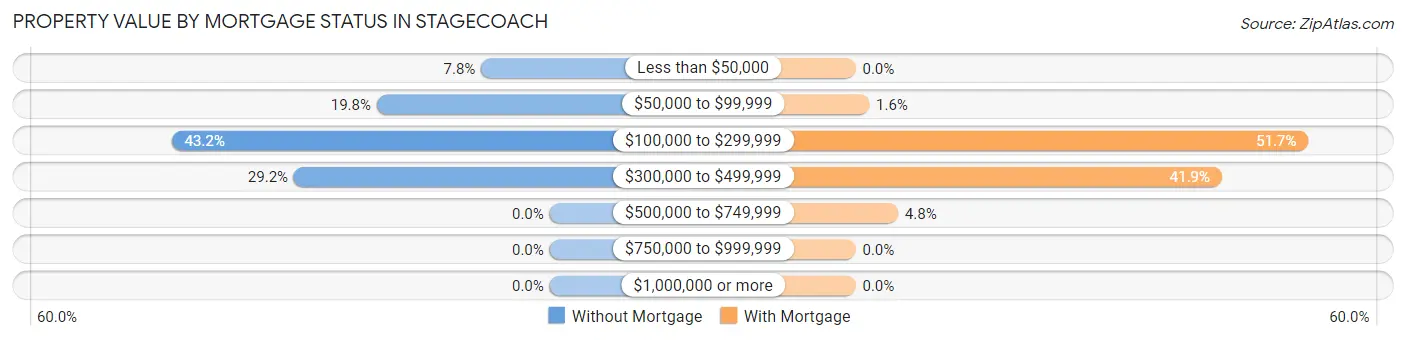
| Property Value | Without Mortgage | With Mortgage |
| Less than $50,000 | 19 (7.8%) | 0 (0.0%) |
| $50,000 to $99,999 | 48 (19.8%) | 8 (1.5%) |
| $100,000 to $299,999 | 105 (43.2%) | 267 (51.7%) |
| $300,000 to $499,999 | 71 (29.2%) | 216 (41.9%) |
| $500,000 to $749,999 | 0 (0.0%) | 25 (4.8%) |
| $750,000 to $999,999 | 0 (0.0%) | 0 (0.0%) |
| $1,000,000 or more | 0 (0.0%) | 0 (0.0%) |
| Total | 243 (100.0%) | 516 (100.0%) |
Household Income by Mortgage Status in Stagecoach
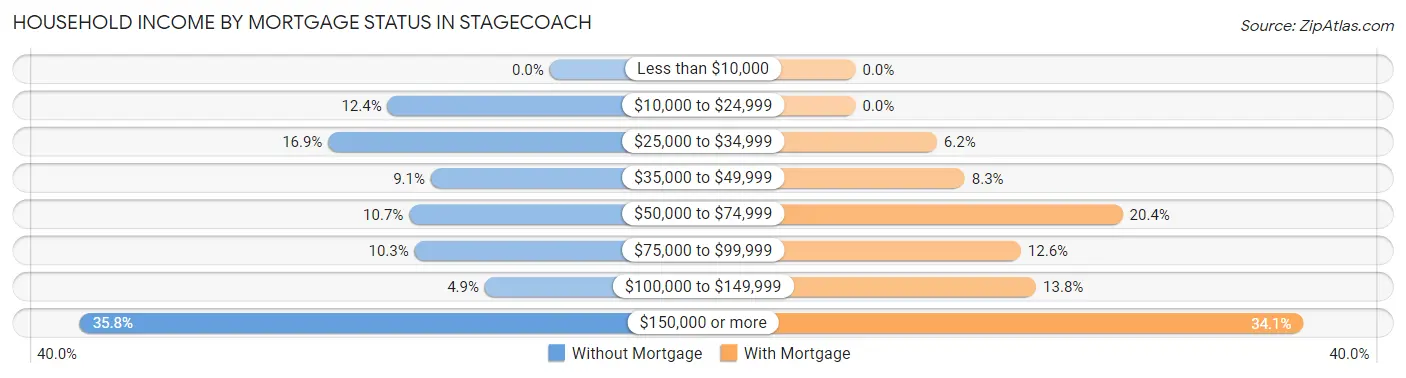
| Household Income | Without Mortgage | With Mortgage |
| Less than $10,000 | 0 (0.0%) | 0 (0.0%) |
| $10,000 to $24,999 | 30 (12.3%) | 0 (0.0%) |
| $25,000 to $34,999 | 41 (16.9%) | 32 (6.2%) |
| $35,000 to $49,999 | 22 (9.0%) | 43 (8.3%) |
| $50,000 to $74,999 | 26 (10.7%) | 105 (20.3%) |
| $75,000 to $99,999 | 25 (10.3%) | 65 (12.6%) |
| $100,000 to $149,999 | 12 (4.9%) | 71 (13.8%) |
| $150,000 or more | 87 (35.8%) | 176 (34.1%) |
| Total | 243 (100.0%) | 516 (100.0%) |
Property Value to Household Income Ratio in Stagecoach
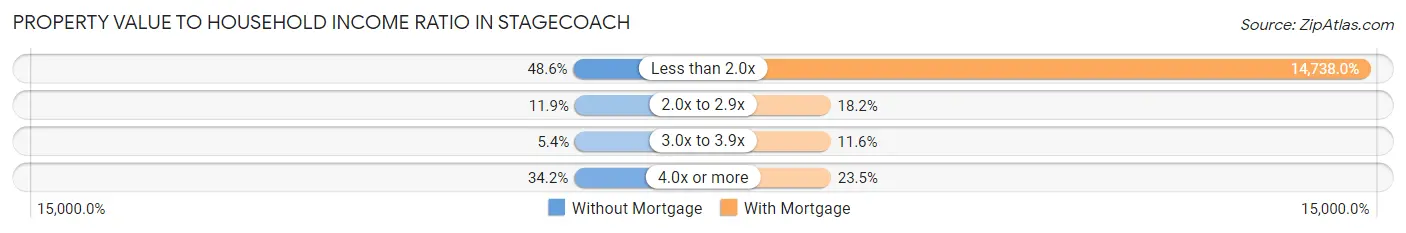
| Value-to-Income Ratio | Without Mortgage | With Mortgage |
| Less than 2.0x | 118 (48.6%) | 76,048 (14,738.0%) |
| 2.0x to 2.9x | 29 (11.9%) | 94 (18.2%) |
| 3.0x to 3.9x | 13 (5.3%) | 60 (11.6%) |
| 4.0x or more | 83 (34.2%) | 121 (23.4%) |
| Total | 243 (100.0%) | 516 (100.0%) |
Real Estate Taxes by Mortgage Status in Stagecoach

| Property Taxes | Without Mortgage | With Mortgage |
| Less than $800 | 143 (58.9%) | 0 (0.0%) |
| $800 to $1,499 | 35 (14.4%) | 106 (20.5%) |
| $800 to $1,499 | 48 (19.8%) | 201 (39.0%) |
| Total | 243 (100.0%) | 516 (100.0%) |
Health & Disability in Stagecoach
Health Insurance Coverage by Age in Stagecoach
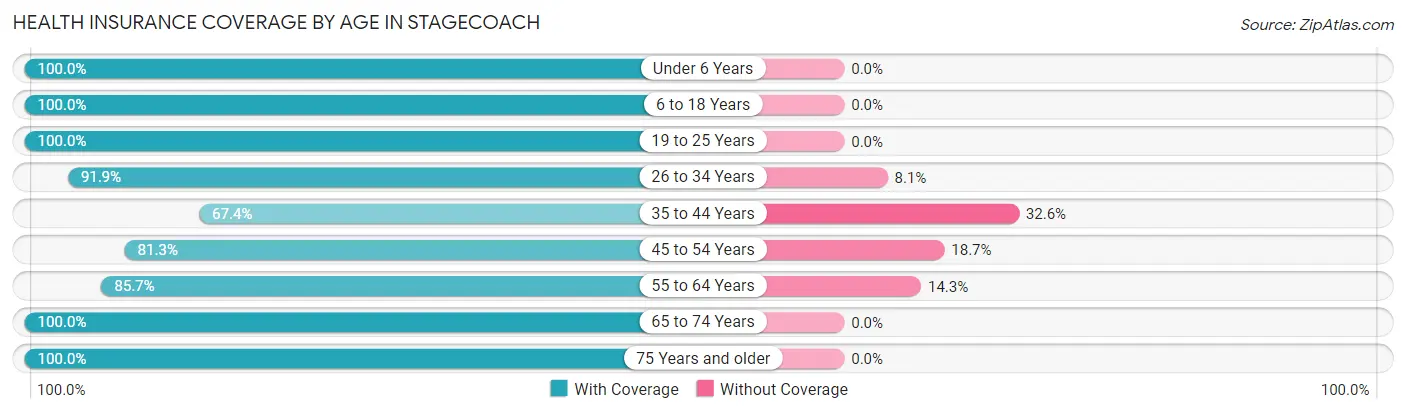
| Age Bracket | With Coverage | Without Coverage |
| Under 6 Years | 15 (100.0%) | 0 (0.0%) |
| 6 to 18 Years | 191 (100.0%) | 0 (0.0%) |
| 19 to 25 Years | 116 (100.0%) | 0 (0.0%) |
| 26 to 34 Years | 262 (91.9%) | 23 (8.1%) |
| 35 to 44 Years | 203 (67.4%) | 98 (32.6%) |
| 45 to 54 Years | 109 (81.3%) | 25 (18.7%) |
| 55 to 64 Years | 317 (85.7%) | 53 (14.3%) |
| 65 to 74 Years | 303 (100.0%) | 0 (0.0%) |
| 75 Years and older | 189 (100.0%) | 0 (0.0%) |
| Total | 1,705 (89.5%) | 199 (10.4%) |
Health Insurance Coverage by Citizenship Status in Stagecoach

| Citizenship Status | With Coverage | Without Coverage |
| Native Born | 15 (100.0%) | 0 (0.0%) |
| Foreign Born, Citizen | 191 (100.0%) | 0 (0.0%) |
| Foreign Born, not a Citizen | 116 (100.0%) | 0 (0.0%) |
Health Insurance Coverage by Household Income in Stagecoach
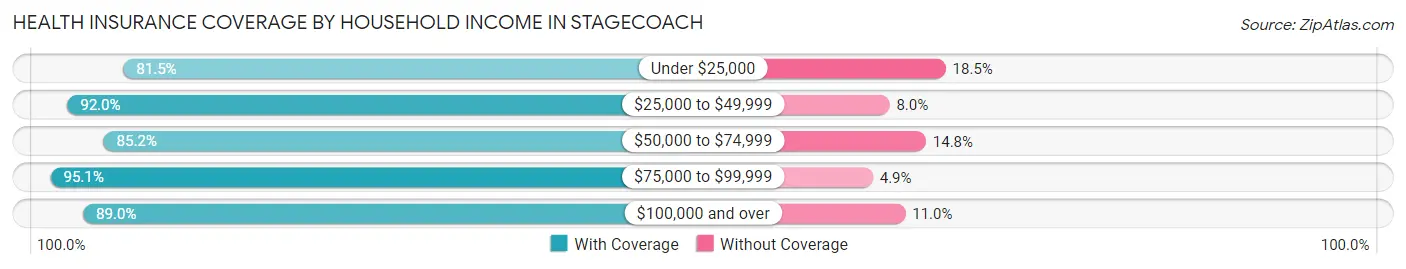
| Household Income | With Coverage | Without Coverage |
| Under $25,000 | 88 (81.5%) | 20 (18.5%) |
| $25,000 to $49,999 | 437 (92.0%) | 38 (8.0%) |
| $50,000 to $74,999 | 276 (85.2%) | 48 (14.8%) |
| $75,000 to $99,999 | 254 (95.1%) | 13 (4.9%) |
| $100,000 and over | 650 (89.0%) | 80 (11.0%) |
Public vs Private Health Insurance Coverage by Age in Stagecoach
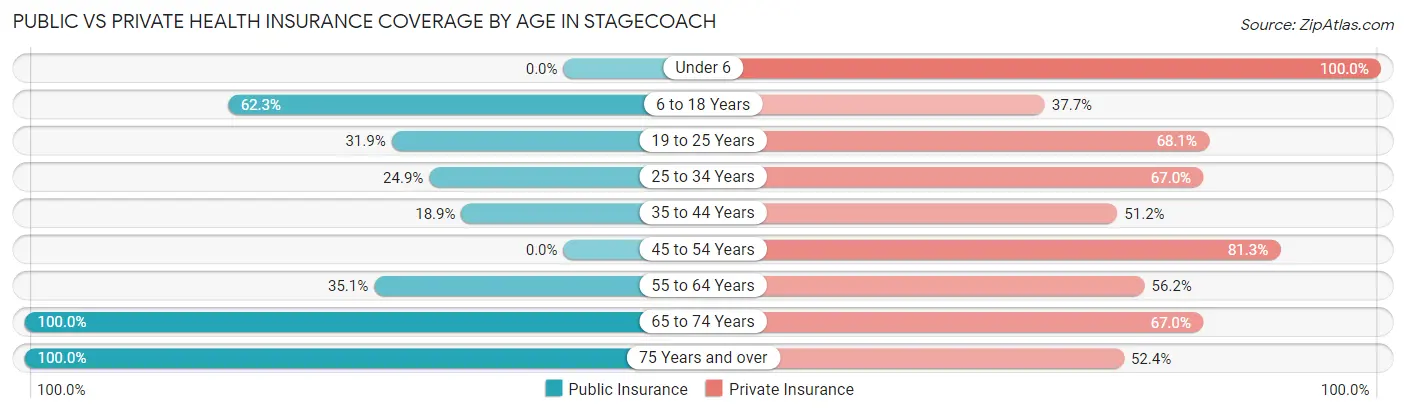
| Age Bracket | Public Insurance | Private Insurance |
| Under 6 | 0 (0.0%) | 15 (100.0%) |
| 6 to 18 Years | 119 (62.3%) | 72 (37.7%) |
| 19 to 25 Years | 37 (31.9%) | 79 (68.1%) |
| 25 to 34 Years | 71 (24.9%) | 191 (67.0%) |
| 35 to 44 Years | 57 (18.9%) | 154 (51.2%) |
| 45 to 54 Years | 0 (0.0%) | 109 (81.3%) |
| 55 to 64 Years | 130 (35.1%) | 208 (56.2%) |
| 65 to 74 Years | 303 (100.0%) | 203 (67.0%) |
| 75 Years and over | 189 (100.0%) | 99 (52.4%) |
| Total | 906 (47.6%) | 1,130 (59.4%) |
Disability Status by Sex by Age in Stagecoach
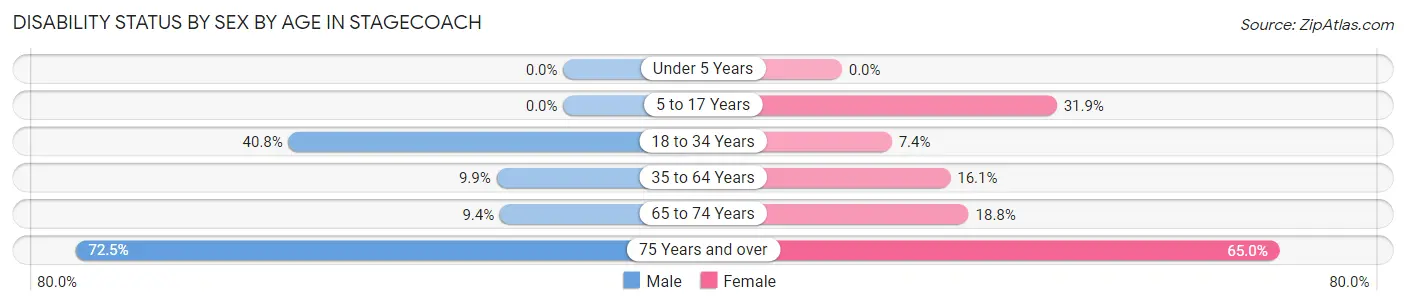
| Age Bracket | Male | Female |
| Under 5 Years | 0 (0.0%) | 0 (0.0%) |
| 5 to 17 Years | 0 (0.0%) | 15 (31.9%) |
| 18 to 34 Years | 102 (40.8%) | 14 (7.4%) |
| 35 to 64 Years | 38 (9.9%) | 68 (16.1%) |
| 65 to 74 Years | 14 (9.4%) | 29 (18.8%) |
| 75 Years and over | 50 (72.5%) | 78 (65.0%) |
Disability Class by Sex by Age in Stagecoach
Disability Class: Hearing Difficulty
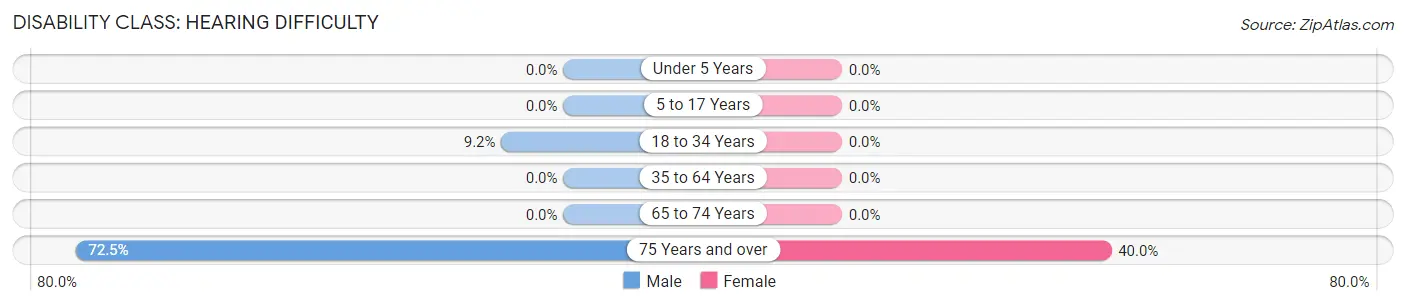
| Age Bracket | Male | Female |
| Under 5 Years | 0 (0.0%) | 0 (0.0%) |
| 5 to 17 Years | 0 (0.0%) | 0 (0.0%) |
| 18 to 34 Years | 23 (9.2%) | 0 (0.0%) |
| 35 to 64 Years | 0 (0.0%) | 0 (0.0%) |
| 65 to 74 Years | 0 (0.0%) | 0 (0.0%) |
| 75 Years and over | 50 (72.5%) | 48 (40.0%) |
Disability Class: Vision Difficulty
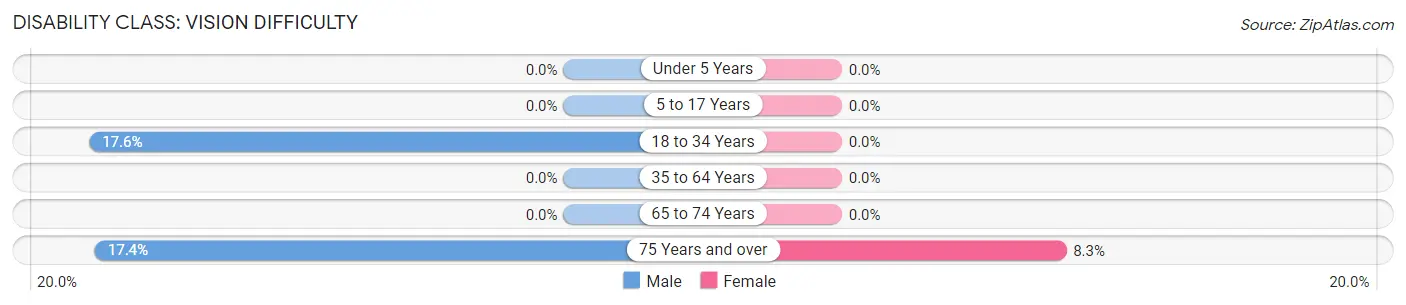
| Age Bracket | Male | Female |
| Under 5 Years | 0 (0.0%) | 0 (0.0%) |
| 5 to 17 Years | 0 (0.0%) | 0 (0.0%) |
| 18 to 34 Years | 44 (17.6%) | 0 (0.0%) |
| 35 to 64 Years | 0 (0.0%) | 0 (0.0%) |
| 65 to 74 Years | 0 (0.0%) | 0 (0.0%) |
| 75 Years and over | 12 (17.4%) | 10 (8.3%) |
Disability Class: Cognitive Difficulty
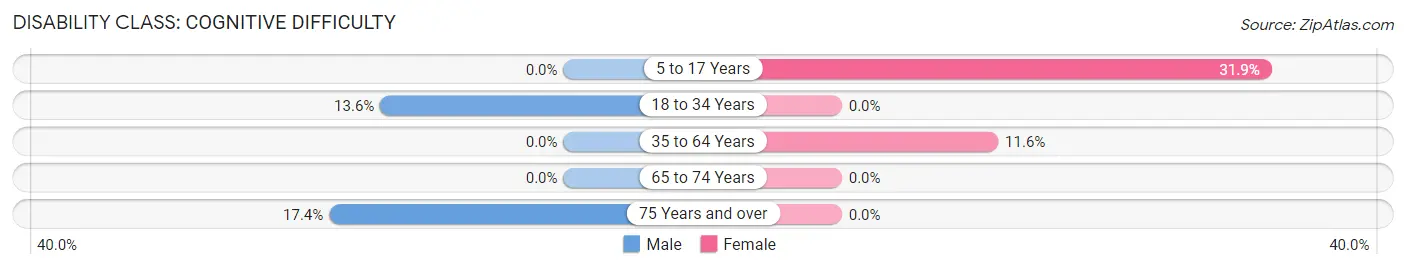
| Age Bracket | Male | Female |
| 5 to 17 Years | 0 (0.0%) | 15 (31.9%) |
| 18 to 34 Years | 34 (13.6%) | 0 (0.0%) |
| 35 to 64 Years | 0 (0.0%) | 49 (11.6%) |
| 65 to 74 Years | 0 (0.0%) | 0 (0.0%) |
| 75 Years and over | 12 (17.4%) | 0 (0.0%) |
Disability Class: Ambulatory Difficulty
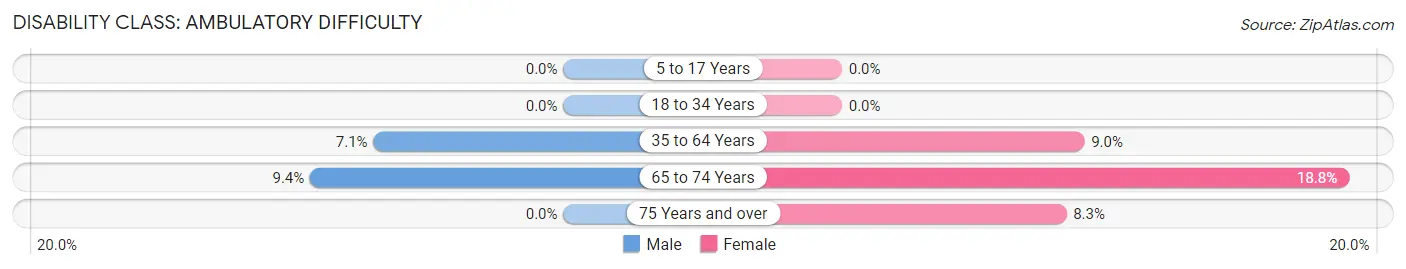
| Age Bracket | Male | Female |
| 5 to 17 Years | 0 (0.0%) | 0 (0.0%) |
| 18 to 34 Years | 0 (0.0%) | 0 (0.0%) |
| 35 to 64 Years | 27 (7.0%) | 38 (9.0%) |
| 65 to 74 Years | 14 (9.4%) | 29 (18.8%) |
| 75 Years and over | 0 (0.0%) | 10 (8.3%) |
Disability Class: Self-Care Difficulty
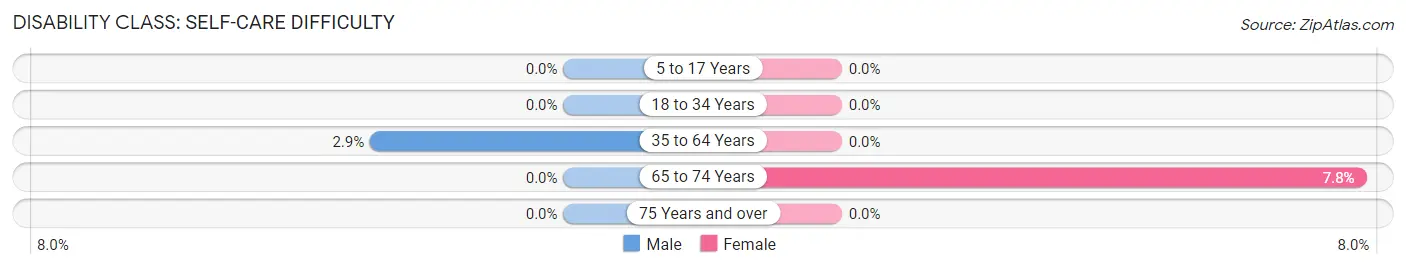
| Age Bracket | Male | Female |
| 5 to 17 Years | 0 (0.0%) | 0 (0.0%) |
| 18 to 34 Years | 0 (0.0%) | 0 (0.0%) |
| 35 to 64 Years | 11 (2.9%) | 0 (0.0%) |
| 65 to 74 Years | 0 (0.0%) | 12 (7.8%) |
| 75 Years and over | 0 (0.0%) | 0 (0.0%) |
Technology Access in Stagecoach
Computing Device Access in Stagecoach
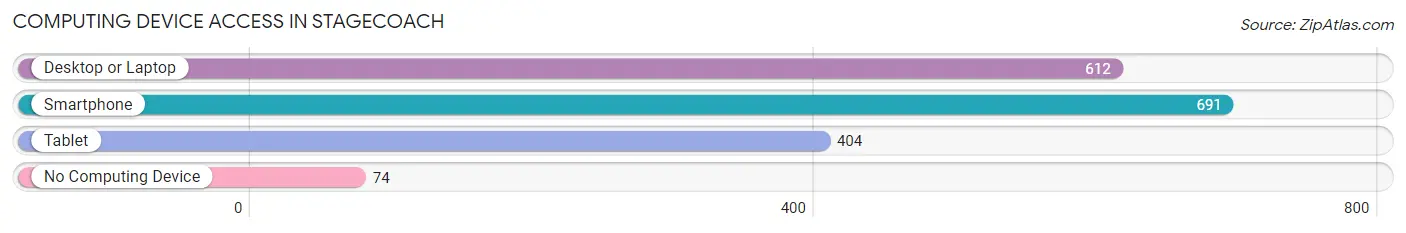
| Device Type | # Households | % Households |
| Desktop or Laptop | 612 | 74.2% |
| Smartphone | 691 | 83.8% |
| Tablet | 404 | 49.0% |
| No Computing Device | 74 | 9.0% |
| Total | 825 | 100.0% |
Internet Access in Stagecoach
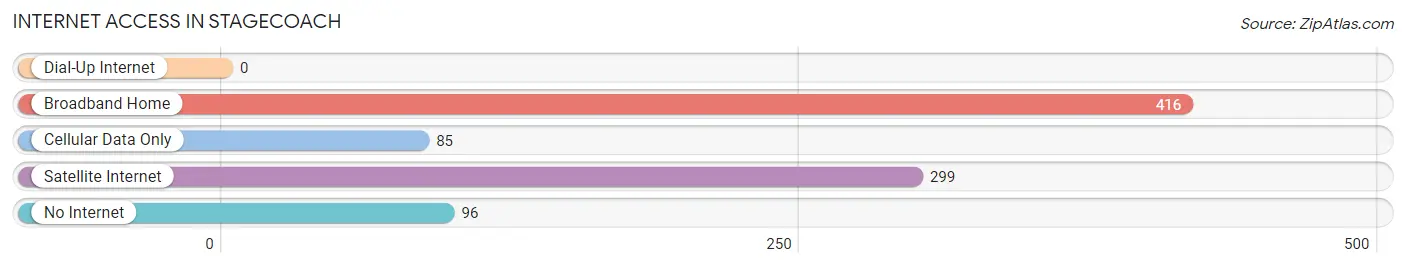
| Internet Type | # Households | % Households |
| Dial-Up Internet | 0 | 0.0% |
| Broadband Home | 416 | 50.4% |
| Cellular Data Only | 85 | 10.3% |
| Satellite Internet | 299 | 36.2% |
| No Internet | 96 | 11.6% |
| Total | 825 | 100.0% |
Stagecoach Summary
Stagecoach, Nevada is a small unincorporated community located in Lyon County, Nevada. It is situated in the western part of the state, approximately 30 miles south of Reno and 40 miles east of Carson City. The community is located in the foothills of the Sierra Nevada mountain range, and is surrounded by the Toiyabe National Forest.
History
Stagecoach, Nevada was founded in the late 1800s as a stagecoach stop along the Carson and Colorado Railroad. The railroad was built to connect the silver mining towns of Virginia City and Austin, and Stagecoach was a convenient stop along the way. The town was named after the stagecoaches that stopped there, and it quickly became a popular spot for travelers.
In the early 1900s, the town began to grow and develop. A post office was established in 1906, and a school was built in 1908. The town also had a general store, a blacksmith shop, and a saloon.
In the 1950s, the town began to decline as the railroad was abandoned and the stagecoaches stopped running. The post office closed in 1959, and the school closed in 1962. The town was nearly abandoned by the 1970s, but it has since seen a resurgence in population.
Geography
Stagecoach, Nevada is located in the western part of the state, in Lyon County. It is situated in the foothills of the Sierra Nevada mountain range, and is surrounded by the Toiyabe National Forest. The town is located at an elevation of 4,890 feet, and has a total area of 0.2 square miles.
The climate in Stagecoach is semi-arid, with hot summers and cold winters. The average high temperature in the summer is around 90 degrees Fahrenheit, and the average low temperature in the winter is around 20 degrees Fahrenheit.
Economy
The economy of Stagecoach, Nevada is largely based on tourism. The town is a popular destination for outdoor recreation, and it is home to several campgrounds, hiking trails, and fishing spots. The town also has a few restaurants and bars, as well as a few small shops.
The town is also home to a few small businesses, including a construction company, a plumbing company, and a landscaping company. The town also has a few small farms, which produce hay, alfalfa, and other crops.
Demographics
As of the 2010 census, the population of Stagecoach, Nevada was 545. The racial makeup of the town was 94.3% White, 0.7% African American, 0.7% Native American, 0.7% Asian, 0.4% Pacific Islander, and 2.9% from other races. The median household income was $45,000, and the median age was 44.
Conclusion
Stagecoach, Nevada is a small unincorporated community located in Lyon County, Nevada. It was founded in the late 1800s as a stagecoach stop along the Carson and Colorado Railroad, and it has since become a popular destination for outdoor recreation. The town has a semi-arid climate, and its economy is largely based on tourism. The population of Stagecoach is 545, and the median household income is $45,000.
Common Questions
What is Per Capita Income in Stagecoach?
Per Capita income in Stagecoach is $67,802.
What is the Median Family Income in Stagecoach?
Median Family Income in Stagecoach is $85,909.
What is the Median Household income in Stagecoach?
Median Household Income in Stagecoach is $68,417.
What is Income or Wage Gap in Stagecoach?
Income or Wage Gap in Stagecoach is 17.7%.
Women in Stagecoach earn 82.3 cents for every dollar earned by a man.
What is Inequality or Gini Index in Stagecoach?
Inequality or Gini Index in Stagecoach is 0.55.
What is the Total Population of Stagecoach?
Total Population of Stagecoach is 1,904.
What is the Total Male Population of Stagecoach?
Total Male Population of Stagecoach is 972.
What is the Total Female Population of Stagecoach?
Total Female Population of Stagecoach is 932.
What is the Ratio of Males per 100 Females in Stagecoach?
There are 104.29 Males per 100 Females in Stagecoach.
What is the Ratio of Females per 100 Males in Stagecoach?
There are 95.88 Females per 100 Males in Stagecoach.
What is the Median Population Age in Stagecoach?
Median Population Age in Stagecoach is 53.1 Years.
What is the Average Family Size in Stagecoach
Average Family Size in Stagecoach is 2.5 People.
What is the Average Household Size in Stagecoach
Average Household Size in Stagecoach is 2.3 People.
How Large is the Labor Force in Stagecoach?
There are 898 People in the Labor Forcein in Stagecoach.
What is the Percentage of People in the Labor Force in Stagecoach?
51.7% of People are in the Labor Force in Stagecoach.
What is the Unemployment Rate in Stagecoach?
Unemployment Rate in Stagecoach is 7.6%.