Gardnerville Ranchos, NV Map & Demographics
Gardnerville Ranchos Map
Gardnerville Ranchos Overview
$35,364
PER CAPITA INCOME
$85,125
AVG FAMILY INCOME
$76,917
AVG HOUSEHOLD INCOME
35.8%
WAGE / INCOME GAP [ % ]
64.2¢/ $1
WAGE / INCOME GAP [ $ ]
0.36
INEQUALITY / GINI INDEX
12,057
TOTAL POPULATION
5,922
MALE POPULATION
6,135
FEMALE POPULATION
96.53
MALES / 100 FEMALES
103.60
FEMALES / 100 MALES
46.7
MEDIAN AGE
2.9
AVG FAMILY SIZE
2.6
AVG HOUSEHOLD SIZE
5,607
LABOR FORCE [ PEOPLE ]
56.3%
PERCENT IN LABOR FORCE
3.4%
UNEMPLOYMENT RATE
Income in Gardnerville Ranchos
Income Overview in Gardnerville Ranchos
Per Capita Income in Gardnerville Ranchos is $35,364, while median incomes of families and households are $85,125 and $76,917 respectively.
| Characteristic | Number | Measure |
| Per Capita Income | 12,057 | $35,364 |
| Median Family Income | 3,594 | $85,125 |
| Mean Family Income | 3,594 | $98,234 |
| Median Household Income | 4,549 | $76,917 |
| Mean Household Income | 4,549 | $90,344 |
| Income Deficit | 3,594 | $0 |
| Wage / Income Gap (%) | 12,057 | 35.83% |
| Wage / Income Gap ($) | 12,057 | 64.17¢ per $1 |
| Gini / Inequality Index | 12,057 | 0.36 |
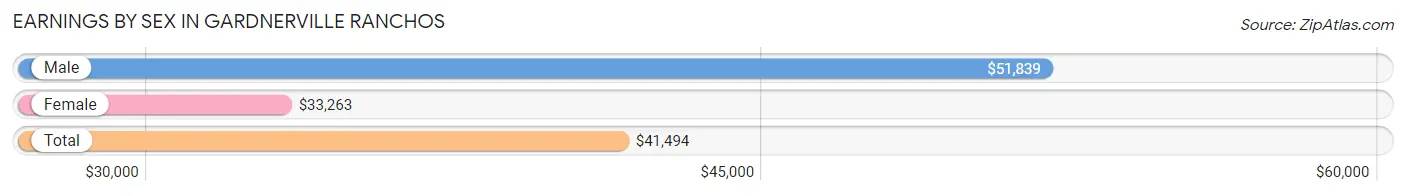
Earnings by Sex in Gardnerville Ranchos
Average Earnings in Gardnerville Ranchos are $41,494, $51,839 for men and $33,263 for women, a difference of 35.8%.
| Sex | Number | Average Earnings |
| Male | 3,089 (51.5%) | $51,839 |
| Female | 2,903 (48.4%) | $33,263 |
| Total | 5,992 (100.0%) | $41,494 |
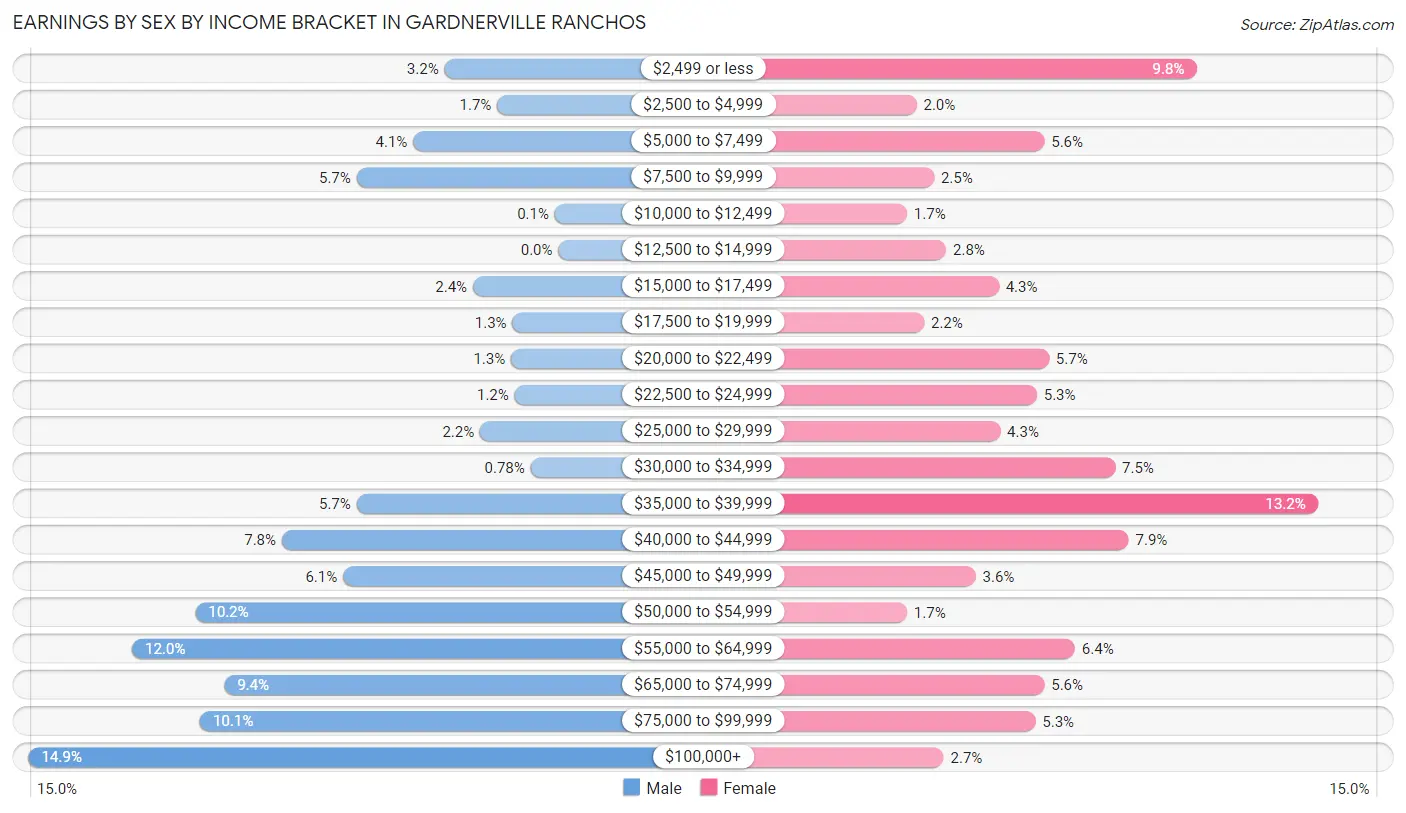
Earnings by Sex by Income Bracket in Gardnerville Ranchos
The most common earnings brackets in Gardnerville Ranchos are $100,000+ for men (460 | 14.9%) and $35,000 to $39,999 for women (384 | 13.2%).
| Income | Male | Female |
| $2,499 or less | 99 (3.2%) | 285 (9.8%) |
| $2,500 to $4,999 | 53 (1.7%) | 57 (2.0%) |
| $5,000 to $7,499 | 126 (4.1%) | 161 (5.6%) |
| $7,500 to $9,999 | 175 (5.7%) | 71 (2.5%) |
| $10,000 to $12,499 | 3 (0.1%) | 49 (1.7%) |
| $12,500 to $14,999 | 0 (0.0%) | 81 (2.8%) |
| $15,000 to $17,499 | 74 (2.4%) | 124 (4.3%) |
| $17,500 to $19,999 | 40 (1.3%) | 63 (2.2%) |
| $20,000 to $22,499 | 41 (1.3%) | 165 (5.7%) |
| $22,500 to $24,999 | 38 (1.2%) | 155 (5.3%) |
| $25,000 to $29,999 | 68 (2.2%) | 125 (4.3%) |
| $30,000 to $34,999 | 24 (0.8%) | 219 (7.5%) |
| $35,000 to $39,999 | 175 (5.7%) | 384 (13.2%) |
| $40,000 to $44,999 | 240 (7.8%) | 230 (7.9%) |
| $45,000 to $49,999 | 187 (6.0%) | 105 (3.6%) |
| $50,000 to $54,999 | 315 (10.2%) | 49 (1.7%) |
| $55,000 to $64,999 | 370 (12.0%) | 186 (6.4%) |
| $65,000 to $74,999 | 290 (9.4%) | 161 (5.6%) |
| $75,000 to $99,999 | 311 (10.1%) | 154 (5.3%) |
| $100,000+ | 460 (14.9%) | 79 (2.7%) |
| Total | 3,089 (100.0%) | 2,903 (100.0%) |
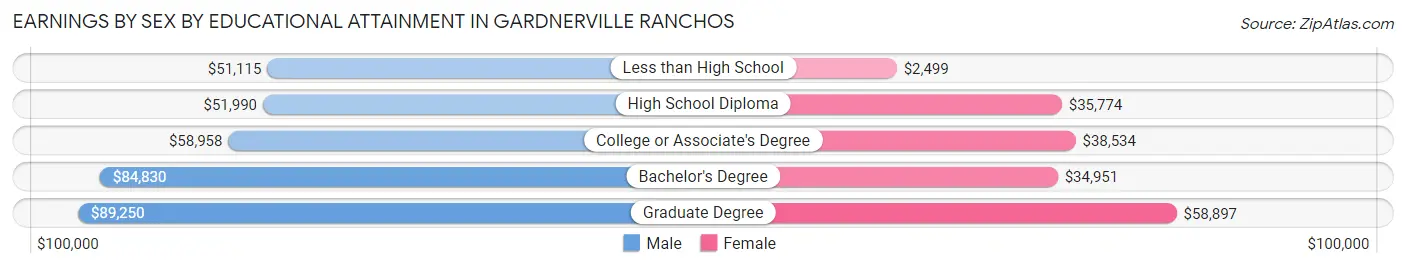
Earnings by Sex by Educational Attainment in Gardnerville Ranchos
Average earnings in Gardnerville Ranchos are $56,366 for men and $36,199 for women, a difference of 35.8%. Men with an educational attainment of graduate degree enjoy the highest average annual earnings of $89,250, while those with less than high school education earn the least with $51,115. Women with an educational attainment of graduate degree earn the most with the average annual earnings of $58,897, while those with less than high school education have the smallest earnings of $2,499.
| Educational Attainment | Male Income | Female Income |
| Less than High School | $51,115 | $2,499 |
| High School Diploma | $51,990 | $35,774 |
| College or Associate's Degree | $58,958 | $38,534 |
| Bachelor's Degree | $84,830 | $34,951 |
| Graduate Degree | $89,250 | $58,897 |
| Total | $56,366 | $36,199 |
Family Income in Gardnerville Ranchos
Family Income Brackets in Gardnerville Ranchos
According to the Gardnerville Ranchos family income data, there are 931 families falling into the $50,000 to $74,999 income range, which is the most common income bracket and makes up 25.9% of all families. Conversely, the $10,000 to $14,999 income bracket is the least frequent group with only 18 families (0.5%) belonging to this category.
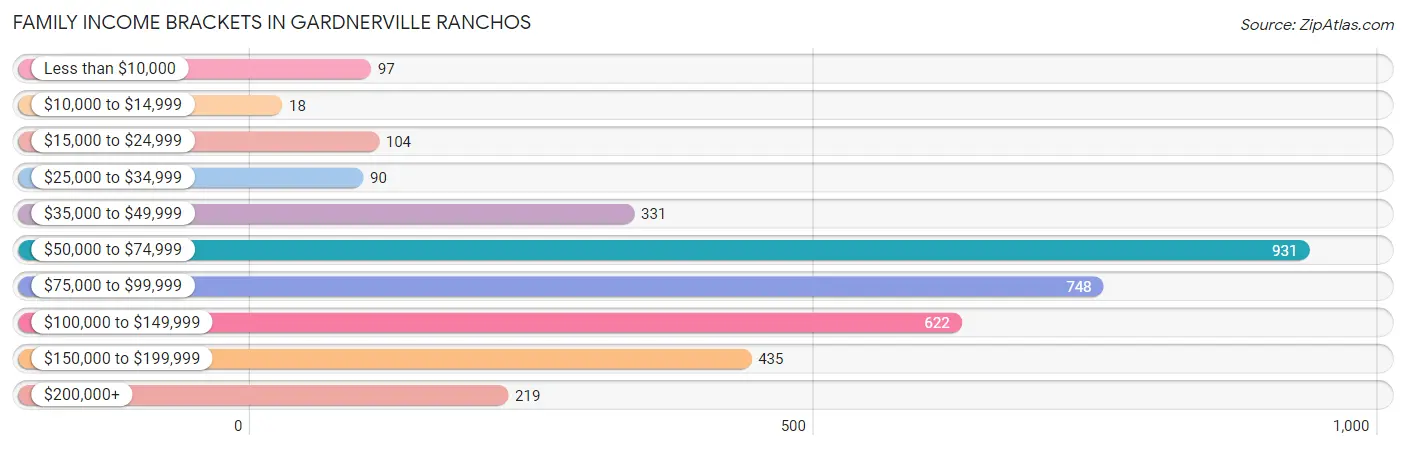
| Income Bracket | # Families | % Families |
| Less than $10,000 | 97 | 2.7% |
| $10,000 to $14,999 | 18 | 0.5% |
| $15,000 to $24,999 | 104 | 2.9% |
| $25,000 to $34,999 | 90 | 2.5% |
| $35,000 to $49,999 | 331 | 9.2% |
| $50,000 to $74,999 | 931 | 25.9% |
| $75,000 to $99,999 | 748 | 20.8% |
| $100,000 to $149,999 | 622 | 17.3% |
| $150,000 to $199,999 | 435 | 12.1% |
| $200,000+ | 219 | 6.1% |
Family Income by Famaliy Size in Gardnerville Ranchos
5-person families (252 | 7.0%) account for the highest median family income in Gardnerville Ranchos with $110,208 per family, while 2-person families (1,914 | 53.3%) have the highest median income of $36,574 per family member.
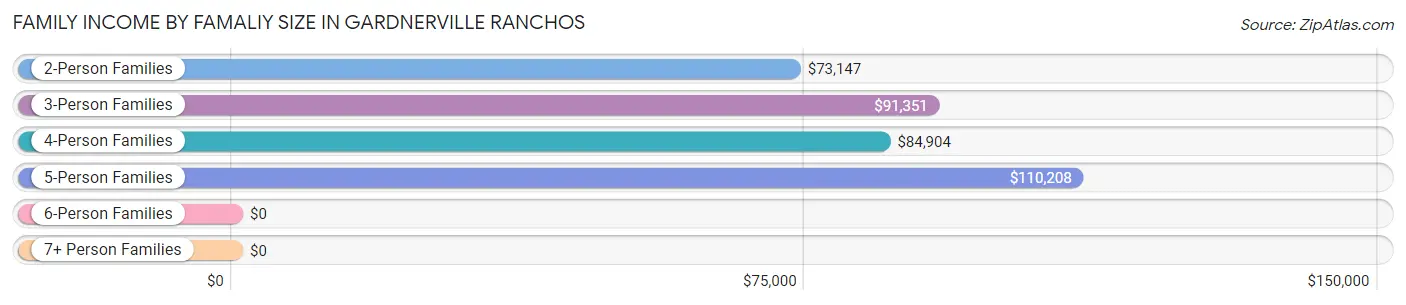
| Income Bracket | # Families | Median Income |
| 2-Person Families | 1,914 (53.3%) | $73,147 |
| 3-Person Families | 892 (24.8%) | $91,351 |
| 4-Person Families | 475 (13.2%) | $84,904 |
| 5-Person Families | 252 (7.0%) | $110,208 |
| 6-Person Families | 0 (0.0%) | $0 |
| 7+ Person Families | 61 (1.7%) | $0 |
| Total | 3,594 (100.0%) | $85,125 |
Family Income by Number of Earners in Gardnerville Ranchos
The median family income in Gardnerville Ranchos is $85,125, with families comprising 3+ earners (236) having the highest median family income of $121,618, while families with no earners (898) have the lowest median family income of $66,548, accounting for 6.6% and 25.0% of families, respectively.
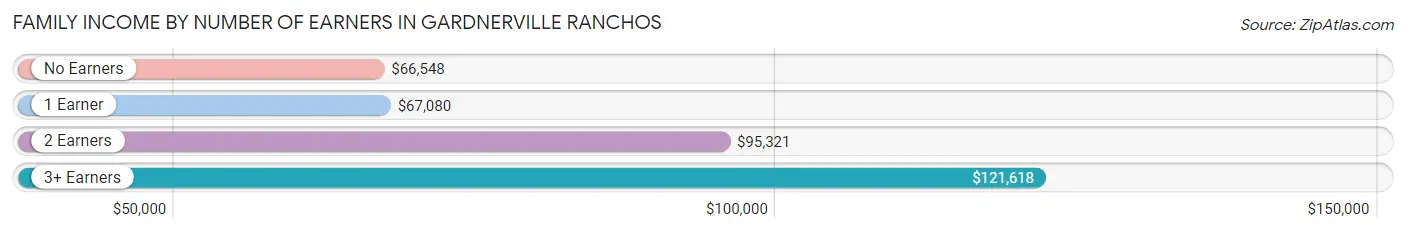
| Number of Earners | # Families | Median Income |
| No Earners | 898 (25.0%) | $66,548 |
| 1 Earner | 817 (22.7%) | $67,080 |
| 2 Earners | 1,643 (45.7%) | $95,321 |
| 3+ Earners | 236 (6.6%) | $121,618 |
| Total | 3,594 (100.0%) | $85,125 |
Household Income in Gardnerville Ranchos
Household Income Brackets in Gardnerville Ranchos
With 905 households falling in the category, the $50,000 to $74,999 income range is the most frequent in Gardnerville Ranchos, accounting for 19.9% of all households. In contrast, only 45 households (1.0%) fall into the $10,000 to $14,999 income bracket, making it the least populous group.
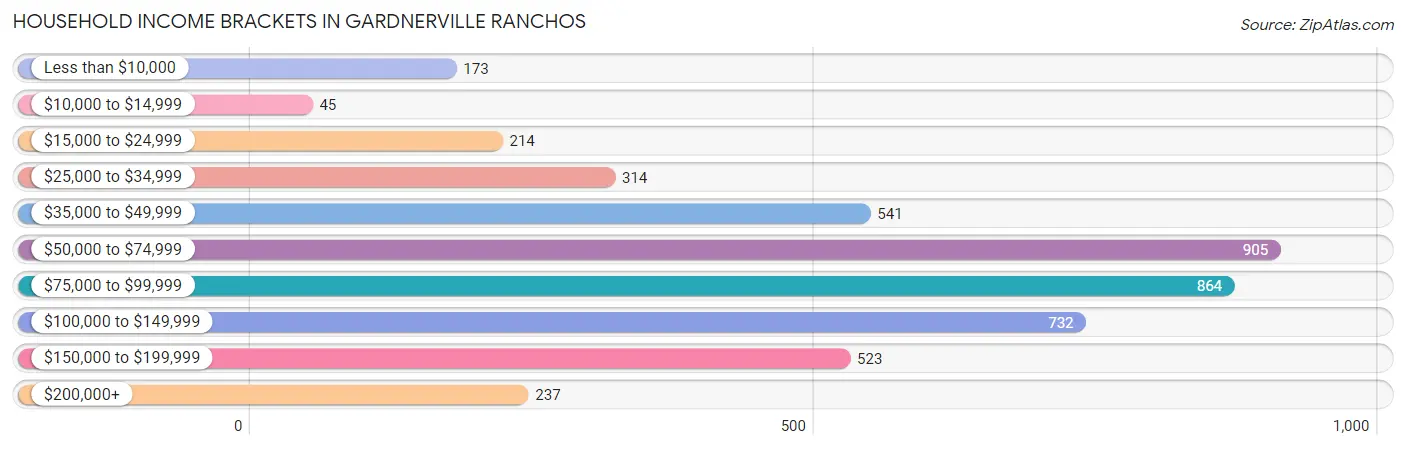
| Income Bracket | # Households | % Households |
| Less than $10,000 | 173 | 3.8% |
| $10,000 to $14,999 | 45 | 1.0% |
| $15,000 to $24,999 | 214 | 4.7% |
| $25,000 to $34,999 | 314 | 6.9% |
| $35,000 to $49,999 | 541 | 11.9% |
| $50,000 to $74,999 | 905 | 19.9% |
| $75,000 to $99,999 | 864 | 19.0% |
| $100,000 to $149,999 | 732 | 16.1% |
| $150,000 to $199,999 | 523 | 11.5% |
| $200,000+ | 237 | 5.2% |
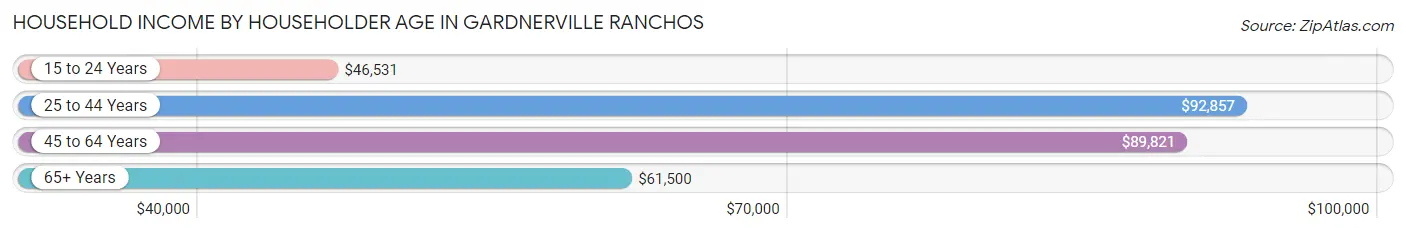
Household Income by Householder Age in Gardnerville Ranchos
The median household income in Gardnerville Ranchos is $76,917, with the highest median household income of $92,857 found in the 25 to 44 years age bracket for the primary householder. A total of 1,126 households (24.7%) fall into this category. Meanwhile, the 15 to 24 years age bracket for the primary householder has the lowest median household income of $46,531, with 91 households (2.0%) in this group.
| Income Bracket | # Households | Median Income |
| 15 to 24 Years | 91 (2.0%) | $46,531 |
| 25 to 44 Years | 1,126 (24.7%) | $92,857 |
| 45 to 64 Years | 1,600 (35.2%) | $89,821 |
| 65+ Years | 1,732 (38.1%) | $61,500 |
| Total | 4,549 (100.0%) | $76,917 |
Poverty in Gardnerville Ranchos
Income Below Poverty by Sex and Age in Gardnerville Ranchos
With 6.8% poverty level for males and 8.3% for females among the residents of Gardnerville Ranchos, 16 and 17 year old males and 12 to 14 year old females are the most vulnerable to poverty, with 18 males (20.7%) and 44 females (26.5%) in their respective age groups living below the poverty level.
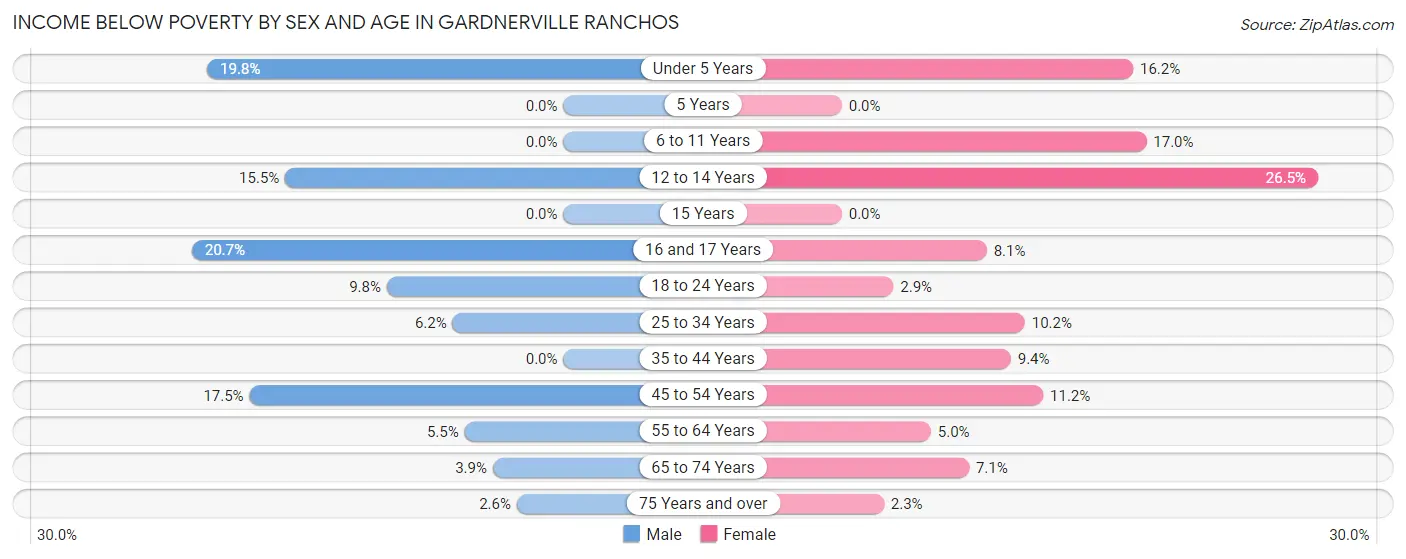
| Age Bracket | Male | Female |
| Under 5 Years | 25 (19.8%) | 18 (16.2%) |
| 5 Years | 0 (0.0%) | 0 (0.0%) |
| 6 to 11 Years | 0 (0.0%) | 88 (17.0%) |
| 12 to 14 Years | 57 (15.5%) | 44 (26.5%) |
| 15 Years | 0 (0.0%) | 0 (0.0%) |
| 16 and 17 Years | 18 (20.7%) | 13 (8.1%) |
| 18 to 24 Years | 40 (9.8%) | 17 (2.9%) |
| 25 to 34 Years | 30 (6.2%) | 60 (10.2%) |
| 35 to 44 Years | 0 (0.0%) | 76 (9.4%) |
| 45 to 54 Years | 125 (17.5%) | 60 (11.2%) |
| 55 to 64 Years | 53 (5.5%) | 47 (5.0%) |
| 65 to 74 Years | 36 (3.9%) | 68 (7.1%) |
| 75 Years and over | 15 (2.6%) | 14 (2.3%) |
| Total | 399 (6.8%) | 505 (8.3%) |
Income Above Poverty by Sex and Age in Gardnerville Ranchos
According to the poverty statistics in Gardnerville Ranchos, males aged 5 years and females aged 15 years are the age groups that are most secure financially, with 100.0% of males and 100.0% of females in these age groups living above the poverty line.
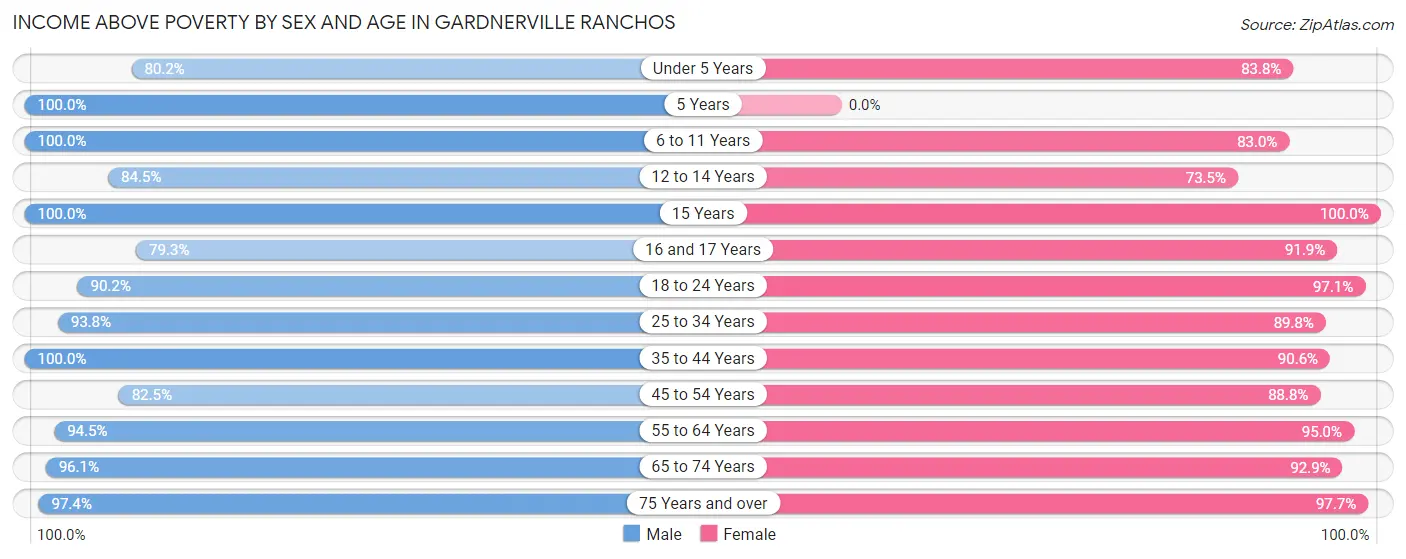
| Age Bracket | Male | Female |
| Under 5 Years | 101 (80.2%) | 93 (83.8%) |
| 5 Years | 74 (100.0%) | 0 (0.0%) |
| 6 to 11 Years | 419 (100.0%) | 431 (83.0%) |
| 12 to 14 Years | 311 (84.5%) | 122 (73.5%) |
| 15 Years | 158 (100.0%) | 136 (100.0%) |
| 16 and 17 Years | 69 (79.3%) | 148 (91.9%) |
| 18 to 24 Years | 367 (90.2%) | 575 (97.1%) |
| 25 to 34 Years | 456 (93.8%) | 529 (89.8%) |
| 35 to 44 Years | 615 (100.0%) | 732 (90.6%) |
| 45 to 54 Years | 590 (82.5%) | 475 (88.8%) |
| 55 to 64 Years | 910 (94.5%) | 900 (95.0%) |
| 65 to 74 Years | 879 (96.1%) | 893 (92.9%) |
| 75 Years and over | 565 (97.4%) | 584 (97.7%) |
| Total | 5,514 (93.2%) | 5,618 (91.7%) |
Income Below Poverty Among Married-Couple Families in Gardnerville Ranchos
The poverty statistics for married-couple families in Gardnerville Ranchos show that 5.9% or 158 of the total 2,669 families live below the poverty line. Families with 1 or 2 children have the highest poverty rate of 14.9%, comprising of 112 families. On the other hand, families with 5 or more children have the lowest poverty rate of 0.0%, which includes 0 families.
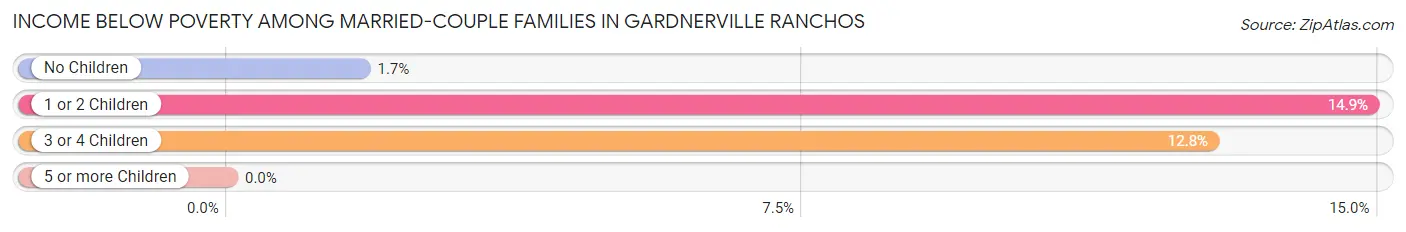
| Children | Above Poverty | Below Poverty |
| No Children | 1,759 (98.3%) | 31 (1.7%) |
| 1 or 2 Children | 639 (85.1%) | 112 (14.9%) |
| 3 or 4 Children | 102 (87.2%) | 15 (12.8%) |
| 5 or more Children | 11 (100.0%) | 0 (0.0%) |
| Total | 2,511 (94.1%) | 158 (5.9%) |
Income Below Poverty Among Single-Parent Households in Gardnerville Ranchos
According to the poverty data in Gardnerville Ranchos, 2.3% or 6 single-father households and 2.9% or 19 single-mother households are living below the poverty line. Among single-father households, those with no children have the highest poverty rate, with 6 households (3.6%) experiencing poverty. Likewise, among single-mother households, those with 1 or 2 children have the highest poverty rate, with 19 households (7.4%) falling below the poverty line.
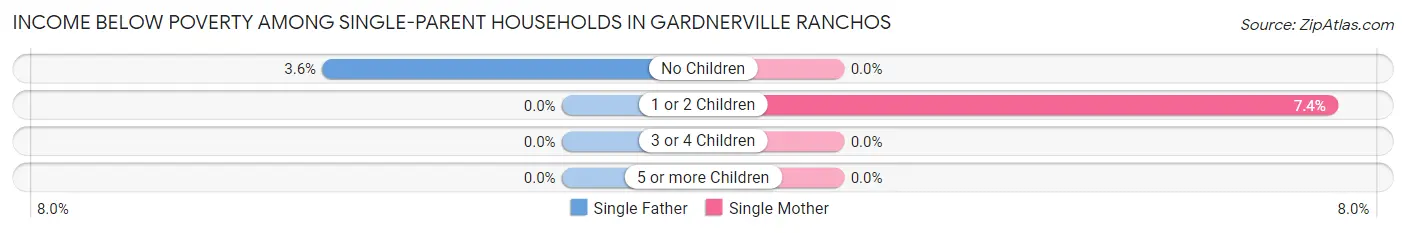
| Children | Single Father | Single Mother |
| No Children | 6 (3.6%) | 0 (0.0%) |
| 1 or 2 Children | 0 (0.0%) | 19 (7.4%) |
| 3 or 4 Children | 0 (0.0%) | 0 (0.0%) |
| 5 or more Children | 0 (0.0%) | 0 (0.0%) |
| Total | 6 (2.3%) | 19 (2.9%) |
Income Below Poverty Among Married-Couple vs Single-Parent Households in Gardnerville Ranchos
The poverty data for Gardnerville Ranchos shows that 158 of the married-couple family households (5.9%) and 25 of the single-parent households (2.7%) are living below the poverty level. Within the married-couple family households, those with 1 or 2 children have the highest poverty rate, with 112 households (14.9%) falling below the poverty line. Among the single-parent households, those with 1 or 2 children have the highest poverty rate, with 19 household (5.9%) living below poverty.
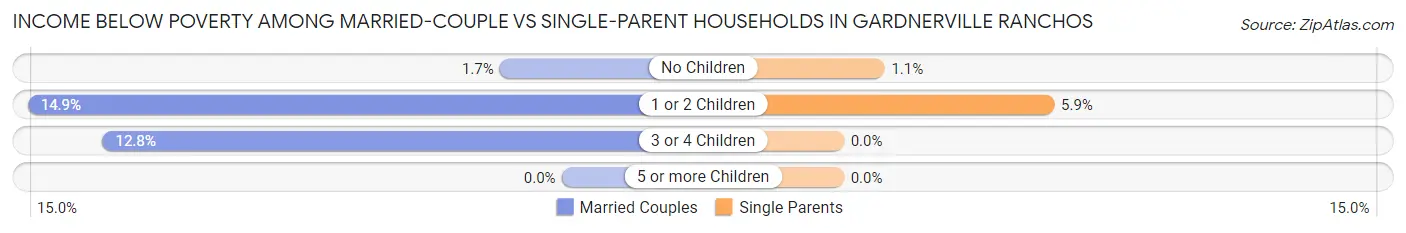
| Children | Married-Couple Families | Single-Parent Households |
| No Children | 31 (1.7%) | 6 (1.1%) |
| 1 or 2 Children | 112 (14.9%) | 19 (5.9%) |
| 3 or 4 Children | 15 (12.8%) | 0 (0.0%) |
| 5 or more Children | 0 (0.0%) | 0 (0.0%) |
| Total | 158 (5.9%) | 25 (2.7%) |
Race in Gardnerville Ranchos
The most populous races in Gardnerville Ranchos are White / Caucasian (10,126 | 84.0%), Hispanic or Latino (1,833 | 15.2%), and Two or more Races (1,045 | 8.7%).
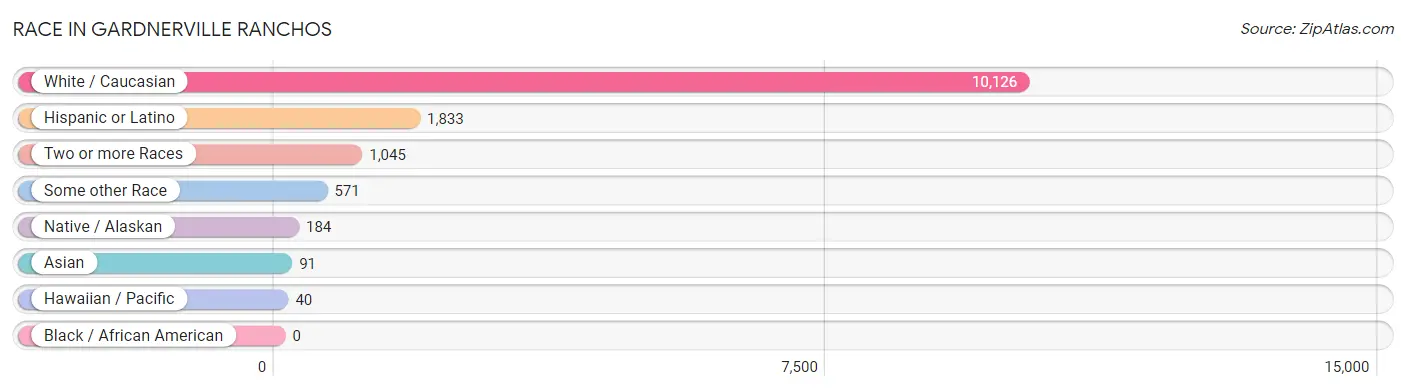
| Race | # Population | % Population |
| Asian | 91 | 0.7% |
| Black / African American | 0 | 0.0% |
| Hawaiian / Pacific | 40 | 0.3% |
| Hispanic or Latino | 1,833 | 15.2% |
| Native / Alaskan | 184 | 1.5% |
| White / Caucasian | 10,126 | 84.0% |
| Two or more Races | 1,045 | 8.7% |
| Some other Race | 571 | 4.7% |
| Total | 12,057 | 100.0% |
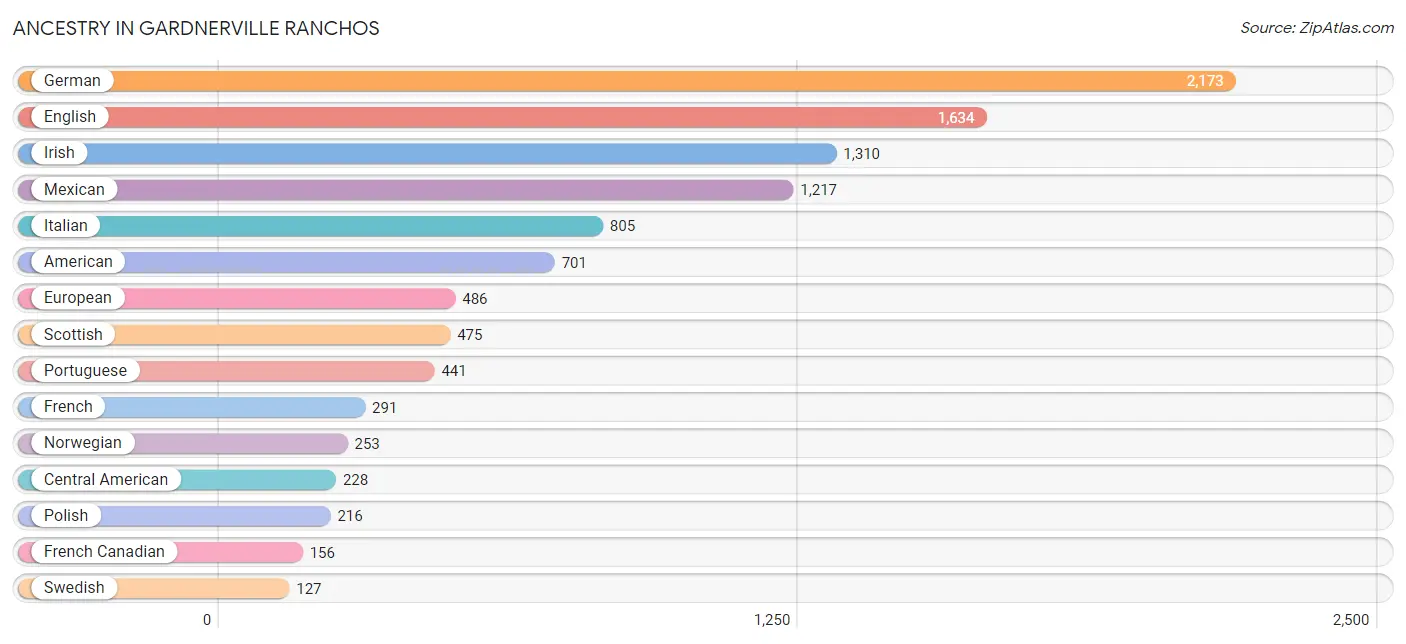
Ancestry in Gardnerville Ranchos
The most populous ancestries reported in Gardnerville Ranchos are German (2,173 | 18.0%), English (1,634 | 13.6%), Irish (1,310 | 10.9%), Mexican (1,217 | 10.1%), and Italian (805 | 6.7%), together accounting for 59.2% of all Gardnerville Ranchos residents.
| Ancestry | # Population | % Population |
| American | 701 | 5.8% |
| Apache | 49 | 0.4% |
| Arab | 27 | 0.2% |
| Argentinean | 41 | 0.3% |
| Armenian | 25 | 0.2% |
| Austrian | 6 | 0.1% |
| Basque | 69 | 0.6% |
| Belgian | 8 | 0.1% |
| Bhutanese | 24 | 0.2% |
| British | 62 | 0.5% |
| Burmese | 11 | 0.1% |
| Canadian | 18 | 0.2% |
| Central American | 228 | 1.9% |
| Cherokee | 70 | 0.6% |
| Chickasaw | 23 | 0.2% |
| Chilean | 15 | 0.1% |
| Choctaw | 54 | 0.4% |
| Croatian | 12 | 0.1% |
| Cuban | 29 | 0.2% |
| Czech | 66 | 0.5% |
| Czechoslovakian | 46 | 0.4% |
| Danish | 102 | 0.9% |
| Dutch | 68 | 0.6% |
| Eastern European | 15 | 0.1% |
| English | 1,634 | 13.6% |
| European | 486 | 4.0% |
| French | 291 | 2.4% |
| French American Indian | 2 | 0.0% |
| French Canadian | 156 | 1.3% |
| German | 2,173 | 18.0% |
| Greek | 9 | 0.1% |
| Guatemalan | 90 | 0.7% |
| Hungarian | 24 | 0.2% |
| Indian (Asian) | 18 | 0.2% |
| Irish | 1,310 | 10.9% |
| Italian | 805 | 6.7% |
| Korean | 98 | 0.8% |
| Laotian | 9 | 0.1% |
| Lebanese | 2 | 0.0% |
| Lithuanian | 70 | 0.6% |
| Mexican | 1,217 | 10.1% |
| Native Hawaiian | 47 | 0.4% |
| Navajo | 33 | 0.3% |
| Nicaraguan | 13 | 0.1% |
| Norwegian | 253 | 2.1% |
| Paiute | 92 | 0.8% |
| Polish | 216 | 1.8% |
| Portuguese | 441 | 3.7% |
| Potawatomi | 26 | 0.2% |
| Puerto Rican | 117 | 1.0% |
| Russian | 59 | 0.5% |
| Salvadoran | 125 | 1.0% |
| Scandinavian | 89 | 0.7% |
| Scotch-Irish | 92 | 0.8% |
| Scottish | 475 | 3.9% |
| Slovak | 17 | 0.1% |
| South American | 56 | 0.5% |
| Spaniard | 87 | 0.7% |
| Spanish | 58 | 0.5% |
| Spanish American | 13 | 0.1% |
| Swedish | 127 | 1.1% |
| Swiss | 32 | 0.3% |
| Syrian | 5 | 0.0% |
| Turkish | 55 | 0.5% |
| Ukrainian | 118 | 1.0% |
| Welsh | 64 | 0.5% |
| Yugoslavian | 25 | 0.2% | View All 67 Rows |
Immigrants in Gardnerville Ranchos
The most numerous immigrant groups reported in Gardnerville Ranchos came from Europe (196 | 1.6%), Central America (161 | 1.3%), Latin America (161 | 1.3%), Mexico (148 | 1.2%), and Eastern Europe (93 | 0.8%), together accounting for 6.3% of all Gardnerville Ranchos residents.
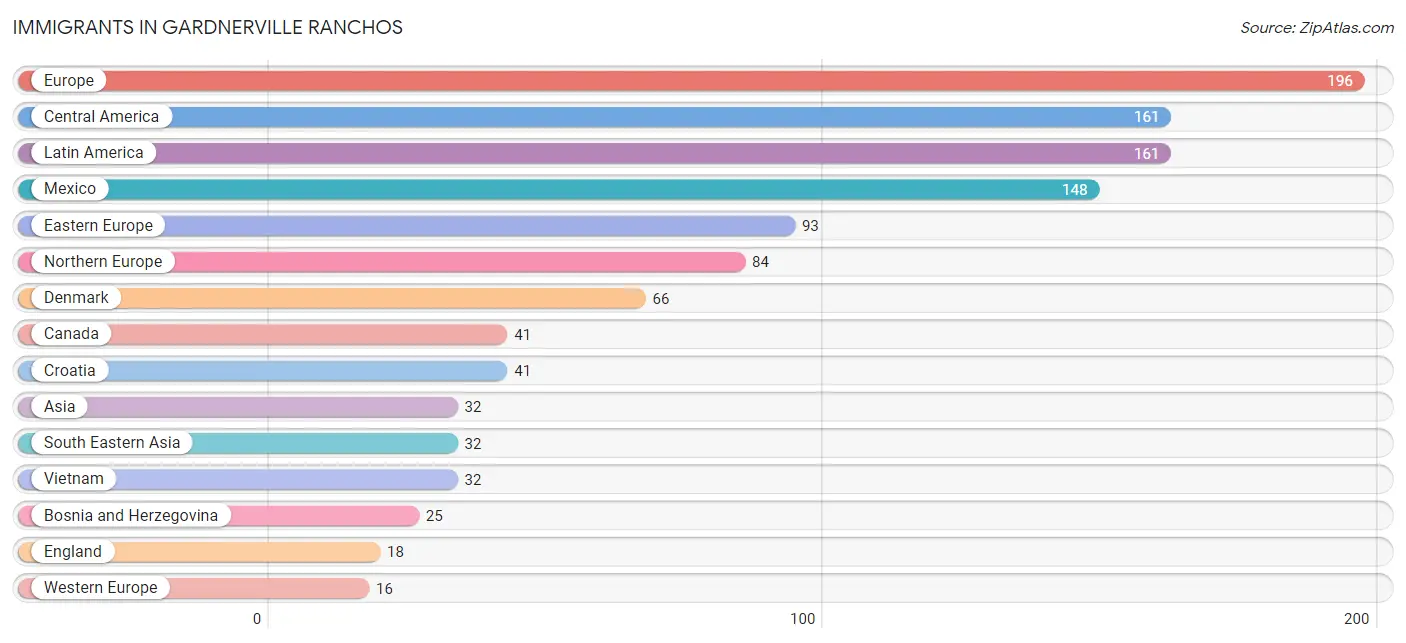
| Immigration Origin | # Population | % Population |
| Asia | 32 | 0.3% |
| Belarus | 13 | 0.1% |
| Bosnia and Herzegovina | 25 | 0.2% |
| Canada | 41 | 0.3% |
| Central America | 161 | 1.3% |
| Croatia | 41 | 0.3% |
| Denmark | 66 | 0.5% |
| Eastern Europe | 93 | 0.8% |
| England | 18 | 0.2% |
| Europe | 196 | 1.6% |
| Germany | 7 | 0.1% |
| Latin America | 161 | 1.3% |
| Latvia | 14 | 0.1% |
| Mexico | 148 | 1.2% |
| Netherlands | 9 | 0.1% |
| Nicaragua | 13 | 0.1% |
| Northern Europe | 84 | 0.7% |
| South Eastern Asia | 32 | 0.3% |
| Southern Europe | 3 | 0.0% |
| Spain | 3 | 0.0% |
| Vietnam | 32 | 0.3% |
| Western Europe | 16 | 0.1% | View All 22 Rows |
Sex and Age in Gardnerville Ranchos
Sex and Age in Gardnerville Ranchos
The most populous age groups in Gardnerville Ranchos are 55 to 59 Years (515 | 8.7%) for men and 65 to 69 Years (636 | 10.4%) for women.
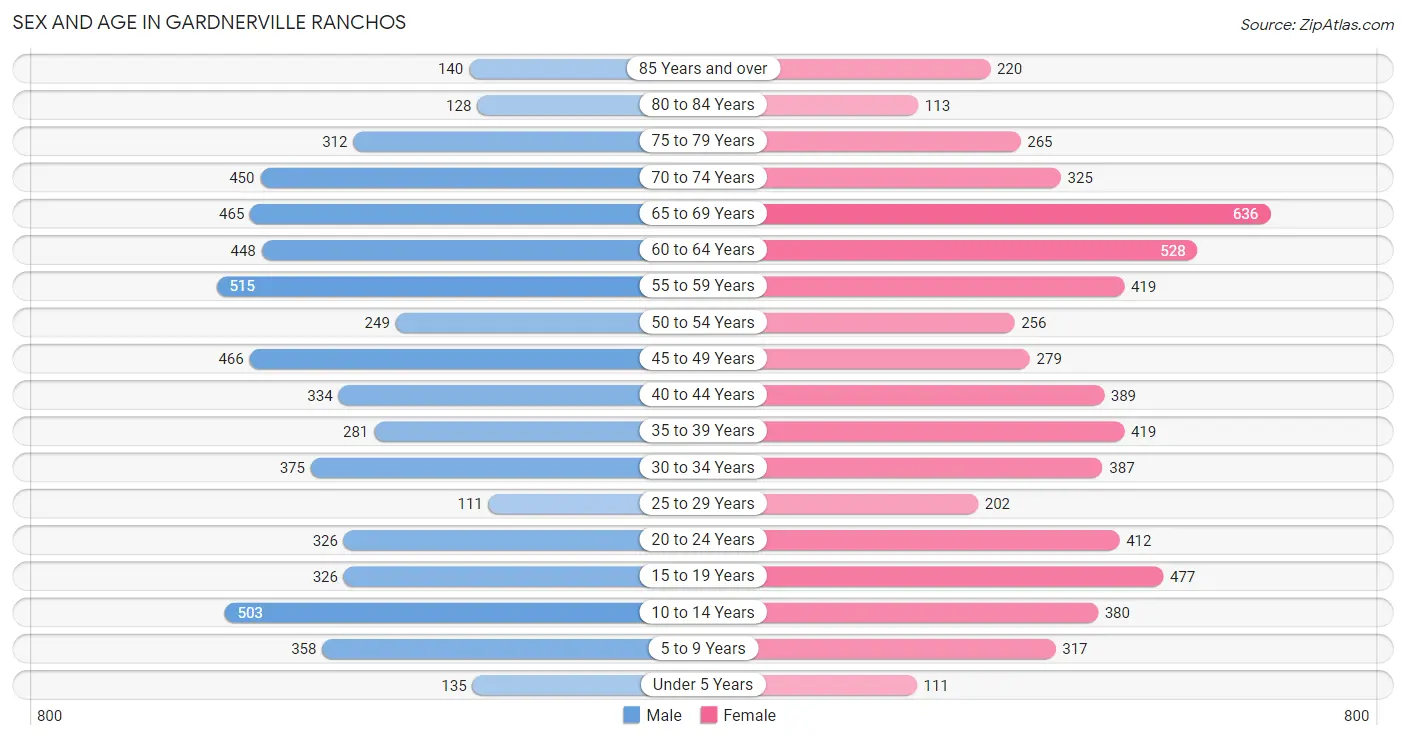
| Age Bracket | Male | Female |
| Under 5 Years | 135 (2.3%) | 111 (1.8%) |
| 5 to 9 Years | 358 (6.0%) | 317 (5.2%) |
| 10 to 14 Years | 503 (8.5%) | 380 (6.2%) |
| 15 to 19 Years | 326 (5.5%) | 477 (7.8%) |
| 20 to 24 Years | 326 (5.5%) | 412 (6.7%) |
| 25 to 29 Years | 111 (1.9%) | 202 (3.3%) |
| 30 to 34 Years | 375 (6.3%) | 387 (6.3%) |
| 35 to 39 Years | 281 (4.8%) | 419 (6.8%) |
| 40 to 44 Years | 334 (5.6%) | 389 (6.3%) |
| 45 to 49 Years | 466 (7.9%) | 279 (4.5%) |
| 50 to 54 Years | 249 (4.2%) | 256 (4.2%) |
| 55 to 59 Years | 515 (8.7%) | 419 (6.8%) |
| 60 to 64 Years | 448 (7.6%) | 528 (8.6%) |
| 65 to 69 Years | 465 (7.9%) | 636 (10.4%) |
| 70 to 74 Years | 450 (7.6%) | 325 (5.3%) |
| 75 to 79 Years | 312 (5.3%) | 265 (4.3%) |
| 80 to 84 Years | 128 (2.2%) | 113 (1.8%) |
| 85 Years and over | 140 (2.4%) | 220 (3.6%) |
| Total | 5,922 (100.0%) | 6,135 (100.0%) |
Families and Households in Gardnerville Ranchos
Median Family Size in Gardnerville Ranchos
The median family size in Gardnerville Ranchos is 2.93 persons per family, with single female/mother families (666 | 18.5%) accounting for the largest median family size of 3.14 persons per family. On the other hand, single male/father families (259 | 7.2%) represent the smallest median family size with 2.42 persons per family.
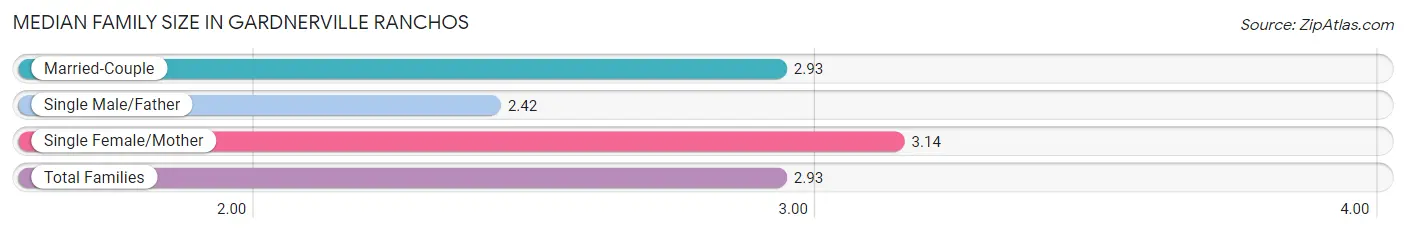
| Family Type | # Families | Family Size |
| Married-Couple | 2,669 (74.3%) | 2.93 |
| Single Male/Father | 259 (7.2%) | 2.42 |
| Single Female/Mother | 666 (18.5%) | 3.14 |
| Total Families | 3,594 (100.0%) | 2.93 |
Median Household Size in Gardnerville Ranchos
The median household size in Gardnerville Ranchos is 2.65 persons per household, with single female/mother households (666 | 14.6%) accounting for the largest median household size of 3.48 persons per household. non-family households (955 | 21.0%) represent the smallest median household size with 1.25 persons per household.
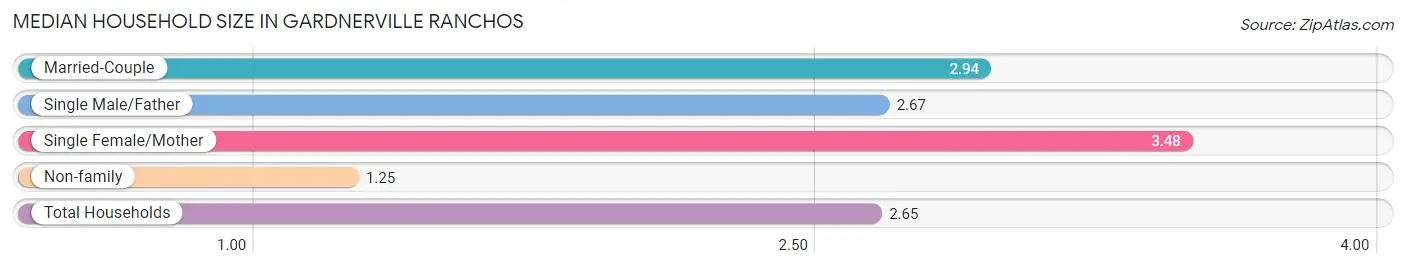
| Household Type | # Households | Household Size |
| Married-Couple | 2,669 (58.7%) | 2.94 |
| Single Male/Father | 259 (5.7%) | 2.67 |
| Single Female/Mother | 666 (14.6%) | 3.48 |
| Non-family | 955 (21.0%) | 1.25 |
| Total Households | 4,549 (100.0%) | 2.65 |
Household Size by Marriage Status in Gardnerville Ranchos
Out of a total of 4,549 households in Gardnerville Ranchos, 3,594 (79.0%) are family households, while 955 (21.0%) are nonfamily households. The most numerous type of family households are 2-person households, comprising 1,810, and the most common type of nonfamily households are 1-person households, comprising 755.
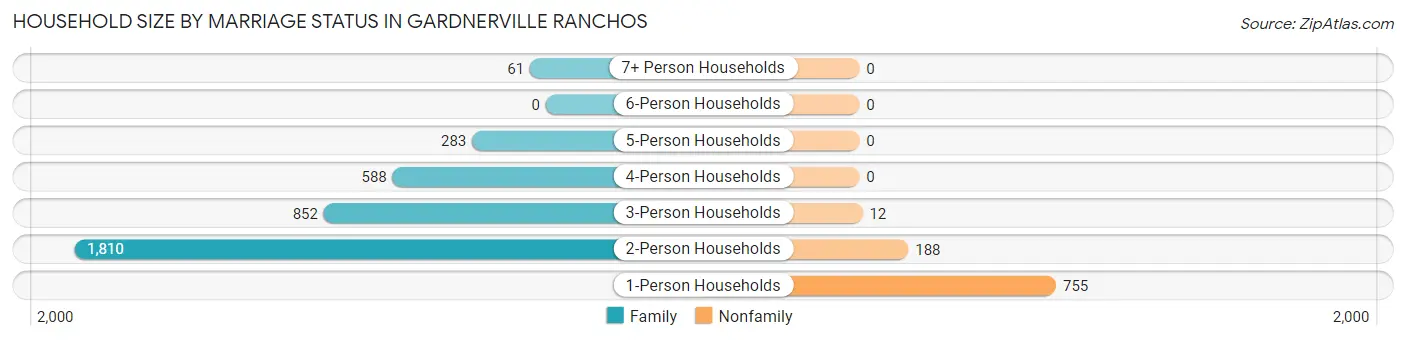
| Household Size | Family Households | Nonfamily Households |
| 1-Person Households | - | 755 (16.6%) |
| 2-Person Households | 1,810 (39.8%) | 188 (4.1%) |
| 3-Person Households | 852 (18.7%) | 12 (0.3%) |
| 4-Person Households | 588 (12.9%) | 0 (0.0%) |
| 5-Person Households | 283 (6.2%) | 0 (0.0%) |
| 6-Person Households | 0 (0.0%) | 0 (0.0%) |
| 7+ Person Households | 61 (1.3%) | 0 (0.0%) |
| Total | 3,594 (79.0%) | 955 (21.0%) |
Female Fertility in Gardnerville Ranchos
Fertility by Age in Gardnerville Ranchos
Average fertility rate in Gardnerville Ranchos is 39.0 births per 1,000 women. Women in the age bracket of 35 to 50 years have the highest fertility rate with 54.0 births per 1,000 women. Women in the age bracket of 35 to 50 years acount for 61.2% of all women with births.
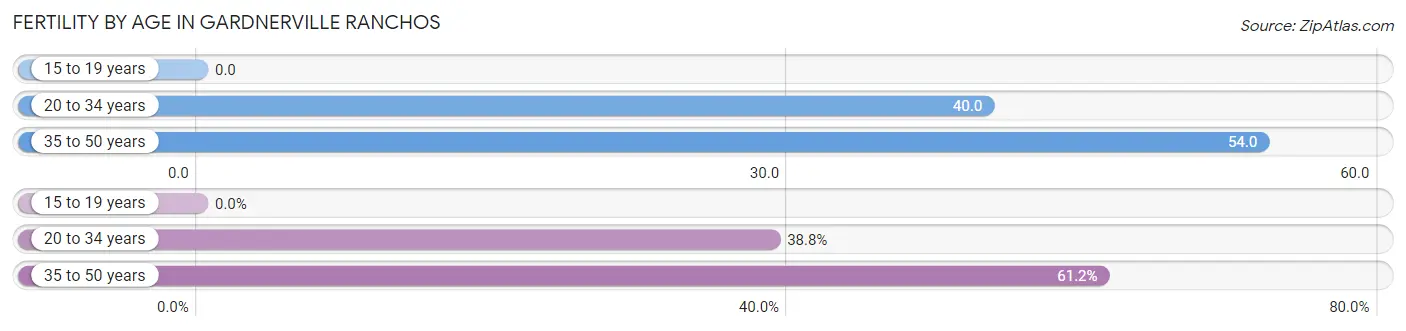
| Age Bracket | Women with Births | Births / 1,000 Women |
| 15 to 19 years | 0 (0.0%) | 0.0 |
| 20 to 34 years | 40 (38.8%) | 40.0 |
| 35 to 50 years | 63 (61.2%) | 54.0 |
| Total | 103 (100.0%) | 39.0 |
Fertility by Age by Marriage Status in Gardnerville Ranchos
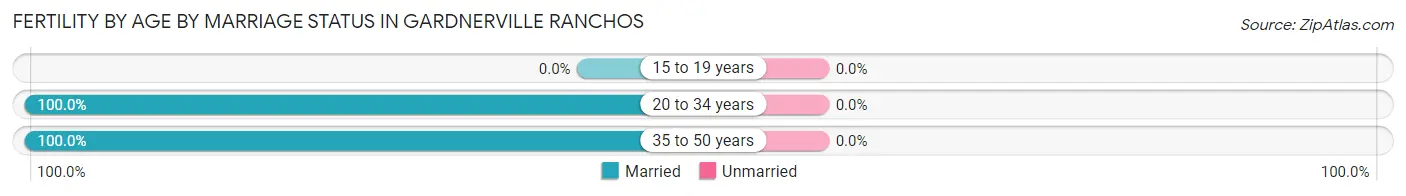
| Age Bracket | Married | Unmarried |
| 15 to 19 years | 0 (0.0%) | 0 (0.0%) |
| 20 to 34 years | 40 (100.0%) | 0 (0.0%) |
| 35 to 50 years | 63 (100.0%) | 0 (0.0%) |
| Total | 103 (100.0%) | 0 (0.0%) |
Fertility by Education in Gardnerville Ranchos
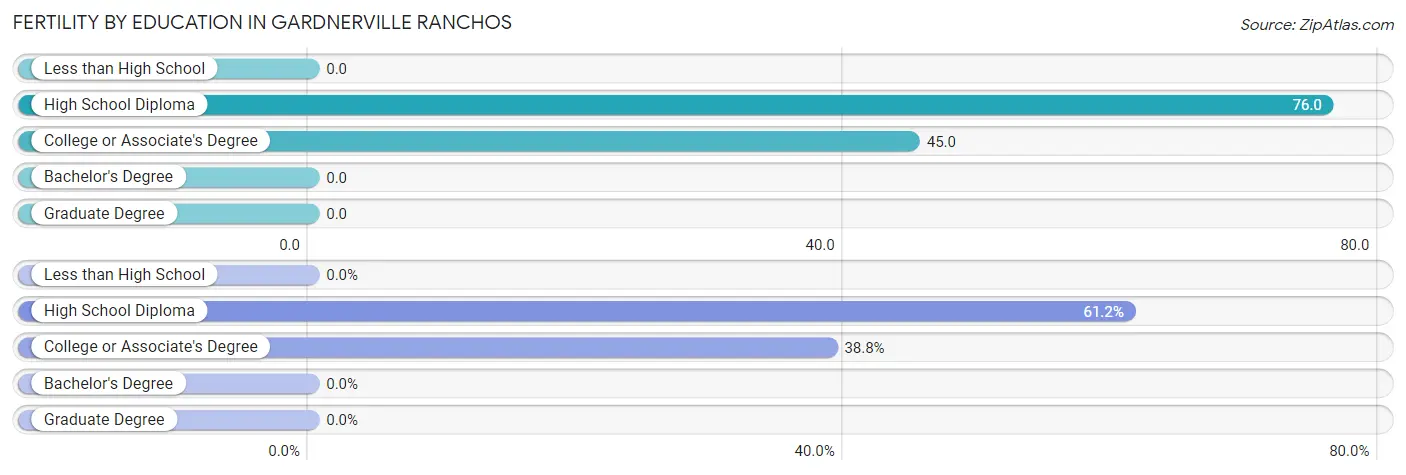
| Educational Attainment | Women with Births | Births / 1,000 Women |
| Less than High School | 0 (0.0%) | 0.0 |
| High School Diploma | 63 (61.2%) | 76.0 |
| College or Associate's Degree | 40 (38.8%) | 45.0 |
| Bachelor's Degree | 0 (0.0%) | 0.0 |
| Graduate Degree | 0 (0.0%) | 0.0 |
| Total | 103 (100.0%) | 39.0 |
Fertility by Education by Marriage Status in Gardnerville Ranchos
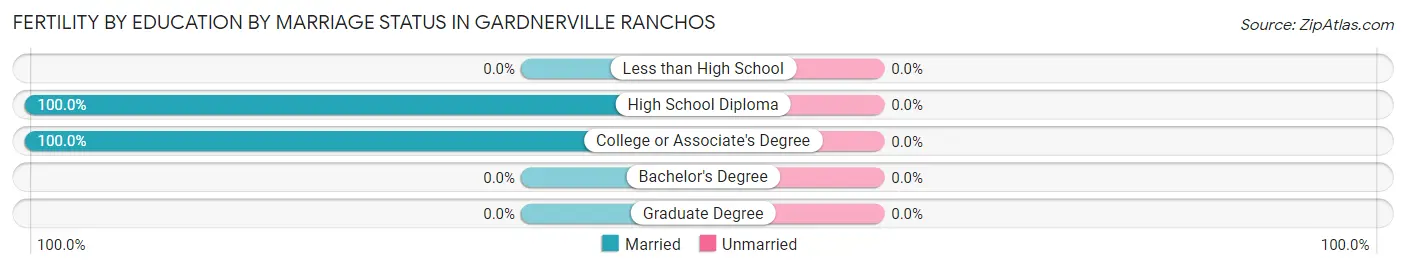
| Educational Attainment | Married | Unmarried |
| Less than High School | 0 (0.0%) | 0 (0.0%) |
| High School Diploma | 63 (100.0%) | 0 (0.0%) |
| College or Associate's Degree | 40 (100.0%) | 0 (0.0%) |
| Bachelor's Degree | 0 (0.0%) | 0 (0.0%) |
| Graduate Degree | 0 (0.0%) | 0 (0.0%) |
| Total | 103 (100.0%) | 0 (0.0%) |
Employment Characteristics in Gardnerville Ranchos
Employment by Class of Employer in Gardnerville Ranchos
Among the 5,204 employed individuals in Gardnerville Ranchos, private company employees (3,244 | 62.3%), local government employees (521 | 10.0%), and self-employed (not incorporated) (464 | 8.9%) make up the most common classes of employment.
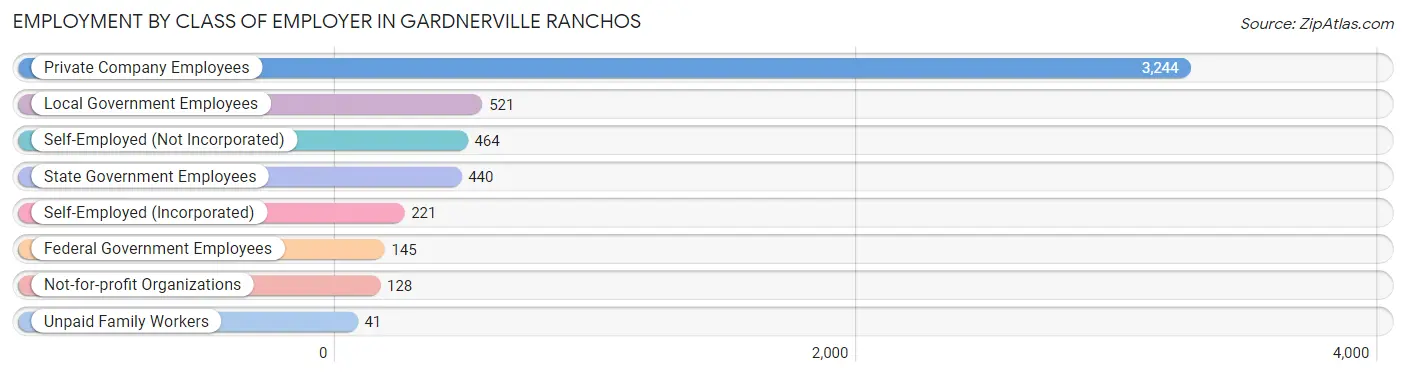
| Employer Class | # Employees | % Employees |
| Private Company Employees | 3,244 | 62.3% |
| Self-Employed (Incorporated) | 221 | 4.3% |
| Self-Employed (Not Incorporated) | 464 | 8.9% |
| Not-for-profit Organizations | 128 | 2.5% |
| Local Government Employees | 521 | 10.0% |
| State Government Employees | 440 | 8.5% |
| Federal Government Employees | 145 | 2.8% |
| Unpaid Family Workers | 41 | 0.8% |
| Total | 5,204 | 100.0% |
Employment Status by Age in Gardnerville Ranchos
According to the labor force statistics for Gardnerville Ranchos, out of the total population over 16 years of age (9,959), 56.3% or 5,607 individuals are in the labor force, with 3.4% or 191 of them unemployed. The age group with the highest labor force participation rate is 30 to 34 years, with 85.4% or 651 individuals in the labor force. Within the labor force, the 25 to 29 years age range has the highest percentage of unemployed individuals, with 13.8% or 33 of them being unemployed.
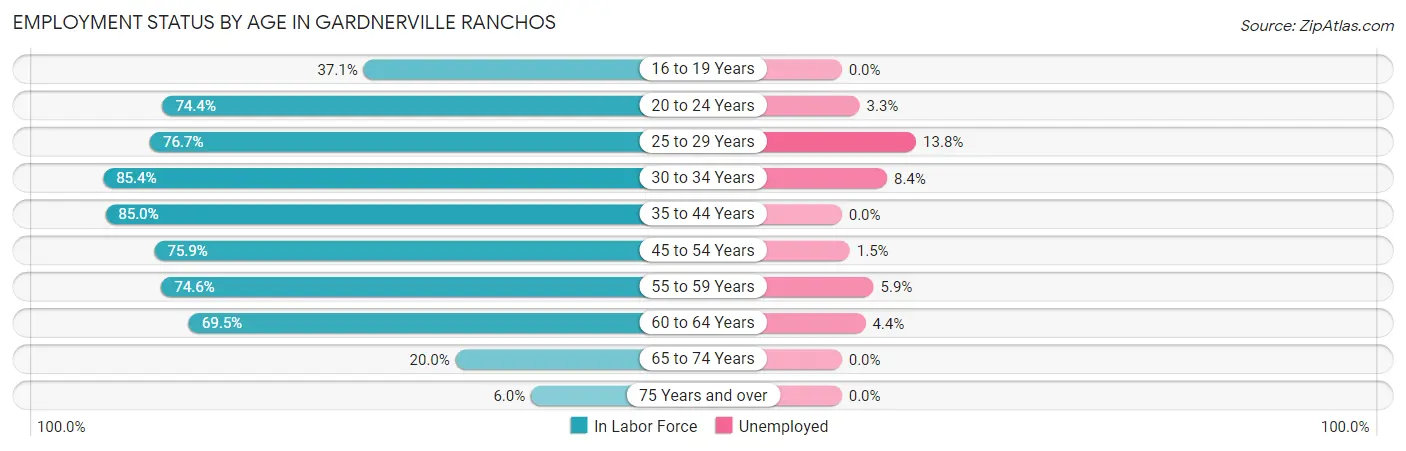
| Age Bracket | In Labor Force | Unemployed |
| 16 to 19 Years | 189 (37.1%) | 0 (0.0%) |
| 20 to 24 Years | 549 (74.4%) | 18 (3.3%) |
| 25 to 29 Years | 240 (76.7%) | 33 (13.8%) |
| 30 to 34 Years | 651 (85.4%) | 55 (8.4%) |
| 35 to 44 Years | 1,210 (85.0%) | 0 (0.0%) |
| 45 to 54 Years | 949 (75.9%) | 14 (1.5%) |
| 55 to 59 Years | 697 (74.6%) | 41 (5.9%) |
| 60 to 64 Years | 678 (69.5%) | 30 (4.4%) |
| 65 to 74 Years | 375 (20.0%) | 0 (0.0%) |
| 75 Years and over | 71 (6.0%) | 0 (0.0%) |
| Total | 5,607 (56.3%) | 191 (3.4%) |
Employment Status by Educational Attainment in Gardnerville Ranchos
According to labor force statistics for Gardnerville Ranchos, 78.2% of individuals (4,425) out of the total population between 25 and 64 years of age (5,658) are in the labor force, with 3.9% or 173 of them being unemployed. The group with the highest labor force participation rate are those with the educational attainment of college / associate degree, with 84.2% or 1,635 individuals in the labor force. Within the labor force, individuals with less than high school education have the highest percentage of unemployment, with 12.4% or 62 of them being unemployed.
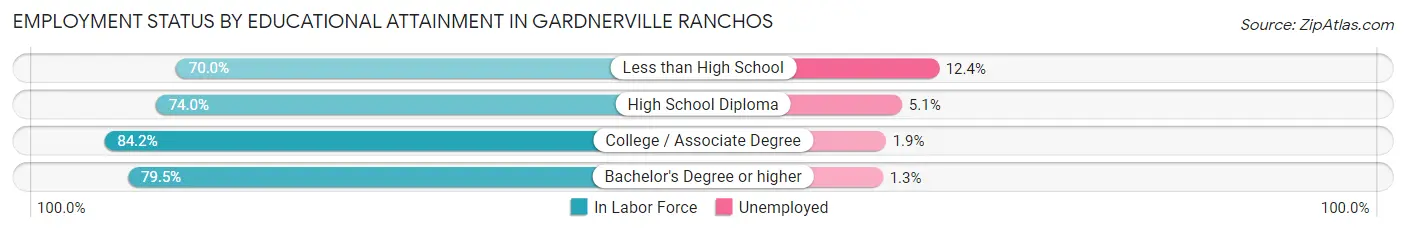
| Educational Attainment | In Labor Force | Unemployed |
| Less than High School | 502 (70.0%) | 89 (12.4%) |
| High School Diploma | 1,308 (74.0%) | 90 (5.1%) |
| College / Associate Degree | 1,635 (84.2%) | 37 (1.9%) |
| Bachelor's Degree or higher | 979 (79.5%) | 16 (1.3%) |
| Total | 4,425 (78.2%) | 221 (3.9%) |
Employment Occupations by Sex in Gardnerville Ranchos
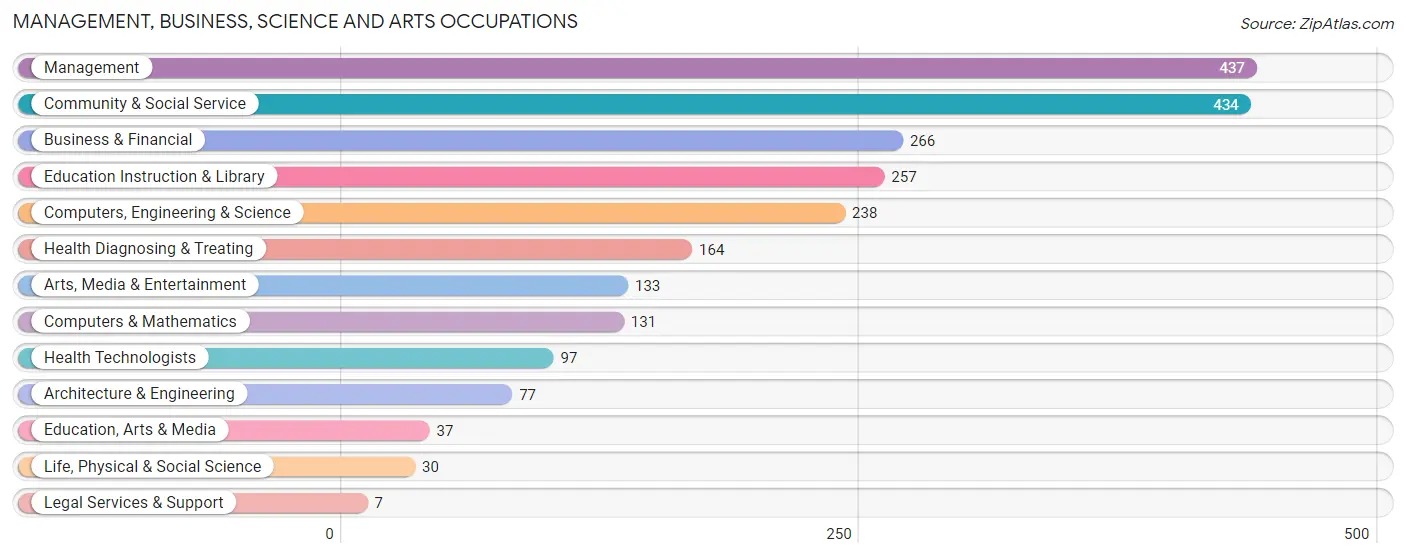
Management, Business, Science and Arts Occupations
The most common Management, Business, Science and Arts occupations in Gardnerville Ranchos are Management (437 | 8.1%), Community & Social Service (434 | 8.0%), Business & Financial (266 | 4.9%), Education Instruction & Library (257 | 4.7%), and Computers, Engineering & Science (238 | 4.4%).
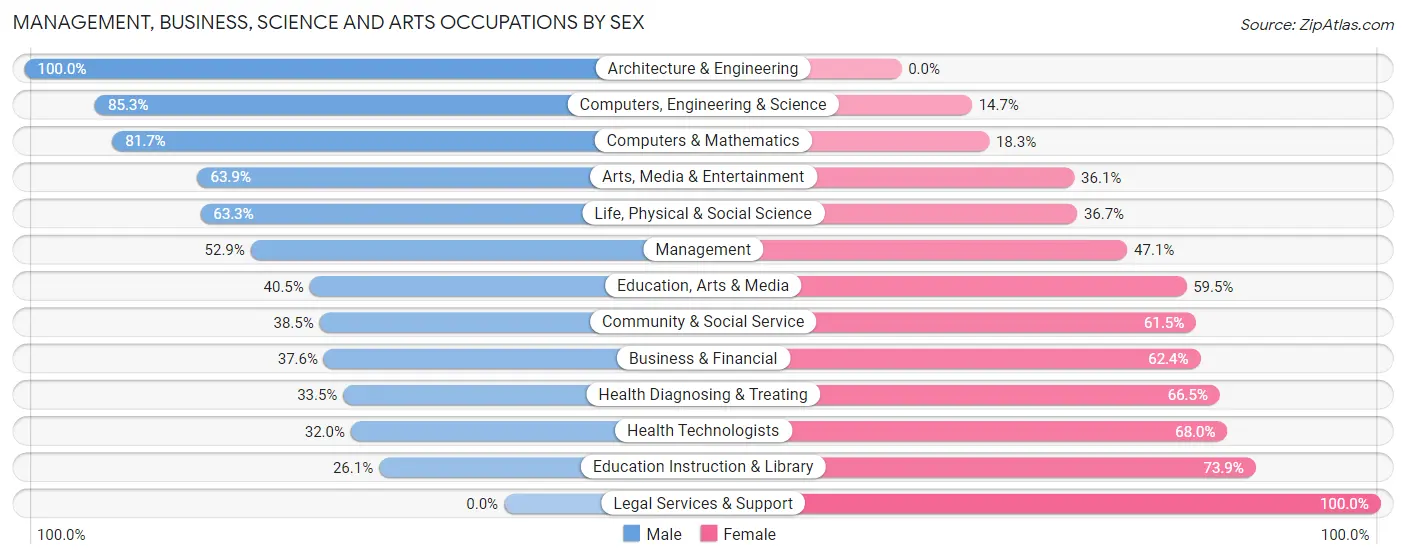
Management, Business, Science and Arts Occupations by Sex
Within the Management, Business, Science and Arts occupations in Gardnerville Ranchos, the most male-oriented occupations are Architecture & Engineering (100.0%), Computers, Engineering & Science (85.3%), and Computers & Mathematics (81.7%), while the most female-oriented occupations are Legal Services & Support (100.0%), Education Instruction & Library (73.9%), and Health Technologists (68.0%).
| Occupation | Male | Female |
| Management | 231 (52.9%) | 206 (47.1%) |
| Business & Financial | 100 (37.6%) | 166 (62.4%) |
| Computers, Engineering & Science | 203 (85.3%) | 35 (14.7%) |
| Computers & Mathematics | 107 (81.7%) | 24 (18.3%) |
| Architecture & Engineering | 77 (100.0%) | 0 (0.0%) |
| Life, Physical & Social Science | 19 (63.3%) | 11 (36.7%) |
| Community & Social Service | 167 (38.5%) | 267 (61.5%) |
| Education, Arts & Media | 15 (40.5%) | 22 (59.5%) |
| Legal Services & Support | 0 (0.0%) | 7 (100.0%) |
| Education Instruction & Library | 67 (26.1%) | 190 (73.9%) |
| Arts, Media & Entertainment | 85 (63.9%) | 48 (36.1%) |
| Health Diagnosing & Treating | 55 (33.5%) | 109 (66.5%) |
| Health Technologists | 31 (32.0%) | 66 (68.0%) |
| Total (Category) | 756 (49.1%) | 783 (50.9%) |
| Total (Overall) | 2,821 (52.1%) | 2,598 (47.9%) |
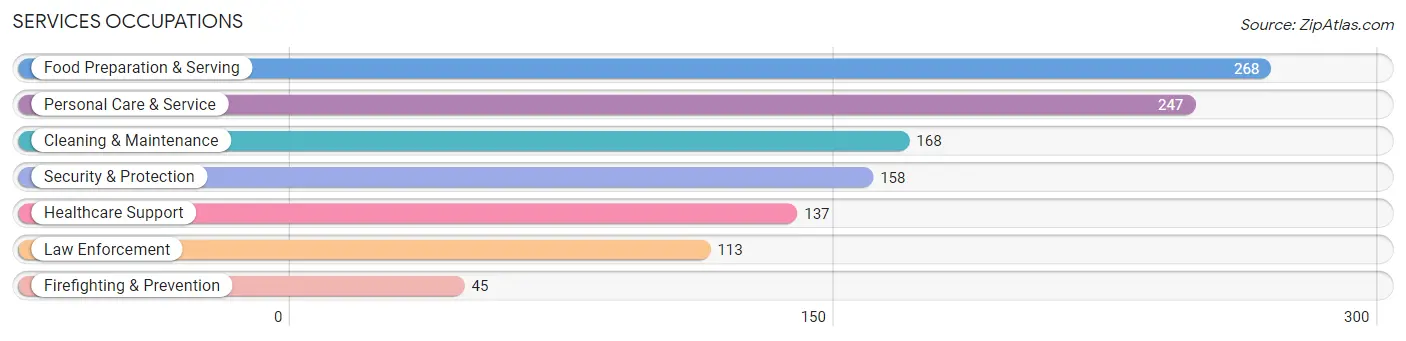
Services Occupations
The most common Services occupations in Gardnerville Ranchos are Food Preparation & Serving (268 | 5.0%), Personal Care & Service (247 | 4.6%), Cleaning & Maintenance (168 | 3.1%), Security & Protection (158 | 2.9%), and Healthcare Support (137 | 2.5%).
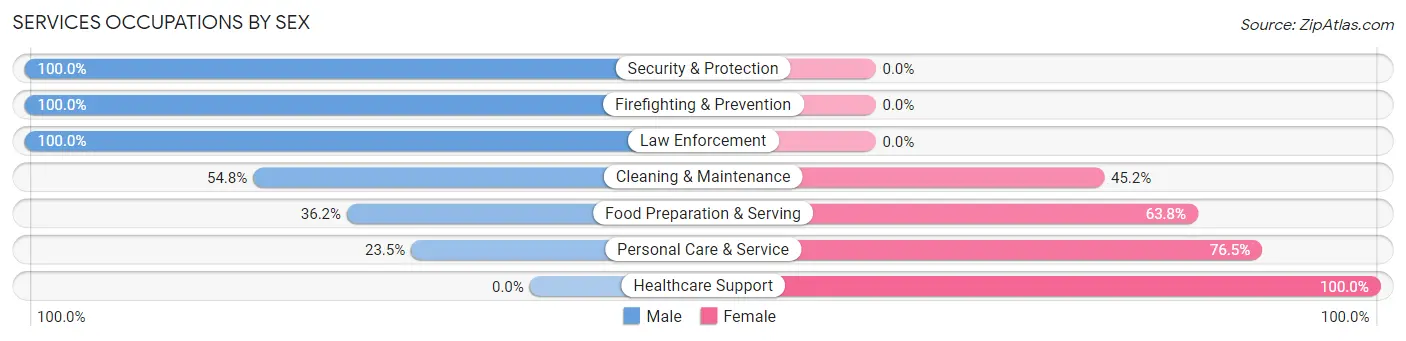
Services Occupations by Sex
Within the Services occupations in Gardnerville Ranchos, the most male-oriented occupations are Security & Protection (100.0%), Firefighting & Prevention (100.0%), and Law Enforcement (100.0%), while the most female-oriented occupations are Healthcare Support (100.0%), Personal Care & Service (76.5%), and Food Preparation & Serving (63.8%).
| Occupation | Male | Female |
| Healthcare Support | 0 (0.0%) | 137 (100.0%) |
| Security & Protection | 158 (100.0%) | 0 (0.0%) |
| Firefighting & Prevention | 45 (100.0%) | 0 (0.0%) |
| Law Enforcement | 113 (100.0%) | 0 (0.0%) |
| Food Preparation & Serving | 97 (36.2%) | 171 (63.8%) |
| Cleaning & Maintenance | 92 (54.8%) | 76 (45.2%) |
| Personal Care & Service | 58 (23.5%) | 189 (76.5%) |
| Total (Category) | 405 (41.4%) | 573 (58.6%) |
| Total (Overall) | 2,821 (52.1%) | 2,598 (47.9%) |
Sales and Office Occupations
The most common Sales and Office occupations in Gardnerville Ranchos are Sales & Related (844 | 15.6%), and Office & Administration (826 | 15.2%).
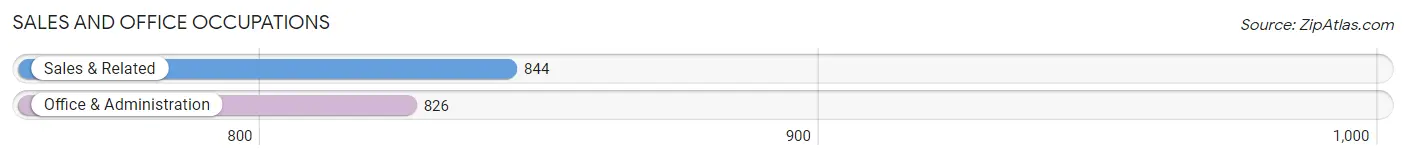
Sales and Office Occupations by Sex
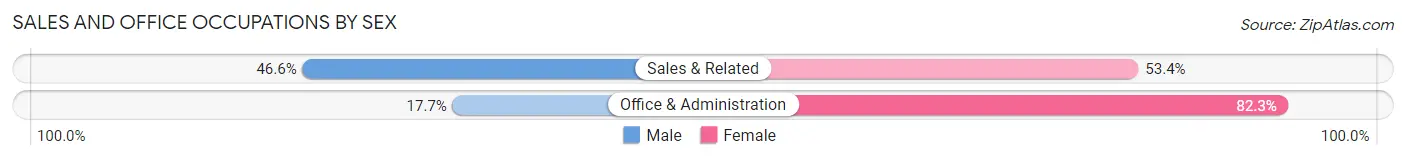
| Occupation | Male | Female |
| Sales & Related | 393 (46.6%) | 451 (53.4%) |
| Office & Administration | 146 (17.7%) | 680 (82.3%) |
| Total (Category) | 539 (32.3%) | 1,131 (67.7%) |
| Total (Overall) | 2,821 (52.1%) | 2,598 (47.9%) |
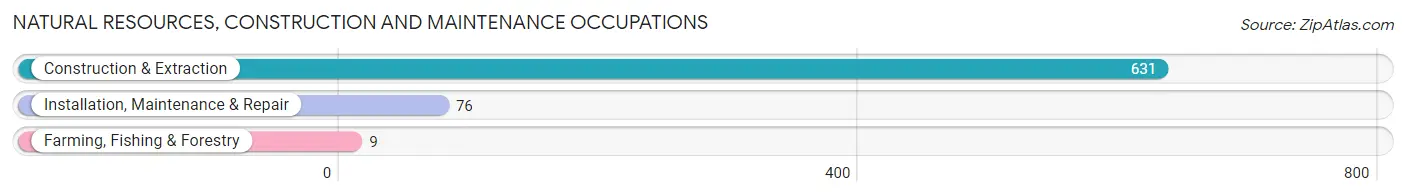
Natural Resources, Construction and Maintenance Occupations
The most common Natural Resources, Construction and Maintenance occupations in Gardnerville Ranchos are Construction & Extraction (631 | 11.6%), Installation, Maintenance & Repair (76 | 1.4%), and Farming, Fishing & Forestry (9 | 0.2%).
Natural Resources, Construction and Maintenance Occupations by Sex
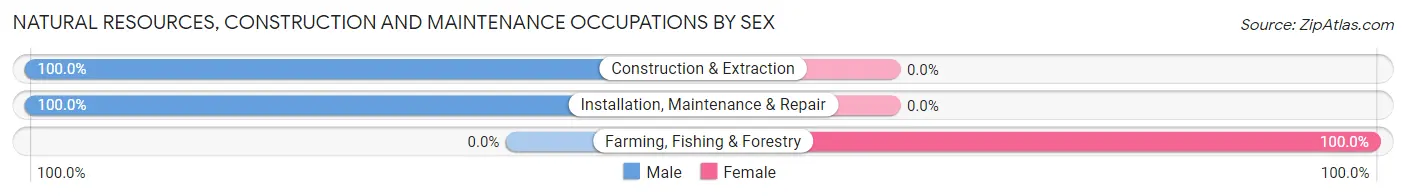
| Occupation | Male | Female |
| Farming, Fishing & Forestry | 0 (0.0%) | 9 (100.0%) |
| Construction & Extraction | 631 (100.0%) | 0 (0.0%) |
| Installation, Maintenance & Repair | 76 (100.0%) | 0 (0.0%) |
| Total (Category) | 707 (98.7%) | 9 (1.3%) |
| Total (Overall) | 2,821 (52.1%) | 2,598 (47.9%) |
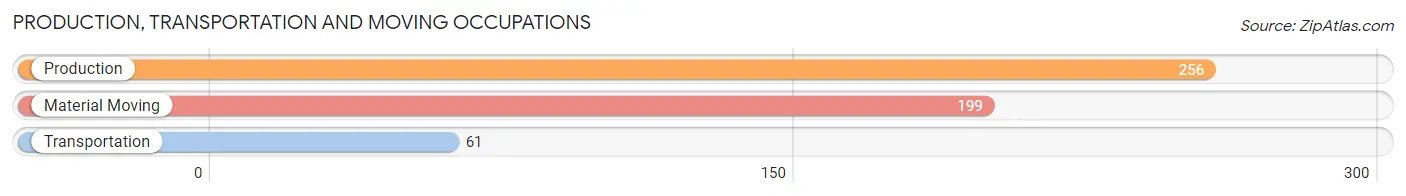
Production, Transportation and Moving Occupations
The most common Production, Transportation and Moving occupations in Gardnerville Ranchos are Production (256 | 4.7%), Material Moving (199 | 3.7%), and Transportation (61 | 1.1%).
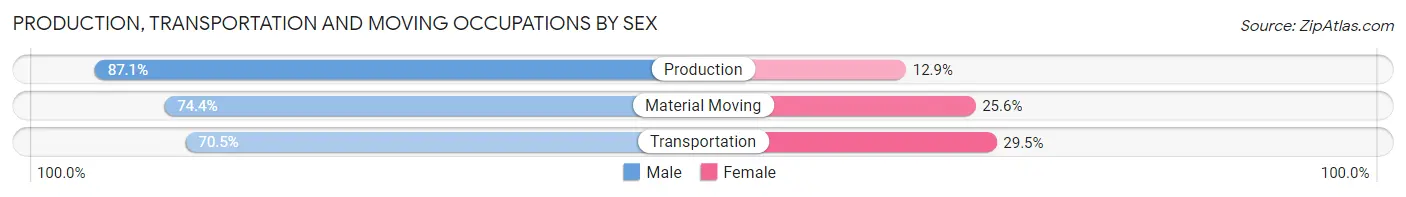
Production, Transportation and Moving Occupations by Sex
| Occupation | Male | Female |
| Production | 223 (87.1%) | 33 (12.9%) |
| Transportation | 43 (70.5%) | 18 (29.5%) |
| Material Moving | 148 (74.4%) | 51 (25.6%) |
| Total (Category) | 414 (80.2%) | 102 (19.8%) |
| Total (Overall) | 2,821 (52.1%) | 2,598 (47.9%) |
Employment Industries by Sex in Gardnerville Ranchos
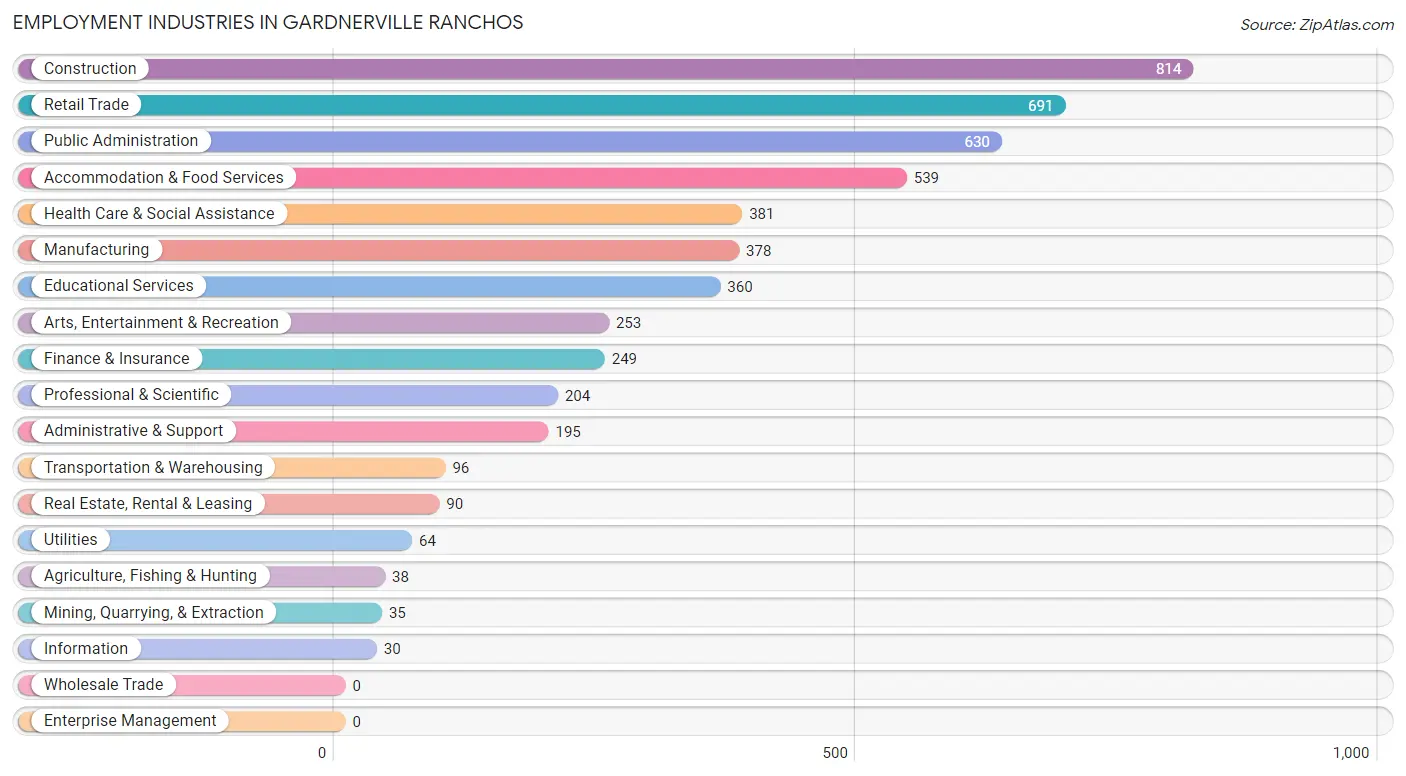
Employment Industries in Gardnerville Ranchos
The major employment industries in Gardnerville Ranchos include Construction (814 | 15.0%), Retail Trade (691 | 12.8%), Public Administration (630 | 11.6%), Accommodation & Food Services (539 | 10.0%), and Health Care & Social Assistance (381 | 7.0%).
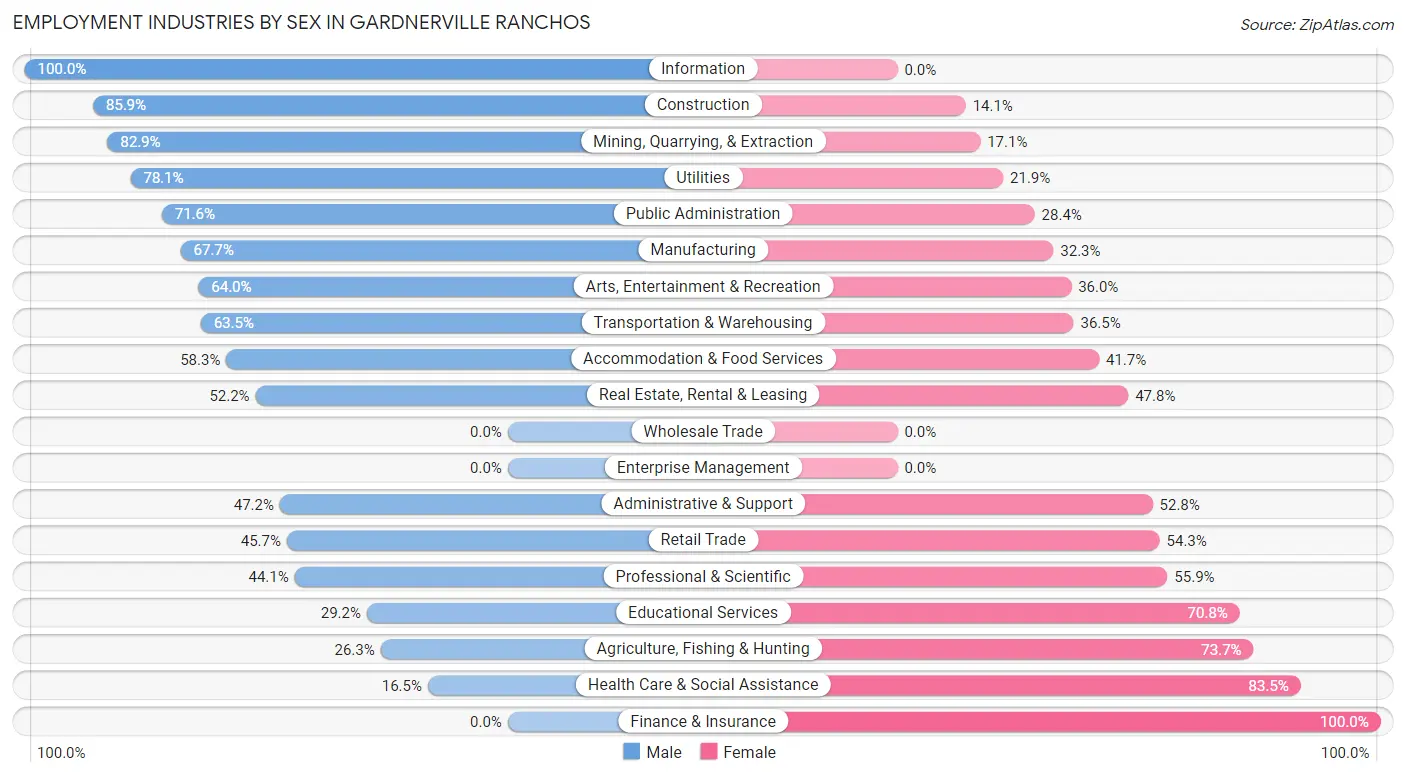
Employment Industries by Sex in Gardnerville Ranchos
The Gardnerville Ranchos industries that see more men than women are Information (100.0%), Construction (85.9%), and Mining, Quarrying, & Extraction (82.9%), whereas the industries that tend to have a higher number of women are Finance & Insurance (100.0%), Health Care & Social Assistance (83.5%), and Agriculture, Fishing & Hunting (73.7%).
| Industry | Male | Female |
| Agriculture, Fishing & Hunting | 10 (26.3%) | 28 (73.7%) |
| Mining, Quarrying, & Extraction | 29 (82.9%) | 6 (17.1%) |
| Construction | 699 (85.9%) | 115 (14.1%) |
| Manufacturing | 256 (67.7%) | 122 (32.3%) |
| Wholesale Trade | 0 (0.0%) | 0 (0.0%) |
| Retail Trade | 316 (45.7%) | 375 (54.3%) |
| Transportation & Warehousing | 61 (63.5%) | 35 (36.5%) |
| Utilities | 50 (78.1%) | 14 (21.9%) |
| Information | 30 (100.0%) | 0 (0.0%) |
| Finance & Insurance | 0 (0.0%) | 249 (100.0%) |
| Real Estate, Rental & Leasing | 47 (52.2%) | 43 (47.8%) |
| Professional & Scientific | 90 (44.1%) | 114 (55.9%) |
| Enterprise Management | 0 (0.0%) | 0 (0.0%) |
| Administrative & Support | 92 (47.2%) | 103 (52.8%) |
| Educational Services | 105 (29.2%) | 255 (70.8%) |
| Health Care & Social Assistance | 63 (16.5%) | 318 (83.5%) |
| Arts, Entertainment & Recreation | 162 (64.0%) | 91 (36.0%) |
| Accommodation & Food Services | 314 (58.3%) | 225 (41.7%) |
| Public Administration | 451 (71.6%) | 179 (28.4%) |
| Total | 2,821 (52.1%) | 2,598 (47.9%) |
Education in Gardnerville Ranchos
School Enrollment in Gardnerville Ranchos
The most common levels of schooling among the 2,914 students in Gardnerville Ranchos are high school (707 | 24.3%), middle school (661 | 22.7%), and elementary school (653 | 22.4%).
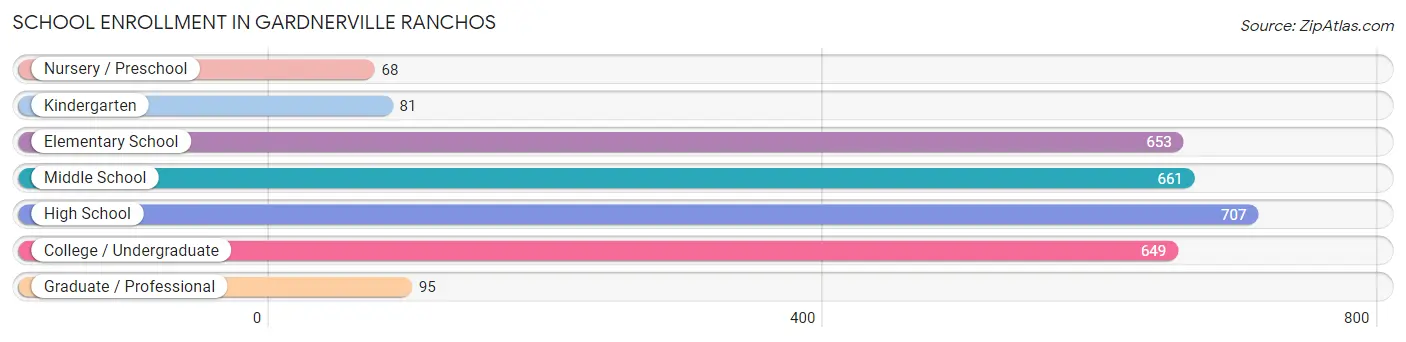
| School Level | # Students | % Students |
| Nursery / Preschool | 68 | 2.3% |
| Kindergarten | 81 | 2.8% |
| Elementary School | 653 | 22.4% |
| Middle School | 661 | 22.7% |
| High School | 707 | 24.3% |
| College / Undergraduate | 649 | 22.3% |
| Graduate / Professional | 95 | 3.3% |
| Total | 2,914 | 100.0% |
School Enrollment by Age by Funding Source in Gardnerville Ranchos
Out of a total of 2,914 students who are enrolled in schools in Gardnerville Ranchos, 262 (9.0%) attend a private institution, while the remaining 2,652 (91.0%) are enrolled in public schools. The age group of 35 years and over has the highest likelihood of being enrolled in private schools, with 50 (33.6% in the age bracket) enrolled. Conversely, the age group of 15 to 17 year olds has the lowest likelihood of being enrolled in a private school, with 503 (100.0% in the age bracket) attending a public institution.
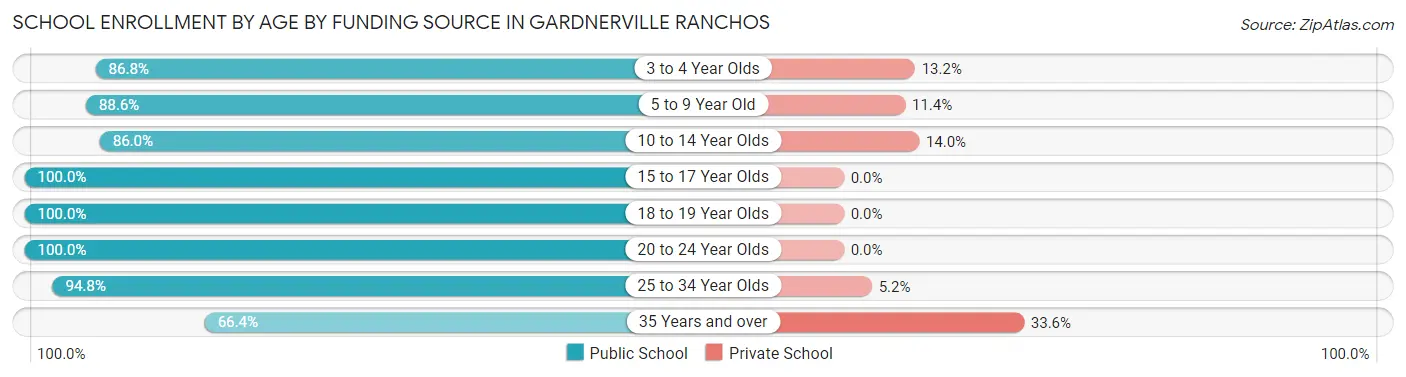
| Age Bracket | Public School | Private School |
| 3 to 4 Year Olds | 59 (86.8%) | 9 (13.2%) |
| 5 to 9 Year Old | 589 (88.6%) | 76 (11.4%) |
| 10 to 14 Year Olds | 730 (86.0%) | 119 (14.0%) |
| 15 to 17 Year Olds | 503 (100.0%) | 0 (0.0%) |
| 18 to 19 Year Olds | 228 (100.0%) | 0 (0.0%) |
| 20 to 24 Year Olds | 318 (100.0%) | 0 (0.0%) |
| 25 to 34 Year Olds | 127 (94.8%) | 7 (5.2%) |
| 35 Years and over | 99 (66.4%) | 50 (33.6%) |
| Total | 2,652 (91.0%) | 262 (9.0%) |
Educational Attainment by Field of Study in Gardnerville Ranchos
Business (310 | 16.0%), education (273 | 14.0%), visual & performing arts (223 | 11.5%), science & technology (212 | 10.9%), and social sciences (171 | 8.8%) are the most common fields of study among 1,944 individuals in Gardnerville Ranchos who have obtained a bachelor's degree or higher.
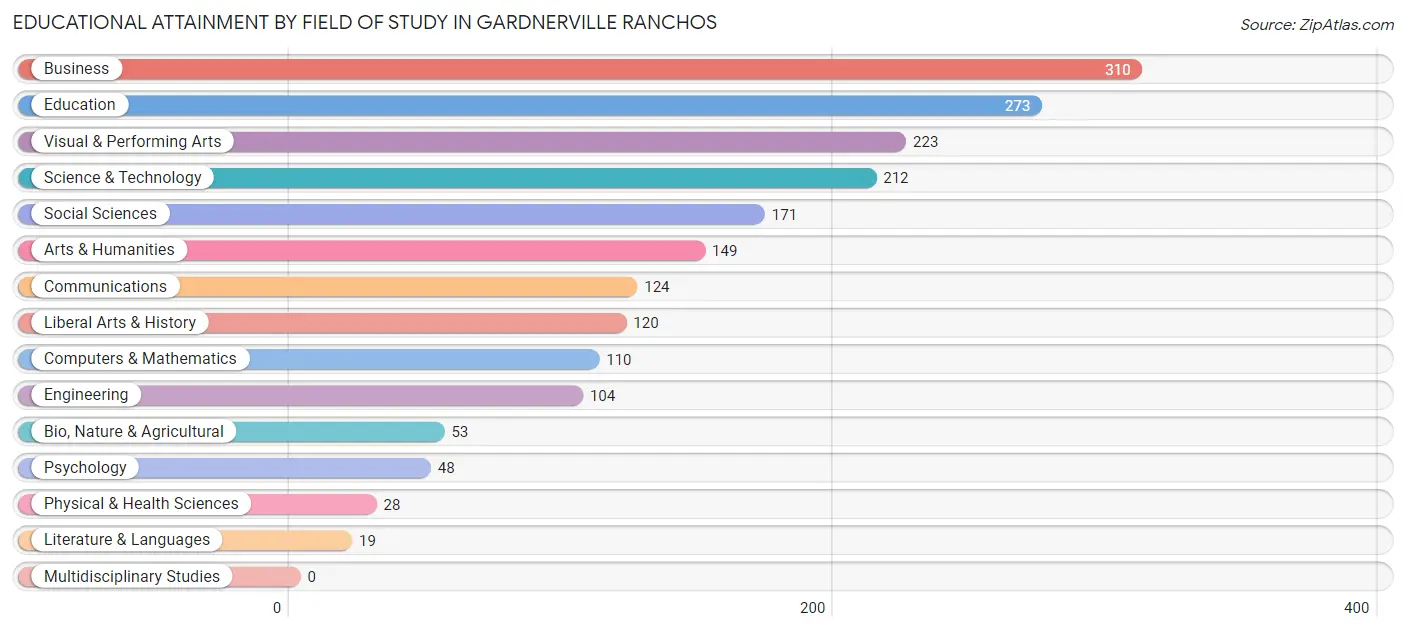
| Field of Study | # Graduates | % Graduates |
| Computers & Mathematics | 110 | 5.7% |
| Bio, Nature & Agricultural | 53 | 2.7% |
| Physical & Health Sciences | 28 | 1.4% |
| Psychology | 48 | 2.5% |
| Social Sciences | 171 | 8.8% |
| Engineering | 104 | 5.3% |
| Multidisciplinary Studies | 0 | 0.0% |
| Science & Technology | 212 | 10.9% |
| Business | 310 | 16.0% |
| Education | 273 | 14.0% |
| Literature & Languages | 19 | 1.0% |
| Liberal Arts & History | 120 | 6.2% |
| Visual & Performing Arts | 223 | 11.5% |
| Communications | 124 | 6.4% |
| Arts & Humanities | 149 | 7.7% |
| Total | 1,944 | 100.0% |
Transportation & Commute in Gardnerville Ranchos
Vehicle Availability by Sex in Gardnerville Ranchos
The most prevalent vehicle ownership categories in Gardnerville Ranchos are males with 2 vehicles (989, accounting for 38.0%) and females with 2 vehicles (959, making up 38.1%).
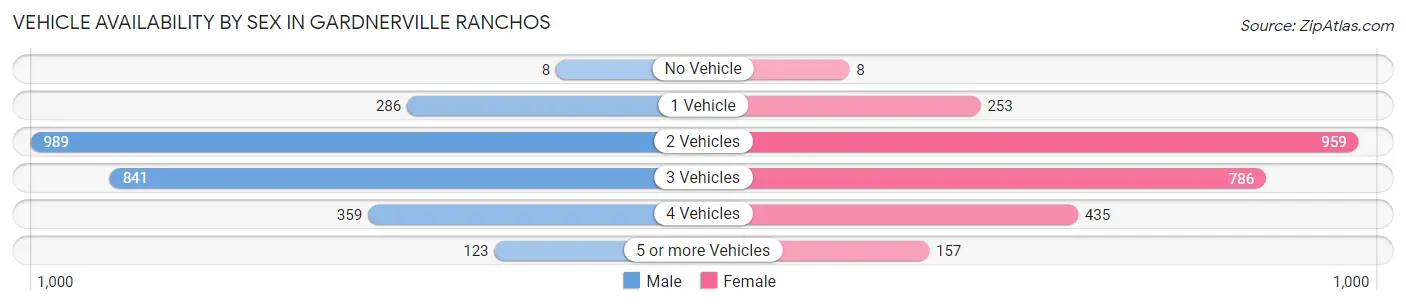
| Vehicles Available | Male | Female |
| No Vehicle | 8 (0.3%) | 8 (0.3%) |
| 1 Vehicle | 286 (11.0%) | 253 (9.7%) |
| 2 Vehicles | 989 (38.0%) | 959 (36.9%) |
| 3 Vehicles | 841 (32.3%) | 786 (30.2%) |
| 4 Vehicles | 359 (13.8%) | 435 (16.7%) |
| 5 or more Vehicles | 123 (4.7%) | 157 (6.0%) |
| Total | 2,606 (100.0%) | 2,598 (100.0%) |
Commute Time in Gardnerville Ranchos
The most frequently occuring commute durations in Gardnerville Ranchos are 10 to 14 minutes (866 commuters, 17.7%), 45 to 59 minutes (615 commuters, 12.6%), and 15 to 19 minutes (606 commuters, 12.4%).
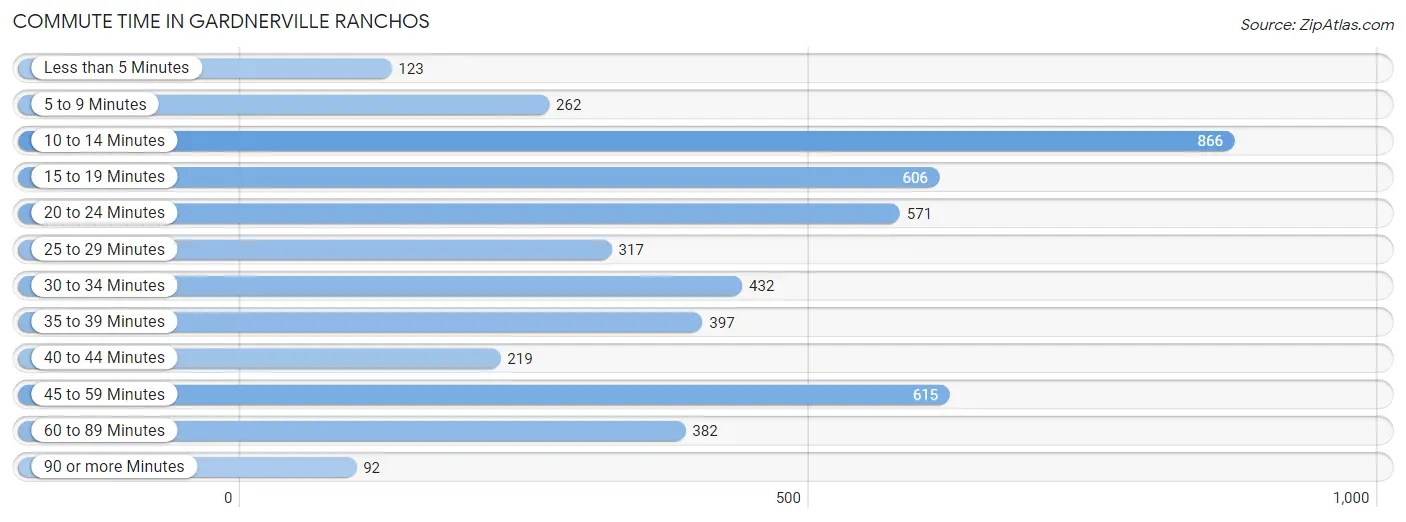
| Commute Time | # Commuters | % Commuters |
| Less than 5 Minutes | 123 | 2.5% |
| 5 to 9 Minutes | 262 | 5.4% |
| 10 to 14 Minutes | 866 | 17.7% |
| 15 to 19 Minutes | 606 | 12.4% |
| 20 to 24 Minutes | 571 | 11.7% |
| 25 to 29 Minutes | 317 | 6.5% |
| 30 to 34 Minutes | 432 | 8.8% |
| 35 to 39 Minutes | 397 | 8.1% |
| 40 to 44 Minutes | 219 | 4.5% |
| 45 to 59 Minutes | 615 | 12.6% |
| 60 to 89 Minutes | 382 | 7.8% |
| 90 or more Minutes | 92 | 1.9% |
Commute Time by Sex in Gardnerville Ranchos
The most common commute times in Gardnerville Ranchos are 10 to 14 minutes (471 commuters, 18.8%) for males and 10 to 14 minutes (395 commuters, 16.7%) for females.
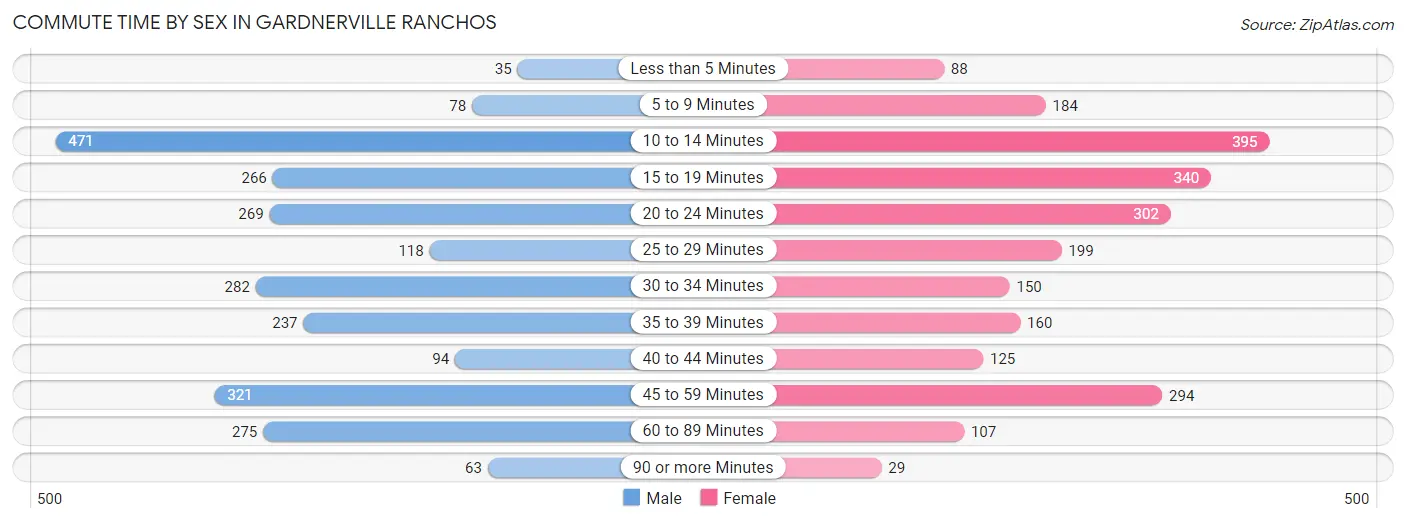
| Commute Time | Male | Female |
| Less than 5 Minutes | 35 (1.4%) | 88 (3.7%) |
| 5 to 9 Minutes | 78 (3.1%) | 184 (7.7%) |
| 10 to 14 Minutes | 471 (18.8%) | 395 (16.7%) |
| 15 to 19 Minutes | 266 (10.6%) | 340 (14.3%) |
| 20 to 24 Minutes | 269 (10.7%) | 302 (12.7%) |
| 25 to 29 Minutes | 118 (4.7%) | 199 (8.4%) |
| 30 to 34 Minutes | 282 (11.2%) | 150 (6.3%) |
| 35 to 39 Minutes | 237 (9.5%) | 160 (6.7%) |
| 40 to 44 Minutes | 94 (3.7%) | 125 (5.3%) |
| 45 to 59 Minutes | 321 (12.8%) | 294 (12.4%) |
| 60 to 89 Minutes | 275 (11.0%) | 107 (4.5%) |
| 90 or more Minutes | 63 (2.5%) | 29 (1.2%) |
Time of Departure to Work by Sex in Gardnerville Ranchos
The most frequent times of departure to work in Gardnerville Ranchos are 6:00 AM to 6:29 AM (524, 20.9%) for males and 7:00 AM to 7:29 AM (385, 16.2%) for females.
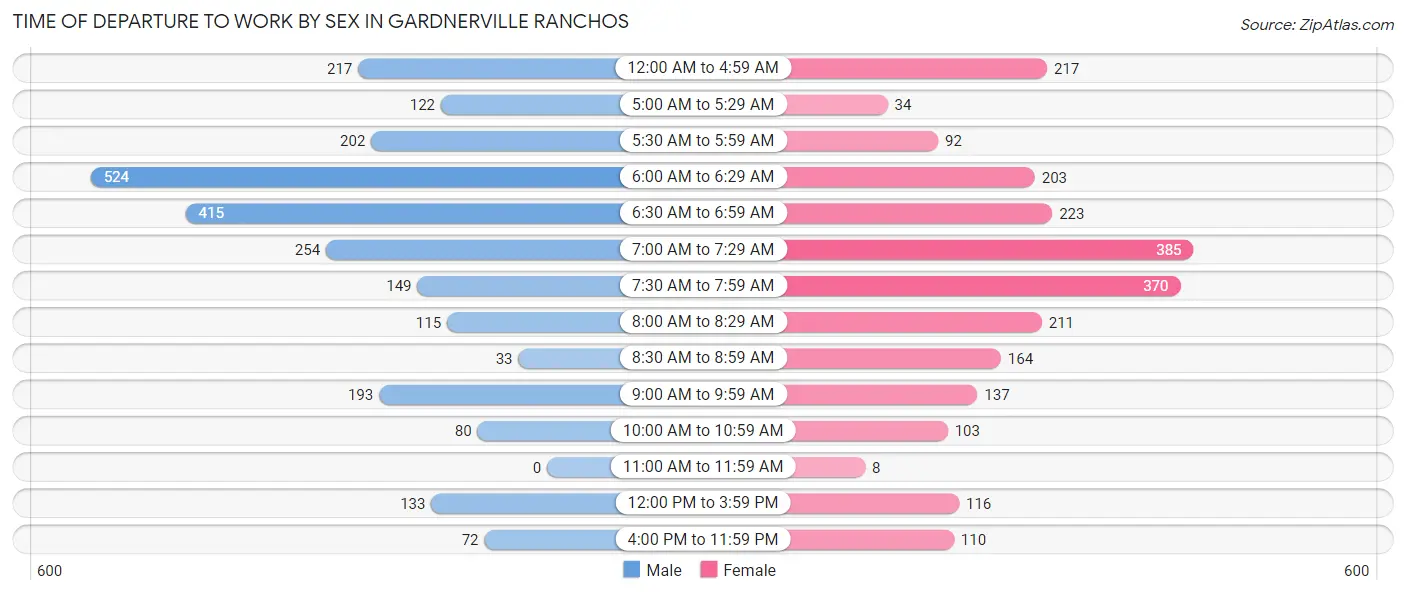
| Time of Departure | Male | Female |
| 12:00 AM to 4:59 AM | 217 (8.6%) | 217 (9.1%) |
| 5:00 AM to 5:29 AM | 122 (4.9%) | 34 (1.4%) |
| 5:30 AM to 5:59 AM | 202 (8.1%) | 92 (3.9%) |
| 6:00 AM to 6:29 AM | 524 (20.9%) | 203 (8.6%) |
| 6:30 AM to 6:59 AM | 415 (16.5%) | 223 (9.4%) |
| 7:00 AM to 7:29 AM | 254 (10.1%) | 385 (16.2%) |
| 7:30 AM to 7:59 AM | 149 (5.9%) | 370 (15.6%) |
| 8:00 AM to 8:29 AM | 115 (4.6%) | 211 (8.9%) |
| 8:30 AM to 8:59 AM | 33 (1.3%) | 164 (6.9%) |
| 9:00 AM to 9:59 AM | 193 (7.7%) | 137 (5.8%) |
| 10:00 AM to 10:59 AM | 80 (3.2%) | 103 (4.3%) |
| 11:00 AM to 11:59 AM | 0 (0.0%) | 8 (0.3%) |
| 12:00 PM to 3:59 PM | 133 (5.3%) | 116 (4.9%) |
| 4:00 PM to 11:59 PM | 72 (2.9%) | 110 (4.6%) |
| Total | 2,509 (100.0%) | 2,373 (100.0%) |
Housing Occupancy in Gardnerville Ranchos
Occupancy by Ownership in Gardnerville Ranchos
Of the total 4,549 dwellings in Gardnerville Ranchos, owner-occupied units account for 3,368 (74.0%), while renter-occupied units make up 1,181 (26.0%).
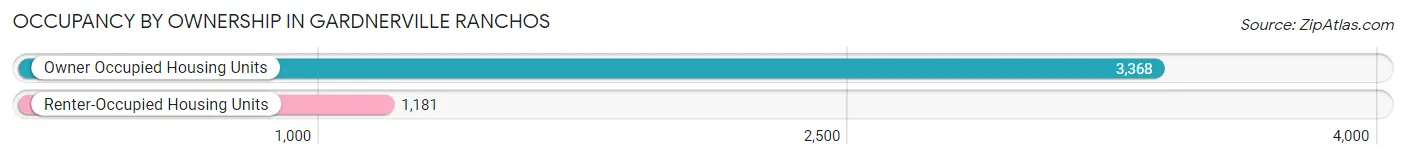
| Occupancy | # Housing Units | % Housing Units |
| Owner Occupied Housing Units | 3,368 | 74.0% |
| Renter-Occupied Housing Units | 1,181 | 26.0% |
| Total Occupied Housing Units | 4,549 | 100.0% |
Occupancy by Household Size in Gardnerville Ranchos
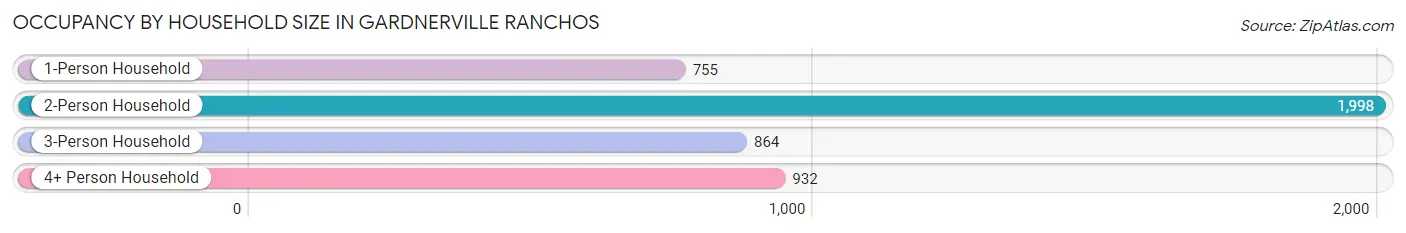
| Household Size | # Housing Units | % Housing Units |
| 1-Person Household | 755 | 16.6% |
| 2-Person Household | 1,998 | 43.9% |
| 3-Person Household | 864 | 19.0% |
| 4+ Person Household | 932 | 20.5% |
| Total Housing Units | 4,549 | 100.0% |
Occupancy by Ownership by Household Size in Gardnerville Ranchos
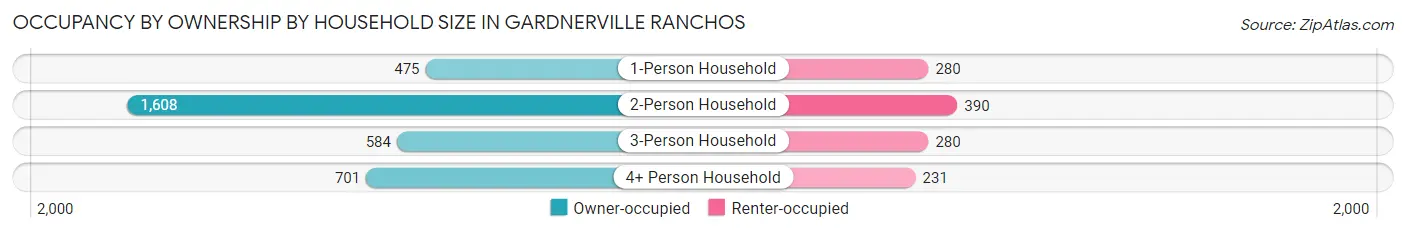
| Household Size | Owner-occupied | Renter-occupied |
| 1-Person Household | 475 (62.9%) | 280 (37.1%) |
| 2-Person Household | 1,608 (80.5%) | 390 (19.5%) |
| 3-Person Household | 584 (67.6%) | 280 (32.4%) |
| 4+ Person Household | 701 (75.2%) | 231 (24.8%) |
| Total Housing Units | 3,368 (74.0%) | 1,181 (26.0%) |
Occupancy by Educational Attainment in Gardnerville Ranchos
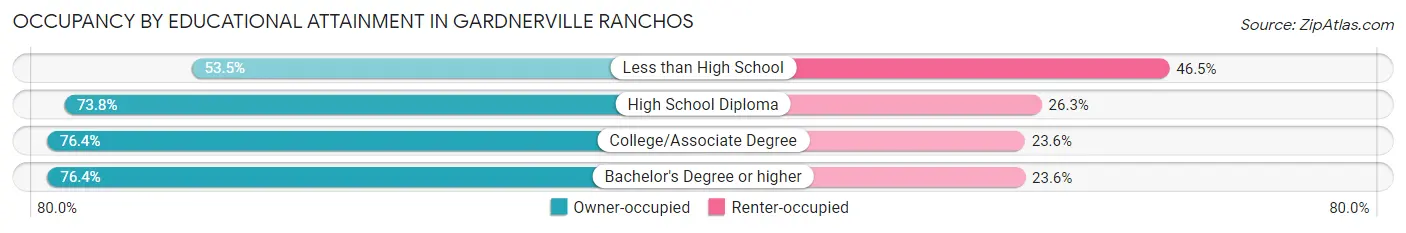
| Household Size | Owner-occupied | Renter-occupied |
| Less than High School | 176 (53.5%) | 153 (46.5%) |
| High School Diploma | 902 (73.8%) | 321 (26.3%) |
| College/Associate Degree | 1,346 (76.4%) | 415 (23.6%) |
| Bachelor's Degree or higher | 944 (76.4%) | 292 (23.6%) |
Occupancy by Age of Householder in Gardnerville Ranchos
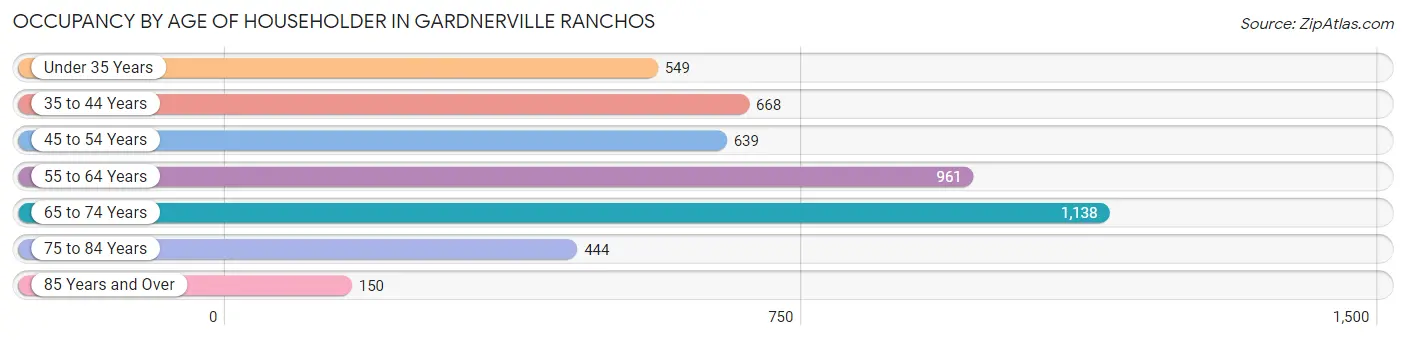
| Age Bracket | # Households | % Households |
| Under 35 Years | 549 | 12.1% |
| 35 to 44 Years | 668 | 14.7% |
| 45 to 54 Years | 639 | 14.1% |
| 55 to 64 Years | 961 | 21.1% |
| 65 to 74 Years | 1,138 | 25.0% |
| 75 to 84 Years | 444 | 9.8% |
| 85 Years and Over | 150 | 3.3% |
| Total | 4,549 | 100.0% |
Housing Finances in Gardnerville Ranchos
Median Income by Occupancy in Gardnerville Ranchos
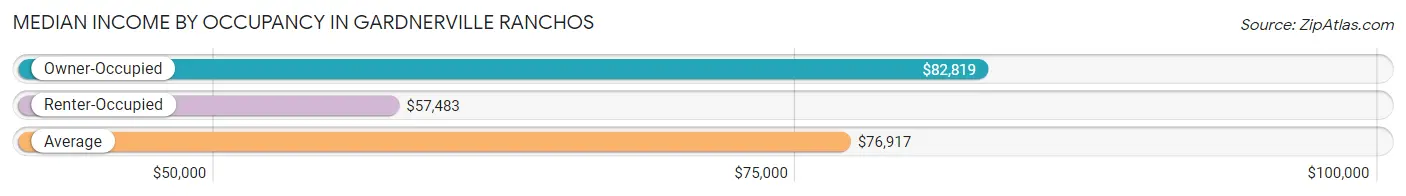
| Occupancy Type | # Households | Median Income |
| Owner-Occupied | 3,368 (74.0%) | $82,819 |
| Renter-Occupied | 1,181 (26.0%) | $57,483 |
| Average | 4,549 (100.0%) | $76,917 |
Occupancy by Householder Income Bracket in Gardnerville Ranchos
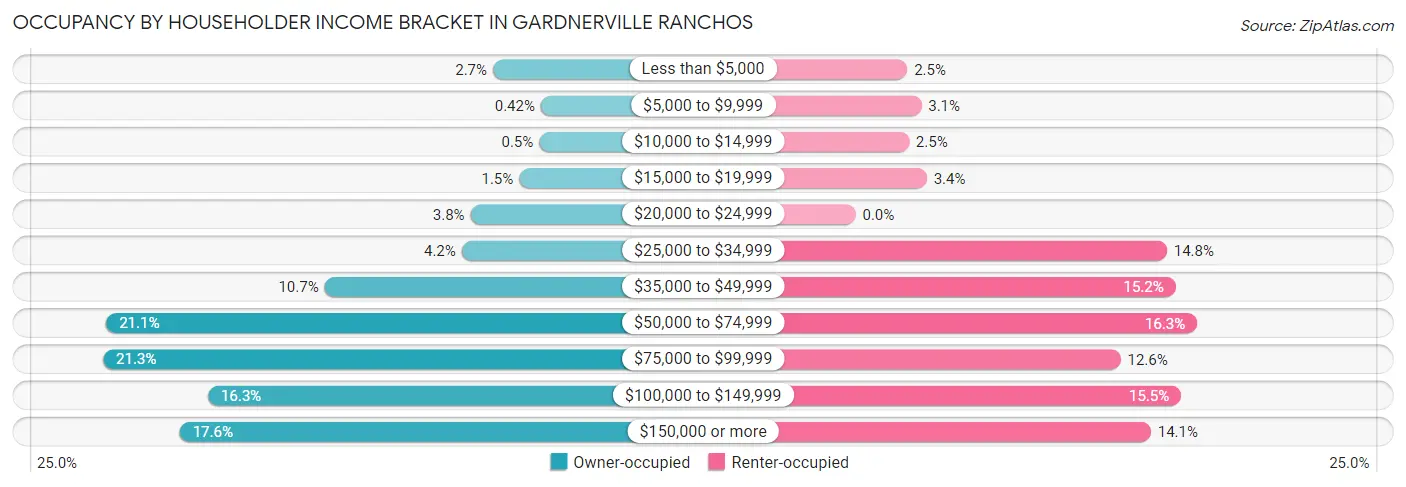
| Income Bracket | Owner-occupied | Renter-occupied |
| Less than $5,000 | 91 (2.7%) | 29 (2.5%) |
| $5,000 to $9,999 | 14 (0.4%) | 37 (3.1%) |
| $10,000 to $14,999 | 17 (0.5%) | 30 (2.5%) |
| $15,000 to $19,999 | 49 (1.5%) | 40 (3.4%) |
| $20,000 to $24,999 | 127 (3.8%) | 0 (0.0%) |
| $25,000 to $34,999 | 141 (4.2%) | 175 (14.8%) |
| $35,000 to $49,999 | 361 (10.7%) | 180 (15.2%) |
| $50,000 to $74,999 | 711 (21.1%) | 192 (16.3%) |
| $75,000 to $99,999 | 716 (21.3%) | 149 (12.6%) |
| $100,000 to $149,999 | 548 (16.3%) | 183 (15.5%) |
| $150,000 or more | 593 (17.6%) | 166 (14.1%) |
| Total | 3,368 (100.0%) | 1,181 (100.0%) |
Monthly Housing Cost Tiers in Gardnerville Ranchos
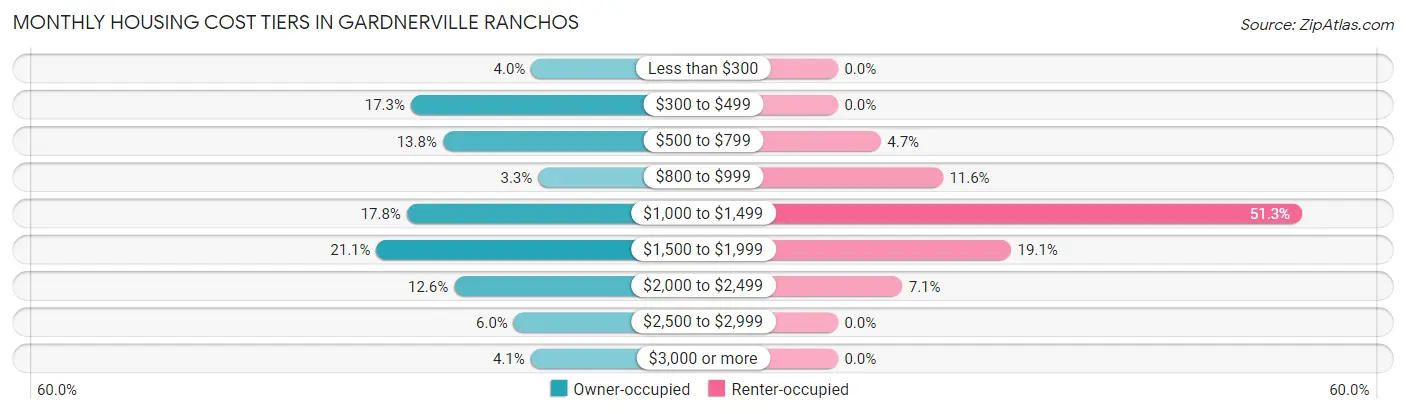
| Monthly Cost | Owner-occupied | Renter-occupied |
| Less than $300 | 136 (4.0%) | 0 (0.0%) |
| $300 to $499 | 584 (17.3%) | 0 (0.0%) |
| $500 to $799 | 465 (13.8%) | 56 (4.7%) |
| $800 to $999 | 110 (3.3%) | 137 (11.6%) |
| $1,000 to $1,499 | 599 (17.8%) | 606 (51.3%) |
| $1,500 to $1,999 | 712 (21.1%) | 226 (19.1%) |
| $2,000 to $2,499 | 423 (12.6%) | 84 (7.1%) |
| $2,500 to $2,999 | 201 (6.0%) | 0 (0.0%) |
| $3,000 or more | 138 (4.1%) | 0 (0.0%) |
| Total | 3,368 (100.0%) | 1,181 (100.0%) |
Physical Housing Characteristics in Gardnerville Ranchos
Housing Structures in Gardnerville Ranchos
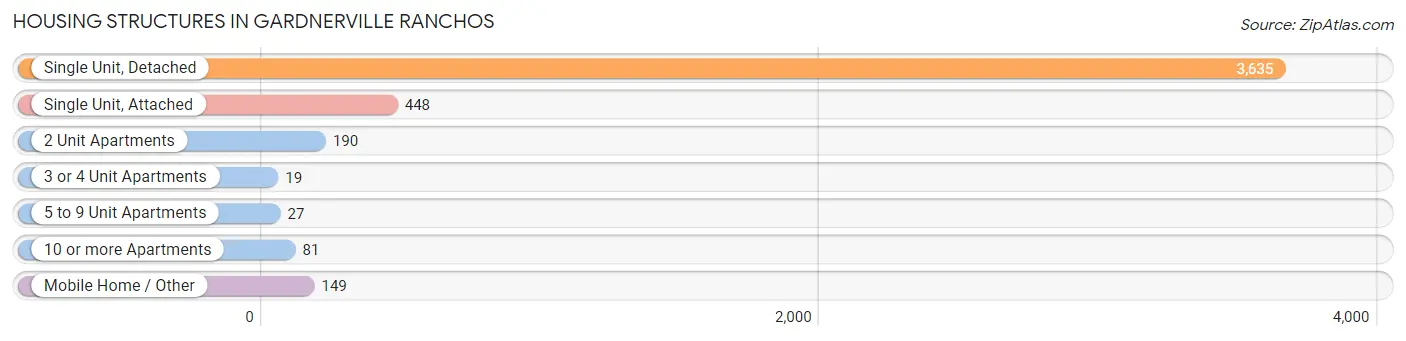
| Structure Type | # Housing Units | % Housing Units |
| Single Unit, Detached | 3,635 | 79.9% |
| Single Unit, Attached | 448 | 9.9% |
| 2 Unit Apartments | 190 | 4.2% |
| 3 or 4 Unit Apartments | 19 | 0.4% |
| 5 to 9 Unit Apartments | 27 | 0.6% |
| 10 or more Apartments | 81 | 1.8% |
| Mobile Home / Other | 149 | 3.3% |
| Total | 4,549 | 100.0% |
Housing Structures by Occupancy in Gardnerville Ranchos
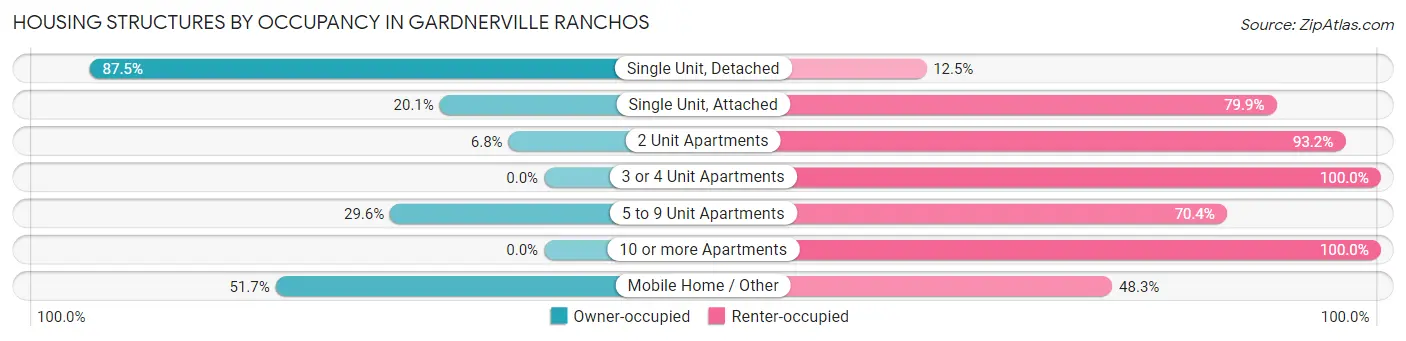
| Structure Type | Owner-occupied | Renter-occupied |
| Single Unit, Detached | 3,180 (87.5%) | 455 (12.5%) |
| Single Unit, Attached | 90 (20.1%) | 358 (79.9%) |
| 2 Unit Apartments | 13 (6.8%) | 177 (93.2%) |
| 3 or 4 Unit Apartments | 0 (0.0%) | 19 (100.0%) |
| 5 to 9 Unit Apartments | 8 (29.6%) | 19 (70.4%) |
| 10 or more Apartments | 0 (0.0%) | 81 (100.0%) |
| Mobile Home / Other | 77 (51.7%) | 72 (48.3%) |
| Total | 3,368 (74.0%) | 1,181 (26.0%) |
Housing Structures by Number of Rooms in Gardnerville Ranchos
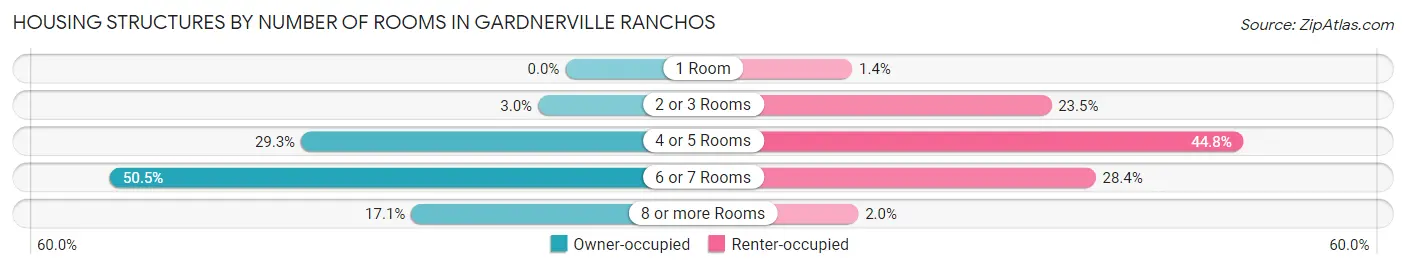
| Number of Rooms | Owner-occupied | Renter-occupied |
| 1 Room | 0 (0.0%) | 16 (1.3%) |
| 2 or 3 Rooms | 102 (3.0%) | 277 (23.4%) |
| 4 or 5 Rooms | 988 (29.3%) | 529 (44.8%) |
| 6 or 7 Rooms | 1,702 (50.5%) | 335 (28.4%) |
| 8 or more Rooms | 576 (17.1%) | 24 (2.0%) |
| Total | 3,368 (100.0%) | 1,181 (100.0%) |
Housing Structure by Heating Type in Gardnerville Ranchos
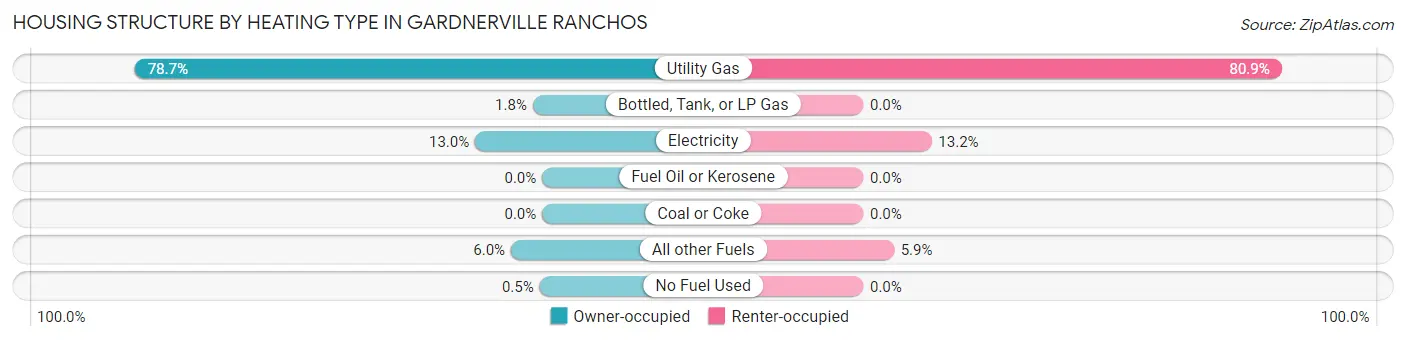
| Heating Type | Owner-occupied | Renter-occupied |
| Utility Gas | 2,651 (78.7%) | 955 (80.9%) |
| Bottled, Tank, or LP Gas | 61 (1.8%) | 0 (0.0%) |
| Electricity | 436 (13.0%) | 156 (13.2%) |
| Fuel Oil or Kerosene | 0 (0.0%) | 0 (0.0%) |
| Coal or Coke | 0 (0.0%) | 0 (0.0%) |
| All other Fuels | 203 (6.0%) | 70 (5.9%) |
| No Fuel Used | 17 (0.5%) | 0 (0.0%) |
| Total | 3,368 (100.0%) | 1,181 (100.0%) |
Household Vehicle Usage in Gardnerville Ranchos
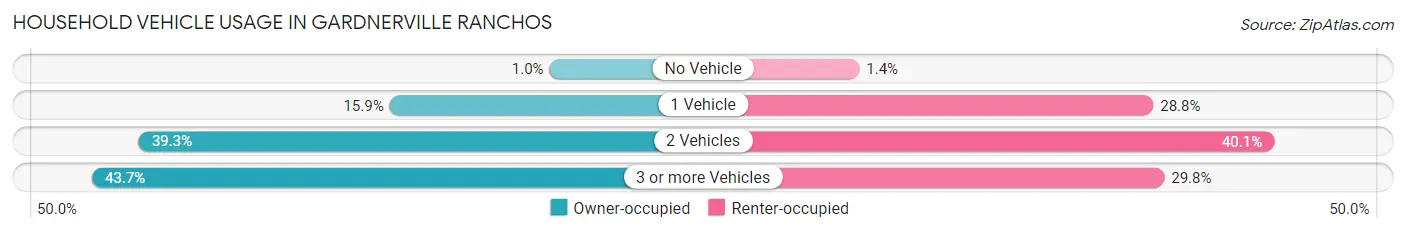
| Vehicles per Household | Owner-occupied | Renter-occupied |
| No Vehicle | 34 (1.0%) | 16 (1.3%) |
| 1 Vehicle | 537 (15.9%) | 340 (28.8%) |
| 2 Vehicles | 1,325 (39.3%) | 473 (40.1%) |
| 3 or more Vehicles | 1,472 (43.7%) | 352 (29.8%) |
| Total | 3,368 (100.0%) | 1,181 (100.0%) |
Real Estate & Mortgages in Gardnerville Ranchos
Real Estate and Mortgage Overview in Gardnerville Ranchos
| Characteristic | Without Mortgage | With Mortgage |
| Housing Units | 1,200 | 2,168 |
| Median Property Value | $403,700 | $453,000 |
| Median Household Income | $64,071 | $397 |
| Monthly Housing Costs | $453 | $138 |
| Real Estate Taxes | $1,908 | $43 |
Property Value by Mortgage Status in Gardnerville Ranchos
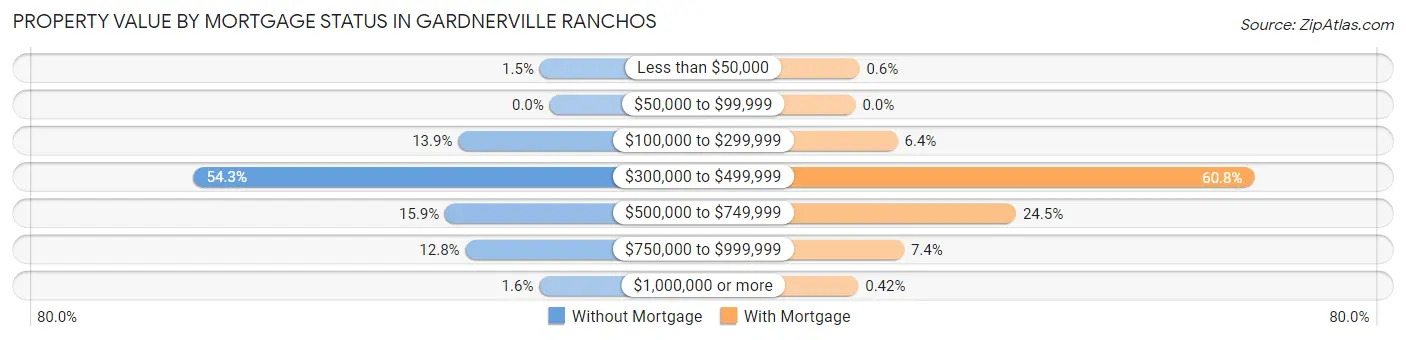
| Property Value | Without Mortgage | With Mortgage |
| Less than $50,000 | 18 (1.5%) | 13 (0.6%) |
| $50,000 to $99,999 | 0 (0.0%) | 0 (0.0%) |
| $100,000 to $299,999 | 167 (13.9%) | 139 (6.4%) |
| $300,000 to $499,999 | 651 (54.2%) | 1,317 (60.8%) |
| $500,000 to $749,999 | 191 (15.9%) | 530 (24.4%) |
| $750,000 to $999,999 | 154 (12.8%) | 160 (7.4%) |
| $1,000,000 or more | 19 (1.6%) | 9 (0.4%) |
| Total | 1,200 (100.0%) | 2,168 (100.0%) |
Household Income by Mortgage Status in Gardnerville Ranchos
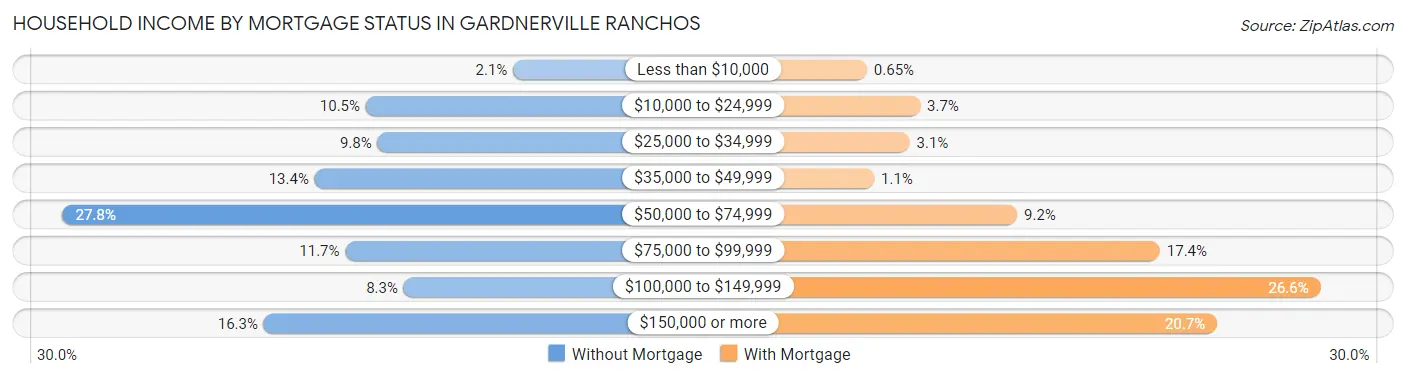
| Household Income | Without Mortgage | With Mortgage |
| Less than $10,000 | 25 (2.1%) | 14 (0.6%) |
| $10,000 to $24,999 | 126 (10.5%) | 80 (3.7%) |
| $25,000 to $34,999 | 118 (9.8%) | 67 (3.1%) |
| $35,000 to $49,999 | 161 (13.4%) | 23 (1.1%) |
| $50,000 to $74,999 | 334 (27.8%) | 200 (9.2%) |
| $75,000 to $99,999 | 140 (11.7%) | 377 (17.4%) |
| $100,000 to $149,999 | 100 (8.3%) | 576 (26.6%) |
| $150,000 or more | 196 (16.3%) | 448 (20.7%) |
| Total | 1,200 (100.0%) | 2,168 (100.0%) |
Property Value to Household Income Ratio in Gardnerville Ranchos
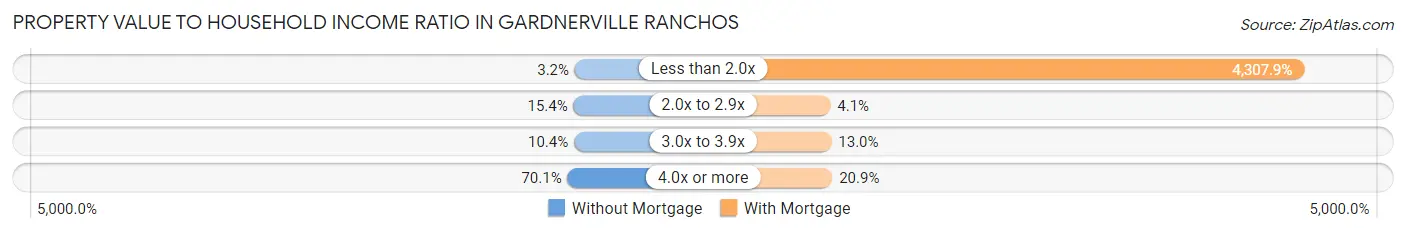
| Value-to-Income Ratio | Without Mortgage | With Mortgage |
| Less than 2.0x | 38 (3.2%) | 93,396 (4,307.9%) |
| 2.0x to 2.9x | 185 (15.4%) | 88 (4.1%) |
| 3.0x to 3.9x | 125 (10.4%) | 282 (13.0%) |
| 4.0x or more | 841 (70.1%) | 454 (20.9%) |
| Total | 1,200 (100.0%) | 2,168 (100.0%) |
Real Estate Taxes by Mortgage Status in Gardnerville Ranchos
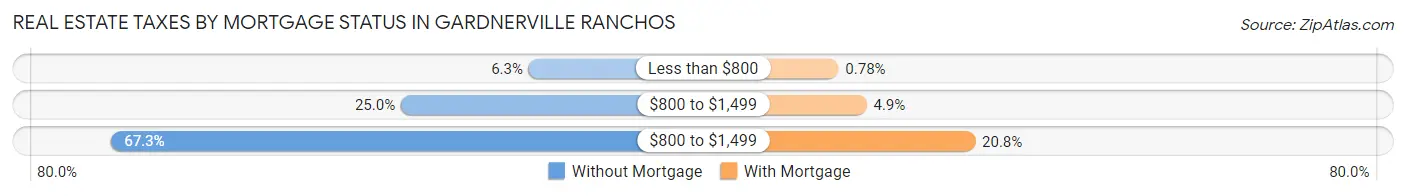
| Property Taxes | Without Mortgage | With Mortgage |
| Less than $800 | 76 (6.3%) | 17 (0.8%) |
| $800 to $1,499 | 300 (25.0%) | 106 (4.9%) |
| $800 to $1,499 | 808 (67.3%) | 450 (20.8%) |
| Total | 1,200 (100.0%) | 2,168 (100.0%) |
Health & Disability in Gardnerville Ranchos
Health Insurance Coverage by Age in Gardnerville Ranchos
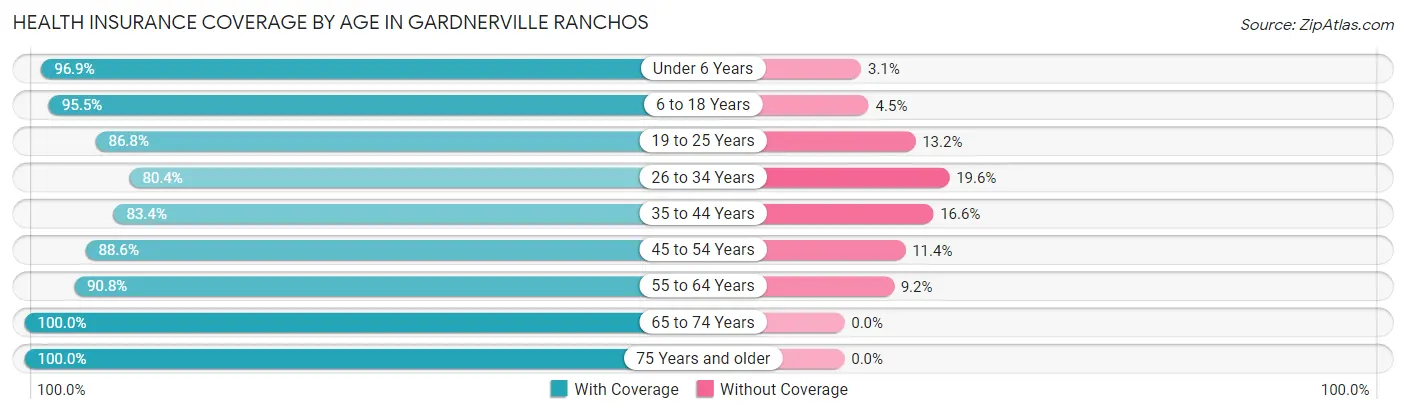
| Age Bracket | With Coverage | Without Coverage |
| Under 6 Years | 310 (96.9%) | 10 (3.1%) |
| 6 to 18 Years | 2,103 (95.5%) | 100 (4.5%) |
| 19 to 25 Years | 741 (86.8%) | 113 (13.2%) |
| 26 to 34 Years | 839 (80.4%) | 204 (19.6%) |
| 35 to 44 Years | 1,187 (83.4%) | 236 (16.6%) |
| 45 to 54 Years | 1,108 (88.6%) | 142 (11.4%) |
| 55 to 64 Years | 1,734 (90.8%) | 176 (9.2%) |
| 65 to 74 Years | 1,876 (100.0%) | 0 (0.0%) |
| 75 Years and older | 1,178 (100.0%) | 0 (0.0%) |
| Total | 11,076 (91.9%) | 981 (8.1%) |
Health Insurance Coverage by Citizenship Status in Gardnerville Ranchos
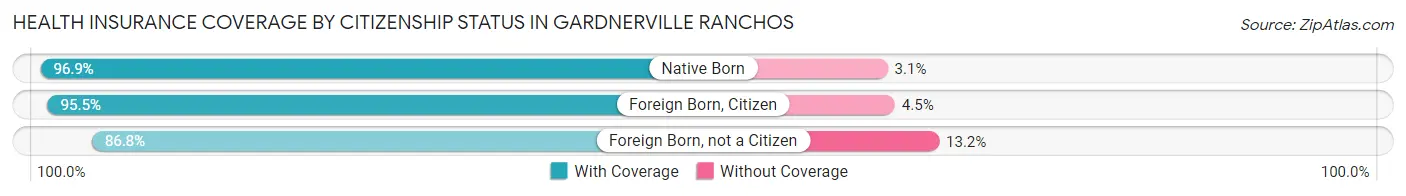
| Citizenship Status | With Coverage | Without Coverage |
| Native Born | 310 (96.9%) | 10 (3.1%) |
| Foreign Born, Citizen | 2,103 (95.5%) | 100 (4.5%) |
| Foreign Born, not a Citizen | 741 (86.8%) | 113 (13.2%) |
Health Insurance Coverage by Household Income in Gardnerville Ranchos
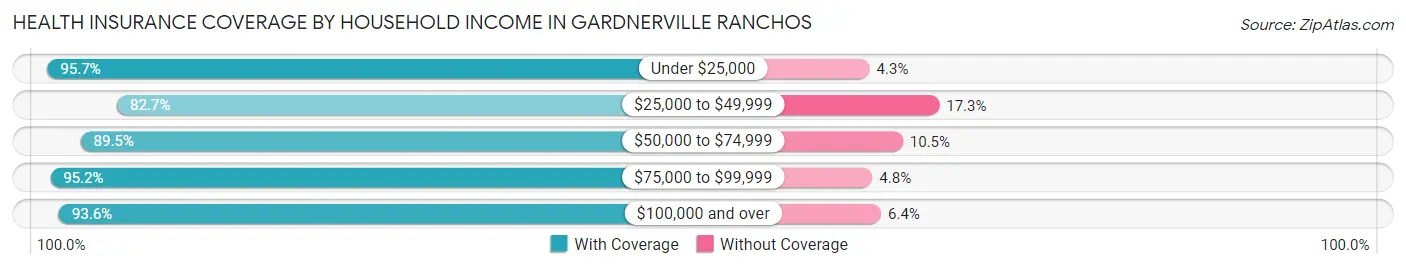
| Household Income | With Coverage | Without Coverage |
| Under $25,000 | 894 (95.7%) | 40 (4.3%) |
| $25,000 to $49,999 | 1,331 (82.7%) | 279 (17.3%) |
| $50,000 to $74,999 | 1,985 (89.5%) | 233 (10.5%) |
| $75,000 to $99,999 | 2,318 (95.2%) | 117 (4.8%) |
| $100,000 and over | 4,537 (93.6%) | 312 (6.4%) |
Public vs Private Health Insurance Coverage by Age in Gardnerville Ranchos
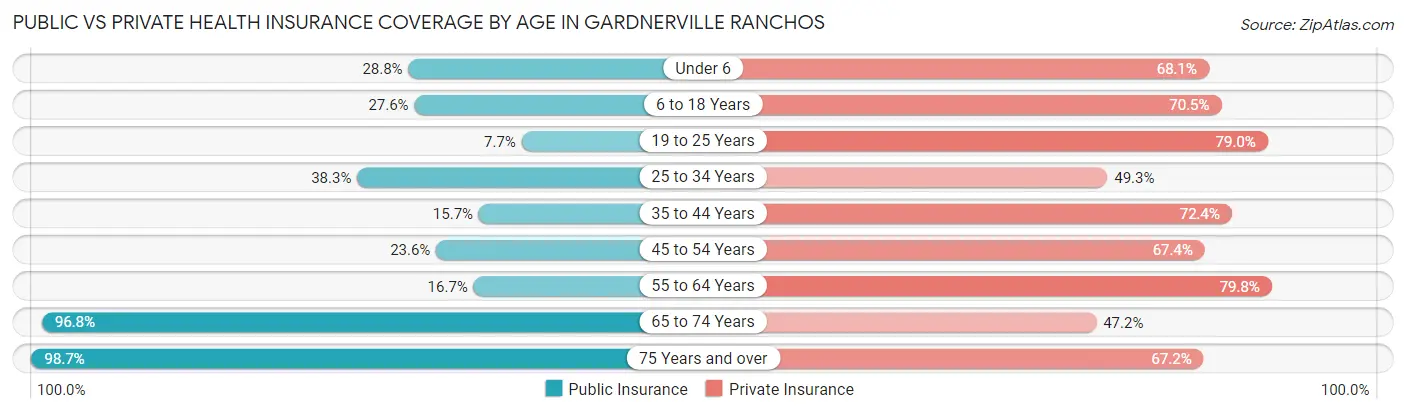
| Age Bracket | Public Insurance | Private Insurance |
| Under 6 | 92 (28.7%) | 218 (68.1%) |
| 6 to 18 Years | 609 (27.6%) | 1,552 (70.5%) |
| 19 to 25 Years | 66 (7.7%) | 675 (79.0%) |
| 25 to 34 Years | 399 (38.3%) | 514 (49.3%) |
| 35 to 44 Years | 223 (15.7%) | 1,030 (72.4%) |
| 45 to 54 Years | 295 (23.6%) | 842 (67.4%) |
| 55 to 64 Years | 318 (16.7%) | 1,524 (79.8%) |
| 65 to 74 Years | 1,816 (96.8%) | 886 (47.2%) |
| 75 Years and over | 1,163 (98.7%) | 791 (67.1%) |
| Total | 4,981 (41.3%) | 8,032 (66.6%) |
Disability Status by Sex by Age in Gardnerville Ranchos
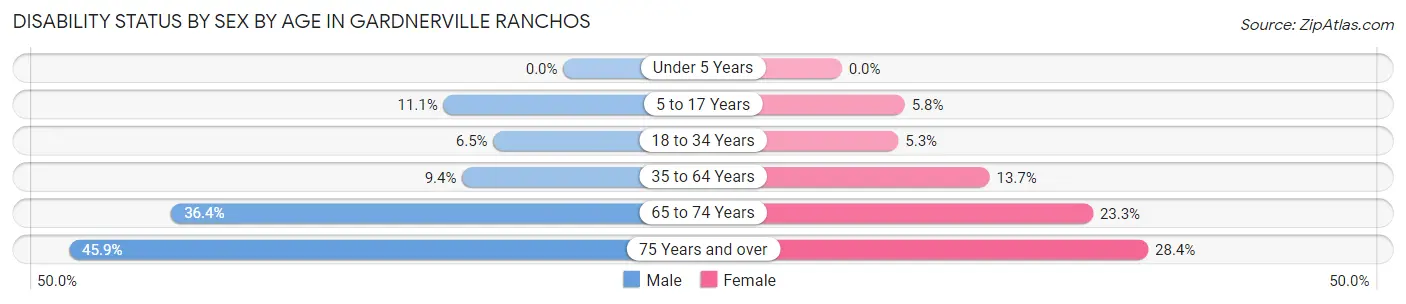
| Age Bracket | Male | Female |
| Under 5 Years | 0 (0.0%) | 0 (0.0%) |
| 5 to 17 Years | 123 (11.1%) | 58 (5.8%) |
| 18 to 34 Years | 58 (6.5%) | 62 (5.2%) |
| 35 to 64 Years | 215 (9.4%) | 314 (13.7%) |
| 65 to 74 Years | 333 (36.4%) | 224 (23.3%) |
| 75 Years and over | 266 (45.9%) | 170 (28.4%) |
Disability Class by Sex by Age in Gardnerville Ranchos
Disability Class: Hearing Difficulty
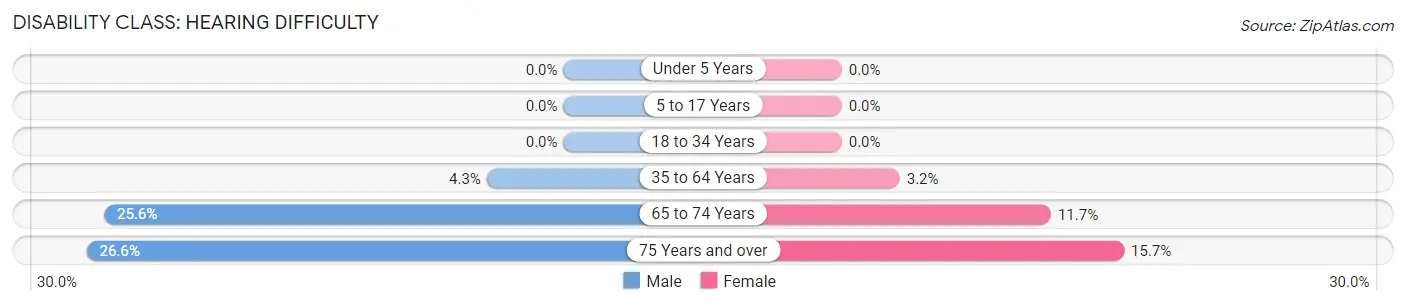
| Age Bracket | Male | Female |
| Under 5 Years | 0 (0.0%) | 0 (0.0%) |
| 5 to 17 Years | 0 (0.0%) | 0 (0.0%) |
| 18 to 34 Years | 0 (0.0%) | 0 (0.0%) |
| 35 to 64 Years | 98 (4.3%) | 74 (3.2%) |
| 65 to 74 Years | 234 (25.6%) | 112 (11.7%) |
| 75 Years and over | 154 (26.6%) | 94 (15.7%) |
Disability Class: Vision Difficulty
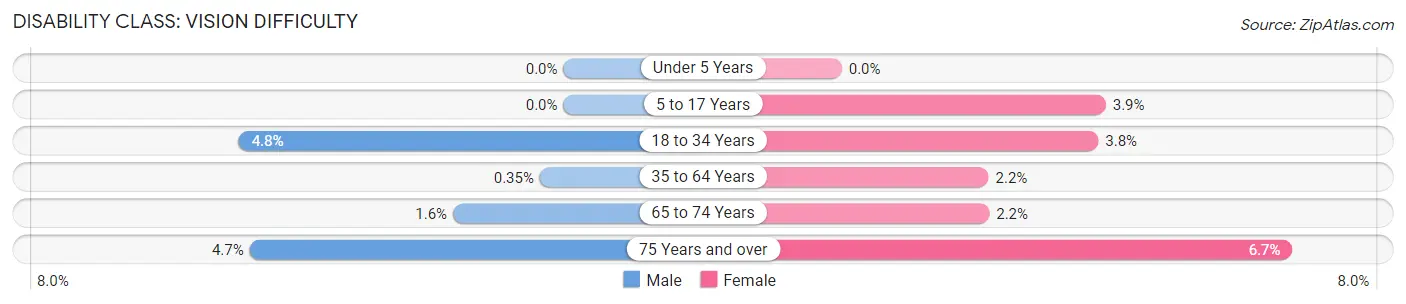
| Age Bracket | Male | Female |
| Under 5 Years | 0 (0.0%) | 0 (0.0%) |
| 5 to 17 Years | 0 (0.0%) | 39 (3.9%) |
| 18 to 34 Years | 43 (4.8%) | 45 (3.8%) |
| 35 to 64 Years | 8 (0.4%) | 50 (2.2%) |
| 65 to 74 Years | 15 (1.6%) | 21 (2.2%) |
| 75 Years and over | 27 (4.7%) | 40 (6.7%) |
Disability Class: Cognitive Difficulty
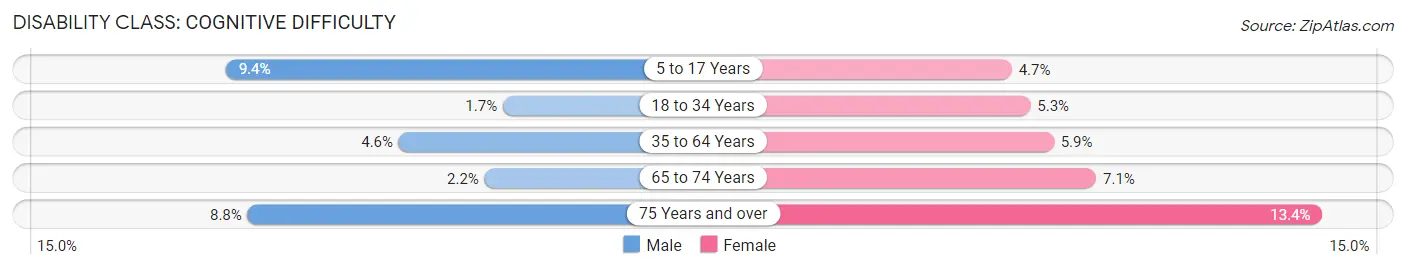
| Age Bracket | Male | Female |
| 5 to 17 Years | 104 (9.4%) | 47 (4.7%) |
| 18 to 34 Years | 15 (1.7%) | 62 (5.2%) |
| 35 to 64 Years | 105 (4.6%) | 135 (5.9%) |
| 65 to 74 Years | 20 (2.2%) | 68 (7.1%) |
| 75 Years and over | 51 (8.8%) | 80 (13.4%) |
Disability Class: Ambulatory Difficulty
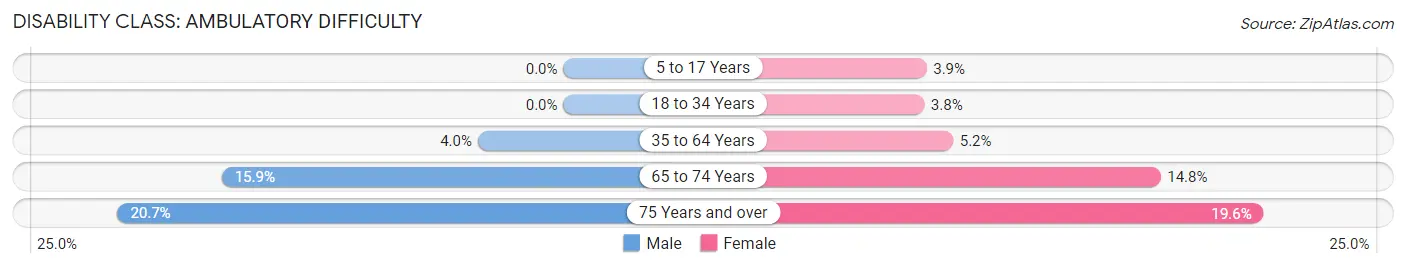
| Age Bracket | Male | Female |
| 5 to 17 Years | 0 (0.0%) | 39 (3.9%) |
| 18 to 34 Years | 0 (0.0%) | 45 (3.8%) |
| 35 to 64 Years | 91 (4.0%) | 118 (5.1%) |
| 65 to 74 Years | 145 (15.9%) | 142 (14.8%) |
| 75 Years and over | 120 (20.7%) | 117 (19.6%) |
Disability Class: Self-Care Difficulty
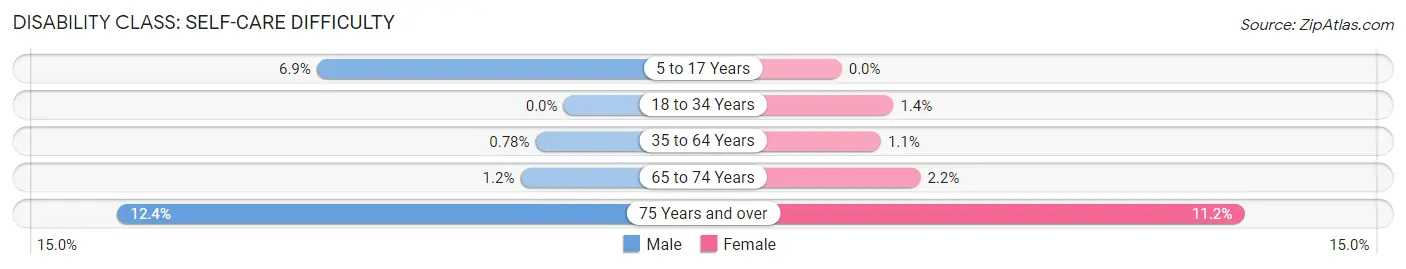
| Age Bracket | Male | Female |
| 5 to 17 Years | 76 (6.9%) | 0 (0.0%) |
| 18 to 34 Years | 0 (0.0%) | 17 (1.4%) |
| 35 to 64 Years | 18 (0.8%) | 25 (1.1%) |
| 65 to 74 Years | 11 (1.2%) | 21 (2.2%) |
| 75 Years and over | 72 (12.4%) | 67 (11.2%) |
Technology Access in Gardnerville Ranchos
Computing Device Access in Gardnerville Ranchos
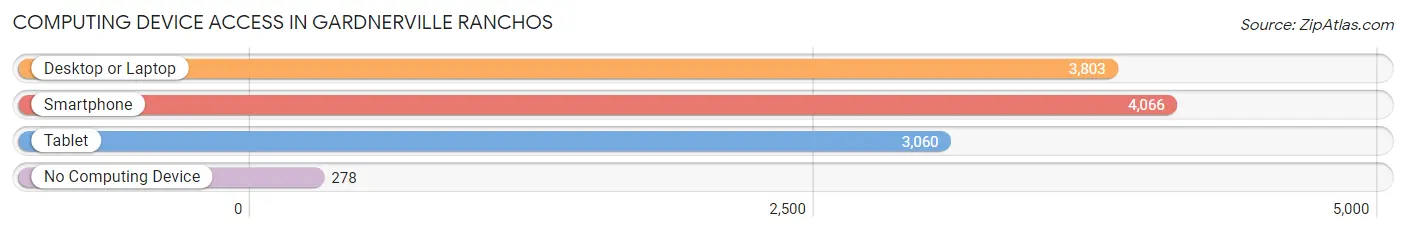
| Device Type | # Households | % Households |
| Desktop or Laptop | 3,803 | 83.6% |
| Smartphone | 4,066 | 89.4% |
| Tablet | 3,060 | 67.3% |
| No Computing Device | 278 | 6.1% |
| Total | 4,549 | 100.0% |
Internet Access in Gardnerville Ranchos
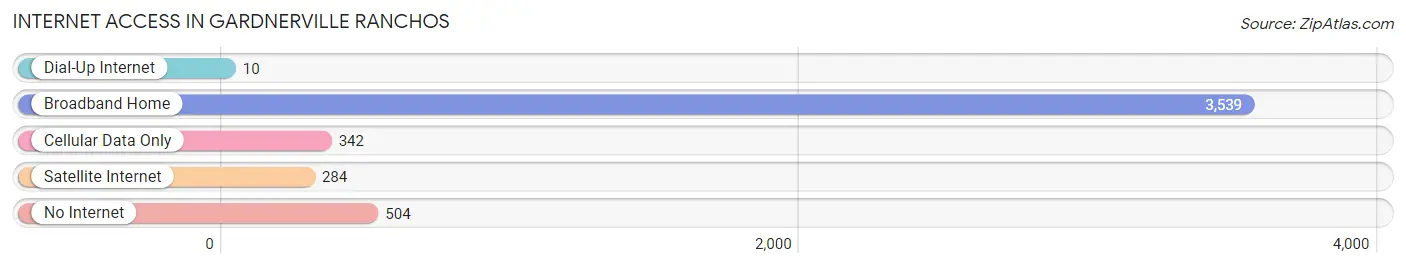
| Internet Type | # Households | % Households |
| Dial-Up Internet | 10 | 0.2% |
| Broadband Home | 3,539 | 77.8% |
| Cellular Data Only | 342 | 7.5% |
| Satellite Internet | 284 | 6.2% |
| No Internet | 504 | 11.1% |
| Total | 4,549 | 100.0% |
Gardnerville Ranchos Summary
Gardnerville Ranchos is an unincorporated town located in Douglas County, Nevada. It is situated in the Carson Valley, approximately 20 miles south of Carson City and about 30 miles east of Lake Tahoe. The town is bordered by the towns of Minden and Genoa to the north, and the Carson River to the south. As of the 2010 census, the population of Gardnerville Ranchos was 8,515.
Geography
Gardnerville Ranchos is located in the Carson Valley, which is a large valley in western Nevada. The valley is bordered by the Sierra Nevada mountain range to the west and the Carson Range to the east. The Carson River flows through the valley, and the town of Gardnerville Ranchos is situated on the western side of the river. The town is located at an elevation of 4,890 feet above sea level.
The climate in Gardnerville Ranchos is semi-arid, with hot summers and cold winters. The average high temperature in the summer is around 90°F, and the average low temperature in the winter is around 20°F. The average annual precipitation is around 10 inches.
History
Gardnerville Ranchos was founded in 1851 by John Gardnerville, a rancher from California. He purchased a large tract of land in the Carson Valley and established a ranch. The town was originally known as Gardnerville, but the name was changed to Gardnerville Ranchos in the early 1900s.
The town grew slowly over the years, and by the 1950s it had become a popular tourist destination. The town was known for its natural beauty and its proximity to Lake Tahoe.
Economy
The economy of Gardnerville Ranchos is largely based on tourism and agriculture. The town is home to several wineries, and it is also a popular destination for outdoor activities such as hiking, fishing, and camping.
The town is also home to several businesses, including restaurants, retail stores, and professional services. The town is also home to several manufacturing companies, including a furniture manufacturer and a metal fabrication company.
Demographics
As of the 2010 census, the population of Gardnerville Ranchos was 8,515. The racial makeup of the town was 87.3% White, 0.7% African American, 0.7% Native American, 0.9% Asian, 0.1% Pacific Islander, 8.2% from other races, and 2.2% from two or more races. Hispanic or Latino of any race were 16.3% of the population.
The median household income in Gardnerville Ranchos was $50,945, and the median family income was $58,958. The per capita income was $25,945. About 8.3% of families and 10.7% of the population were below the poverty line, including 14.2% of those under age 18 and 5.2% of those age 65 or over.
Conclusion
Gardnerville Ranchos is an unincorporated town located in Douglas County, Nevada. It is situated in the Carson Valley, approximately 20 miles south of Carson City and about 30 miles east of Lake Tahoe. The town is bordered by the towns of Minden and Genoa to the north, and the Carson River to the south. As of the 2010 census, the population of Gardnerville Ranchos was 8,515. The economy of the town is largely based on tourism and agriculture, and it is also home to several businesses, including restaurants, retail stores, and professional services. The median household income in Gardnerville Ranchos was $50,945, and the median family income was $58,958. The per capita income was $25,945.
Common Questions
What is Per Capita Income in Gardnerville Ranchos?
Per Capita income in Gardnerville Ranchos is $35,364.
What is the Median Family Income in Gardnerville Ranchos?
Median Family Income in Gardnerville Ranchos is $85,125.
What is the Median Household income in Gardnerville Ranchos?
Median Household Income in Gardnerville Ranchos is $76,917.
What is Income or Wage Gap in Gardnerville Ranchos?
Income or Wage Gap in Gardnerville Ranchos is 35.8%.
Women in Gardnerville Ranchos earn 64.2 cents for every dollar earned by a man.
What is Inequality or Gini Index in Gardnerville Ranchos?
Inequality or Gini Index in Gardnerville Ranchos is 0.36.
What is the Total Population of Gardnerville Ranchos?
Total Population of Gardnerville Ranchos is 12,057.
What is the Total Male Population of Gardnerville Ranchos?
Total Male Population of Gardnerville Ranchos is 5,922.
What is the Total Female Population of Gardnerville Ranchos?
Total Female Population of Gardnerville Ranchos is 6,135.
What is the Ratio of Males per 100 Females in Gardnerville Ranchos?
There are 96.53 Males per 100 Females in Gardnerville Ranchos.
What is the Ratio of Females per 100 Males in Gardnerville Ranchos?
There are 103.60 Females per 100 Males in Gardnerville Ranchos.
What is the Median Population Age in Gardnerville Ranchos?
Median Population Age in Gardnerville Ranchos is 46.7 Years.
What is the Average Family Size in Gardnerville Ranchos
Average Family Size in Gardnerville Ranchos is 2.9 People.
What is the Average Household Size in Gardnerville Ranchos
Average Household Size in Gardnerville Ranchos is 2.6 People.
How Large is the Labor Force in Gardnerville Ranchos?
There are 5,607 People in the Labor Forcein in Gardnerville Ranchos.
What is the Percentage of People in the Labor Force in Gardnerville Ranchos?
56.3% of People are in the Labor Force in Gardnerville Ranchos.
What is the Unemployment Rate in Gardnerville Ranchos?
Unemployment Rate in Gardnerville Ranchos is 3.4%.