Moapa Town, NV Map & Demographics
Moapa Town Map
Moapa Town Overview
$41,020
PER CAPITA INCOME
$74,830
AVG FAMILY INCOME
$73,182
AVG HOUSEHOLD INCOME
15.4%
WAGE / INCOME GAP [ % ]
84.6¢/ $1
WAGE / INCOME GAP [ $ ]
0.45
INEQUALITY / GINI INDEX
775
TOTAL POPULATION
474
MALE POPULATION
301
FEMALE POPULATION
157.48
MALES / 100 FEMALES
63.50
FEMALES / 100 MALES
46.9
MEDIAN AGE
3.1
AVG FAMILY SIZE
2.8
AVG HOUSEHOLD SIZE
325
LABOR FORCE [ PEOPLE ]
53.8%
PERCENT IN LABOR FORCE
3.4%
UNEMPLOYMENT RATE
Income in Moapa Town
Income Overview in Moapa Town
Per Capita Income in Moapa Town is $41,020, while median incomes of families and households are $74,830 and $73,182 respectively.
| Characteristic | Number | Measure |
| Per Capita Income | 775 | $41,020 |
| Median Family Income | 235 | $74,830 |
| Mean Family Income | 235 | $110,268 |
| Median Household Income | 276 | $73,182 |
| Mean Household Income | 276 | $102,711 |
| Income Deficit | 235 | $0 |
| Wage / Income Gap (%) | 775 | 15.43% |
| Wage / Income Gap ($) | 775 | 84.57¢ per $1 |
| Gini / Inequality Index | 775 | 0.45 |
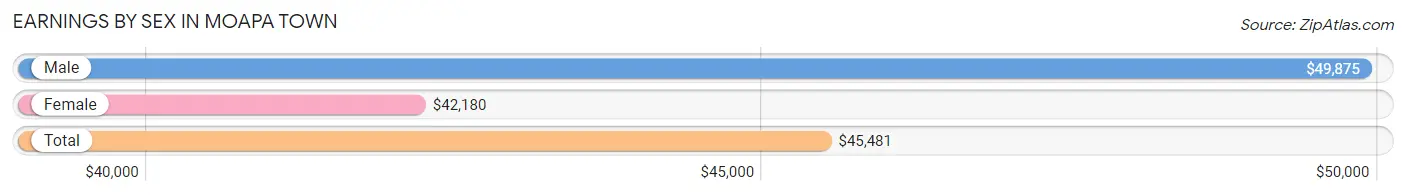
Earnings by Sex in Moapa Town
Average Earnings in Moapa Town are $45,481, $49,875 for men and $42,180 for women, a difference of 15.4%.
| Sex | Number | Average Earnings |
| Male | 248 (63.4%) | $49,875 |
| Female | 143 (36.6%) | $42,180 |
| Total | 391 (100.0%) | $45,481 |
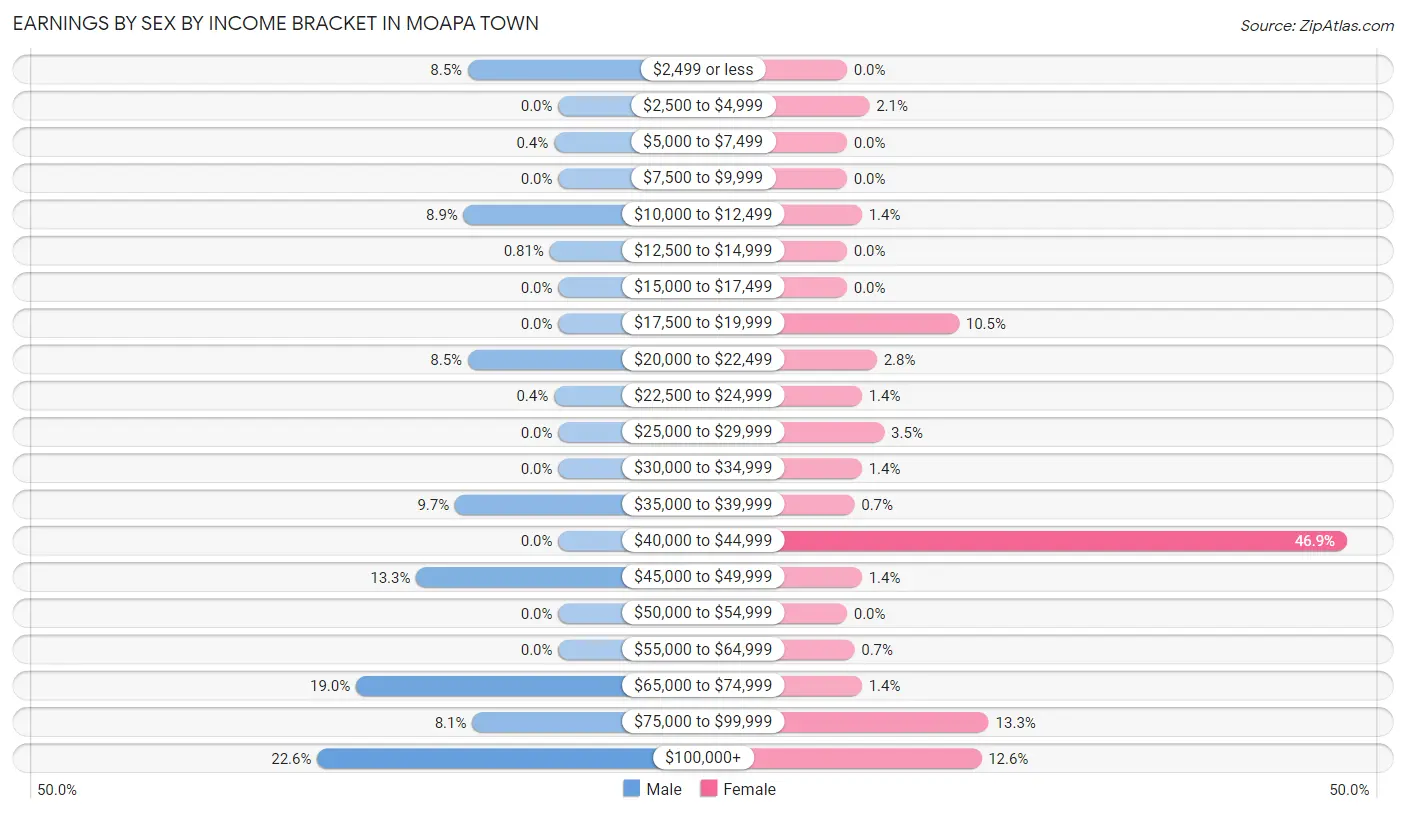
Earnings by Sex by Income Bracket in Moapa Town
The most common earnings brackets in Moapa Town are $100,000+ for men (56 | 22.6%) and $40,000 to $44,999 for women (67 | 46.9%).
| Income | Male | Female |
| $2,499 or less | 21 (8.5%) | 0 (0.0%) |
| $2,500 to $4,999 | 0 (0.0%) | 3 (2.1%) |
| $5,000 to $7,499 | 1 (0.4%) | 0 (0.0%) |
| $7,500 to $9,999 | 0 (0.0%) | 0 (0.0%) |
| $10,000 to $12,499 | 22 (8.9%) | 2 (1.4%) |
| $12,500 to $14,999 | 2 (0.8%) | 0 (0.0%) |
| $15,000 to $17,499 | 0 (0.0%) | 0 (0.0%) |
| $17,500 to $19,999 | 0 (0.0%) | 15 (10.5%) |
| $20,000 to $22,499 | 21 (8.5%) | 4 (2.8%) |
| $22,500 to $24,999 | 1 (0.4%) | 2 (1.4%) |
| $25,000 to $29,999 | 0 (0.0%) | 5 (3.5%) |
| $30,000 to $34,999 | 0 (0.0%) | 2 (1.4%) |
| $35,000 to $39,999 | 24 (9.7%) | 1 (0.7%) |
| $40,000 to $44,999 | 0 (0.0%) | 67 (46.9%) |
| $45,000 to $49,999 | 33 (13.3%) | 2 (1.4%) |
| $50,000 to $54,999 | 0 (0.0%) | 0 (0.0%) |
| $55,000 to $64,999 | 0 (0.0%) | 1 (0.7%) |
| $65,000 to $74,999 | 47 (19.0%) | 2 (1.4%) |
| $75,000 to $99,999 | 20 (8.1%) | 19 (13.3%) |
| $100,000+ | 56 (22.6%) | 18 (12.6%) |
| Total | 248 (100.0%) | 143 (100.0%) |
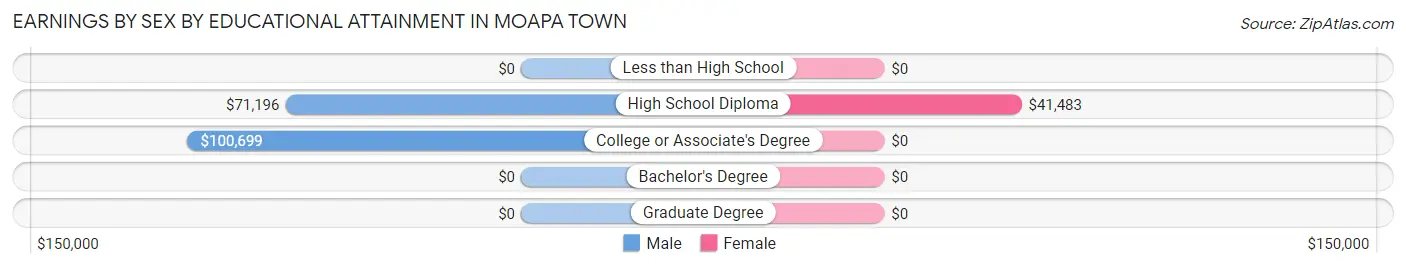
Earnings by Sex by Educational Attainment in Moapa Town
Average earnings in Moapa Town are $71,250 for men and $42,413 for women, a difference of 40.5%. Men with an educational attainment of college or associate's degree enjoy the highest average annual earnings of $100,699, while those with high school diploma education earn the least with $71,196. Women with an educational attainment of high school diploma earn the most with the average annual earnings of $41,483, while those with high school diploma education have the smallest earnings of $41,483.
| Educational Attainment | Male Income | Female Income |
| Less than High School | - | - |
| High School Diploma | $71,196 | $41,483 |
| College or Associate's Degree | $100,699 | $0 |
| Bachelor's Degree | - | - |
| Graduate Degree | - | - |
| Total | $71,250 | $42,413 |
Family Income in Moapa Town
Family Income Brackets in Moapa Town
According to the Moapa Town family income data, there are 51 families falling into the $50,000 to $74,999 income range, which is the most common income bracket and makes up 21.7% of all families.
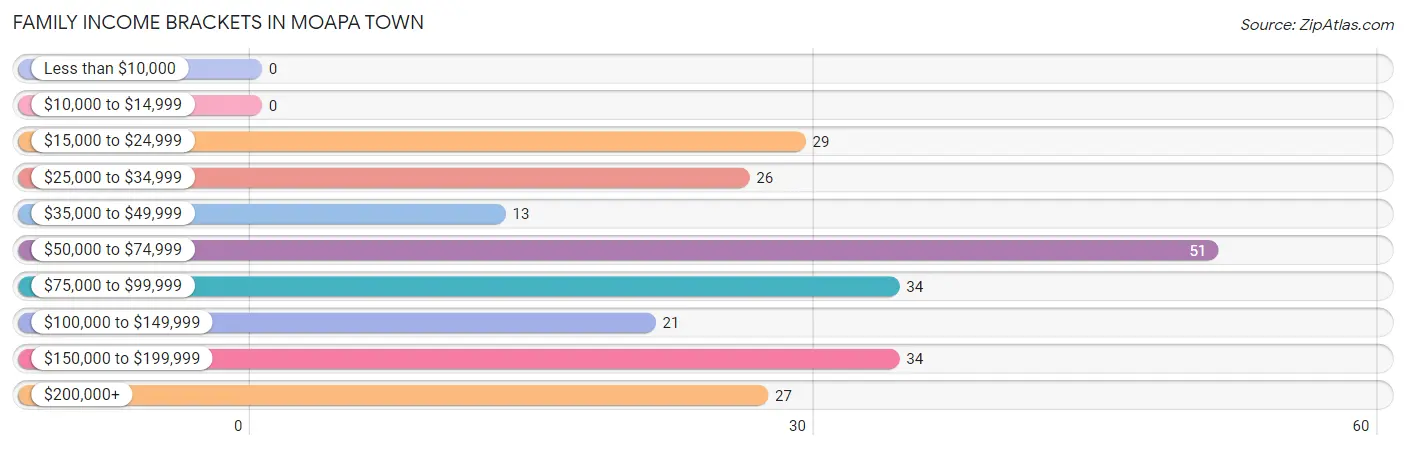
| Income Bracket | # Families | % Families |
| Less than $10,000 | 0 | 0.0% |
| $10,000 to $14,999 | 0 | 0.0% |
| $15,000 to $24,999 | 29 | 12.3% |
| $25,000 to $34,999 | 26 | 11.1% |
| $35,000 to $49,999 | 13 | 5.5% |
| $50,000 to $74,999 | 51 | 21.7% |
| $75,000 to $99,999 | 34 | 14.5% |
| $100,000 to $149,999 | 21 | 8.9% |
| $150,000 to $199,999 | 34 | 14.5% |
| $200,000+ | 27 | 11.5% |
Family Income by Famaliy Size in Moapa Town
4-person families (57 | 24.3%) account for the highest median family income in Moapa Town with $172,904 per family, while 4-person families (57 | 24.3%) have the highest median income of $43,226 per family member.
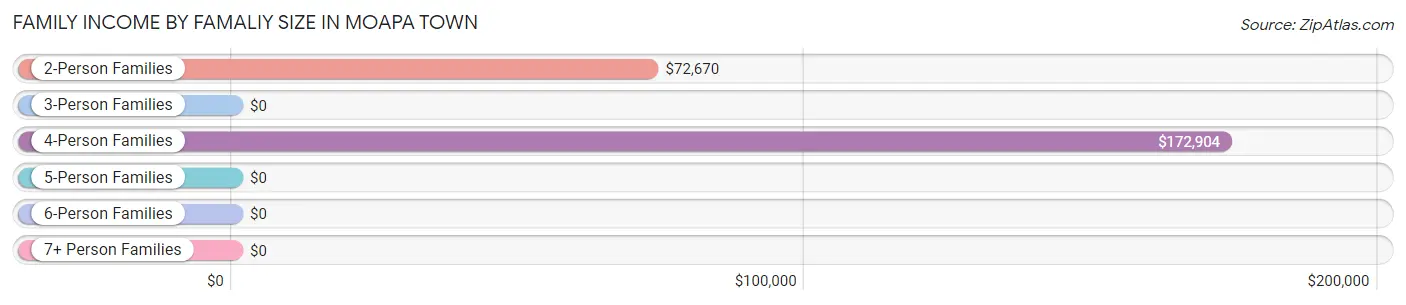
| Income Bracket | # Families | Median Income |
| 2-Person Families | 111 (47.2%) | $72,670 |
| 3-Person Families | 63 (26.8%) | $0 |
| 4-Person Families | 57 (24.3%) | $172,904 |
| 5-Person Families | 4 (1.7%) | $0 |
| 6-Person Families | 0 (0.0%) | $0 |
| 7+ Person Families | 0 (0.0%) | $0 |
| Total | 235 (100.0%) | $74,830 |
Family Income by Number of Earners in Moapa Town
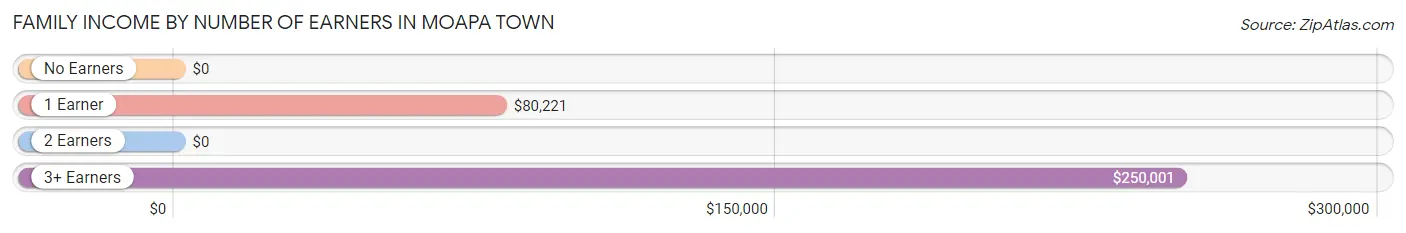
| Number of Earners | # Families | Median Income |
| No Earners | 60 (25.5%) | $0 |
| 1 Earner | 67 (28.5%) | $80,221 |
| 2 Earners | 88 (37.4%) | $0 |
| 3+ Earners | 20 (8.5%) | $250,001 |
| Total | 235 (100.0%) | $74,830 |
Household Income in Moapa Town
Household Income Brackets in Moapa Town
With 71 households falling in the category, the $50,000 to $74,999 income range is the most frequent in Moapa Town, accounting for 25.7% of all households.
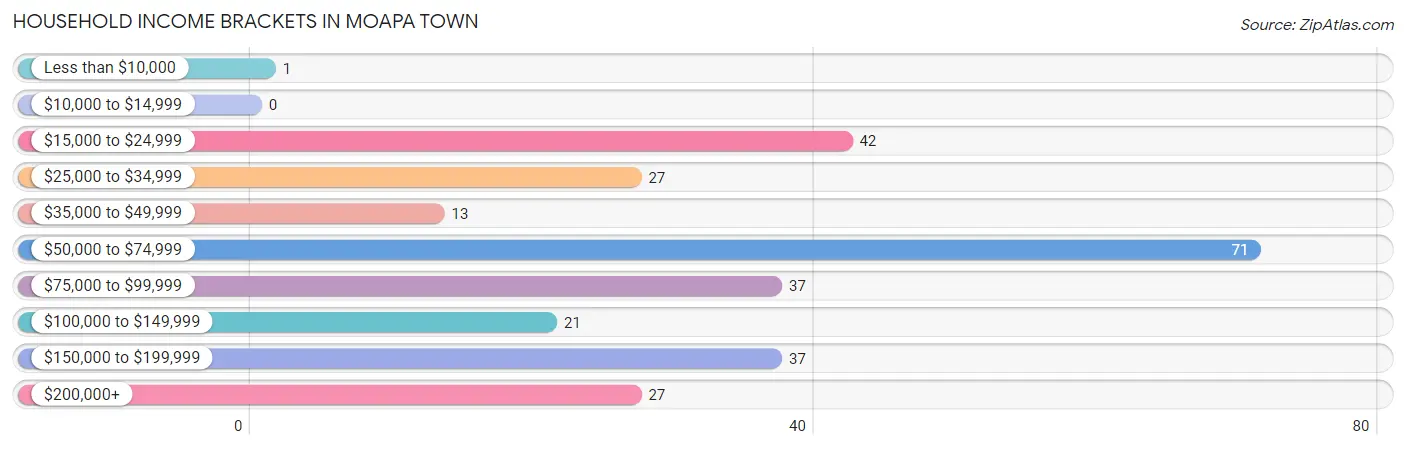
| Income Bracket | # Households | % Households |
| Less than $10,000 | 1 | 0.4% |
| $10,000 to $14,999 | 0 | 0.0% |
| $15,000 to $24,999 | 42 | 15.2% |
| $25,000 to $34,999 | 27 | 9.8% |
| $35,000 to $49,999 | 13 | 4.7% |
| $50,000 to $74,999 | 71 | 25.7% |
| $75,000 to $99,999 | 37 | 13.4% |
| $100,000 to $149,999 | 21 | 7.6% |
| $150,000 to $199,999 | 37 | 13.4% |
| $200,000+ | 27 | 9.8% |
Household Income by Householder Age in Moapa Town
The median household income in Moapa Town is $73,182, with the highest median household income of $81,838 found in the 45 to 64 years age bracket for the primary householder. A total of 103 households (37.3%) fall into this category. Meanwhile, the 15 to 24 years age bracket for the primary householder has the lowest median household income of $0, with 4 households (1.5%) in this group.
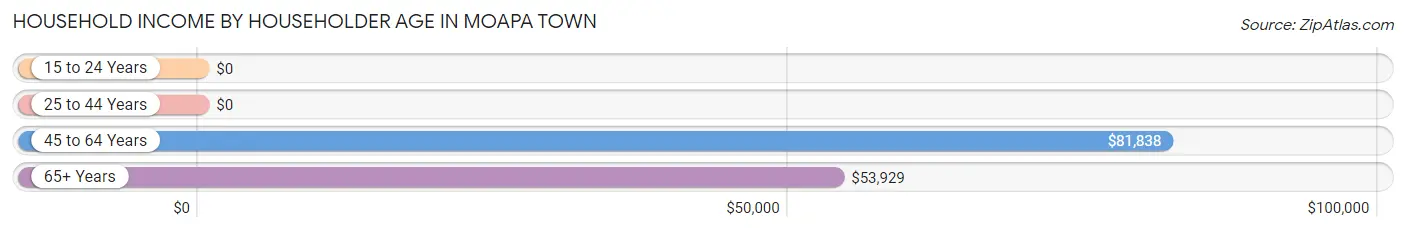
| Income Bracket | # Households | Median Income |
| 15 to 24 Years | 4 (1.5%) | $0 |
| 25 to 44 Years | 83 (30.1%) | $0 |
| 45 to 64 Years | 103 (37.3%) | $81,838 |
| 65+ Years | 86 (31.2%) | $53,929 |
| Total | 276 (100.0%) | $73,182 |
Poverty in Moapa Town
Income Below Poverty by Sex and Age in Moapa Town
With 9.3% poverty level for males and 12.3% for females among the residents of Moapa Town, 16 and 17 year old males and 65 to 74 year old females are the most vulnerable to poverty, with 1 males (100.0%) and 23 females (42.6%) in their respective age groups living below the poverty level.
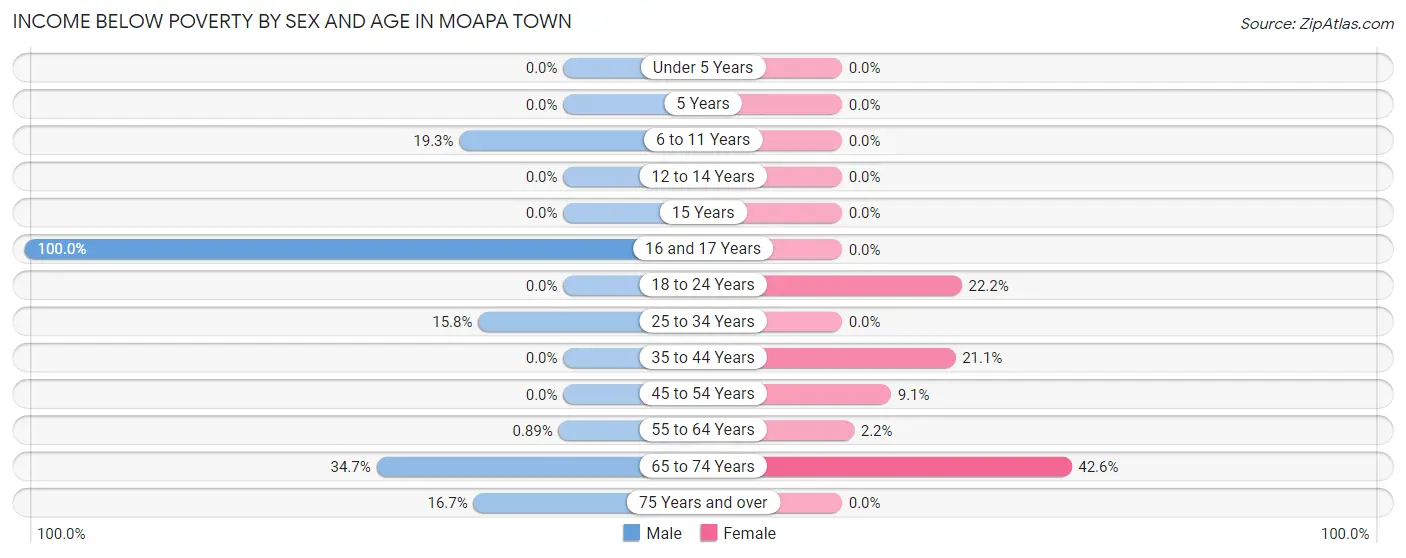
| Age Bracket | Male | Female |
| Under 5 Years | 0 (0.0%) | 0 (0.0%) |
| 5 Years | 0 (0.0%) | 0 (0.0%) |
| 6 to 11 Years | 11 (19.3%) | 0 (0.0%) |
| 12 to 14 Years | 0 (0.0%) | 0 (0.0%) |
| 15 Years | 0 (0.0%) | 0 (0.0%) |
| 16 and 17 Years | 1 (100.0%) | 0 (0.0%) |
| 18 to 24 Years | 0 (0.0%) | 2 (22.2%) |
| 25 to 34 Years | 3 (15.8%) | 0 (0.0%) |
| 35 to 44 Years | 0 (0.0%) | 8 (21.0%) |
| 45 to 54 Years | 0 (0.0%) | 2 (9.1%) |
| 55 to 64 Years | 1 (0.9%) | 2 (2.2%) |
| 65 to 74 Years | 26 (34.7%) | 23 (42.6%) |
| 75 Years and over | 2 (16.7%) | 0 (0.0%) |
| Total | 44 (9.3%) | 37 (12.3%) |
Income Above Poverty by Sex and Age in Moapa Town
According to the poverty statistics in Moapa Town, males aged under 5 years and females aged under 5 years are the age groups that are most secure financially, with 100.0% of males and 100.0% of females in these age groups living above the poverty line.
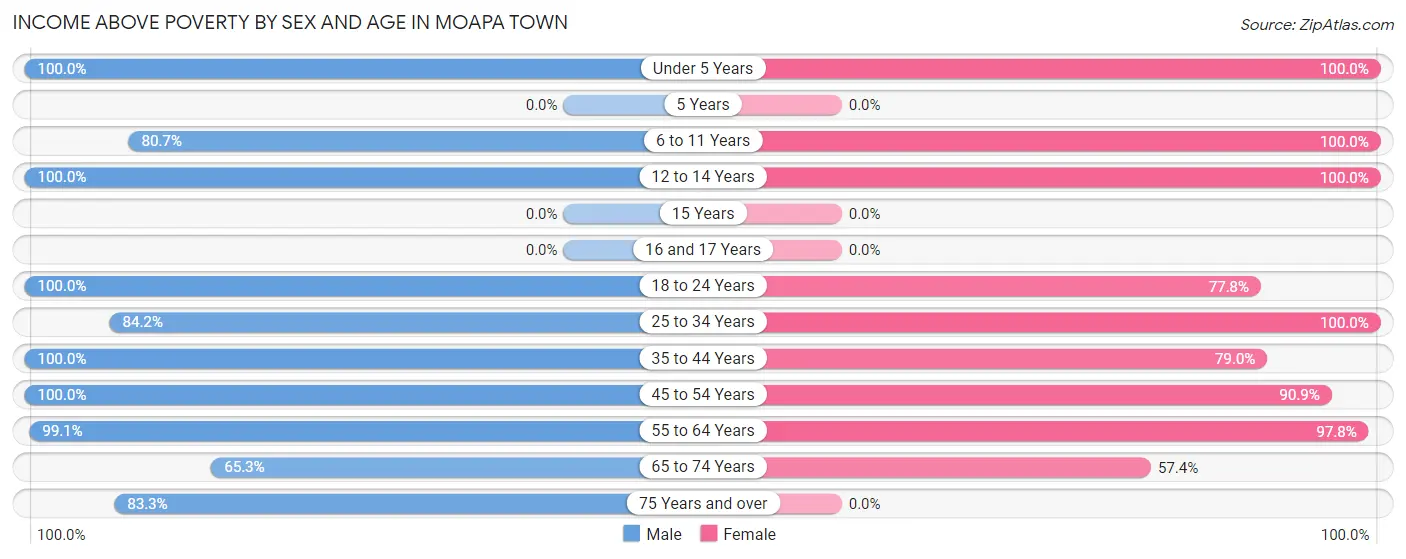
| Age Bracket | Male | Female |
| Under 5 Years | 18 (100.0%) | 45 (100.0%) |
| 5 Years | 0 (0.0%) | 0 (0.0%) |
| 6 to 11 Years | 46 (80.7%) | 4 (100.0%) |
| 12 to 14 Years | 45 (100.0%) | 2 (100.0%) |
| 15 Years | 0 (0.0%) | 0 (0.0%) |
| 16 and 17 Years | 0 (0.0%) | 0 (0.0%) |
| 18 to 24 Years | 47 (100.0%) | 7 (77.8%) |
| 25 to 34 Years | 16 (84.2%) | 37 (100.0%) |
| 35 to 44 Years | 47 (100.0%) | 30 (78.9%) |
| 45 to 54 Years | 41 (100.0%) | 20 (90.9%) |
| 55 to 64 Years | 111 (99.1%) | 88 (97.8%) |
| 65 to 74 Years | 49 (65.3%) | 31 (57.4%) |
| 75 Years and over | 10 (83.3%) | 0 (0.0%) |
| Total | 430 (90.7%) | 264 (87.7%) |
Income Below Poverty Among Married-Couple Families in Moapa Town
The poverty statistics for married-couple families in Moapa Town show that 19.6% or 27 of the total 138 families live below the poverty line. Families with 3 or 4 children have the highest poverty rate of 100.0%, comprising of 4 families. On the other hand, families with 1 or 2 children have the lowest poverty rate of 0.0%, which includes 0 families.
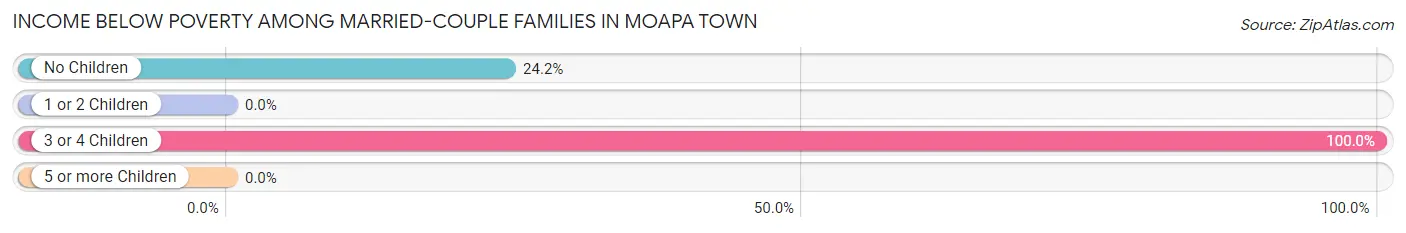
| Children | Above Poverty | Below Poverty |
| No Children | 72 (75.8%) | 23 (24.2%) |
| 1 or 2 Children | 39 (100.0%) | 0 (0.0%) |
| 3 or 4 Children | 0 (0.0%) | 4 (100.0%) |
| 5 or more Children | 0 (0.0%) | 0 (0.0%) |
| Total | 111 (80.4%) | 27 (19.6%) |
Income Below Poverty Among Single-Parent Households in Moapa Town
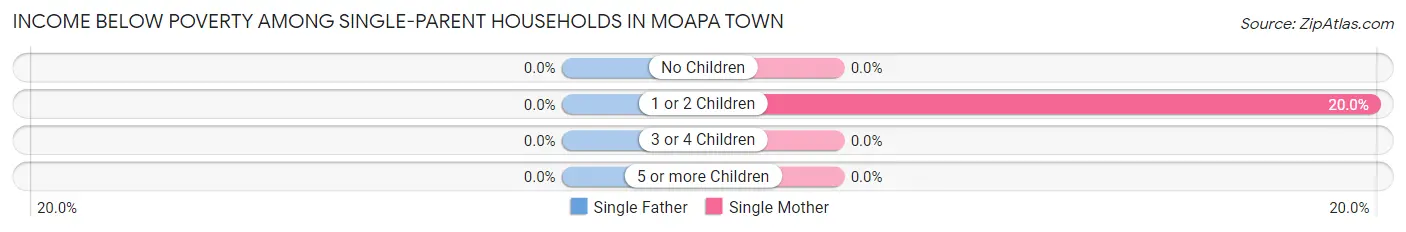
| Children | Single Father | Single Mother |
| No Children | 0 (0.0%) | 0 (0.0%) |
| 1 or 2 Children | 0 (0.0%) | 2 (20.0%) |
| 3 or 4 Children | 0 (0.0%) | 0 (0.0%) |
| 5 or more Children | 0 (0.0%) | 0 (0.0%) |
| Total | 0 (0.0%) | 2 (14.3%) |
Income Below Poverty Among Married-Couple vs Single-Parent Households in Moapa Town
The poverty data for Moapa Town shows that 27 of the married-couple family households (19.6%) and 2 of the single-parent households (2.1%) are living below the poverty level. Within the married-couple family households, those with 3 or 4 children have the highest poverty rate, with 4 households (100.0%) falling below the poverty line. Among the single-parent households, those with 1 or 2 children have the highest poverty rate, with 2 household (3.3%) living below poverty.
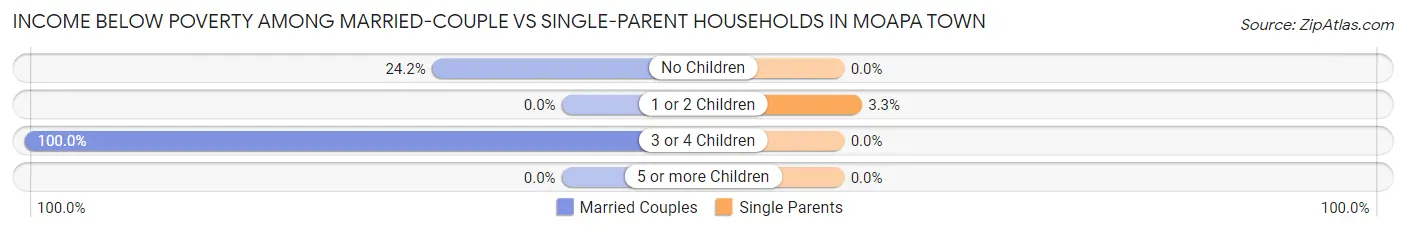
| Children | Married-Couple Families | Single-Parent Households |
| No Children | 23 (24.2%) | 0 (0.0%) |
| 1 or 2 Children | 0 (0.0%) | 2 (3.3%) |
| 3 or 4 Children | 4 (100.0%) | 0 (0.0%) |
| 5 or more Children | 0 (0.0%) | 0 (0.0%) |
| Total | 27 (19.6%) | 2 (2.1%) |
Race in Moapa Town
The most populous races in Moapa Town are White / Caucasian (533 | 68.8%), Hispanic or Latino (241 | 31.1%), and Two or more Races (176 | 22.7%).
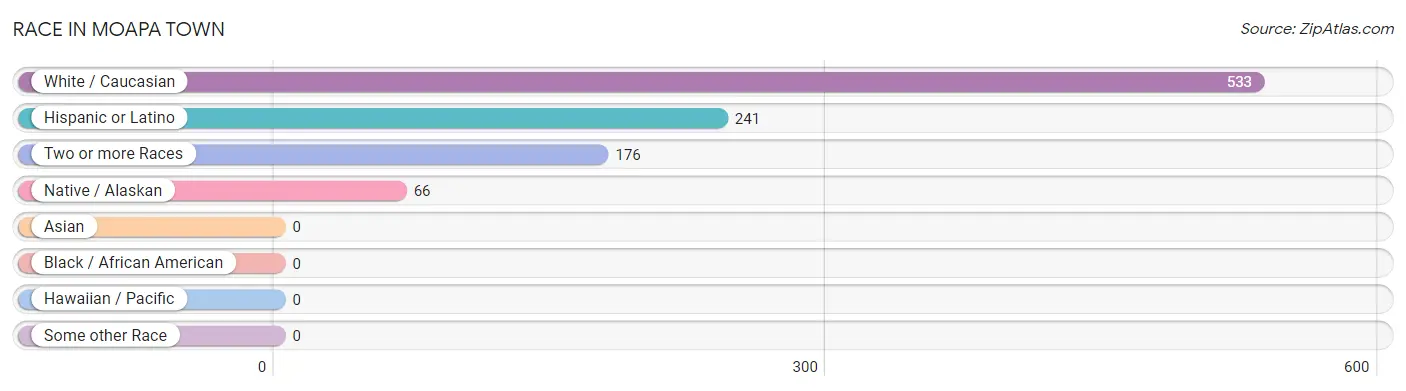
| Race | # Population | % Population |
| Asian | 0 | 0.0% |
| Black / African American | 0 | 0.0% |
| Hawaiian / Pacific | 0 | 0.0% |
| Hispanic or Latino | 241 | 31.1% |
| Native / Alaskan | 66 | 8.5% |
| White / Caucasian | 533 | 68.8% |
| Two or more Races | 176 | 22.7% |
| Some other Race | 0 | 0.0% |
| Total | 775 | 100.0% |
Ancestry in Moapa Town
The most populous ancestries reported in Moapa Town are English (378 | 48.8%), Mexican (241 | 31.1%), Irish (139 | 17.9%), Scotch-Irish (101 | 13.0%), and German (96 | 12.4%), together accounting for 123.2% of all Moapa Town residents.
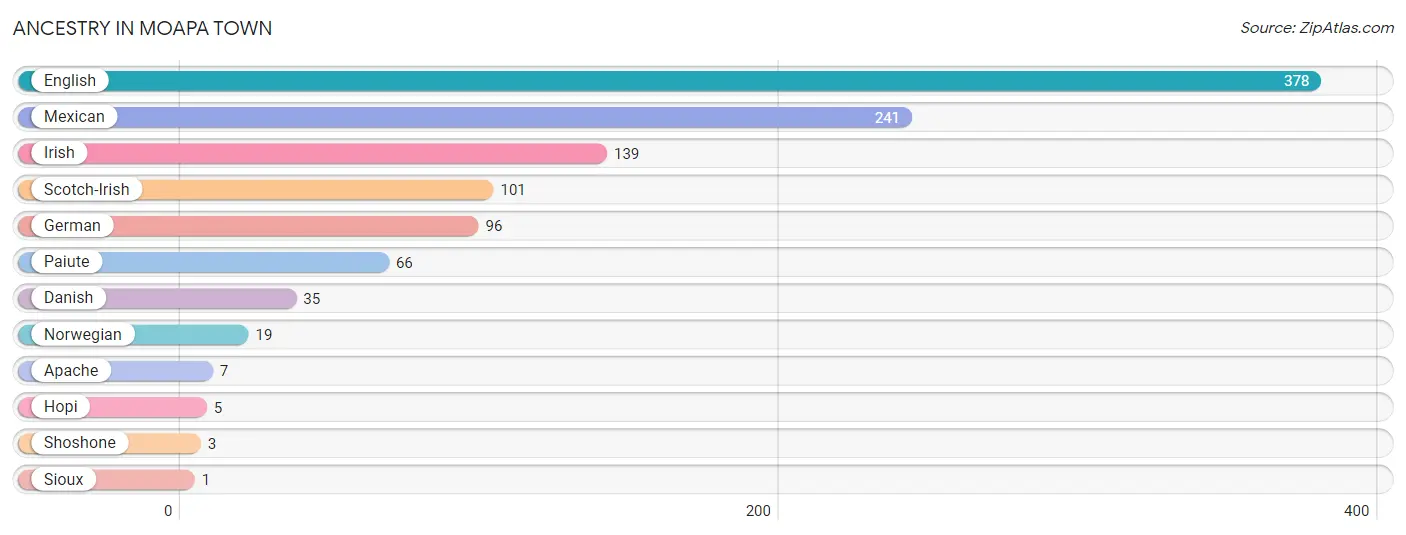
| Ancestry | # Population | % Population |
| Apache | 7 | 0.9% |
| Danish | 35 | 4.5% |
| English | 378 | 48.8% |
| German | 96 | 12.4% |
| Hopi | 5 | 0.6% |
| Irish | 139 | 17.9% |
| Mexican | 241 | 31.1% |
| Norwegian | 19 | 2.5% |
| Paiute | 66 | 8.5% |
| Scotch-Irish | 101 | 13.0% |
| Shoshone | 3 | 0.4% |
| Sioux | 1 | 0.1% | View All 12 Rows |
Immigrants in Moapa Town
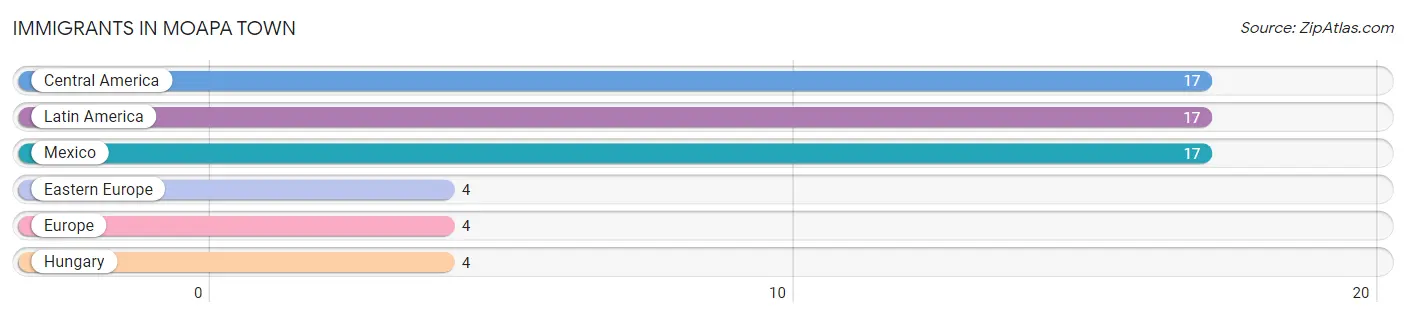
The most numerous immigrant groups reported in Moapa Town came from Central America (17 | 2.2%), Latin America (17 | 2.2%), Mexico (17 | 2.2%), Eastern Europe (4 | 0.5%), and Europe (4 | 0.5%), together accounting for 7.6% of all Moapa Town residents.
| Immigration Origin | # Population | % Population |
| Central America | 17 | 2.2% |
| Eastern Europe | 4 | 0.5% |
| Europe | 4 | 0.5% |
| Hungary | 4 | 0.5% |
| Latin America | 17 | 2.2% |
| Mexico | 17 | 2.2% | View All 6 Rows |
Sex and Age in Moapa Town
Sex and Age in Moapa Town
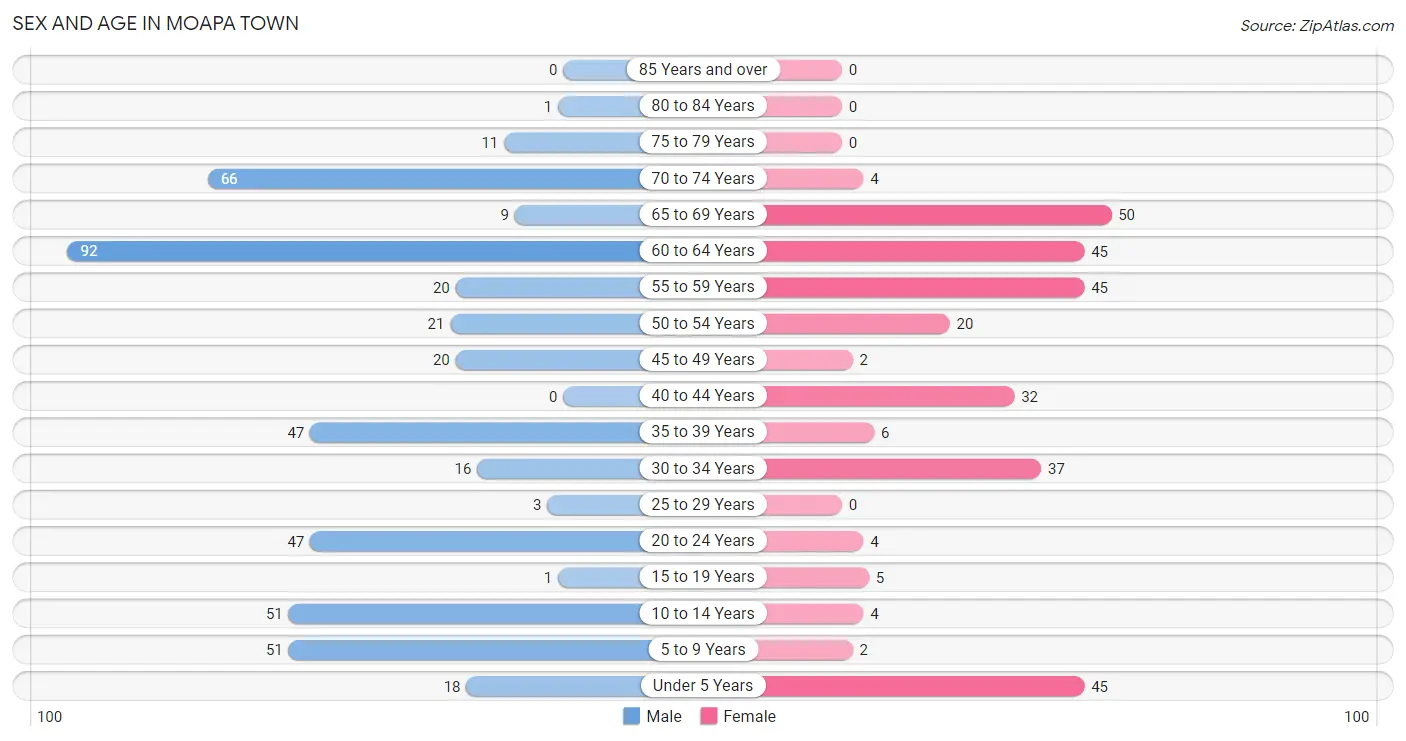
The most populous age groups in Moapa Town are 60 to 64 Years (92 | 19.4%) for men and 65 to 69 Years (50 | 16.6%) for women.
| Age Bracket | Male | Female |
| Under 5 Years | 18 (3.8%) | 45 (14.9%) |
| 5 to 9 Years | 51 (10.8%) | 2 (0.7%) |
| 10 to 14 Years | 51 (10.8%) | 4 (1.3%) |
| 15 to 19 Years | 1 (0.2%) | 5 (1.7%) |
| 20 to 24 Years | 47 (9.9%) | 4 (1.3%) |
| 25 to 29 Years | 3 (0.6%) | 0 (0.0%) |
| 30 to 34 Years | 16 (3.4%) | 37 (12.3%) |
| 35 to 39 Years | 47 (9.9%) | 6 (2.0%) |
| 40 to 44 Years | 0 (0.0%) | 32 (10.6%) |
| 45 to 49 Years | 20 (4.2%) | 2 (0.7%) |
| 50 to 54 Years | 21 (4.4%) | 20 (6.6%) |
| 55 to 59 Years | 20 (4.2%) | 45 (14.9%) |
| 60 to 64 Years | 92 (19.4%) | 45 (14.9%) |
| 65 to 69 Years | 9 (1.9%) | 50 (16.6%) |
| 70 to 74 Years | 66 (13.9%) | 4 (1.3%) |
| 75 to 79 Years | 11 (2.3%) | 0 (0.0%) |
| 80 to 84 Years | 1 (0.2%) | 0 (0.0%) |
| 85 Years and over | 0 (0.0%) | 0 (0.0%) |
| Total | 474 (100.0%) | 301 (100.0%) |
Families and Households in Moapa Town
Median Family Size in Moapa Town
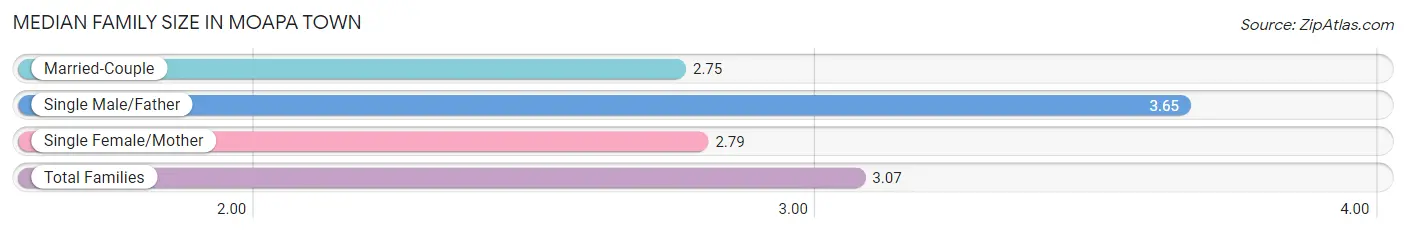
The median family size in Moapa Town is 3.07 persons per family, with single male/father families (83 | 35.3%) accounting for the largest median family size of 3.65 persons per family. On the other hand, married-couple families (138 | 58.7%) represent the smallest median family size with 2.75 persons per family.
| Family Type | # Families | Family Size |
| Married-Couple | 138 (58.7%) | 2.75 |
| Single Male/Father | 83 (35.3%) | 3.65 |
| Single Female/Mother | 14 (6.0%) | 2.79 |
| Total Families | 235 (100.0%) | 3.07 |
Median Household Size in Moapa Town
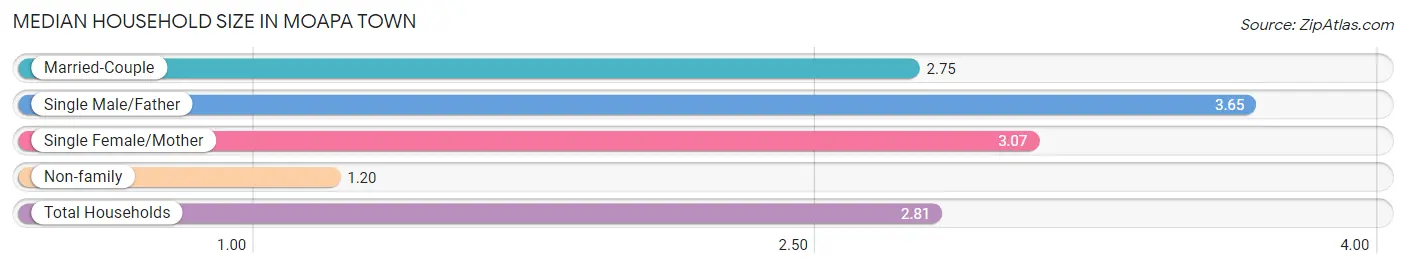
The median household size in Moapa Town is 2.81 persons per household, with single male/father households (83 | 30.1%) accounting for the largest median household size of 3.65 persons per household. non-family households (41 | 14.9%) represent the smallest median household size with 1.20 persons per household.
| Household Type | # Households | Household Size |
| Married-Couple | 138 (50.0%) | 2.75 |
| Single Male/Father | 83 (30.1%) | 3.65 |
| Single Female/Mother | 14 (5.1%) | 3.07 |
| Non-family | 41 (14.9%) | 1.20 |
| Total Households | 276 (100.0%) | 2.81 |
Household Size by Marriage Status in Moapa Town
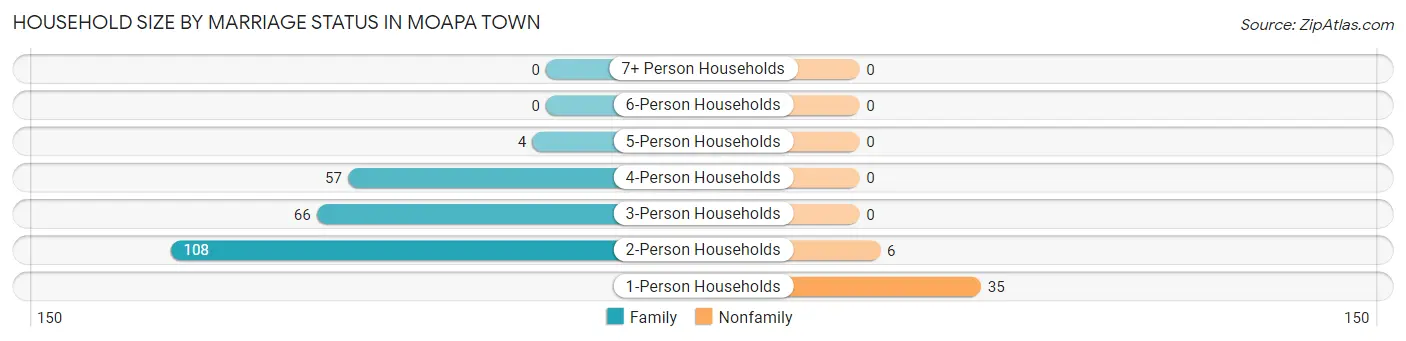
Out of a total of 276 households in Moapa Town, 235 (85.1%) are family households, while 41 (14.9%) are nonfamily households. The most numerous type of family households are 2-person households, comprising 108, and the most common type of nonfamily households are 1-person households, comprising 35.
| Household Size | Family Households | Nonfamily Households |
| 1-Person Households | - | 35 (12.7%) |
| 2-Person Households | 108 (39.1%) | 6 (2.2%) |
| 3-Person Households | 66 (23.9%) | 0 (0.0%) |
| 4-Person Households | 57 (20.6%) | 0 (0.0%) |
| 5-Person Households | 4 (1.5%) | 0 (0.0%) |
| 6-Person Households | 0 (0.0%) | 0 (0.0%) |
| 7+ Person Households | 0 (0.0%) | 0 (0.0%) |
| Total | 235 (85.1%) | 41 (14.9%) |
Female Fertility in Moapa Town
Fertility by Age in Moapa Town
| Age Bracket | Women with Births | Births / 1,000 Women |
| 15 to 19 years | 0 (0.0%) | 0.0 |
| 20 to 34 years | 0 (0.0%) | 0.0 |
| 35 to 50 years | 0 (0.0%) | 0.0 |
| Total | 0 (0.0%) | 0.0 |
Fertility by Age by Marriage Status in Moapa Town
| Age Bracket | Married | Unmarried |
| 15 to 19 years | 0 (0.0%) | 0 (0.0%) |
| 20 to 34 years | 0 (0.0%) | 0 (0.0%) |
| 35 to 50 years | 0 (0.0%) | 0 (0.0%) |
| Total | 0 (0.0%) | 0 (0.0%) |
Fertility by Education in Moapa Town
| Educational Attainment | Women with Births | Births / 1,000 Women |
| Less than High School | 0 (0.0%) | 0.0 |
| High School Diploma | 0 (0.0%) | 0.0 |
| College or Associate's Degree | 0 (0.0%) | 0.0 |
| Bachelor's Degree | 0 (0.0%) | 0.0 |
| Graduate Degree | 0 (0.0%) | 0.0 |
| Total | 0 (0.0%) | 0.0 |
Fertility by Education by Marriage Status in Moapa Town

| Educational Attainment | Married | Unmarried |
| Less than High School | 0 (0.0%) | 0 (0.0%) |
| High School Diploma | 0 (0.0%) | 0 (0.0%) |
| College or Associate's Degree | 0 (0.0%) | 0 (0.0%) |
| Bachelor's Degree | 0 (0.0%) | 0 (0.0%) |
| Graduate Degree | 0 (0.0%) | 0 (0.0%) |
| Total | 0 (0.0%) | 0 (0.0%) |
Employment Characteristics in Moapa Town
Employment by Class of Employer in Moapa Town
Among the 267 employed individuals in Moapa Town, private company employees (172 | 64.4%), local government employees (39 | 14.6%), and federal government employees (35 | 13.1%) make up the most common classes of employment.
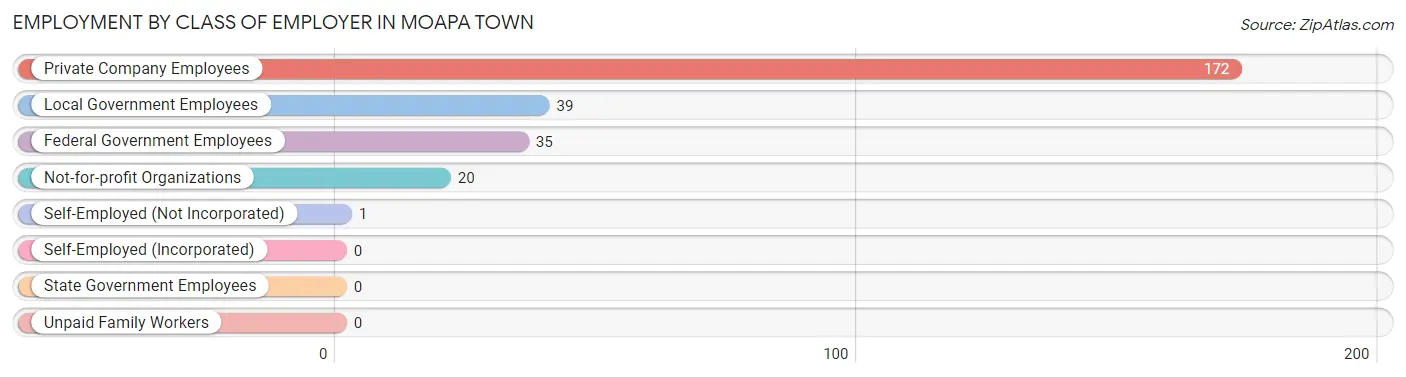
| Employer Class | # Employees | % Employees |
| Private Company Employees | 172 | 64.4% |
| Self-Employed (Incorporated) | 0 | 0.0% |
| Self-Employed (Not Incorporated) | 1 | 0.4% |
| Not-for-profit Organizations | 20 | 7.5% |
| Local Government Employees | 39 | 14.6% |
| State Government Employees | 0 | 0.0% |
| Federal Government Employees | 35 | 13.1% |
| Unpaid Family Workers | 0 | 0.0% |
| Total | 267 | 100.0% |
Employment Status by Age in Moapa Town
According to the labor force statistics for Moapa Town, out of the total population over 16 years of age (604), 53.8% or 325 individuals are in the labor force, with 3.4% or 11 of them unemployed. The age group with the highest labor force participation rate is 20 to 24 years, with 100.0% or 51 individuals in the labor force. Within the labor force, the 35 to 44 years age range has the highest percentage of unemployed individuals, with 11.4% or 9 of them being unemployed.
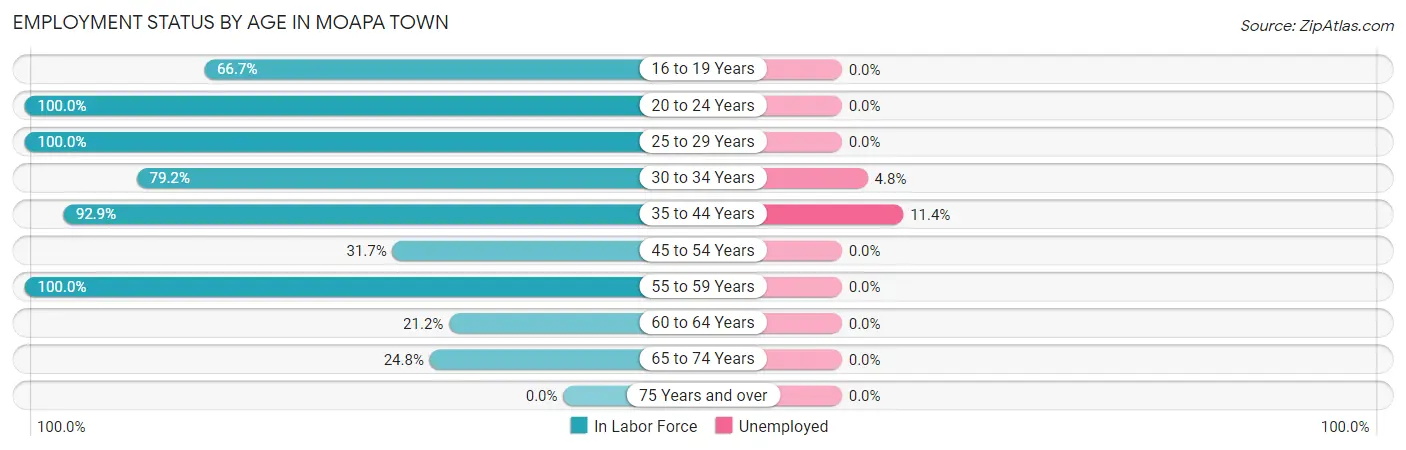
| Age Bracket | In Labor Force | Unemployed |
| 16 to 19 Years | 4 (66.7%) | 0 (0.0%) |
| 20 to 24 Years | 51 (100.0%) | 0 (0.0%) |
| 25 to 29 Years | 3 (100.0%) | 0 (0.0%) |
| 30 to 34 Years | 42 (79.2%) | 2 (4.8%) |
| 35 to 44 Years | 79 (92.9%) | 9 (11.4%) |
| 45 to 54 Years | 20 (31.7%) | 0 (0.0%) |
| 55 to 59 Years | 65 (100.0%) | 0 (0.0%) |
| 60 to 64 Years | 29 (21.2%) | 0 (0.0%) |
| 65 to 74 Years | 32 (24.8%) | 0 (0.0%) |
| 75 Years and over | 0 (0.0%) | 0 (0.0%) |
| Total | 325 (53.8%) | 11 (3.4%) |
Employment Status by Educational Attainment in Moapa Town
According to labor force statistics for Moapa Town, 58.6% of individuals (238) out of the total population between 25 and 64 years of age (406) are in the labor force, with 4.6% or 11 of them being unemployed. The group with the highest labor force participation rate are those with the educational attainment of college / associate degree, with 69.7% or 108 individuals in the labor force. Within the labor force, individuals with college / associate degree education have the highest percentage of unemployment, with 8.3% or 9 of them being unemployed.
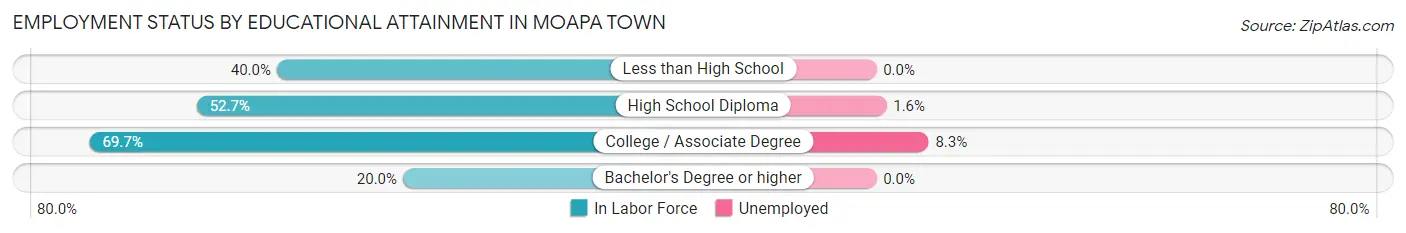
| Educational Attainment | In Labor Force | Unemployed |
| Less than High School | 2 (40.0%) | 0 (0.0%) |
| High School Diploma | 127 (52.7%) | 4 (1.6%) |
| College / Associate Degree | 108 (69.7%) | 13 (8.3%) |
| Bachelor's Degree or higher | 1 (20.0%) | 0 (0.0%) |
| Total | 238 (58.6%) | 19 (4.6%) |
Employment Occupations by Sex in Moapa Town
Management, Business, Science and Arts Occupations
The most common Management, Business, Science and Arts occupations in Moapa Town are Community & Social Service (36 | 11.5%), and Education Instruction & Library (36 | 11.5%).
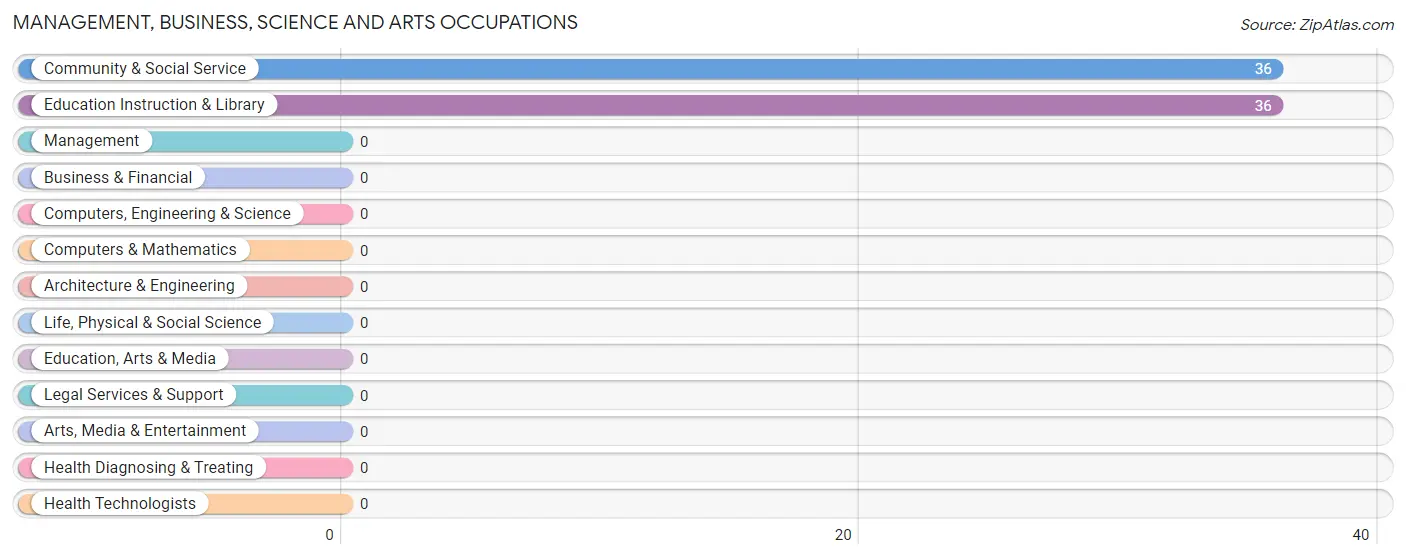
Management, Business, Science and Arts Occupations by Sex
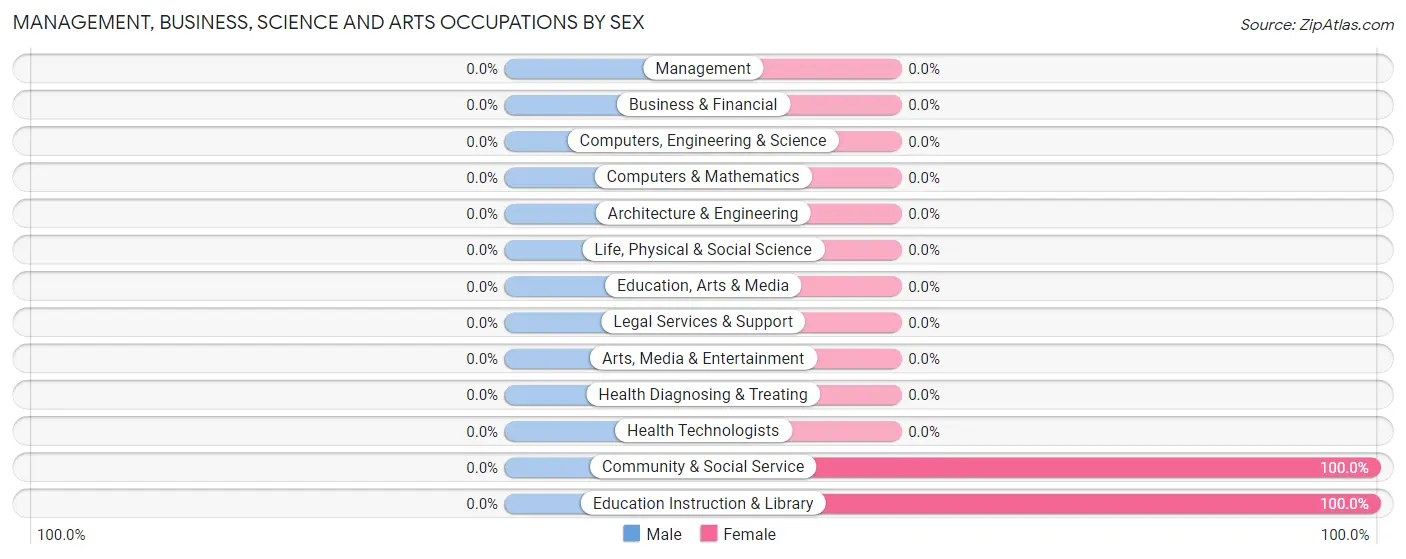
| Occupation | Male | Female |
| Management | 0 (0.0%) | 0 (0.0%) |
| Business & Financial | 0 (0.0%) | 0 (0.0%) |
| Computers, Engineering & Science | 0 (0.0%) | 0 (0.0%) |
| Computers & Mathematics | 0 (0.0%) | 0 (0.0%) |
| Architecture & Engineering | 0 (0.0%) | 0 (0.0%) |
| Life, Physical & Social Science | 0 (0.0%) | 0 (0.0%) |
| Community & Social Service | 0 (0.0%) | 36 (100.0%) |
| Education, Arts & Media | 0 (0.0%) | 0 (0.0%) |
| Legal Services & Support | 0 (0.0%) | 0 (0.0%) |
| Education Instruction & Library | 0 (0.0%) | 36 (100.0%) |
| Arts, Media & Entertainment | 0 (0.0%) | 0 (0.0%) |
| Health Diagnosing & Treating | 0 (0.0%) | 0 (0.0%) |
| Health Technologists | 0 (0.0%) | 0 (0.0%) |
| Total (Category) | 0 (0.0%) | 36 (100.0%) |
| Total (Overall) | 172 (54.8%) | 142 (45.2%) |
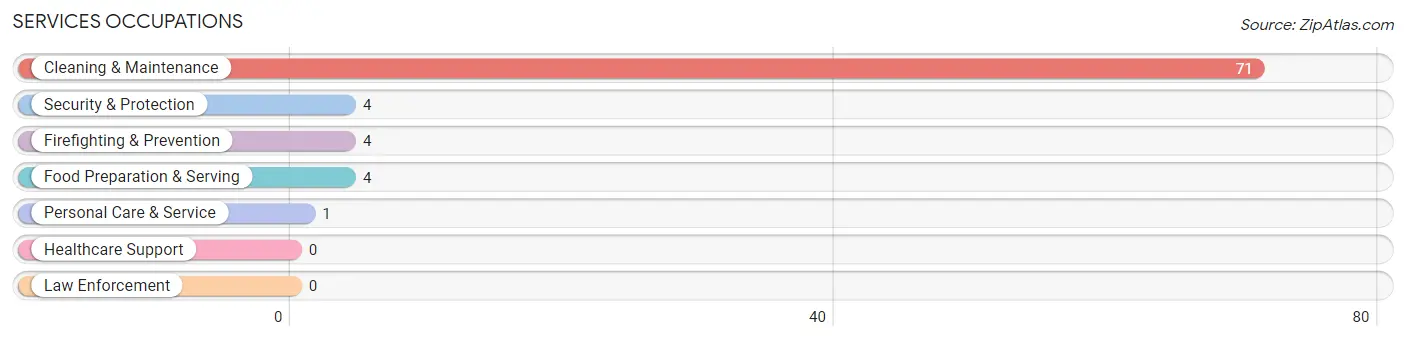
Services Occupations
The most common Services occupations in Moapa Town are Cleaning & Maintenance (71 | 22.6%), Security & Protection (4 | 1.3%), Firefighting & Prevention (4 | 1.3%), Food Preparation & Serving (4 | 1.3%), and Personal Care & Service (1 | 0.3%).
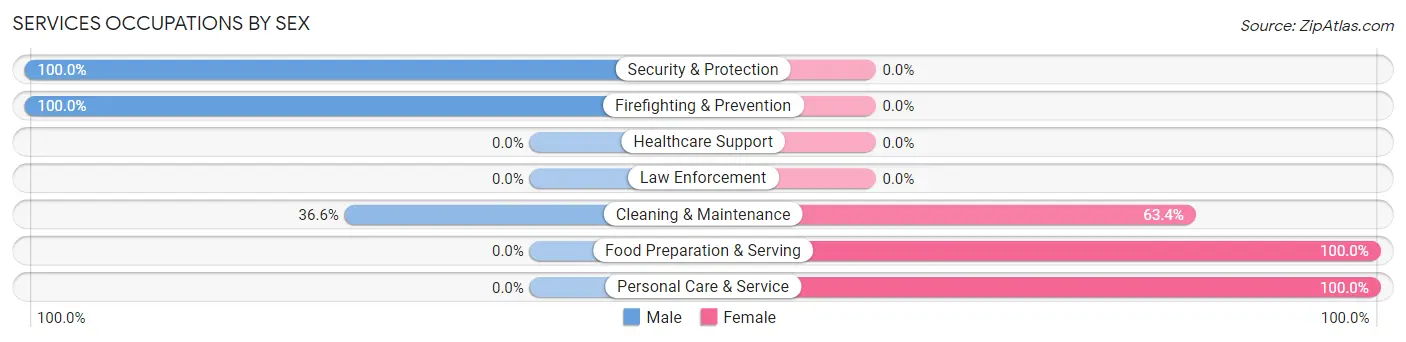
Services Occupations by Sex
Within the Services occupations in Moapa Town, the most male-oriented occupations are Security & Protection (100.0%), Firefighting & Prevention (100.0%), and Cleaning & Maintenance (36.6%), while the most female-oriented occupations are Food Preparation & Serving (100.0%), Personal Care & Service (100.0%), and Cleaning & Maintenance (63.4%).
| Occupation | Male | Female |
| Healthcare Support | 0 (0.0%) | 0 (0.0%) |
| Security & Protection | 4 (100.0%) | 0 (0.0%) |
| Firefighting & Prevention | 4 (100.0%) | 0 (0.0%) |
| Law Enforcement | 0 (0.0%) | 0 (0.0%) |
| Food Preparation & Serving | 0 (0.0%) | 4 (100.0%) |
| Cleaning & Maintenance | 26 (36.6%) | 45 (63.4%) |
| Personal Care & Service | 0 (0.0%) | 1 (100.0%) |
| Total (Category) | 30 (37.5%) | 50 (62.5%) |
| Total (Overall) | 172 (54.8%) | 142 (45.2%) |
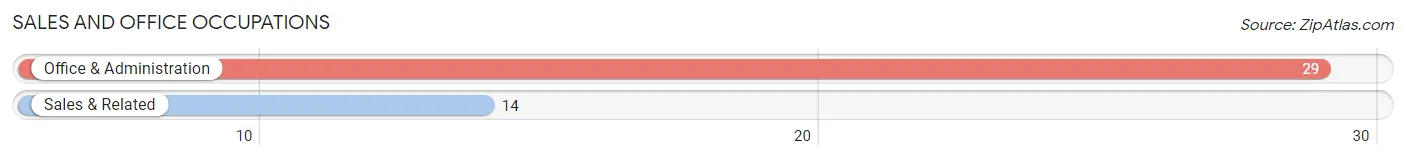
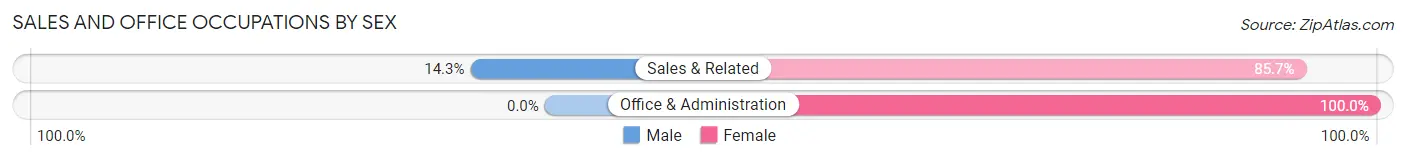
Sales and Office Occupations
The most common Sales and Office occupations in Moapa Town are Office & Administration (29 | 9.2%), and Sales & Related (14 | 4.5%).
Sales and Office Occupations by Sex
| Occupation | Male | Female |
| Sales & Related | 2 (14.3%) | 12 (85.7%) |
| Office & Administration | 0 (0.0%) | 29 (100.0%) |
| Total (Category) | 2 (4.6%) | 41 (95.4%) |
| Total (Overall) | 172 (54.8%) | 142 (45.2%) |
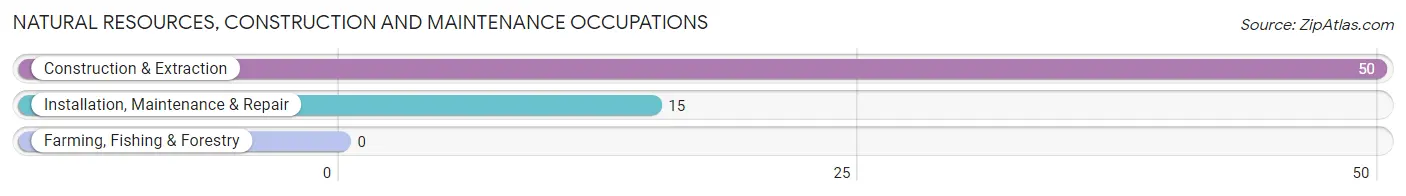
Natural Resources, Construction and Maintenance Occupations
The most common Natural Resources, Construction and Maintenance occupations in Moapa Town are Construction & Extraction (50 | 15.9%), and Installation, Maintenance & Repair (15 | 4.8%).
Natural Resources, Construction and Maintenance Occupations by Sex
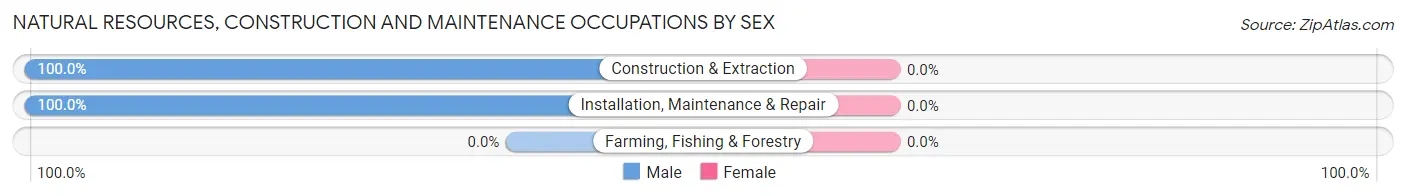
| Occupation | Male | Female |
| Farming, Fishing & Forestry | 0 (0.0%) | 0 (0.0%) |
| Construction & Extraction | 50 (100.0%) | 0 (0.0%) |
| Installation, Maintenance & Repair | 15 (100.0%) | 0 (0.0%) |
| Total (Category) | 65 (100.0%) | 0 (0.0%) |
| Total (Overall) | 172 (54.8%) | 142 (45.2%) |
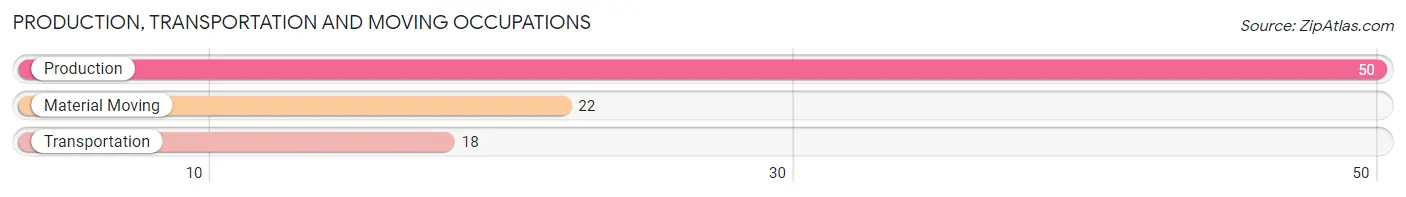
Production, Transportation and Moving Occupations
The most common Production, Transportation and Moving occupations in Moapa Town are Production (50 | 15.9%), Material Moving (22 | 7.0%), and Transportation (18 | 5.7%).
Production, Transportation and Moving Occupations by Sex
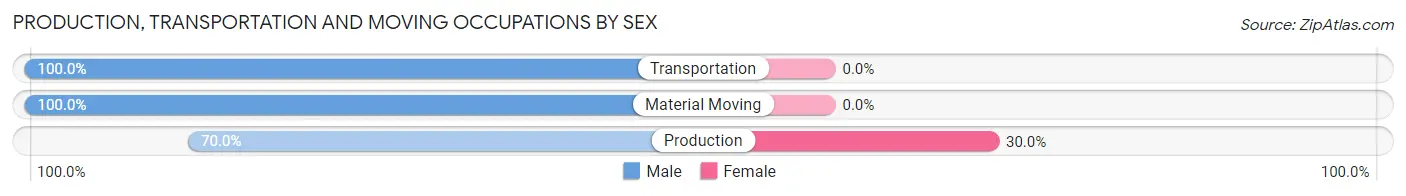
| Occupation | Male | Female |
| Production | 35 (70.0%) | 15 (30.0%) |
| Transportation | 18 (100.0%) | 0 (0.0%) |
| Material Moving | 22 (100.0%) | 0 (0.0%) |
| Total (Category) | 75 (83.3%) | 15 (16.7%) |
| Total (Overall) | 172 (54.8%) | 142 (45.2%) |
Employment Industries by Sex in Moapa Town
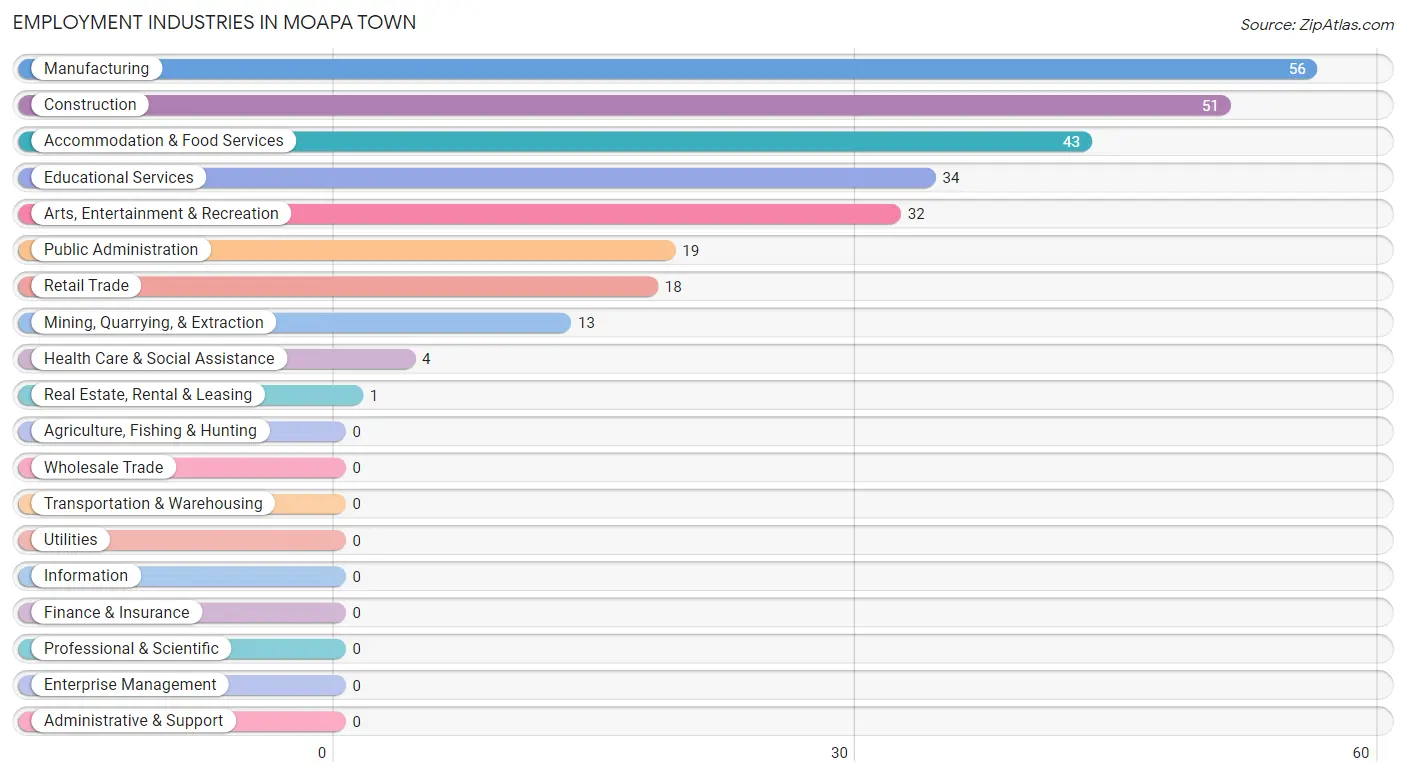
Employment Industries in Moapa Town
The major employment industries in Moapa Town include Manufacturing (56 | 17.8%), Construction (51 | 16.2%), Accommodation & Food Services (43 | 13.7%), Educational Services (34 | 10.8%), and Arts, Entertainment & Recreation (32 | 10.2%).
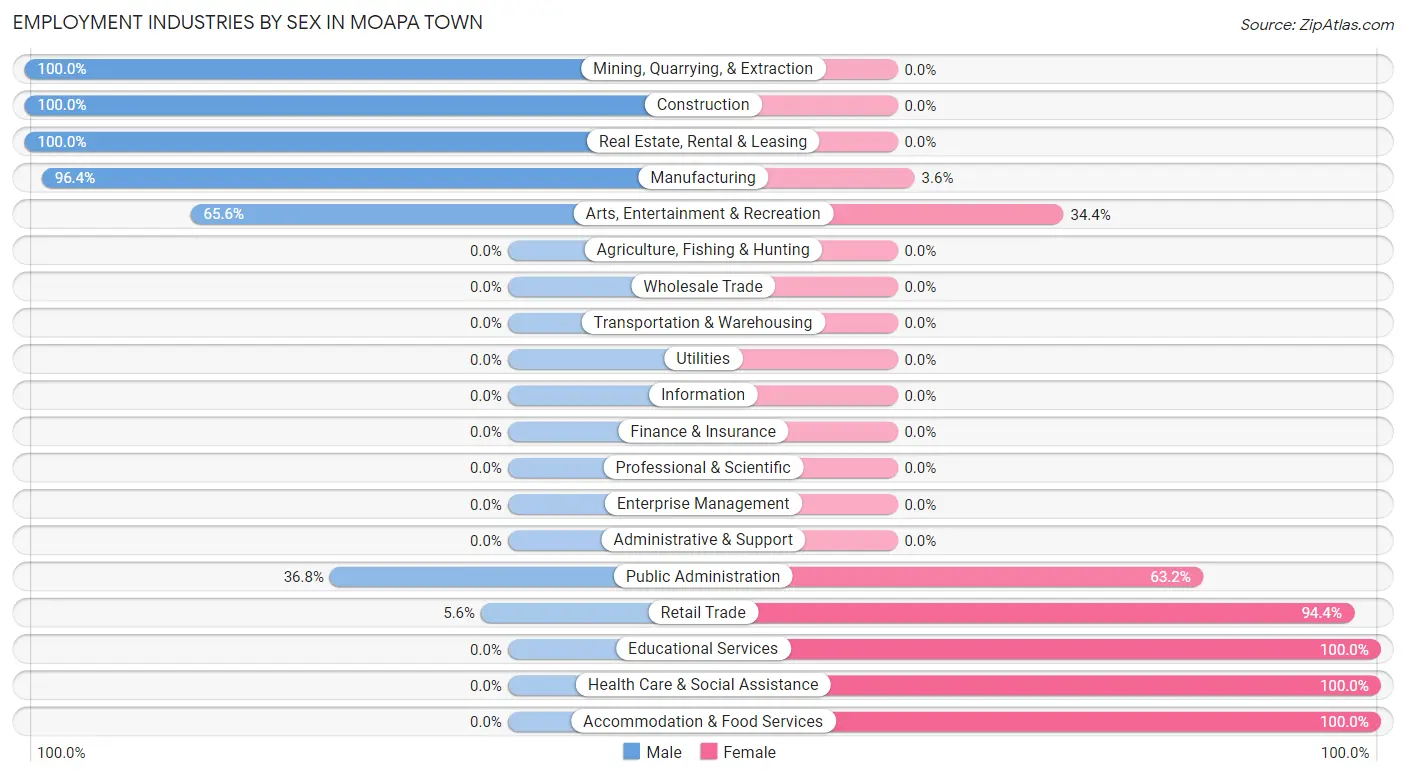
Employment Industries by Sex in Moapa Town
The Moapa Town industries that see more men than women are Mining, Quarrying, & Extraction (100.0%), Construction (100.0%), and Real Estate, Rental & Leasing (100.0%), whereas the industries that tend to have a higher number of women are Educational Services (100.0%), Health Care & Social Assistance (100.0%), and Accommodation & Food Services (100.0%).
| Industry | Male | Female |
| Agriculture, Fishing & Hunting | 0 (0.0%) | 0 (0.0%) |
| Mining, Quarrying, & Extraction | 13 (100.0%) | 0 (0.0%) |
| Construction | 51 (100.0%) | 0 (0.0%) |
| Manufacturing | 54 (96.4%) | 2 (3.6%) |
| Wholesale Trade | 0 (0.0%) | 0 (0.0%) |
| Retail Trade | 1 (5.6%) | 17 (94.4%) |
| Transportation & Warehousing | 0 (0.0%) | 0 (0.0%) |
| Utilities | 0 (0.0%) | 0 (0.0%) |
| Information | 0 (0.0%) | 0 (0.0%) |
| Finance & Insurance | 0 (0.0%) | 0 (0.0%) |
| Real Estate, Rental & Leasing | 1 (100.0%) | 0 (0.0%) |
| Professional & Scientific | 0 (0.0%) | 0 (0.0%) |
| Enterprise Management | 0 (0.0%) | 0 (0.0%) |
| Administrative & Support | 0 (0.0%) | 0 (0.0%) |
| Educational Services | 0 (0.0%) | 34 (100.0%) |
| Health Care & Social Assistance | 0 (0.0%) | 4 (100.0%) |
| Arts, Entertainment & Recreation | 21 (65.6%) | 11 (34.4%) |
| Accommodation & Food Services | 0 (0.0%) | 43 (100.0%) |
| Public Administration | 7 (36.8%) | 12 (63.2%) |
| Total | 172 (54.8%) | 142 (45.2%) |
Education in Moapa Town
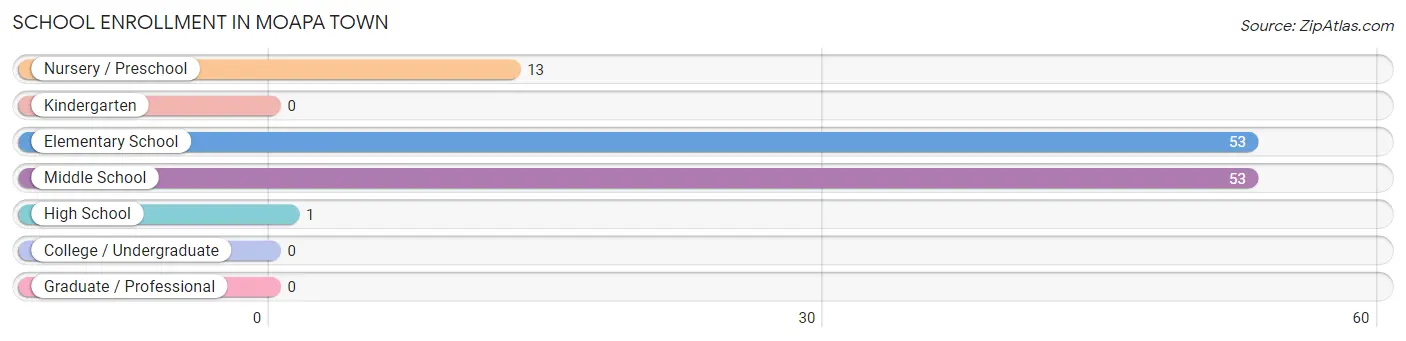
School Enrollment in Moapa Town
The most common levels of schooling among the 120 students in Moapa Town are elementary school (53 | 44.2%), middle school (53 | 44.2%), and nursery / preschool (13 | 10.8%).
| School Level | # Students | % Students |
| Nursery / Preschool | 13 | 10.8% |
| Kindergarten | 0 | 0.0% |
| Elementary School | 53 | 44.2% |
| Middle School | 53 | 44.2% |
| High School | 1 | 0.8% |
| College / Undergraduate | 0 | 0.0% |
| Graduate / Professional | 0 | 0.0% |
| Total | 120 | 100.0% |
School Enrollment by Age by Funding Source in Moapa Town
Out of a total of 120 students who are enrolled in schools in Moapa Town, 18 (15.0%) attend a private institution, while the remaining 102 (85.0%) are enrolled in public schools. The age group of 10 to 14 year olds has the highest likelihood of being enrolled in private schools, with 18 (32.7% in the age bracket) enrolled. Conversely, the age group of 3 to 4 year olds has the lowest likelihood of being enrolled in a private school, with 13 (100.0% in the age bracket) attending a public institution.
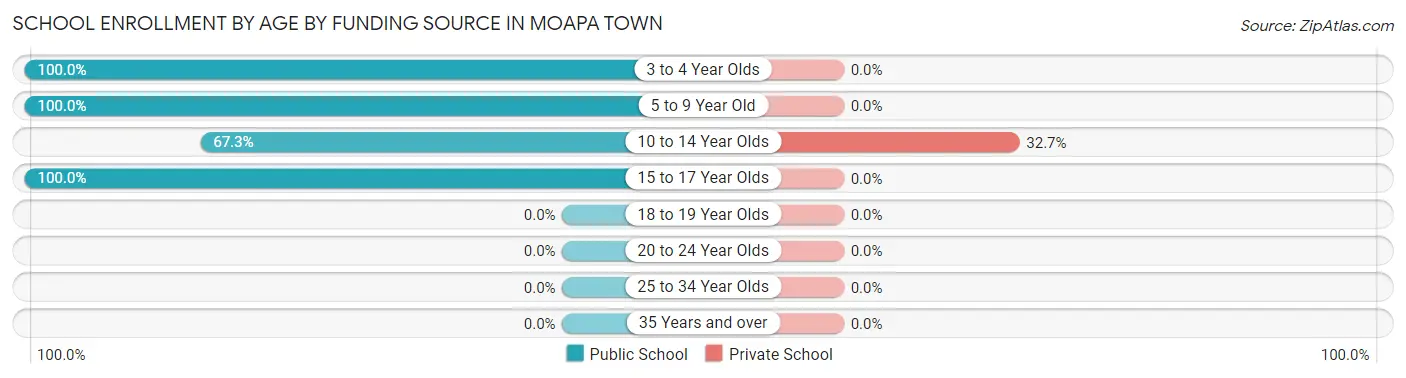
| Age Bracket | Public School | Private School |
| 3 to 4 Year Olds | 13 (100.0%) | 0 (0.0%) |
| 5 to 9 Year Old | 51 (100.0%) | 0 (0.0%) |
| 10 to 14 Year Olds | 37 (67.3%) | 18 (32.7%) |
| 15 to 17 Year Olds | 1 (100.0%) | 0 (0.0%) |
| 18 to 19 Year Olds | 0 (0.0%) | 0 (0.0%) |
| 20 to 24 Year Olds | 0 (0.0%) | 0 (0.0%) |
| 25 to 34 Year Olds | 0 (0.0%) | 0 (0.0%) |
| 35 Years and over | 0 (0.0%) | 0 (0.0%) |
| Total | 102 (85.0%) | 18 (15.0%) |
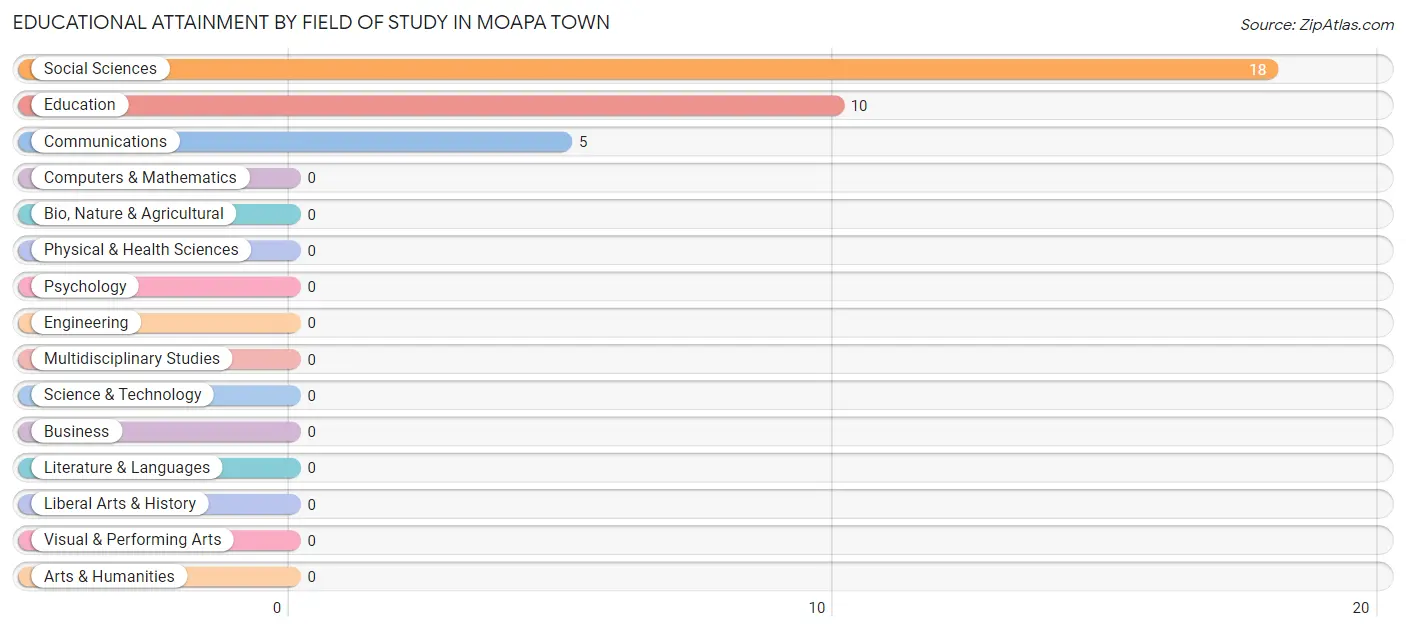
Educational Attainment by Field of Study in Moapa Town
Social sciences (18 | 54.5%), education (10 | 30.3%), and communications (5 | 15.1%) are the most common fields of study among 33 individuals in Moapa Town who have obtained a bachelor's degree or higher.
| Field of Study | # Graduates | % Graduates |
| Computers & Mathematics | 0 | 0.0% |
| Bio, Nature & Agricultural | 0 | 0.0% |
| Physical & Health Sciences | 0 | 0.0% |
| Psychology | 0 | 0.0% |
| Social Sciences | 18 | 54.5% |
| Engineering | 0 | 0.0% |
| Multidisciplinary Studies | 0 | 0.0% |
| Science & Technology | 0 | 0.0% |
| Business | 0 | 0.0% |
| Education | 10 | 30.3% |
| Literature & Languages | 0 | 0.0% |
| Liberal Arts & History | 0 | 0.0% |
| Visual & Performing Arts | 0 | 0.0% |
| Communications | 5 | 15.1% |
| Arts & Humanities | 0 | 0.0% |
| Total | 33 | 100.0% |
Transportation & Commute in Moapa Town
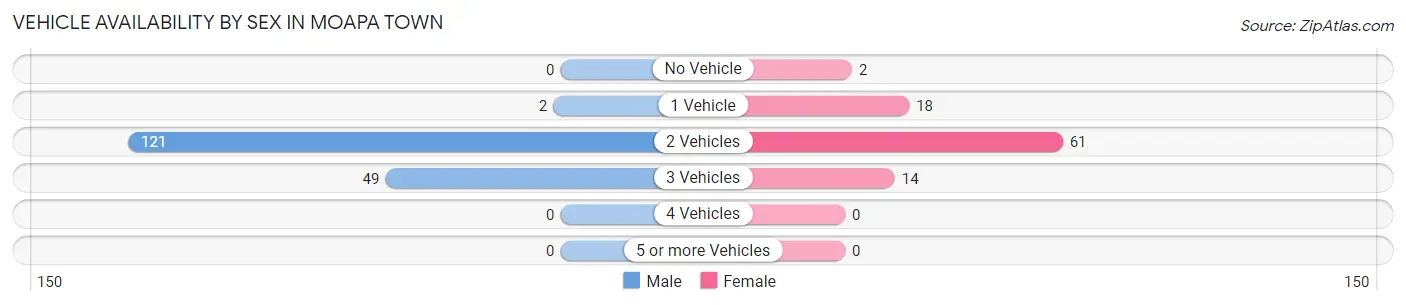
Vehicle Availability by Sex in Moapa Town
The most prevalent vehicle ownership categories in Moapa Town are males with 2 vehicles (121, accounting for 70.4%) and females with 2 vehicles (61, making up 127.4%).
| Vehicles Available | Male | Female |
| No Vehicle | 0 (0.0%) | 2 (2.1%) |
| 1 Vehicle | 2 (1.2%) | 18 (19.0%) |
| 2 Vehicles | 121 (70.4%) | 61 (64.2%) |
| 3 Vehicles | 49 (28.5%) | 14 (14.7%) |
| 4 Vehicles | 0 (0.0%) | 0 (0.0%) |
| 5 or more Vehicles | 0 (0.0%) | 0 (0.0%) |
| Total | 172 (100.0%) | 95 (100.0%) |
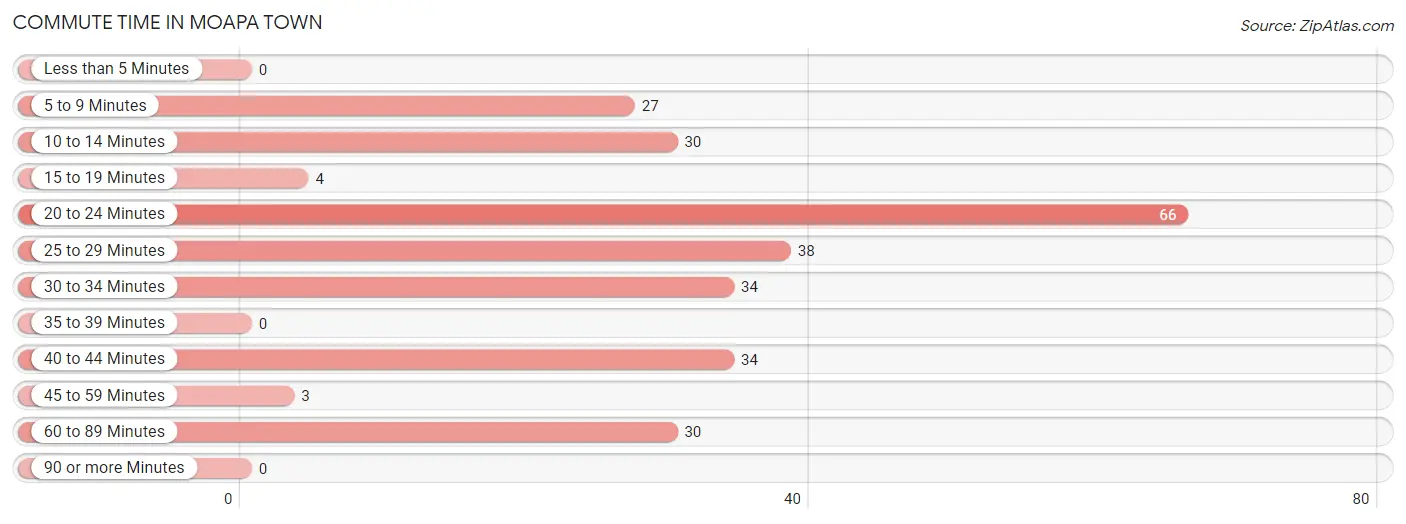
Commute Time in Moapa Town
The most frequently occuring commute durations in Moapa Town are 20 to 24 minutes (66 commuters, 24.8%), 25 to 29 minutes (38 commuters, 14.3%), and 30 to 34 minutes (34 commuters, 12.8%).
| Commute Time | # Commuters | % Commuters |
| Less than 5 Minutes | 0 | 0.0% |
| 5 to 9 Minutes | 27 | 10.2% |
| 10 to 14 Minutes | 30 | 11.3% |
| 15 to 19 Minutes | 4 | 1.5% |
| 20 to 24 Minutes | 66 | 24.8% |
| 25 to 29 Minutes | 38 | 14.3% |
| 30 to 34 Minutes | 34 | 12.8% |
| 35 to 39 Minutes | 0 | 0.0% |
| 40 to 44 Minutes | 34 | 12.8% |
| 45 to 59 Minutes | 3 | 1.1% |
| 60 to 89 Minutes | 30 | 11.3% |
| 90 or more Minutes | 0 | 0.0% |
Commute Time by Sex in Moapa Town
The most common commute times in Moapa Town are 30 to 34 minutes (34 commuters, 19.9%) for males and 20 to 24 minutes (42 commuters, 44.2%) for females.
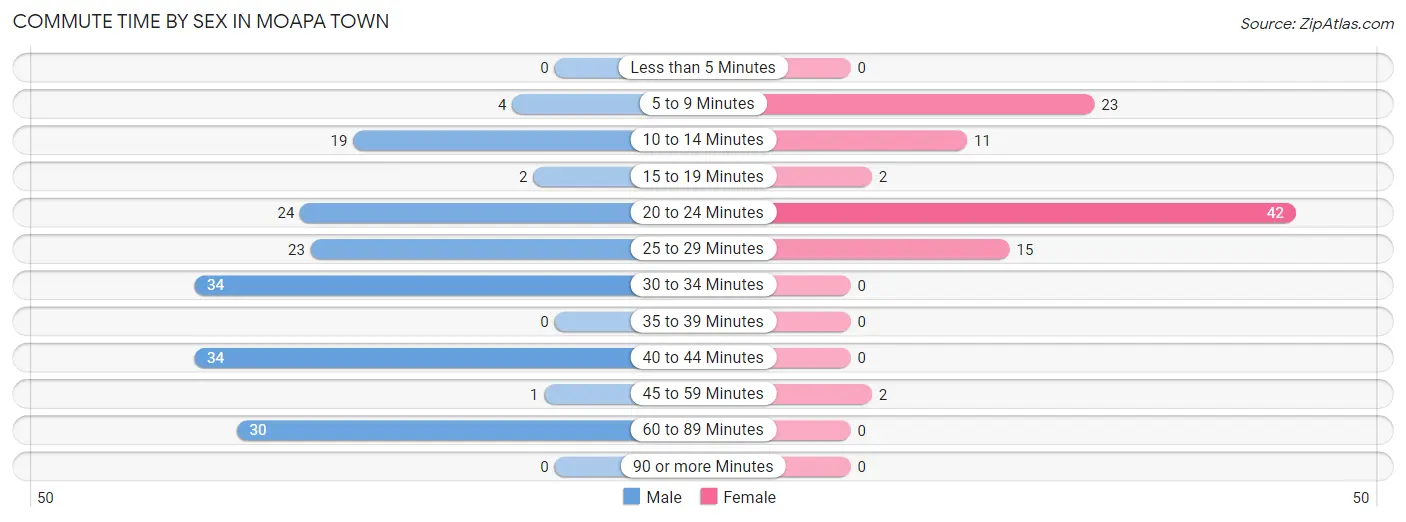
| Commute Time | Male | Female |
| Less than 5 Minutes | 0 (0.0%) | 0 (0.0%) |
| 5 to 9 Minutes | 4 (2.3%) | 23 (24.2%) |
| 10 to 14 Minutes | 19 (11.1%) | 11 (11.6%) |
| 15 to 19 Minutes | 2 (1.2%) | 2 (2.1%) |
| 20 to 24 Minutes | 24 (14.0%) | 42 (44.2%) |
| 25 to 29 Minutes | 23 (13.5%) | 15 (15.8%) |
| 30 to 34 Minutes | 34 (19.9%) | 0 (0.0%) |
| 35 to 39 Minutes | 0 (0.0%) | 0 (0.0%) |
| 40 to 44 Minutes | 34 (19.9%) | 0 (0.0%) |
| 45 to 59 Minutes | 1 (0.6%) | 2 (2.1%) |
| 60 to 89 Minutes | 30 (17.5%) | 0 (0.0%) |
| 90 or more Minutes | 0 (0.0%) | 0 (0.0%) |
Time of Departure to Work by Sex in Moapa Town
The most frequent times of departure to work in Moapa Town are 12:00 AM to 4:59 AM (49, 28.6%) for males and 7:30 AM to 7:59 AM (32, 33.7%) for females.
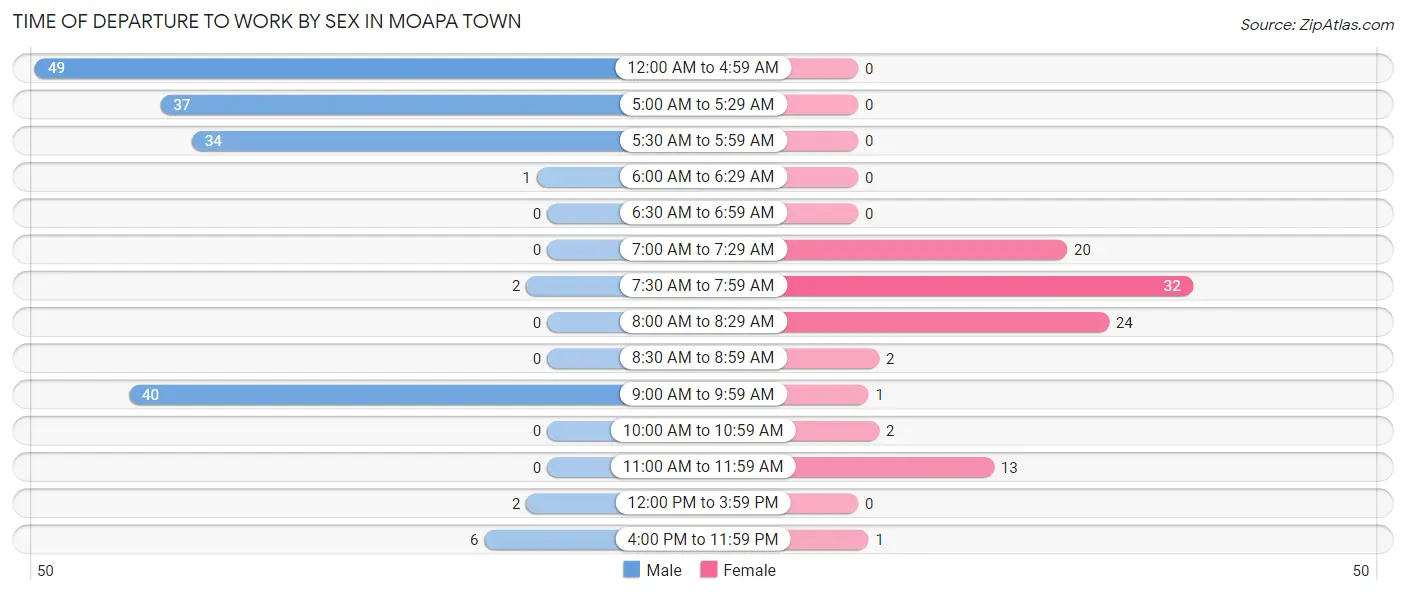
| Time of Departure | Male | Female |
| 12:00 AM to 4:59 AM | 49 (28.6%) | 0 (0.0%) |
| 5:00 AM to 5:29 AM | 37 (21.6%) | 0 (0.0%) |
| 5:30 AM to 5:59 AM | 34 (19.9%) | 0 (0.0%) |
| 6:00 AM to 6:29 AM | 1 (0.6%) | 0 (0.0%) |
| 6:30 AM to 6:59 AM | 0 (0.0%) | 0 (0.0%) |
| 7:00 AM to 7:29 AM | 0 (0.0%) | 20 (21.0%) |
| 7:30 AM to 7:59 AM | 2 (1.2%) | 32 (33.7%) |
| 8:00 AM to 8:29 AM | 0 (0.0%) | 24 (25.3%) |
| 8:30 AM to 8:59 AM | 0 (0.0%) | 2 (2.1%) |
| 9:00 AM to 9:59 AM | 40 (23.4%) | 1 (1.1%) |
| 10:00 AM to 10:59 AM | 0 (0.0%) | 2 (2.1%) |
| 11:00 AM to 11:59 AM | 0 (0.0%) | 13 (13.7%) |
| 12:00 PM to 3:59 PM | 2 (1.2%) | 0 (0.0%) |
| 4:00 PM to 11:59 PM | 6 (3.5%) | 1 (1.1%) |
| Total | 171 (100.0%) | 95 (100.0%) |
Housing Occupancy in Moapa Town
Occupancy by Ownership in Moapa Town
Of the total 276 dwellings in Moapa Town, owner-occupied units account for 215 (77.9%), while renter-occupied units make up 61 (22.1%).
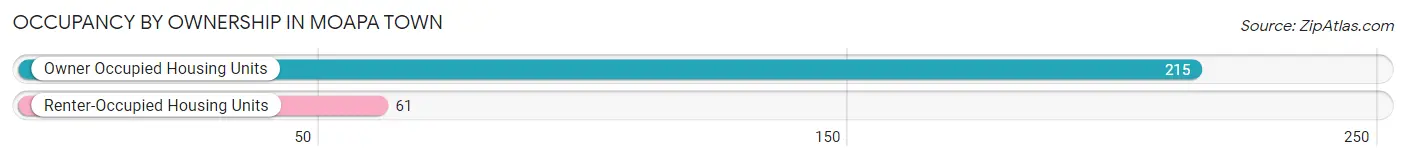
| Occupancy | # Housing Units | % Housing Units |
| Owner Occupied Housing Units | 215 | 77.9% |
| Renter-Occupied Housing Units | 61 | 22.1% |
| Total Occupied Housing Units | 276 | 100.0% |
Occupancy by Household Size in Moapa Town
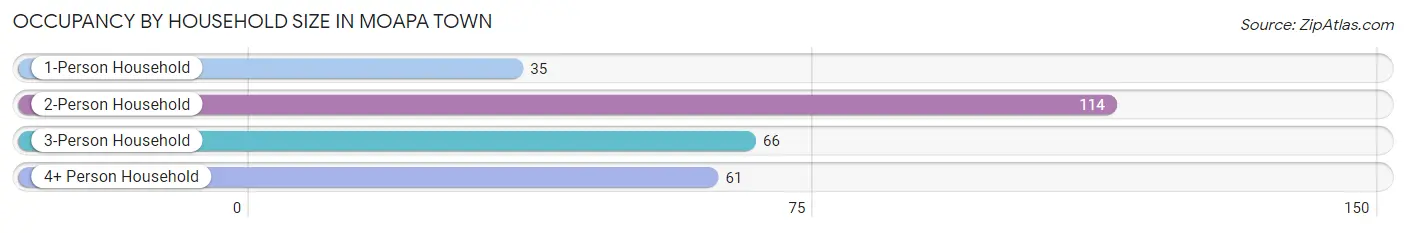
| Household Size | # Housing Units | % Housing Units |
| 1-Person Household | 35 | 12.7% |
| 2-Person Household | 114 | 41.3% |
| 3-Person Household | 66 | 23.9% |
| 4+ Person Household | 61 | 22.1% |
| Total Housing Units | 276 | 100.0% |
Occupancy by Ownership by Household Size in Moapa Town
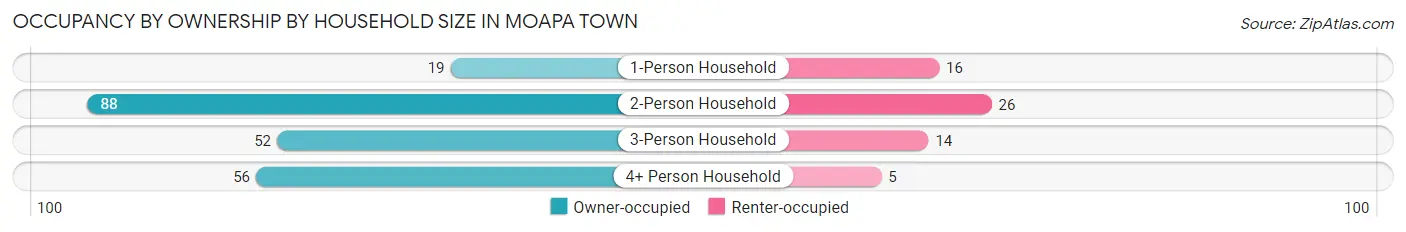
| Household Size | Owner-occupied | Renter-occupied |
| 1-Person Household | 19 (54.3%) | 16 (45.7%) |
| 2-Person Household | 88 (77.2%) | 26 (22.8%) |
| 3-Person Household | 52 (78.8%) | 14 (21.2%) |
| 4+ Person Household | 56 (91.8%) | 5 (8.2%) |
| Total Housing Units | 215 (77.9%) | 61 (22.1%) |
Occupancy by Educational Attainment in Moapa Town
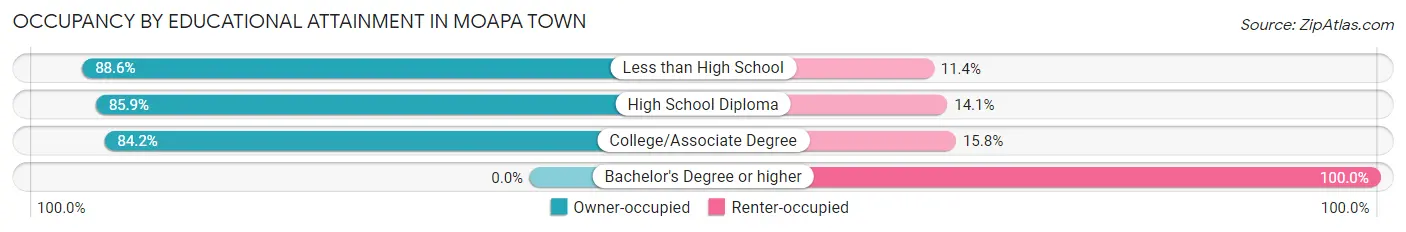
| Household Size | Owner-occupied | Renter-occupied |
| Less than High School | 31 (88.6%) | 4 (11.4%) |
| High School Diploma | 67 (85.9%) | 11 (14.1%) |
| College/Associate Degree | 117 (84.2%) | 22 (15.8%) |
| Bachelor's Degree or higher | 0 (0.0%) | 24 (100.0%) |
Occupancy by Age of Householder in Moapa Town
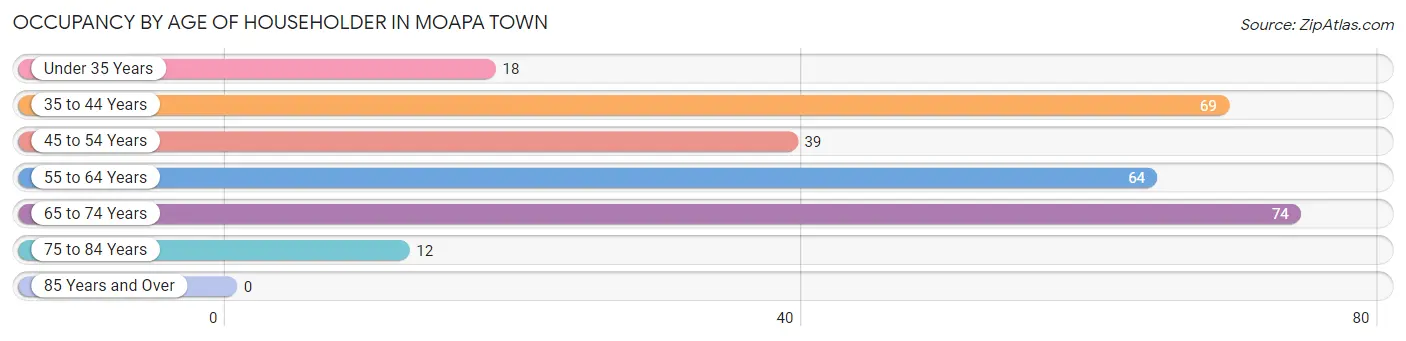
| Age Bracket | # Households | % Households |
| Under 35 Years | 18 | 6.5% |
| 35 to 44 Years | 69 | 25.0% |
| 45 to 54 Years | 39 | 14.1% |
| 55 to 64 Years | 64 | 23.2% |
| 65 to 74 Years | 74 | 26.8% |
| 75 to 84 Years | 12 | 4.3% |
| 85 Years and Over | 0 | 0.0% |
| Total | 276 | 100.0% |
Housing Finances in Moapa Town
Median Income by Occupancy in Moapa Town
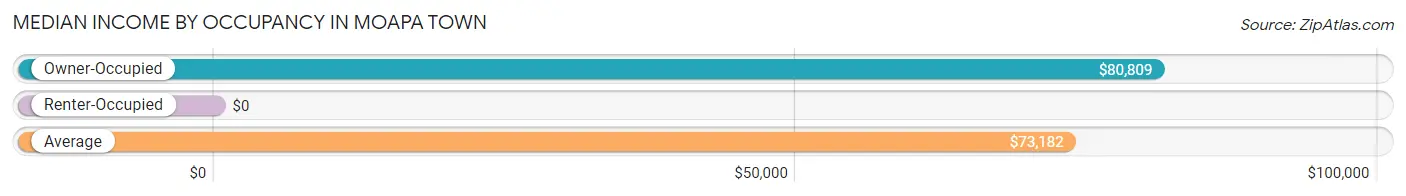
| Occupancy Type | # Households | Median Income |
| Owner-Occupied | 215 (77.9%) | $80,809 |
| Renter-Occupied | 61 (22.1%) | $0 |
| Average | 276 (100.0%) | $73,182 |
Occupancy by Householder Income Bracket in Moapa Town
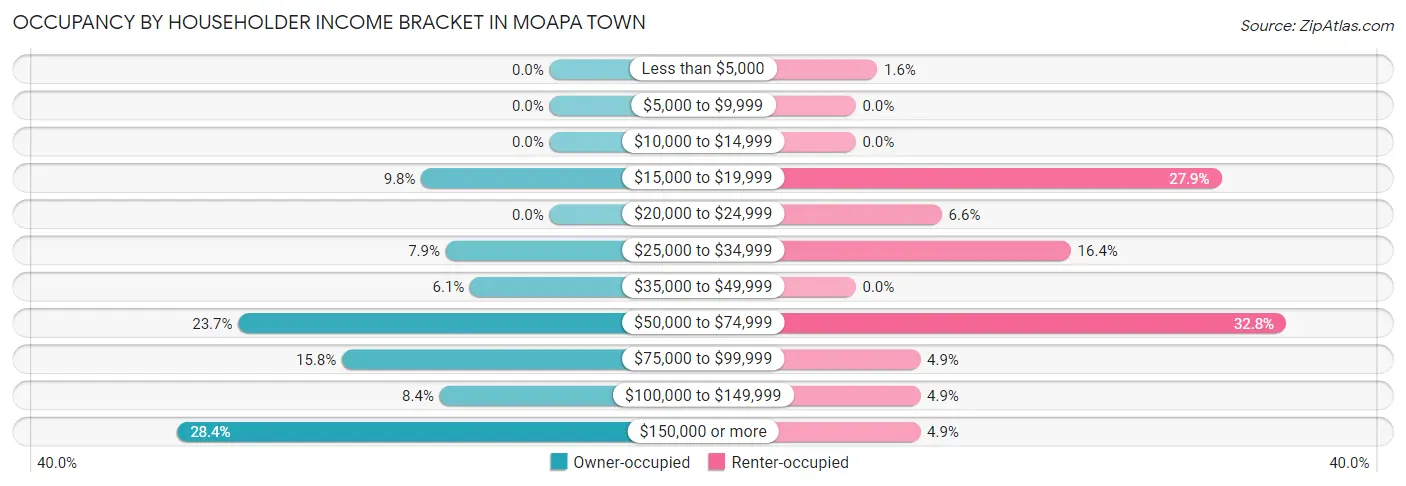
| Income Bracket | Owner-occupied | Renter-occupied |
| Less than $5,000 | 0 (0.0%) | 1 (1.6%) |
| $5,000 to $9,999 | 0 (0.0%) | 0 (0.0%) |
| $10,000 to $14,999 | 0 (0.0%) | 0 (0.0%) |
| $15,000 to $19,999 | 21 (9.8%) | 17 (27.9%) |
| $20,000 to $24,999 | 0 (0.0%) | 4 (6.6%) |
| $25,000 to $34,999 | 17 (7.9%) | 10 (16.4%) |
| $35,000 to $49,999 | 13 (6.0%) | 0 (0.0%) |
| $50,000 to $74,999 | 51 (23.7%) | 20 (32.8%) |
| $75,000 to $99,999 | 34 (15.8%) | 3 (4.9%) |
| $100,000 to $149,999 | 18 (8.4%) | 3 (4.9%) |
| $150,000 or more | 61 (28.4%) | 3 (4.9%) |
| Total | 215 (100.0%) | 61 (100.0%) |
Monthly Housing Cost Tiers in Moapa Town
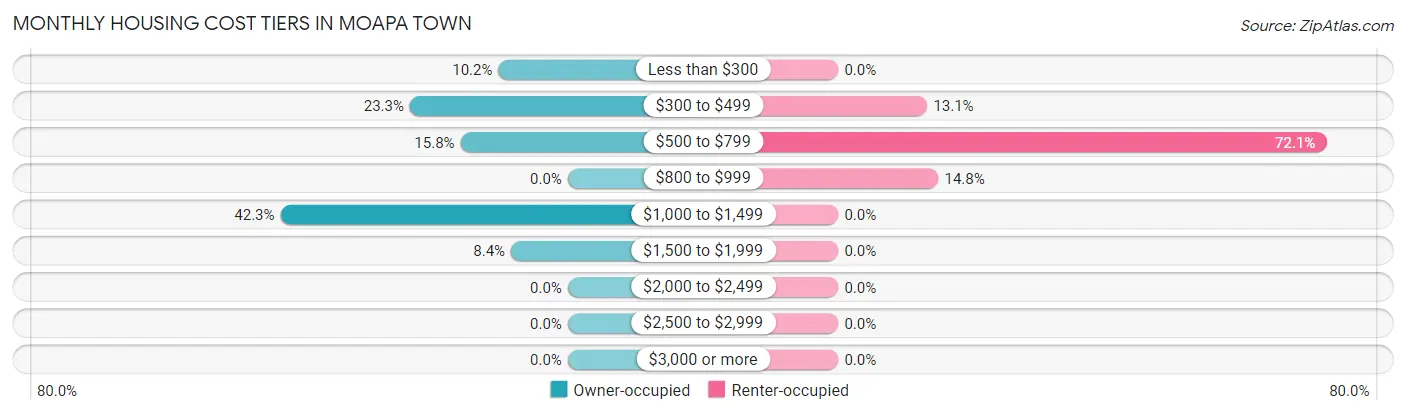
| Monthly Cost | Owner-occupied | Renter-occupied |
| Less than $300 | 22 (10.2%) | 0 (0.0%) |
| $300 to $499 | 50 (23.3%) | 8 (13.1%) |
| $500 to $799 | 34 (15.8%) | 44 (72.1%) |
| $800 to $999 | 0 (0.0%) | 9 (14.7%) |
| $1,000 to $1,499 | 91 (42.3%) | 0 (0.0%) |
| $1,500 to $1,999 | 18 (8.4%) | 0 (0.0%) |
| $2,000 to $2,499 | 0 (0.0%) | 0 (0.0%) |
| $2,500 to $2,999 | 0 (0.0%) | 0 (0.0%) |
| $3,000 or more | 0 (0.0%) | 0 (0.0%) |
| Total | 215 (100.0%) | 61 (100.0%) |
Physical Housing Characteristics in Moapa Town
Housing Structures in Moapa Town
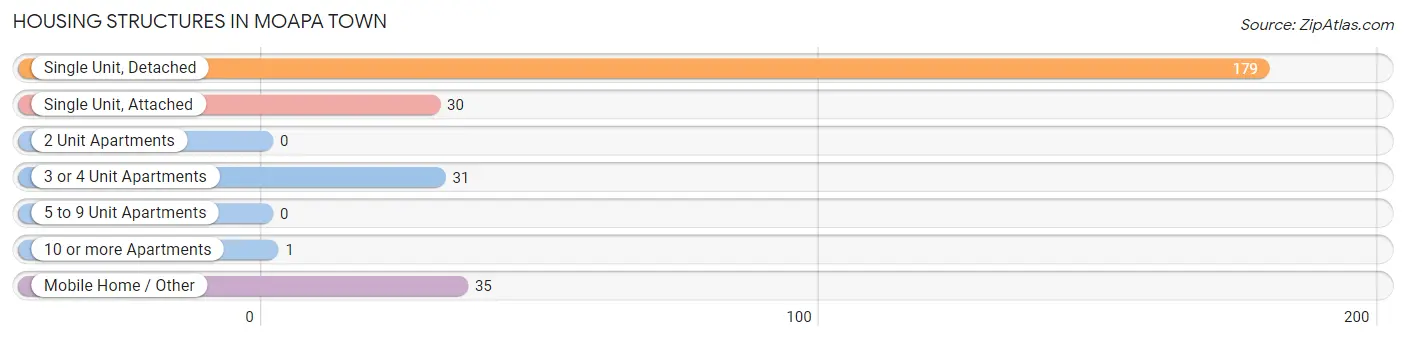
| Structure Type | # Housing Units | % Housing Units |
| Single Unit, Detached | 179 | 64.9% |
| Single Unit, Attached | 30 | 10.9% |
| 2 Unit Apartments | 0 | 0.0% |
| 3 or 4 Unit Apartments | 31 | 11.2% |
| 5 to 9 Unit Apartments | 0 | 0.0% |
| 10 or more Apartments | 1 | 0.4% |
| Mobile Home / Other | 35 | 12.7% |
| Total | 276 | 100.0% |
Housing Structures by Occupancy in Moapa Town
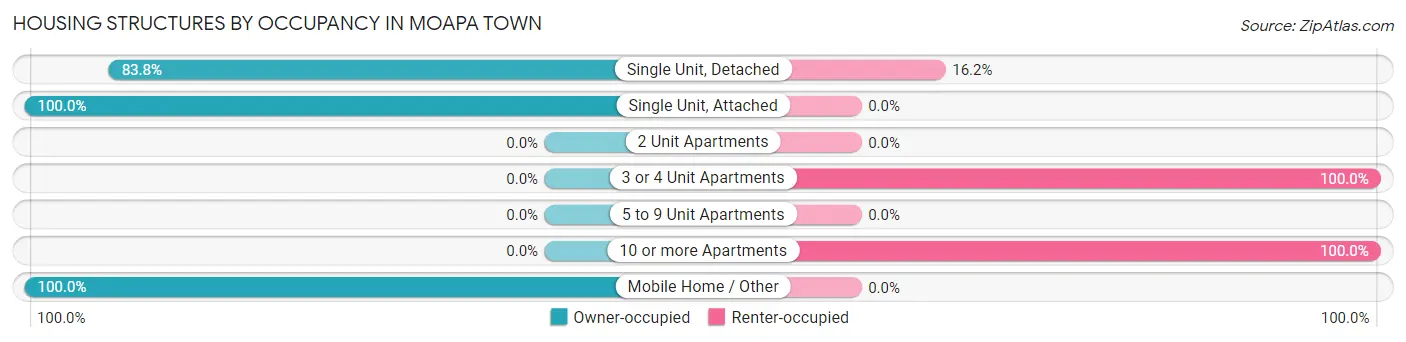
| Structure Type | Owner-occupied | Renter-occupied |
| Single Unit, Detached | 150 (83.8%) | 29 (16.2%) |
| Single Unit, Attached | 30 (100.0%) | 0 (0.0%) |
| 2 Unit Apartments | 0 (0.0%) | 0 (0.0%) |
| 3 or 4 Unit Apartments | 0 (0.0%) | 31 (100.0%) |
| 5 to 9 Unit Apartments | 0 (0.0%) | 0 (0.0%) |
| 10 or more Apartments | 0 (0.0%) | 1 (100.0%) |
| Mobile Home / Other | 35 (100.0%) | 0 (0.0%) |
| Total | 215 (77.9%) | 61 (22.1%) |
Housing Structures by Number of Rooms in Moapa Town
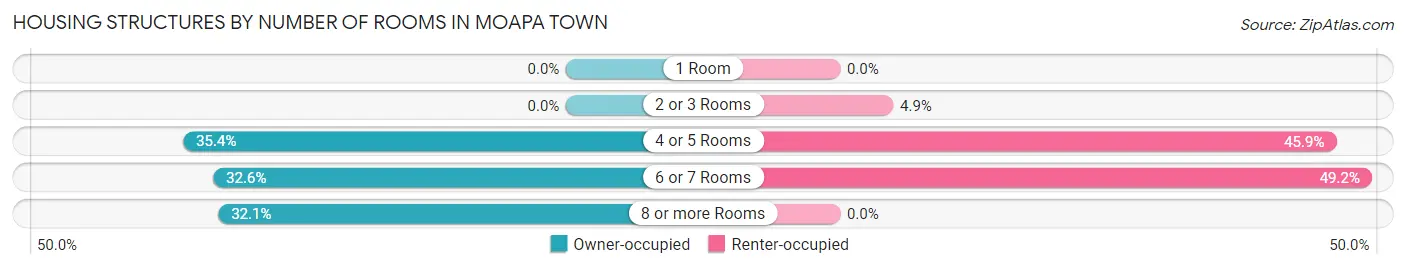
| Number of Rooms | Owner-occupied | Renter-occupied |
| 1 Room | 0 (0.0%) | 0 (0.0%) |
| 2 or 3 Rooms | 0 (0.0%) | 3 (4.9%) |
| 4 or 5 Rooms | 76 (35.3%) | 28 (45.9%) |
| 6 or 7 Rooms | 70 (32.6%) | 30 (49.2%) |
| 8 or more Rooms | 69 (32.1%) | 0 (0.0%) |
| Total | 215 (100.0%) | 61 (100.0%) |
Housing Structure by Heating Type in Moapa Town
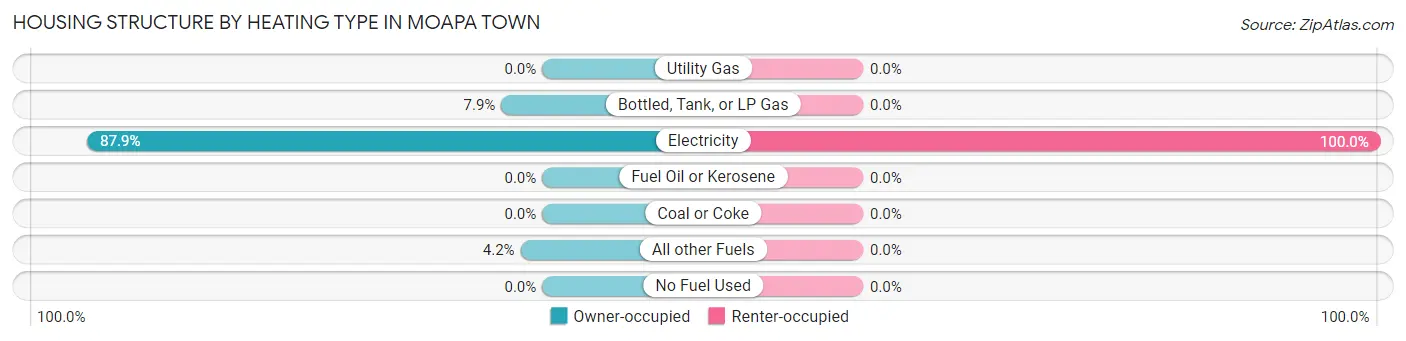
| Heating Type | Owner-occupied | Renter-occupied |
| Utility Gas | 0 (0.0%) | 0 (0.0%) |
| Bottled, Tank, or LP Gas | 17 (7.9%) | 0 (0.0%) |
| Electricity | 189 (87.9%) | 61 (100.0%) |
| Fuel Oil or Kerosene | 0 (0.0%) | 0 (0.0%) |
| Coal or Coke | 0 (0.0%) | 0 (0.0%) |
| All other Fuels | 9 (4.2%) | 0 (0.0%) |
| No Fuel Used | 0 (0.0%) | 0 (0.0%) |
| Total | 215 (100.0%) | 61 (100.0%) |
Household Vehicle Usage in Moapa Town
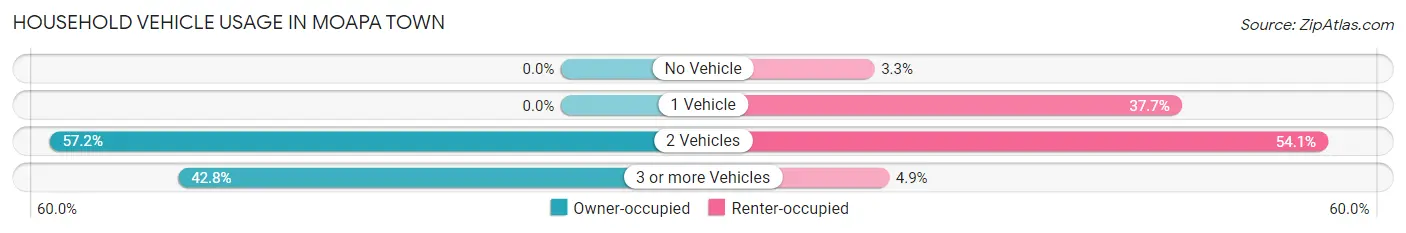
| Vehicles per Household | Owner-occupied | Renter-occupied |
| No Vehicle | 0 (0.0%) | 2 (3.3%) |
| 1 Vehicle | 0 (0.0%) | 23 (37.7%) |
| 2 Vehicles | 123 (57.2%) | 33 (54.1%) |
| 3 or more Vehicles | 92 (42.8%) | 3 (4.9%) |
| Total | 215 (100.0%) | 61 (100.0%) |
Real Estate & Mortgages in Moapa Town
Real Estate and Mortgage Overview in Moapa Town
| Characteristic | Without Mortgage | With Mortgage |
| Housing Units | 106 | 109 |
| Median Property Value | $232,400 | $357,700 |
| Median Household Income | - | - |
| Monthly Housing Costs | $366 | $0 |
| Real Estate Taxes | $1,145 | $0 |
Property Value by Mortgage Status in Moapa Town
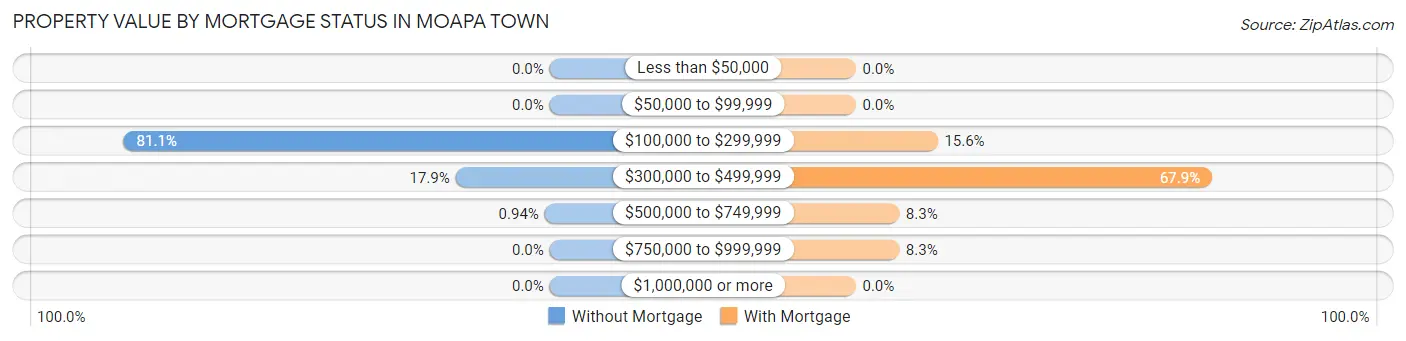
| Property Value | Without Mortgage | With Mortgage |
| Less than $50,000 | 0 (0.0%) | 0 (0.0%) |
| $50,000 to $99,999 | 0 (0.0%) | 0 (0.0%) |
| $100,000 to $299,999 | 86 (81.1%) | 17 (15.6%) |
| $300,000 to $499,999 | 19 (17.9%) | 74 (67.9%) |
| $500,000 to $749,999 | 1 (0.9%) | 9 (8.3%) |
| $750,000 to $999,999 | 0 (0.0%) | 9 (8.3%) |
| $1,000,000 or more | 0 (0.0%) | 0 (0.0%) |
| Total | 106 (100.0%) | 109 (100.0%) |
Household Income by Mortgage Status in Moapa Town
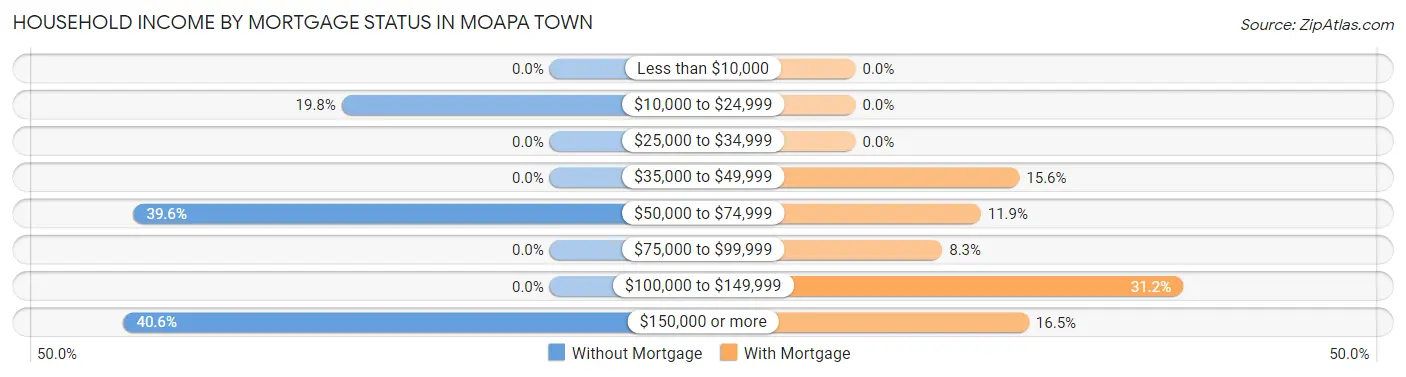
| Household Income | Without Mortgage | With Mortgage |
| Less than $10,000 | 0 (0.0%) | 0 (0.0%) |
| $10,000 to $24,999 | 21 (19.8%) | 0 (0.0%) |
| $25,000 to $34,999 | 0 (0.0%) | 0 (0.0%) |
| $35,000 to $49,999 | 0 (0.0%) | 17 (15.6%) |
| $50,000 to $74,999 | 42 (39.6%) | 13 (11.9%) |
| $75,000 to $99,999 | 0 (0.0%) | 9 (8.3%) |
| $100,000 to $149,999 | 0 (0.0%) | 34 (31.2%) |
| $150,000 or more | 43 (40.6%) | 18 (16.5%) |
| Total | 106 (100.0%) | 109 (100.0%) |
Property Value to Household Income Ratio in Moapa Town
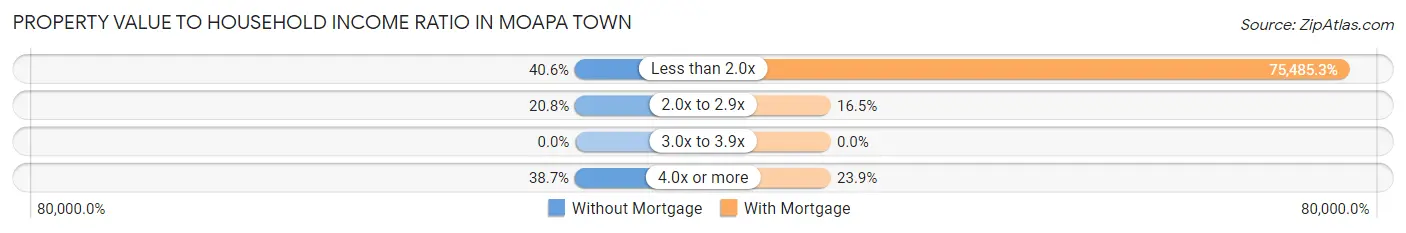
| Value-to-Income Ratio | Without Mortgage | With Mortgage |
| Less than 2.0x | 43 (40.6%) | 82,279 (75,485.3%) |
| 2.0x to 2.9x | 22 (20.7%) | 18 (16.5%) |
| 3.0x to 3.9x | 0 (0.0%) | 0 (0.0%) |
| 4.0x or more | 41 (38.7%) | 26 (23.8%) |
| Total | 106 (100.0%) | 109 (100.0%) |
Real Estate Taxes by Mortgage Status in Moapa Town
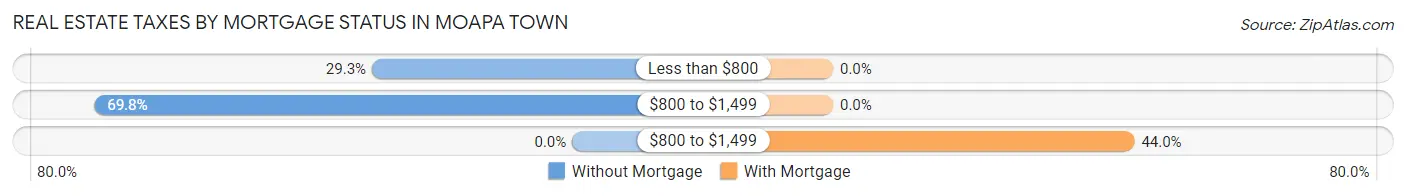
| Property Taxes | Without Mortgage | With Mortgage |
| Less than $800 | 31 (29.2%) | 0 (0.0%) |
| $800 to $1,499 | 74 (69.8%) | 0 (0.0%) |
| $800 to $1,499 | 0 (0.0%) | 48 (44.0%) |
| Total | 106 (100.0%) | 109 (100.0%) |
Health & Disability in Moapa Town
Health Insurance Coverage by Age in Moapa Town
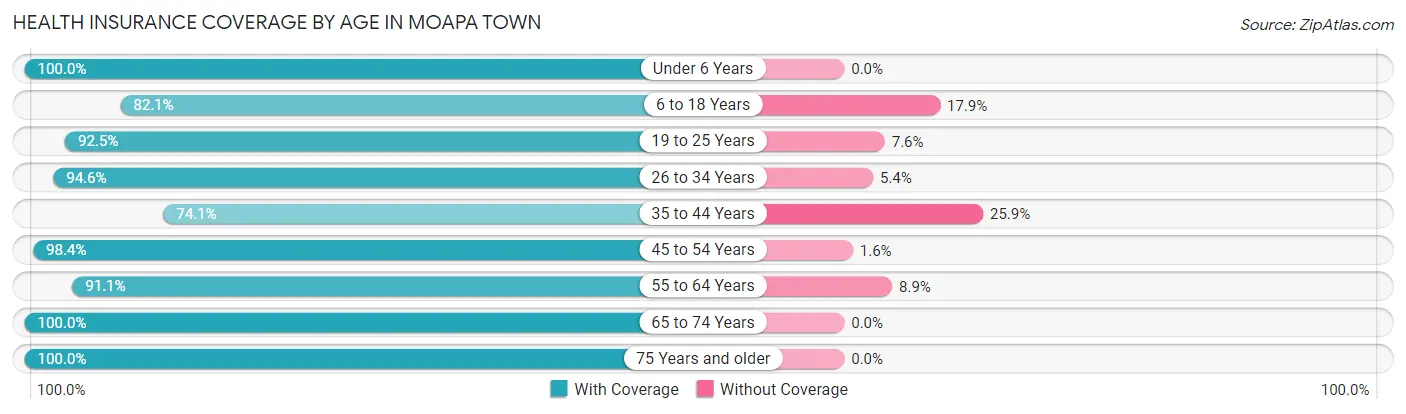
| Age Bracket | With Coverage | Without Coverage |
| Under 6 Years | 63 (100.0%) | 0 (0.0%) |
| 6 to 18 Years | 92 (82.1%) | 20 (17.9%) |
| 19 to 25 Years | 49 (92.4%) | 4 (7.5%) |
| 26 to 34 Years | 53 (94.6%) | 3 (5.4%) |
| 35 to 44 Years | 63 (74.1%) | 22 (25.9%) |
| 45 to 54 Years | 62 (98.4%) | 1 (1.6%) |
| 55 to 64 Years | 184 (91.1%) | 18 (8.9%) |
| 65 to 74 Years | 129 (100.0%) | 0 (0.0%) |
| 75 Years and older | 12 (100.0%) | 0 (0.0%) |
| Total | 707 (91.2%) | 68 (8.8%) |
Health Insurance Coverage by Citizenship Status in Moapa Town
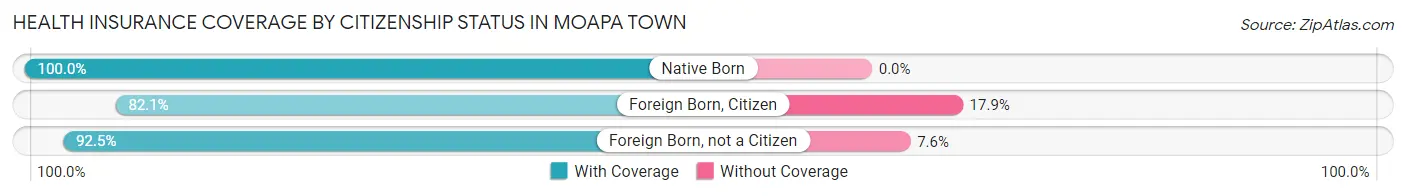
| Citizenship Status | With Coverage | Without Coverage |
| Native Born | 63 (100.0%) | 0 (0.0%) |
| Foreign Born, Citizen | 92 (82.1%) | 20 (17.9%) |
| Foreign Born, not a Citizen | 49 (92.4%) | 4 (7.5%) |
Health Insurance Coverage by Household Income in Moapa Town
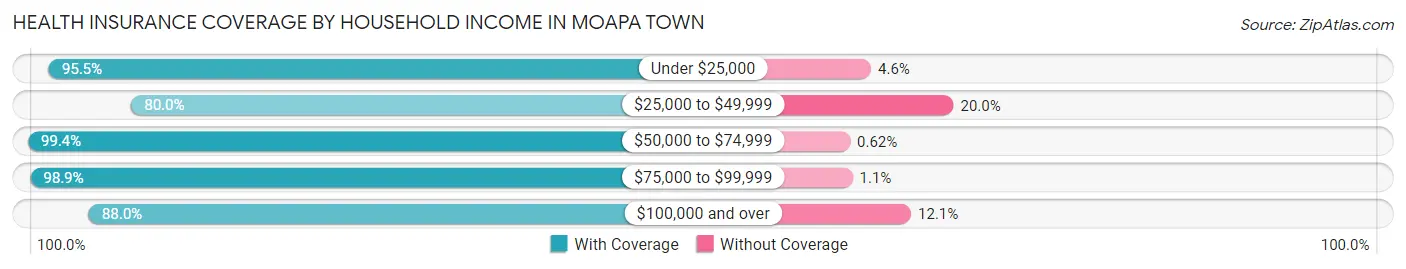
| Household Income | With Coverage | Without Coverage |
| Under $25,000 | 84 (95.5%) | 4 (4.5%) |
| $25,000 to $49,999 | 100 (80.0%) | 25 (20.0%) |
| $50,000 to $74,999 | 161 (99.4%) | 1 (0.6%) |
| $75,000 to $99,999 | 92 (98.9%) | 1 (1.1%) |
| $100,000 and over | 270 (87.9%) | 37 (12.0%) |
Public vs Private Health Insurance Coverage by Age in Moapa Town
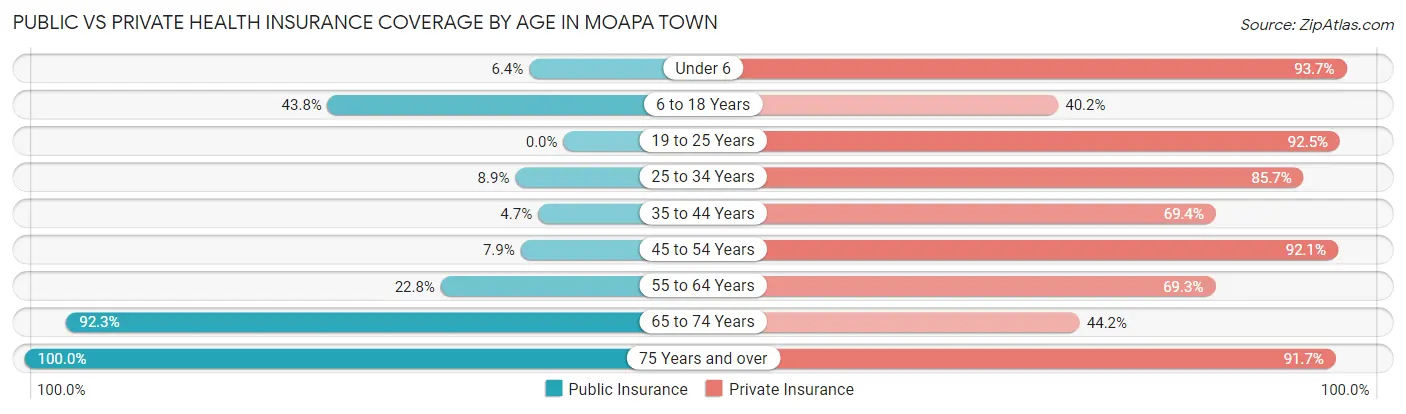
| Age Bracket | Public Insurance | Private Insurance |
| Under 6 | 4 (6.4%) | 59 (93.6%) |
| 6 to 18 Years | 49 (43.8%) | 45 (40.2%) |
| 19 to 25 Years | 0 (0.0%) | 49 (92.4%) |
| 25 to 34 Years | 5 (8.9%) | 48 (85.7%) |
| 35 to 44 Years | 4 (4.7%) | 59 (69.4%) |
| 45 to 54 Years | 5 (7.9%) | 58 (92.1%) |
| 55 to 64 Years | 46 (22.8%) | 140 (69.3%) |
| 65 to 74 Years | 119 (92.2%) | 57 (44.2%) |
| 75 Years and over | 12 (100.0%) | 11 (91.7%) |
| Total | 244 (31.5%) | 526 (67.9%) |
Disability Status by Sex by Age in Moapa Town
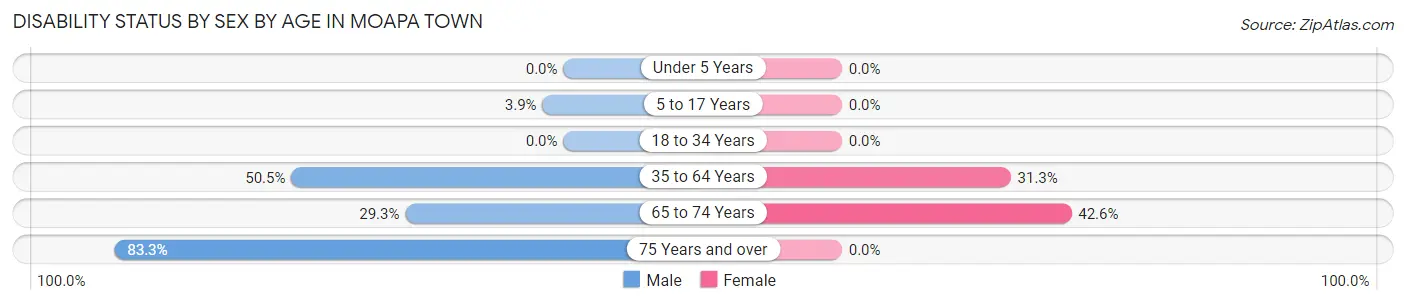
| Age Bracket | Male | Female |
| Under 5 Years | 0 (0.0%) | 0 (0.0%) |
| 5 to 17 Years | 4 (3.9%) | 0 (0.0%) |
| 18 to 34 Years | 0 (0.0%) | 0 (0.0%) |
| 35 to 64 Years | 101 (50.5%) | 47 (31.3%) |
| 65 to 74 Years | 22 (29.3%) | 23 (42.6%) |
| 75 Years and over | 10 (83.3%) | 0 (0.0%) |
Disability Class by Sex by Age in Moapa Town
Disability Class: Hearing Difficulty
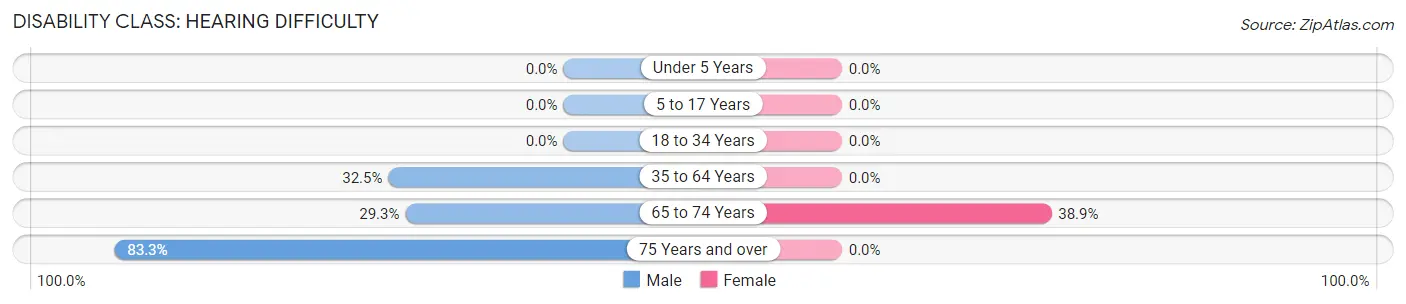
| Age Bracket | Male | Female |
| Under 5 Years | 0 (0.0%) | 0 (0.0%) |
| 5 to 17 Years | 0 (0.0%) | 0 (0.0%) |
| 18 to 34 Years | 0 (0.0%) | 0 (0.0%) |
| 35 to 64 Years | 65 (32.5%) | 0 (0.0%) |
| 65 to 74 Years | 22 (29.3%) | 21 (38.9%) |
| 75 Years and over | 10 (83.3%) | 0 (0.0%) |
Disability Class: Vision Difficulty
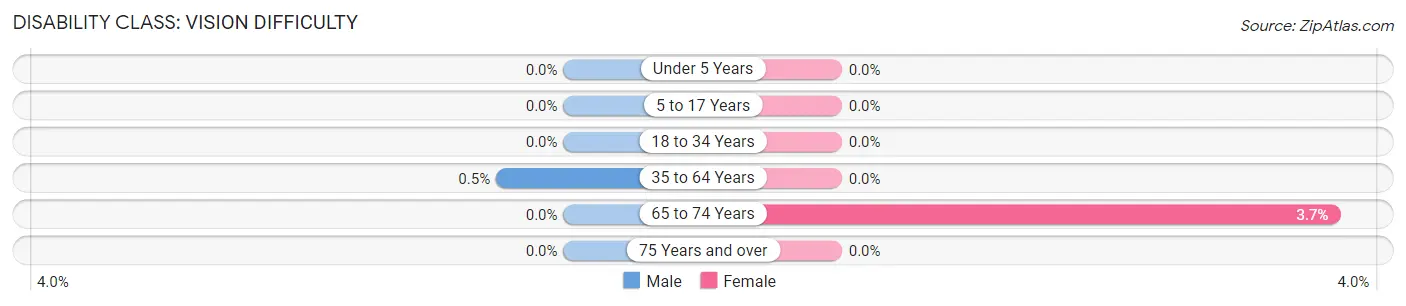
| Age Bracket | Male | Female |
| Under 5 Years | 0 (0.0%) | 0 (0.0%) |
| 5 to 17 Years | 0 (0.0%) | 0 (0.0%) |
| 18 to 34 Years | 0 (0.0%) | 0 (0.0%) |
| 35 to 64 Years | 1 (0.5%) | 0 (0.0%) |
| 65 to 74 Years | 0 (0.0%) | 2 (3.7%) |
| 75 Years and over | 0 (0.0%) | 0 (0.0%) |
Disability Class: Cognitive Difficulty
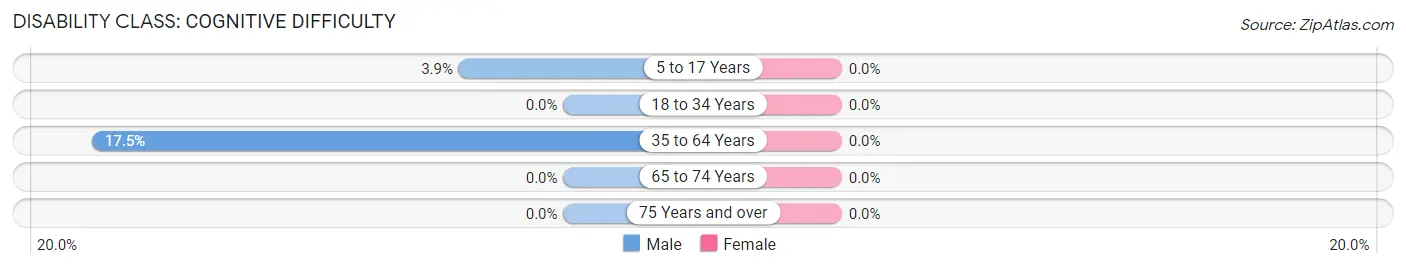
| Age Bracket | Male | Female |
| 5 to 17 Years | 4 (3.9%) | 0 (0.0%) |
| 18 to 34 Years | 0 (0.0%) | 0 (0.0%) |
| 35 to 64 Years | 35 (17.5%) | 0 (0.0%) |
| 65 to 74 Years | 0 (0.0%) | 0 (0.0%) |
| 75 Years and over | 0 (0.0%) | 0 (0.0%) |
Disability Class: Ambulatory Difficulty
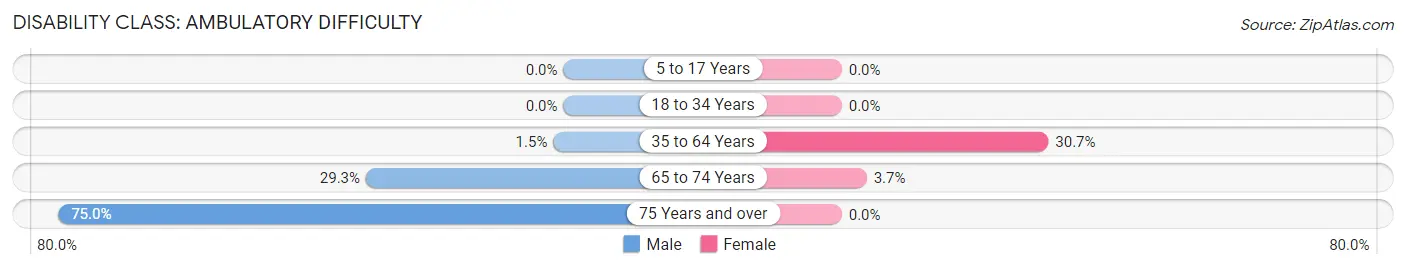
| Age Bracket | Male | Female |
| 5 to 17 Years | 0 (0.0%) | 0 (0.0%) |
| 18 to 34 Years | 0 (0.0%) | 0 (0.0%) |
| 35 to 64 Years | 3 (1.5%) | 46 (30.7%) |
| 65 to 74 Years | 22 (29.3%) | 2 (3.7%) |
| 75 Years and over | 9 (75.0%) | 0 (0.0%) |
Disability Class: Self-Care Difficulty
| Age Bracket | Male | Female |
| 5 to 17 Years | 0 (0.0%) | 0 (0.0%) |
| 18 to 34 Years | 0 (0.0%) | 0 (0.0%) |
| 35 to 64 Years | 0 (0.0%) | 0 (0.0%) |
| 65 to 74 Years | 0 (0.0%) | 0 (0.0%) |
| 75 Years and over | 0 (0.0%) | 0 (0.0%) |
Technology Access in Moapa Town
Computing Device Access in Moapa Town
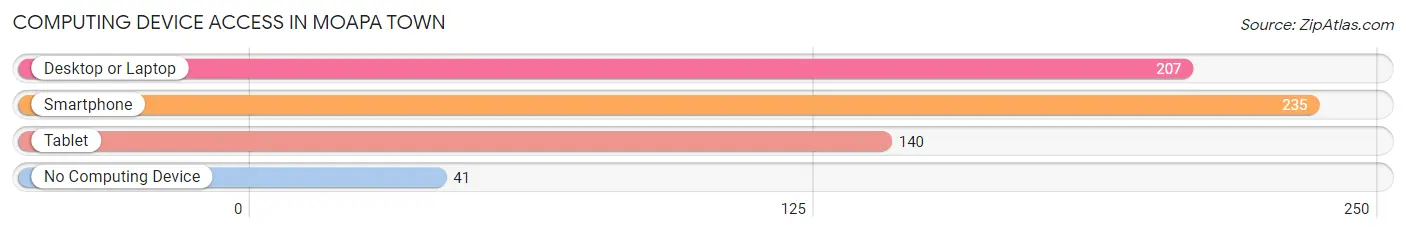
| Device Type | # Households | % Households |
| Desktop or Laptop | 207 | 75.0% |
| Smartphone | 235 | 85.1% |
| Tablet | 140 | 50.7% |
| No Computing Device | 41 | 14.9% |
| Total | 276 | 100.0% |
Internet Access in Moapa Town
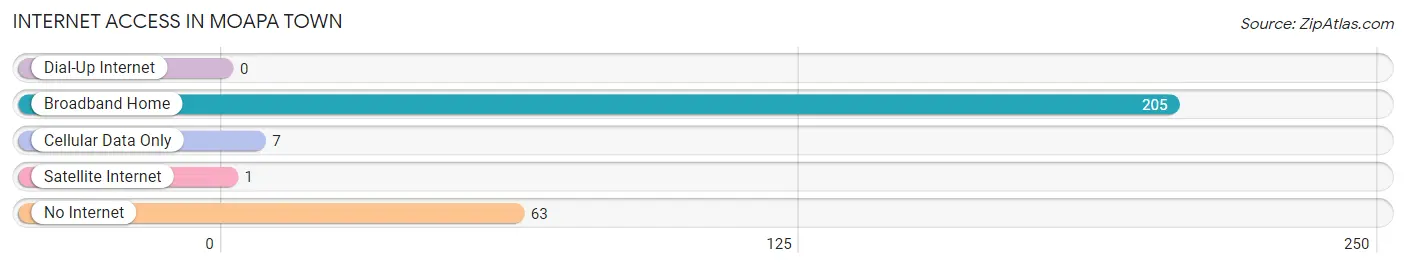
| Internet Type | # Households | % Households |
| Dial-Up Internet | 0 | 0.0% |
| Broadband Home | 205 | 74.3% |
| Cellular Data Only | 7 | 2.5% |
| Satellite Internet | 1 | 0.4% |
| No Internet | 63 | 22.8% |
| Total | 276 | 100.0% |
Moapa Town Summary
Moapa Town is a small town located in Clark County, Nevada, United States. It is situated on the Moapa River, about 40 miles northeast of Las Vegas. The town was founded in 1864 and is the oldest settlement in Clark County. As of the 2010 census, the population of Moapa Town was 1,025.
Geography
Moapa Town is located at 36°37'17" North, 114°41'17" West (36.6214, -114.6881). It is situated on the Moapa River, about 40 miles northeast of Las Vegas. The town has a total area of 0.6 square miles, all of which is land.
Climate
Moapa Town has a semi-arid climate, with hot summers and mild winters. The average annual temperature is 68°F, with an average high of 95°F in July and an average low of 41°F in January. The average annual precipitation is 4.5 inches, with the majority of it falling in the summer months.
Demographics
As of the 2010 census, there were 1,025 people, 327 households, and 246 families residing in Moapa Town. The population density was 1,717.5 people per square mile. The racial makeup of the town was 79.2% White, 0.7% African American, 0.7% Native American, 0.3% Asian, 0.1% Pacific Islander, 16.2% from other races, and 2.9% from two or more races. Hispanic or Latino of any race were 28.2% of the population.
Economy
Moapa Town is primarily a farming and ranching community. The town is home to several small businesses, including a grocery store, a gas station, and a few restaurants. The town also has a post office and a library.
The town is also home to the Moapa Valley National Wildlife Refuge, which is a popular destination for birdwatchers and other wildlife enthusiasts. The refuge is home to a variety of birds, mammals, reptiles, and amphibians.
The town is also home to the Moapa Valley Speedway, which hosts a variety of racing events throughout the year.
History
Moapa Town was founded in 1864 by Mormon settlers. The town was originally known as St. Thomas, but the name was changed to Moapa Town in 1871. The town was an important stop on the Pony Express route and was also a major stop on the Overland Stage Line.
In the early 1900s, the town was a major producer of alfalfa, cotton, and other crops. The town also had a large dairy industry.
In the 1950s, the town began to decline as the population shifted to larger cities. The town was revitalized in the 1970s when the Moapa Valley National Wildlife Refuge was established.
Today, Moapa Town is a small, rural community with a population of just over 1,000 people. The town is home to a variety of small businesses and is a popular destination for birdwatchers and other wildlife enthusiasts.
Common Questions
What is Per Capita Income in Moapa Town?
Per Capita income in Moapa Town is $41,020.
What is the Median Family Income in Moapa Town?
Median Family Income in Moapa Town is $74,830.
What is the Median Household income in Moapa Town?
Median Household Income in Moapa Town is $73,182.
What is Income or Wage Gap in Moapa Town?
Income or Wage Gap in Moapa Town is 15.4%.
Women in Moapa Town earn 84.6 cents for every dollar earned by a man.
What is Inequality or Gini Index in Moapa Town?
Inequality or Gini Index in Moapa Town is 0.45.
What is the Total Population of Moapa Town?
Total Population of Moapa Town is 775.
What is the Total Male Population of Moapa Town?
Total Male Population of Moapa Town is 474.
What is the Total Female Population of Moapa Town?
Total Female Population of Moapa Town is 301.
What is the Ratio of Males per 100 Females in Moapa Town?
There are 157.48 Males per 100 Females in Moapa Town.
What is the Ratio of Females per 100 Males in Moapa Town?
There are 63.50 Females per 100 Males in Moapa Town.
What is the Median Population Age in Moapa Town?
Median Population Age in Moapa Town is 46.9 Years.
What is the Average Family Size in Moapa Town
Average Family Size in Moapa Town is 3.1 People.
What is the Average Household Size in Moapa Town
Average Household Size in Moapa Town is 2.8 People.
How Large is the Labor Force in Moapa Town?
There are 325 People in the Labor Forcein in Moapa Town.
What is the Percentage of People in the Labor Force in Moapa Town?
53.8% of People are in the Labor Force in Moapa Town.
What is the Unemployment Rate in Moapa Town?
Unemployment Rate in Moapa Town is 3.4%.