Double Spring, NV Map & Demographics
Double Spring Map
Double Spring Overview
$36,164
PER CAPITA INCOME
$101,875
AVG FAMILY INCOME
$100,417
AVG HOUSEHOLD INCOME
21.5%
WAGE / INCOME GAP [ % ]
78.5¢/ $1
WAGE / INCOME GAP [ $ ]
0.34
INEQUALITY / GINI INDEX
276
TOTAL POPULATION
107
MALE POPULATION
169
FEMALE POPULATION
63.31
MALES / 100 FEMALES
157.94
FEMALES / 100 MALES
30.0
MEDIAN AGE
4.3
AVG FAMILY SIZE
4.1
AVG HOUSEHOLD SIZE
87
LABOR FORCE [ PEOPLE ]
51.2%
PERCENT IN LABOR FORCE
13.8%
UNEMPLOYMENT RATE
Income in Double Spring
Income Overview in Double Spring
Per Capita Income in Double Spring is $36,164, while median incomes of families and households are $101,875 and $100,417 respectively.
| Characteristic | Number | Measure |
| Per Capita Income | 276 | $36,164 |
| Median Family Income | 57 | $101,875 |
| Mean Family Income | 57 | $129,084 |
| Median Household Income | 68 | $100,417 |
| Mean Household Income | 68 | $121,790 |
| Income Deficit | 57 | $0 |
| Wage / Income Gap (%) | 276 | 21.49% |
| Wage / Income Gap ($) | 276 | 78.51¢ per $1 |
| Gini / Inequality Index | 276 | 0.34 |
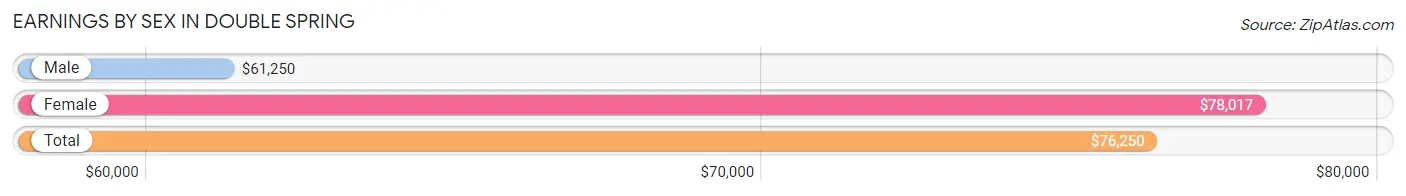
Earnings by Sex in Double Spring
Average Earnings in Double Spring are $76,250, $61,250 for men and $78,017 for women, a difference of 21.5%.
| Sex | Number | Average Earnings |
| Male | 36 (41.9%) | $61,250 |
| Female | 50 (58.1%) | $78,017 |
| Total | 86 (100.0%) | $76,250 |
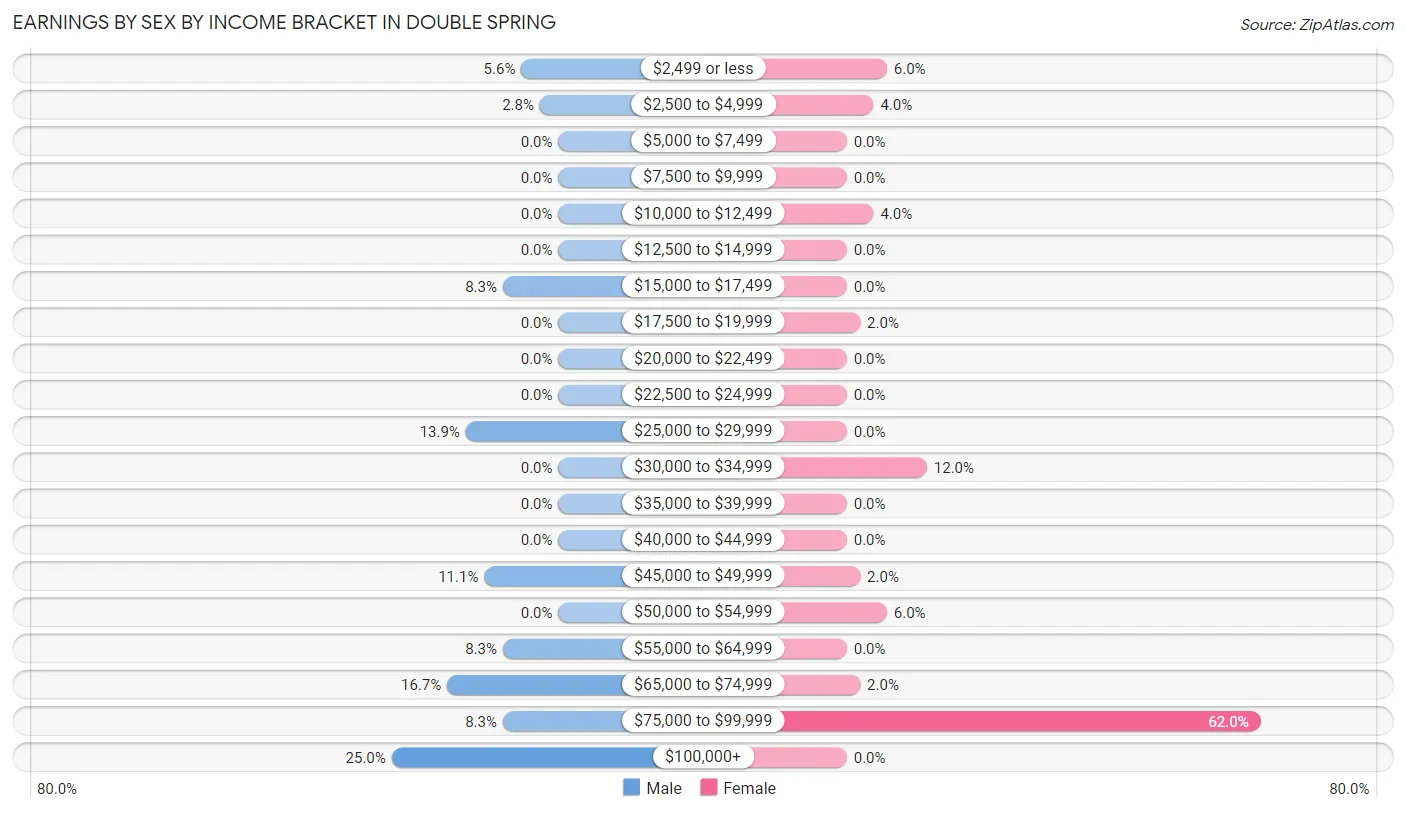
Earnings by Sex by Income Bracket in Double Spring
The most common earnings brackets in Double Spring are $100,000+ for men (9 | 25.0%) and $75,000 to $99,999 for women (31 | 62.0%).
| Income | Male | Female |
| $2,499 or less | 2 (5.6%) | 3 (6.0%) |
| $2,500 to $4,999 | 1 (2.8%) | 2 (4.0%) |
| $5,000 to $7,499 | 0 (0.0%) | 0 (0.0%) |
| $7,500 to $9,999 | 0 (0.0%) | 0 (0.0%) |
| $10,000 to $12,499 | 0 (0.0%) | 2 (4.0%) |
| $12,500 to $14,999 | 0 (0.0%) | 0 (0.0%) |
| $15,000 to $17,499 | 3 (8.3%) | 0 (0.0%) |
| $17,500 to $19,999 | 0 (0.0%) | 1 (2.0%) |
| $20,000 to $22,499 | 0 (0.0%) | 0 (0.0%) |
| $22,500 to $24,999 | 0 (0.0%) | 0 (0.0%) |
| $25,000 to $29,999 | 5 (13.9%) | 0 (0.0%) |
| $30,000 to $34,999 | 0 (0.0%) | 6 (12.0%) |
| $35,000 to $39,999 | 0 (0.0%) | 0 (0.0%) |
| $40,000 to $44,999 | 0 (0.0%) | 0 (0.0%) |
| $45,000 to $49,999 | 4 (11.1%) | 1 (2.0%) |
| $50,000 to $54,999 | 0 (0.0%) | 3 (6.0%) |
| $55,000 to $64,999 | 3 (8.3%) | 0 (0.0%) |
| $65,000 to $74,999 | 6 (16.7%) | 1 (2.0%) |
| $75,000 to $99,999 | 3 (8.3%) | 31 (62.0%) |
| $100,000+ | 9 (25.0%) | 0 (0.0%) |
| Total | 36 (100.0%) | 50 (100.0%) |
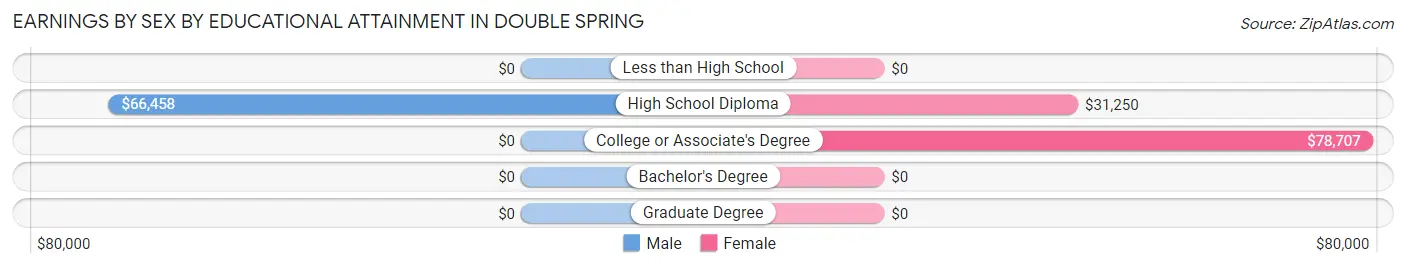
Earnings by Sex by Educational Attainment in Double Spring
Average earnings in Double Spring are $65,833 for men and $78,319 for women, a difference of 15.9%. Men with an educational attainment of high school diploma enjoy the highest average annual earnings of $66,458, while those with high school diploma education earn the least with $66,458. Women with an educational attainment of college or associate's degree earn the most with the average annual earnings of $78,707, while those with high school diploma education have the smallest earnings of $31,250.
| Educational Attainment | Male Income | Female Income |
| Less than High School | - | - |
| High School Diploma | $66,458 | $31,250 |
| College or Associate's Degree | - | - |
| Bachelor's Degree | - | - |
| Graduate Degree | - | - |
| Total | $65,833 | $78,319 |
Family Income in Double Spring
Family Income Brackets in Double Spring
According to the Double Spring family income data, there are 17 families falling into the $100,000 to $149,999 income range, which is the most common income bracket and makes up 29.8% of all families.
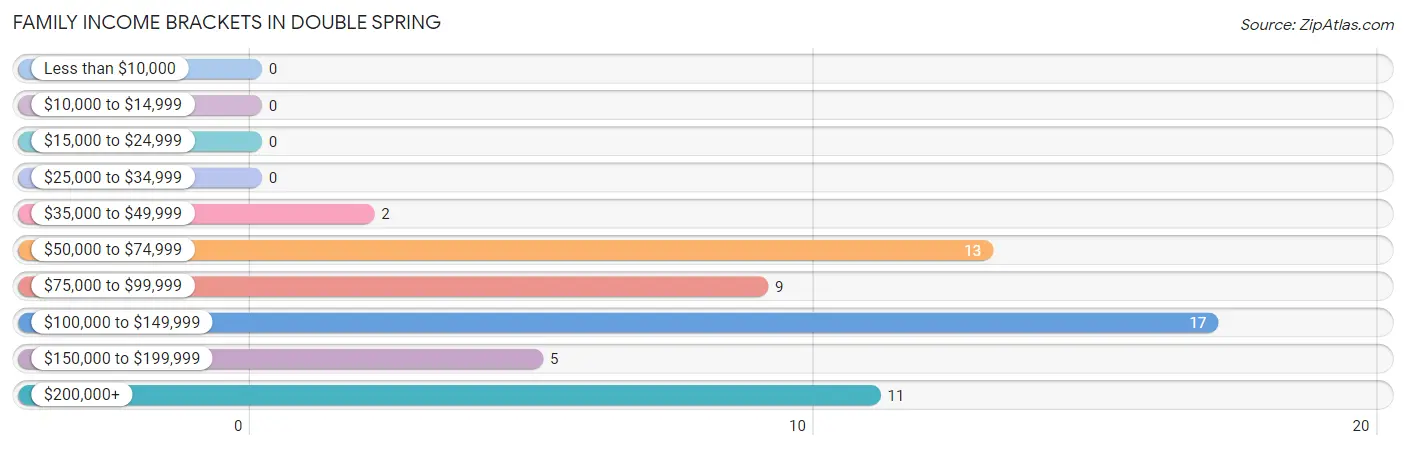
| Income Bracket | # Families | % Families |
| Less than $10,000 | 0 | 0.0% |
| $10,000 to $14,999 | 0 | 0.0% |
| $15,000 to $24,999 | 0 | 0.0% |
| $25,000 to $34,999 | 0 | 0.0% |
| $35,000 to $49,999 | 2 | 3.5% |
| $50,000 to $74,999 | 13 | 22.8% |
| $75,000 to $99,999 | 9 | 15.8% |
| $100,000 to $149,999 | 17 | 29.8% |
| $150,000 to $199,999 | 5 | 8.8% |
| $200,000+ | 11 | 19.3% |
Family Income by Famaliy Size in Double Spring
2-person families (39 | 68.4%) account for the highest median family income in Double Spring with $101,042 per family, while 2-person families (39 | 68.4%) have the highest median income of $50,521 per family member.
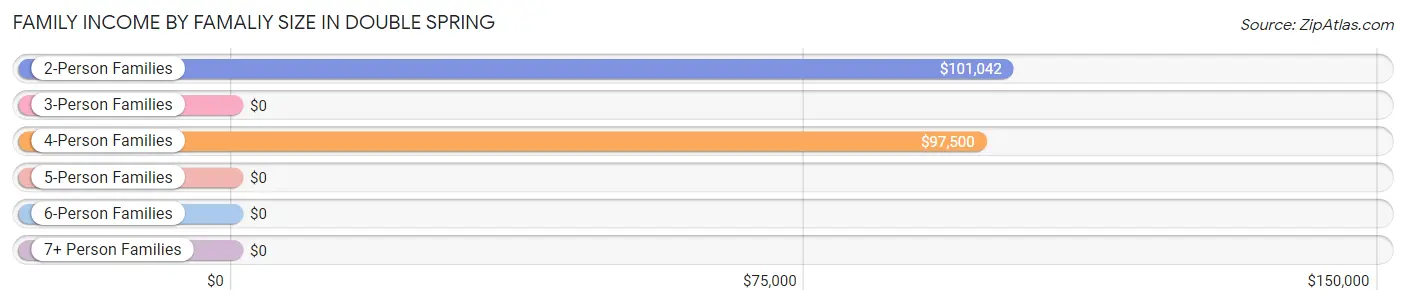
| Income Bracket | # Families | Median Income |
| 2-Person Families | 39 (68.4%) | $101,042 |
| 3-Person Families | 2 (3.5%) | $0 |
| 4-Person Families | 6 (10.5%) | $97,500 |
| 5-Person Families | 2 (3.5%) | $0 |
| 6-Person Families | 7 (12.3%) | $0 |
| 7+ Person Families | 1 (1.8%) | $0 |
| Total | 57 (100.0%) | $101,875 |
Family Income by Number of Earners in Double Spring
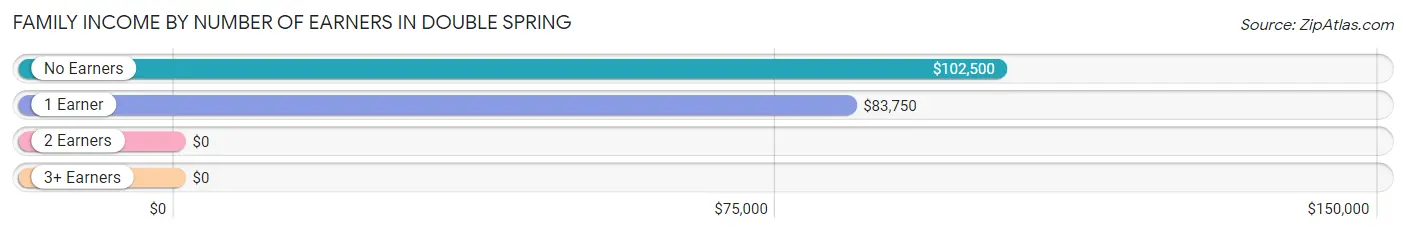
| Number of Earners | # Families | Median Income |
| No Earners | 20 (35.1%) | $102,500 |
| 1 Earner | 23 (40.4%) | $83,750 |
| 2 Earners | 14 (24.6%) | $0 |
| 3+ Earners | 0 (0.0%) | $0 |
| Total | 57 (100.0%) | $101,875 |
Household Income in Double Spring
Household Income Brackets in Double Spring
With 15 households falling in the category, the $75,000 to $99,999 income range is the most frequent in Double Spring, accounting for 22.1% of all households.
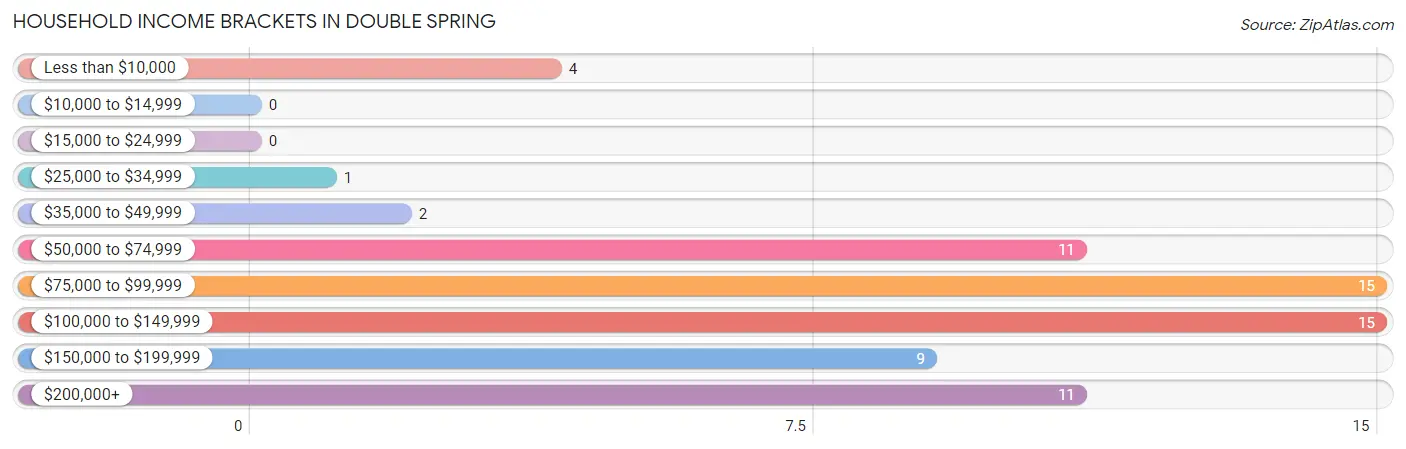
| Income Bracket | # Households | % Households |
| Less than $10,000 | 4 | 5.9% |
| $10,000 to $14,999 | 0 | 0.0% |
| $15,000 to $24,999 | 0 | 0.0% |
| $25,000 to $34,999 | 1 | 1.5% |
| $35,000 to $49,999 | 2 | 2.9% |
| $50,000 to $74,999 | 11 | 16.2% |
| $75,000 to $99,999 | 15 | 22.1% |
| $100,000 to $149,999 | 15 | 22.1% |
| $150,000 to $199,999 | 9 | 13.2% |
| $200,000+ | 11 | 16.2% |
Household Income by Householder Age in Double Spring
The median household income in Double Spring is $100,417, with the highest median household income of $141,250 found in the 45 to 64 years age bracket for the primary householder. A total of 15 households (22.1%) fall into this category.
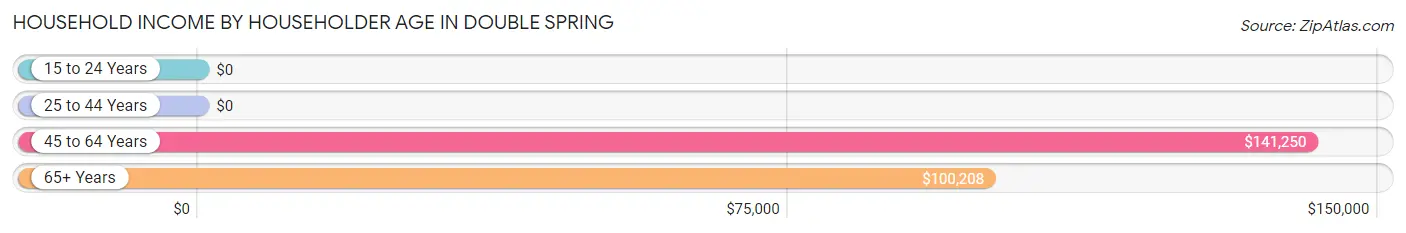
| Income Bracket | # Households | Median Income |
| 15 to 24 Years | 0 (0.0%) | $0 |
| 25 to 44 Years | 16 (23.5%) | $0 |
| 45 to 64 Years | 15 (22.1%) | $141,250 |
| 65+ Years | 37 (54.4%) | $100,208 |
| Total | 68 (100.0%) | $100,417 |
Poverty in Double Spring
Income Below Poverty by Sex and Age in Double Spring
With 2.0% poverty level for males and 3.5% for females among the residents of Double Spring, 55 to 64 year old males and 75 year old and over females are the most vulnerable to poverty, with 2 males (14.3%) and 2 females (66.7%) in their respective age groups living below the poverty level.
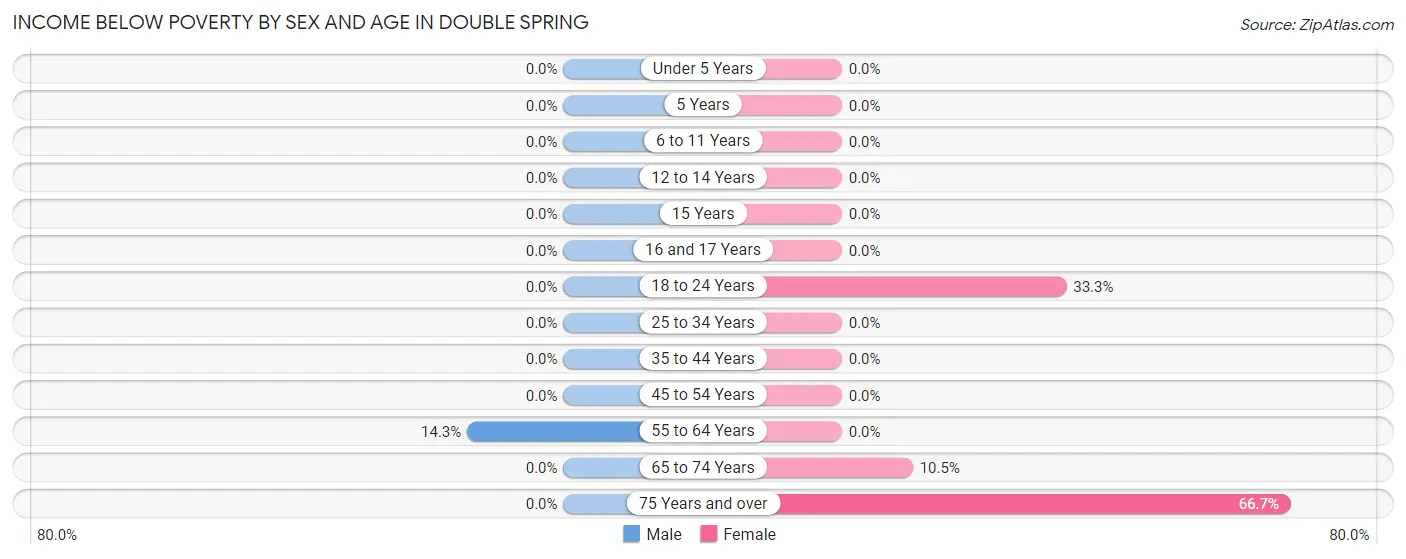
| Age Bracket | Male | Female |
| Under 5 Years | 0 (0.0%) | 0 (0.0%) |
| 5 Years | 0 (0.0%) | 0 (0.0%) |
| 6 to 11 Years | 0 (0.0%) | 0 (0.0%) |
| 12 to 14 Years | 0 (0.0%) | 0 (0.0%) |
| 15 Years | 0 (0.0%) | 0 (0.0%) |
| 16 and 17 Years | 0 (0.0%) | 0 (0.0%) |
| 18 to 24 Years | 0 (0.0%) | 2 (33.3%) |
| 25 to 34 Years | 0 (0.0%) | 0 (0.0%) |
| 35 to 44 Years | 0 (0.0%) | 0 (0.0%) |
| 45 to 54 Years | 0 (0.0%) | 0 (0.0%) |
| 55 to 64 Years | 2 (14.3%) | 0 (0.0%) |
| 65 to 74 Years | 0 (0.0%) | 2 (10.5%) |
| 75 Years and over | 0 (0.0%) | 2 (66.7%) |
| Total | 2 (2.0%) | 6 (3.5%) |
Income Above Poverty by Sex and Age in Double Spring
According to the poverty statistics in Double Spring, males aged under 5 years and females aged under 5 years are the age groups that are most secure financially, with 100.0% of males and 100.0% of females in these age groups living above the poverty line.
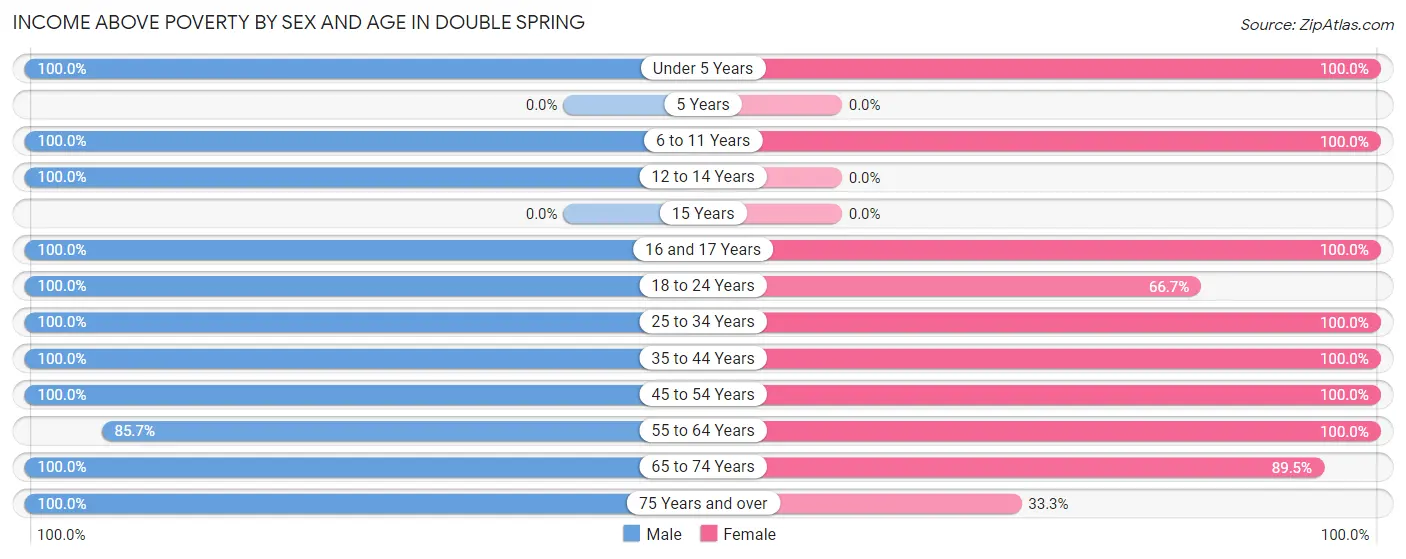
| Age Bracket | Male | Female |
| Under 5 Years | 5 (100.0%) | 2 (100.0%) |
| 5 Years | 0 (0.0%) | 0 (0.0%) |
| 6 to 11 Years | 9 (100.0%) | 74 (100.0%) |
| 12 to 14 Years | 11 (100.0%) | 0 (0.0%) |
| 15 Years | 0 (0.0%) | 0 (0.0%) |
| 16 and 17 Years | 2 (100.0%) | 7 (100.0%) |
| 18 to 24 Years | 5 (100.0%) | 4 (66.7%) |
| 25 to 34 Years | 9 (100.0%) | 37 (100.0%) |
| 35 to 44 Years | 11 (100.0%) | 3 (100.0%) |
| 45 to 54 Years | 2 (100.0%) | 3 (100.0%) |
| 55 to 64 Years | 12 (85.7%) | 15 (100.0%) |
| 65 to 74 Years | 28 (100.0%) | 17 (89.5%) |
| 75 Years and over | 6 (100.0%) | 1 (33.3%) |
| Total | 100 (98.0%) | 163 (96.5%) |
Income Below Poverty Among Married-Couple Families in Double Spring
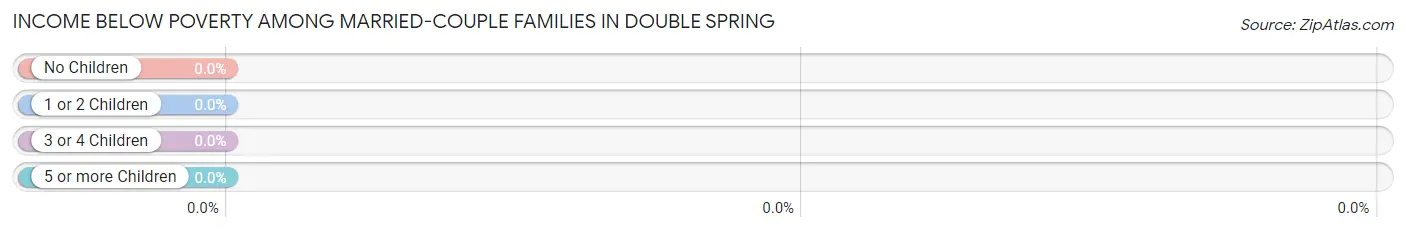
| Children | Above Poverty | Below Poverty |
| No Children | 32 (100.0%) | 0 (0.0%) |
| 1 or 2 Children | 5 (100.0%) | 0 (0.0%) |
| 3 or 4 Children | 9 (100.0%) | 0 (0.0%) |
| 5 or more Children | 1 (100.0%) | 0 (0.0%) |
| Total | 47 (100.0%) | 0 (0.0%) |
Income Below Poverty Among Single-Parent Households in Double Spring
| Children | Single Father | Single Mother |
| No Children | 0 (0.0%) | 0 (0.0%) |
| 1 or 2 Children | 0 (0.0%) | 0 (0.0%) |
| 3 or 4 Children | 0 (0.0%) | 0 (0.0%) |
| 5 or more Children | 0 (0.0%) | 0 (0.0%) |
| Total | 0 (0.0%) | 0 (0.0%) |
Income Below Poverty Among Married-Couple vs Single-Parent Households in Double Spring
| Children | Married-Couple Families | Single-Parent Households |
| No Children | 0 (0.0%) | 0 (0.0%) |
| 1 or 2 Children | 0 (0.0%) | 0 (0.0%) |
| 3 or 4 Children | 0 (0.0%) | 0 (0.0%) |
| 5 or more Children | 0 (0.0%) | 0 (0.0%) |
| Total | 0 (0.0%) | 0 (0.0%) |
Race in Double Spring
The most populous races in Double Spring are White / Caucasian (207 | 75.0%), Two or more Races (68 | 24.6%), and Asian (1 | 0.4%).
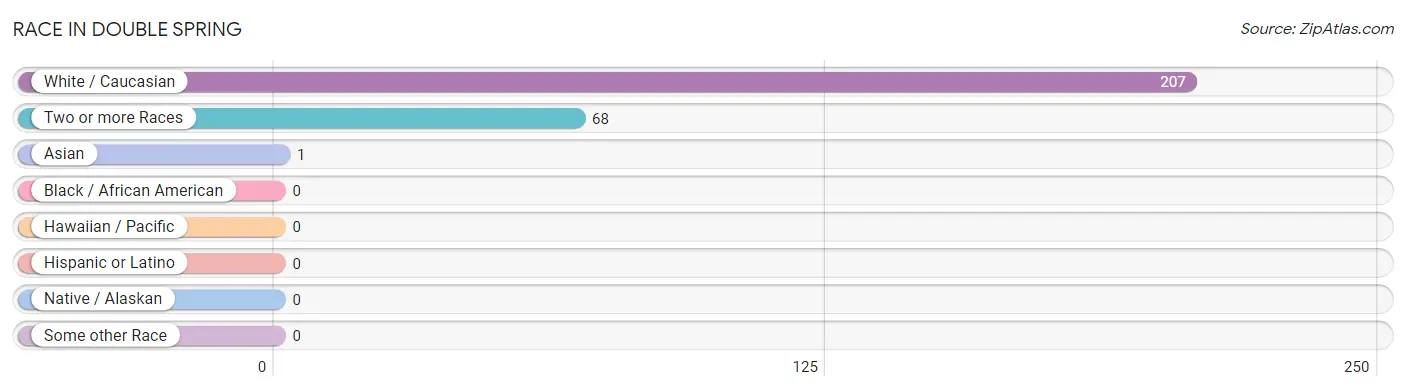
| Race | # Population | % Population |
| Asian | 1 | 0.4% |
| Black / African American | 0 | 0.0% |
| Hawaiian / Pacific | 0 | 0.0% |
| Hispanic or Latino | 0 | 0.0% |
| Native / Alaskan | 0 | 0.0% |
| White / Caucasian | 207 | 75.0% |
| Two or more Races | 68 | 24.6% |
| Some other Race | 0 | 0.0% |
| Total | 276 | 100.0% |
Ancestry in Double Spring
The most populous ancestries reported in Double Spring are Norwegian (116 | 42.0%), German (34 | 12.3%), Irish (11 | 4.0%), American (8 | 2.9%), and Dutch (8 | 2.9%), together accounting for 64.1% of all Double Spring residents.
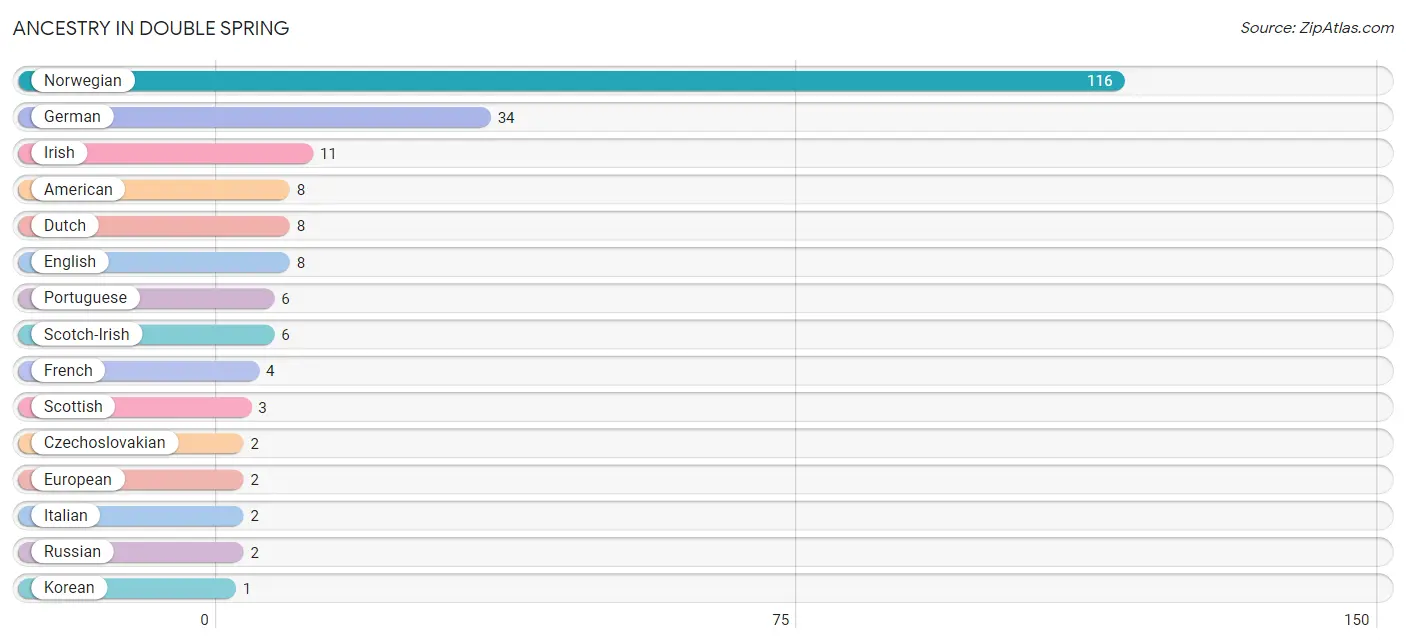
| Ancestry | # Population | % Population |
| American | 8 | 2.9% |
| Czechoslovakian | 2 | 0.7% |
| Dutch | 8 | 2.9% |
| English | 8 | 2.9% |
| European | 2 | 0.7% |
| French | 4 | 1.5% |
| German | 34 | 12.3% |
| Irish | 11 | 4.0% |
| Italian | 2 | 0.7% |
| Korean | 1 | 0.4% |
| Norwegian | 116 | 42.0% |
| Portuguese | 6 | 2.2% |
| Russian | 2 | 0.7% |
| Scandinavian | 1 | 0.4% |
| Scotch-Irish | 6 | 2.2% |
| Scottish | 3 | 1.1% | View All 16 Rows |
Immigrants in Double Spring
The most numerous immigrant groups reported in Double Spring came from Europe (3 | 1.1%), Eastern Europe (2 | 0.7%), Asia (1 | 0.4%), England (1 | 0.4%), and Northern Europe (1 | 0.4%), together accounting for 2.9% of all Double Spring residents.
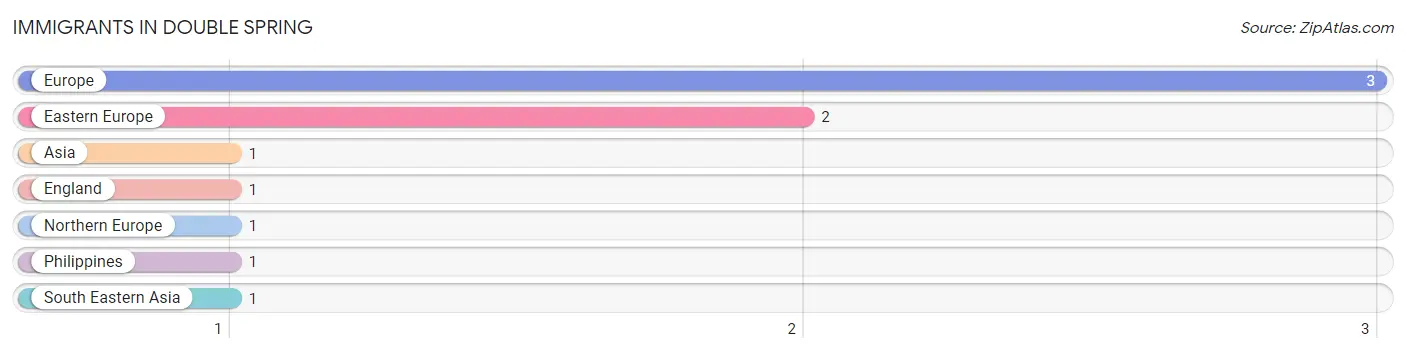
| Immigration Origin | # Population | % Population |
| Asia | 1 | 0.4% |
| Eastern Europe | 2 | 0.7% |
| England | 1 | 0.4% |
| Europe | 3 | 1.1% |
| Northern Europe | 1 | 0.4% |
| Philippines | 1 | 0.4% |
| South Eastern Asia | 1 | 0.4% | View All 7 Rows |
Sex and Age in Double Spring
Sex and Age in Double Spring
The most populous age groups in Double Spring are 65 to 69 Years (22 | 20.6%) for men and 10 to 14 Years (63 | 37.3%) for women.
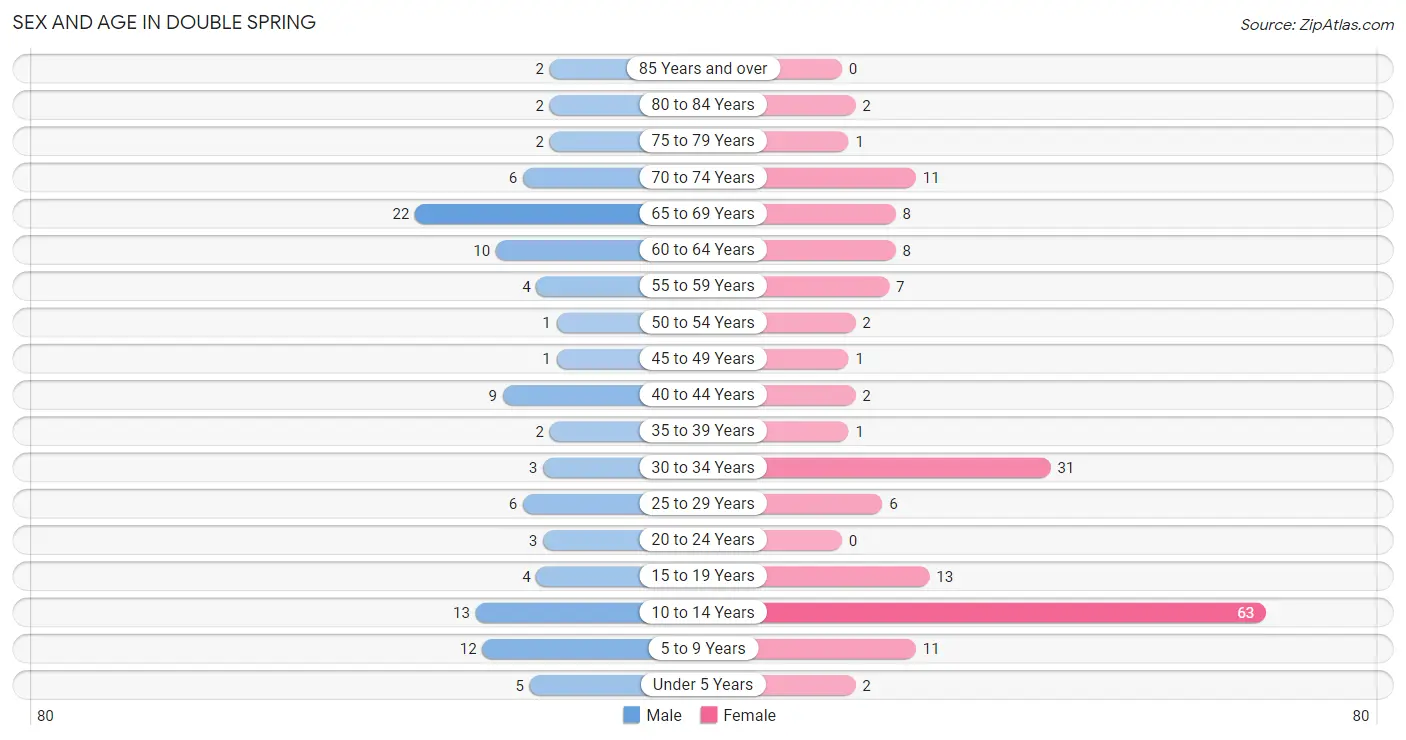
| Age Bracket | Male | Female |
| Under 5 Years | 5 (4.7%) | 2 (1.2%) |
| 5 to 9 Years | 12 (11.2%) | 11 (6.5%) |
| 10 to 14 Years | 13 (12.1%) | 63 (37.3%) |
| 15 to 19 Years | 4 (3.7%) | 13 (7.7%) |
| 20 to 24 Years | 3 (2.8%) | 0 (0.0%) |
| 25 to 29 Years | 6 (5.6%) | 6 (3.5%) |
| 30 to 34 Years | 3 (2.8%) | 31 (18.3%) |
| 35 to 39 Years | 2 (1.9%) | 1 (0.6%) |
| 40 to 44 Years | 9 (8.4%) | 2 (1.2%) |
| 45 to 49 Years | 1 (0.9%) | 1 (0.6%) |
| 50 to 54 Years | 1 (0.9%) | 2 (1.2%) |
| 55 to 59 Years | 4 (3.7%) | 7 (4.1%) |
| 60 to 64 Years | 10 (9.3%) | 8 (4.7%) |
| 65 to 69 Years | 22 (20.6%) | 8 (4.7%) |
| 70 to 74 Years | 6 (5.6%) | 11 (6.5%) |
| 75 to 79 Years | 2 (1.9%) | 1 (0.6%) |
| 80 to 84 Years | 2 (1.9%) | 2 (1.2%) |
| 85 Years and over | 2 (1.9%) | 0 (0.0%) |
| Total | 107 (100.0%) | 169 (100.0%) |
Families and Households in Double Spring
Median Family Size in Double Spring
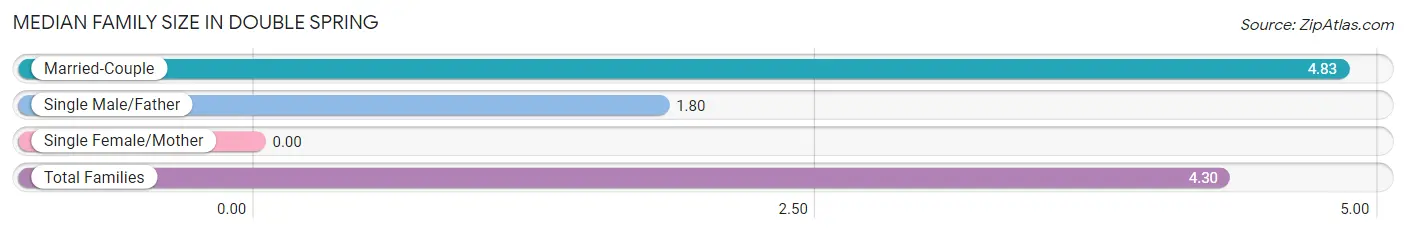
| Family Type | # Families | Family Size |
| Married-Couple | 47 (82.5%) | 4.83 |
| Single Male/Father | 10 (17.5%) | 1.80 |
| Single Female/Mother | 0 (0.0%) | - |
| Total Families | 57 (100.0%) | 4.30 |
Median Household Size in Double Spring
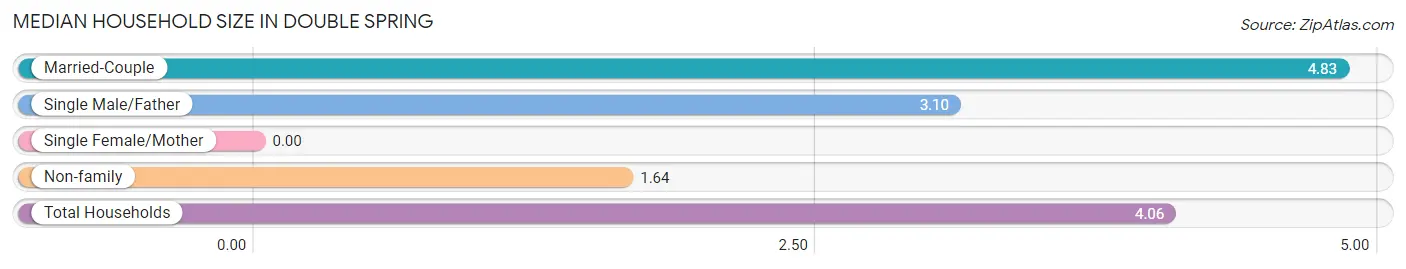
| Household Type | # Households | Household Size |
| Married-Couple | 47 (69.1%) | 4.83 |
| Single Male/Father | 10 (14.7%) | 3.10 |
| Single Female/Mother | 0 (0.0%) | - |
| Non-family | 11 (16.2%) | 1.64 |
| Total Households | 68 (100.0%) | 4.06 |
Household Size by Marriage Status in Double Spring
Out of a total of 68 households in Double Spring, 57 (83.8%) are family households, while 11 (16.2%) are nonfamily households. The most numerous type of family households are 2-person households, comprising 31, and the most common type of nonfamily households are 1-person households, comprising 7.
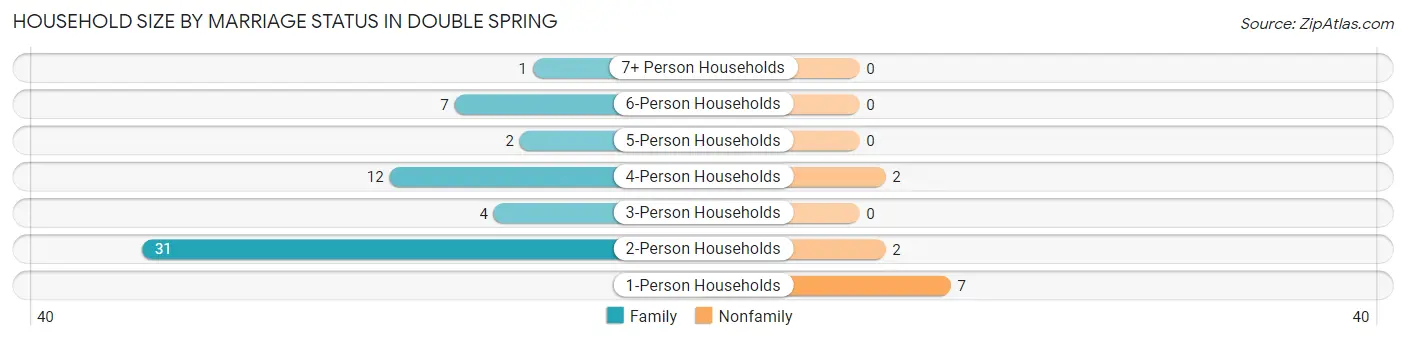
| Household Size | Family Households | Nonfamily Households |
| 1-Person Households | - | 7 (10.3%) |
| 2-Person Households | 31 (45.6%) | 2 (2.9%) |
| 3-Person Households | 4 (5.9%) | 0 (0.0%) |
| 4-Person Households | 12 (17.6%) | 2 (2.9%) |
| 5-Person Households | 2 (2.9%) | 0 (0.0%) |
| 6-Person Households | 7 (10.3%) | 0 (0.0%) |
| 7+ Person Households | 1 (1.5%) | 0 (0.0%) |
| Total | 57 (83.8%) | 11 (16.2%) |
Female Fertility in Double Spring
Fertility by Age in Double Spring
| Age Bracket | Women with Births | Births / 1,000 Women |
| 15 to 19 years | 0 (0.0%) | 0.0 |
| 20 to 34 years | 0 (0.0%) | 0.0 |
| 35 to 50 years | 0 (0.0%) | 0.0 |
| Total | 0 (0.0%) | 0.0 |
Fertility by Age by Marriage Status in Double Spring
| Age Bracket | Married | Unmarried |
| 15 to 19 years | 0 (0.0%) | 0 (0.0%) |
| 20 to 34 years | 0 (0.0%) | 0 (0.0%) |
| 35 to 50 years | 0 (0.0%) | 0 (0.0%) |
| Total | 0 (0.0%) | 0 (0.0%) |
Fertility by Education in Double Spring
| Educational Attainment | Women with Births | Births / 1,000 Women |
| Less than High School | 0 (0.0%) | 0.0 |
| High School Diploma | 0 (0.0%) | 0.0 |
| College or Associate's Degree | 0 (0.0%) | 0.0 |
| Bachelor's Degree | 0 (0.0%) | 0.0 |
| Graduate Degree | 0 (0.0%) | 0.0 |
| Total | 0 (0.0%) | 0.0 |
Fertility by Education by Marriage Status in Double Spring
| Educational Attainment | Married | Unmarried |
| Less than High School | 0 (0.0%) | 0 (0.0%) |
| High School Diploma | 0 (0.0%) | 0 (0.0%) |
| College or Associate's Degree | 0 (0.0%) | 0 (0.0%) |
| Bachelor's Degree | 0 (0.0%) | 0 (0.0%) |
| Graduate Degree | 0 (0.0%) | 0 (0.0%) |
| Total | 0 (0.0%) | 0 (0.0%) |
Employment Characteristics in Double Spring
Employment by Class of Employer in Double Spring
Among the 75 employed individuals in Double Spring, private company employees (58 | 77.3%), local government employees (7 | 9.3%), and self-employed (incorporated) (4 | 5.3%) make up the most common classes of employment.
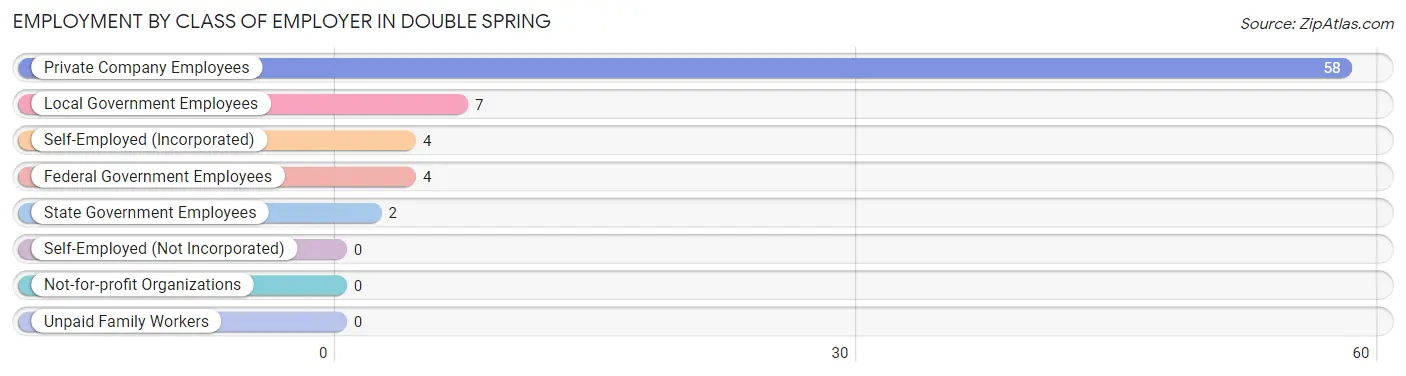
| Employer Class | # Employees | % Employees |
| Private Company Employees | 58 | 77.3% |
| Self-Employed (Incorporated) | 4 | 5.3% |
| Self-Employed (Not Incorporated) | 0 | 0.0% |
| Not-for-profit Organizations | 0 | 0.0% |
| Local Government Employees | 7 | 9.3% |
| State Government Employees | 2 | 2.7% |
| Federal Government Employees | 4 | 5.3% |
| Unpaid Family Workers | 0 | 0.0% |
| Total | 75 | 100.0% |
Employment Status by Age in Double Spring
According to the labor force statistics for Double Spring, out of the total population over 16 years of age (170), 51.2% or 87 individuals are in the labor force, with 13.8% or 12 of them unemployed. The age group with the highest labor force participation rate is 20 to 24 years, with 100.0% or 3 individuals in the labor force. Within the labor force, the 20 to 24 years age range has the highest percentage of unemployed individuals, with 100.0% or 3 of them being unemployed.
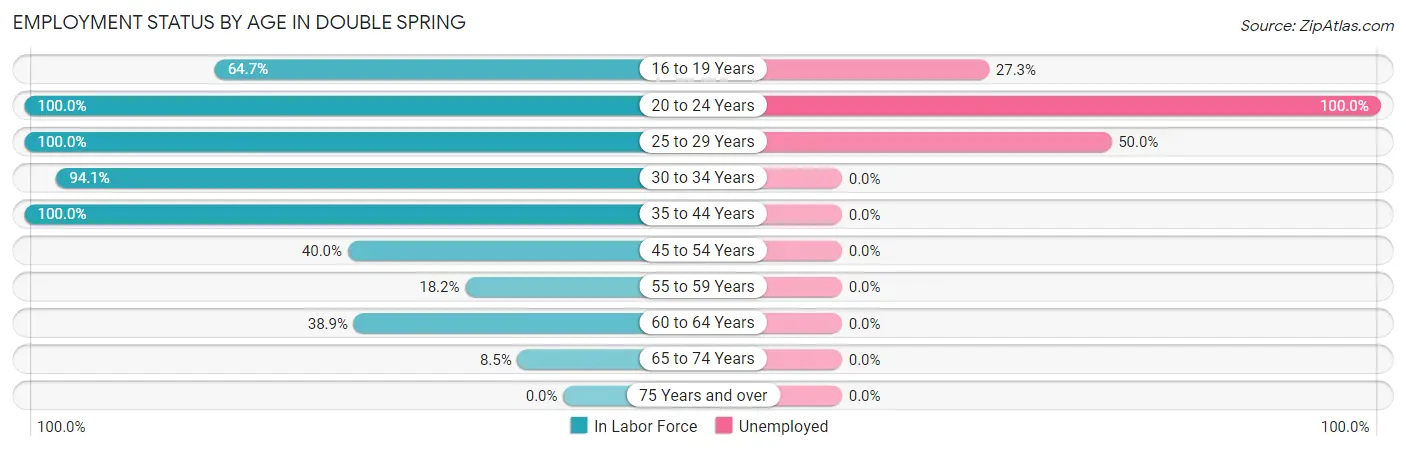
| Age Bracket | In Labor Force | Unemployed |
| 16 to 19 Years | 11 (64.7%) | 3 (27.3%) |
| 20 to 24 Years | 3 (100.0%) | 3 (100.0%) |
| 25 to 29 Years | 12 (100.0%) | 6 (50.0%) |
| 30 to 34 Years | 32 (94.1%) | 0 (0.0%) |
| 35 to 44 Years | 14 (100.0%) | 0 (0.0%) |
| 45 to 54 Years | 2 (40.0%) | 0 (0.0%) |
| 55 to 59 Years | 2 (18.2%) | 0 (0.0%) |
| 60 to 64 Years | 7 (38.9%) | 0 (0.0%) |
| 65 to 74 Years | 4 (8.5%) | 0 (0.0%) |
| 75 Years and over | 0 (0.0%) | 0 (0.0%) |
| Total | 87 (51.2%) | 12 (13.8%) |
Employment Status by Educational Attainment in Double Spring
According to labor force statistics for Double Spring, 73.4% of individuals (69) out of the total population between 25 and 64 years of age (94) are in the labor force, with 8.7% or 6 of them being unemployed. The group with the highest labor force participation rate are those with the educational attainment of college / associate degree, with 82.8% or 48 individuals in the labor force. Within the labor force, individuals with high school diploma education have the highest percentage of unemployment, with 30.0% or 6 of them being unemployed.
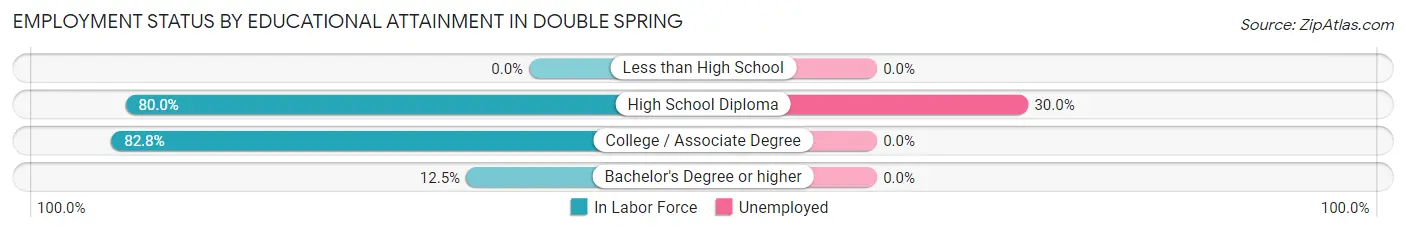
| Educational Attainment | In Labor Force | Unemployed |
| Less than High School | 0 (0.0%) | 0 (0.0%) |
| High School Diploma | 20 (80.0%) | 8 (30.0%) |
| College / Associate Degree | 48 (82.8%) | 0 (0.0%) |
| Bachelor's Degree or higher | 1 (12.5%) | 0 (0.0%) |
| Total | 69 (73.4%) | 8 (8.7%) |
Employment Occupations by Sex in Double Spring
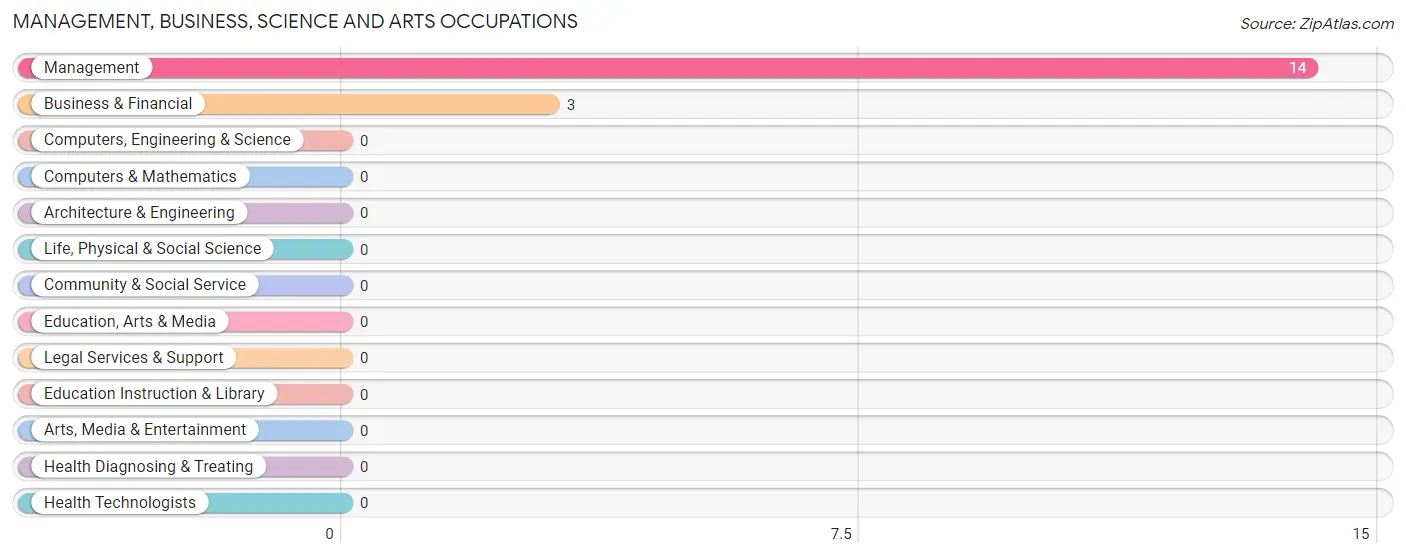
Management, Business, Science and Arts Occupations
The most common Management, Business, Science and Arts occupations in Double Spring are Management (14 | 18.7%), and Business & Financial (3 | 4.0%).
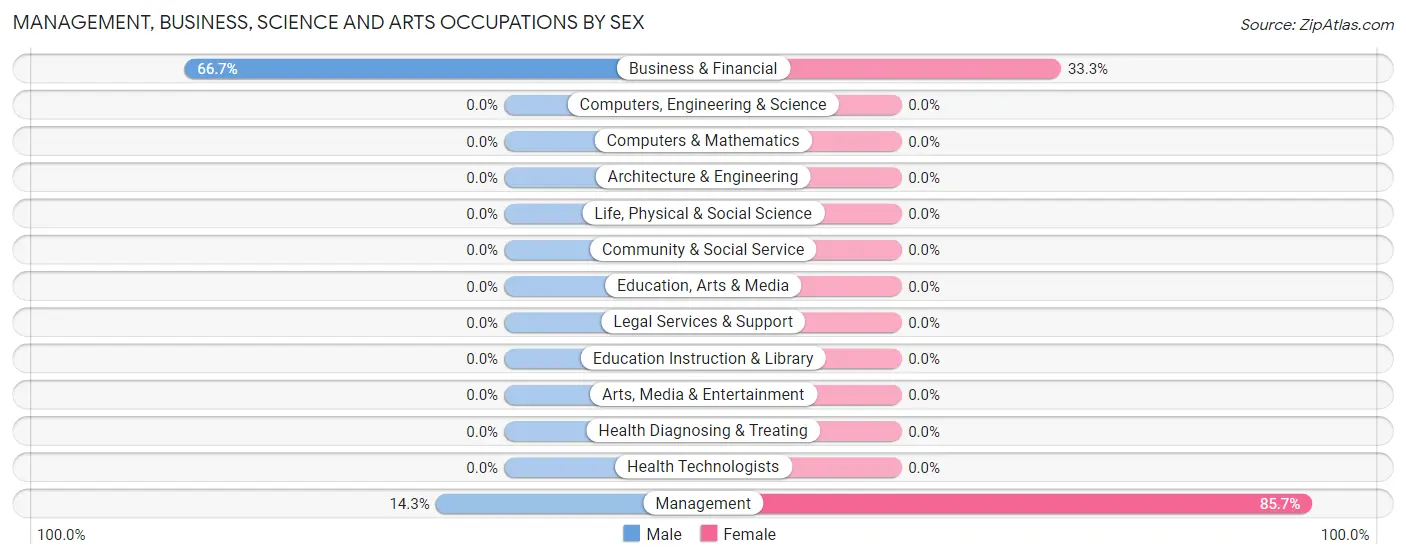
Management, Business, Science and Arts Occupations by Sex
Within the Management, Business, Science and Arts occupations in Double Spring, the most male-oriented occupations are Business & Financial (66.7%), and Management (14.3%), while the most female-oriented occupations are Management (85.7%), and Business & Financial (33.3%).
| Occupation | Male | Female |
| Management | 2 (14.3%) | 12 (85.7%) |
| Business & Financial | 2 (66.7%) | 1 (33.3%) |
| Computers, Engineering & Science | 0 (0.0%) | 0 (0.0%) |
| Computers & Mathematics | 0 (0.0%) | 0 (0.0%) |
| Architecture & Engineering | 0 (0.0%) | 0 (0.0%) |
| Life, Physical & Social Science | 0 (0.0%) | 0 (0.0%) |
| Community & Social Service | 0 (0.0%) | 0 (0.0%) |
| Education, Arts & Media | 0 (0.0%) | 0 (0.0%) |
| Legal Services & Support | 0 (0.0%) | 0 (0.0%) |
| Education Instruction & Library | 0 (0.0%) | 0 (0.0%) |
| Arts, Media & Entertainment | 0 (0.0%) | 0 (0.0%) |
| Health Diagnosing & Treating | 0 (0.0%) | 0 (0.0%) |
| Health Technologists | 0 (0.0%) | 0 (0.0%) |
| Total (Category) | 4 (23.5%) | 13 (76.5%) |
| Total (Overall) | 28 (37.3%) | 47 (62.7%) |
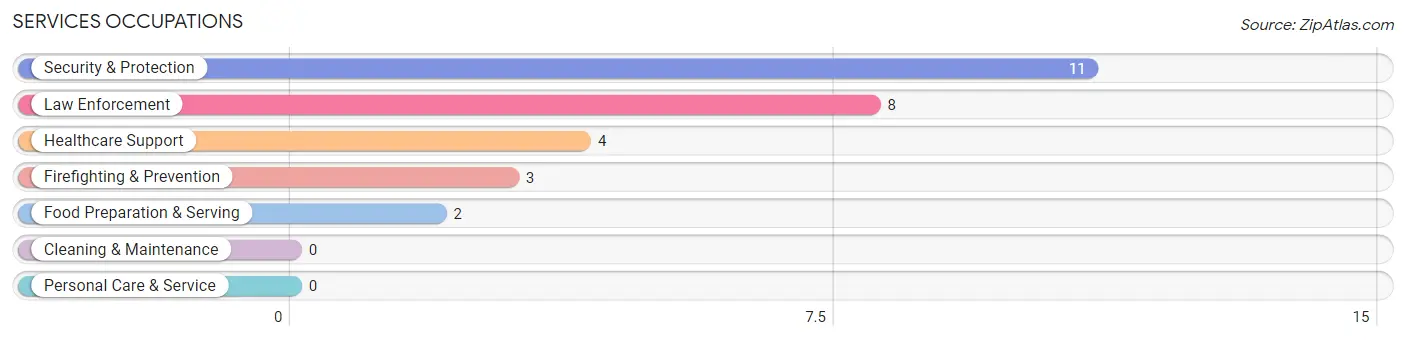
Services Occupations
The most common Services occupations in Double Spring are Security & Protection (11 | 14.7%), Law Enforcement (8 | 10.7%), Healthcare Support (4 | 5.3%), Firefighting & Prevention (3 | 4.0%), and Food Preparation & Serving (2 | 2.7%).
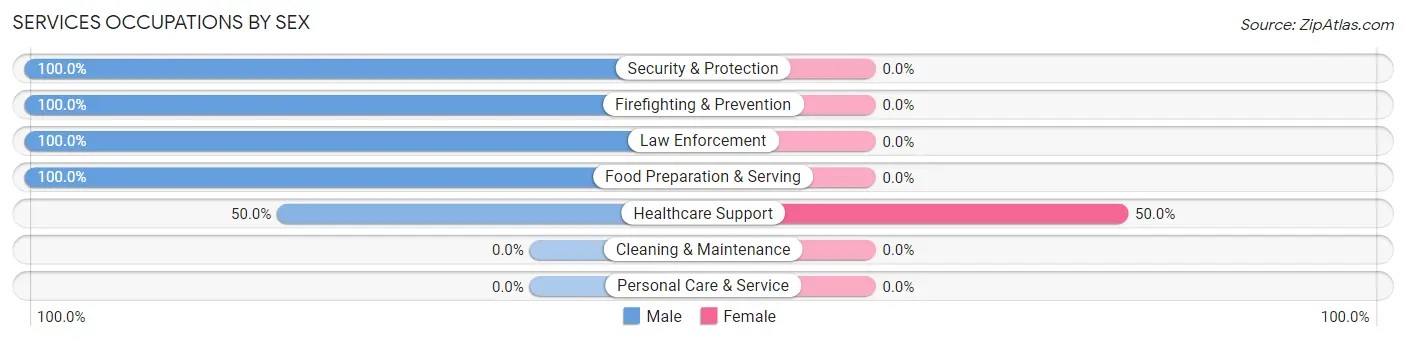
Services Occupations by Sex
| Occupation | Male | Female |
| Healthcare Support | 2 (50.0%) | 2 (50.0%) |
| Security & Protection | 11 (100.0%) | 0 (0.0%) |
| Firefighting & Prevention | 3 (100.0%) | 0 (0.0%) |
| Law Enforcement | 8 (100.0%) | 0 (0.0%) |
| Food Preparation & Serving | 2 (100.0%) | 0 (0.0%) |
| Cleaning & Maintenance | 0 (0.0%) | 0 (0.0%) |
| Personal Care & Service | 0 (0.0%) | 0 (0.0%) |
| Total (Category) | 15 (88.2%) | 2 (11.8%) |
| Total (Overall) | 28 (37.3%) | 47 (62.7%) |
Sales and Office Occupations
The most common Sales and Office occupations in Double Spring are , and Office & Administration (33 | 44.0%).
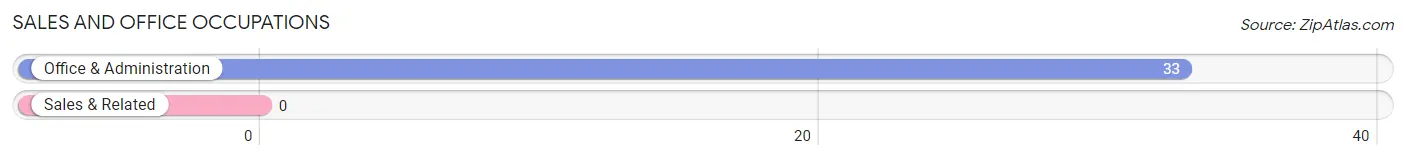
Sales and Office Occupations by Sex
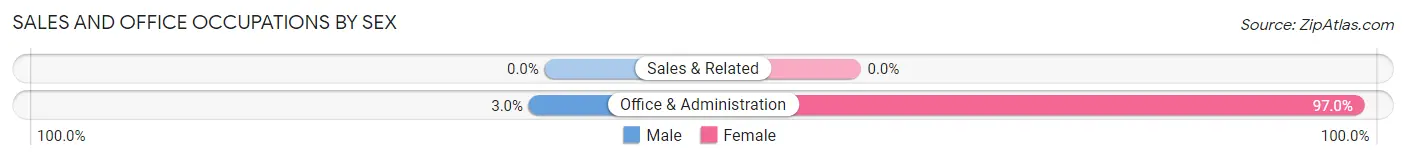
| Occupation | Male | Female |
| Sales & Related | 0 (0.0%) | 0 (0.0%) |
| Office & Administration | 1 (3.0%) | 32 (97.0%) |
| Total (Category) | 1 (3.0%) | 32 (97.0%) |
| Total (Overall) | 28 (37.3%) | 47 (62.7%) |
Natural Resources, Construction and Maintenance Occupations
The most common Natural Resources, Construction and Maintenance occupations in Double Spring are Installation, Maintenance & Repair (2 | 2.7%), and Construction & Extraction (1 | 1.3%).
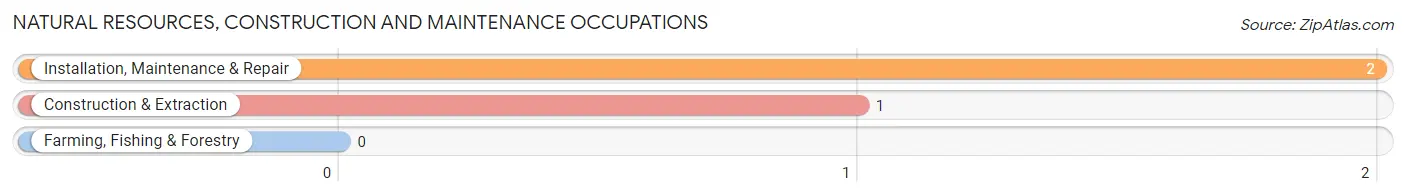
Natural Resources, Construction and Maintenance Occupations by Sex
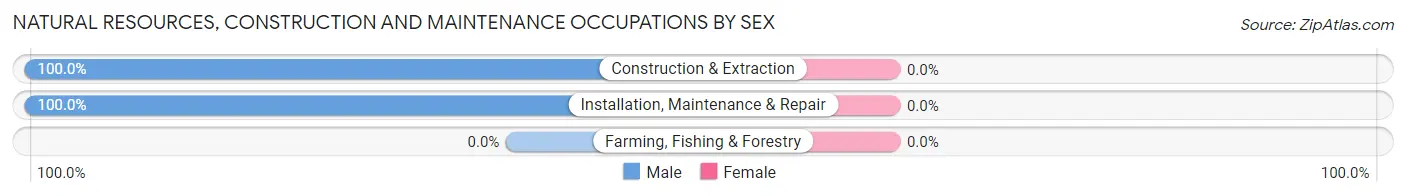
| Occupation | Male | Female |
| Farming, Fishing & Forestry | 0 (0.0%) | 0 (0.0%) |
| Construction & Extraction | 1 (100.0%) | 0 (0.0%) |
| Installation, Maintenance & Repair | 2 (100.0%) | 0 (0.0%) |
| Total (Category) | 3 (100.0%) | 0 (0.0%) |
| Total (Overall) | 28 (37.3%) | 47 (62.7%) |
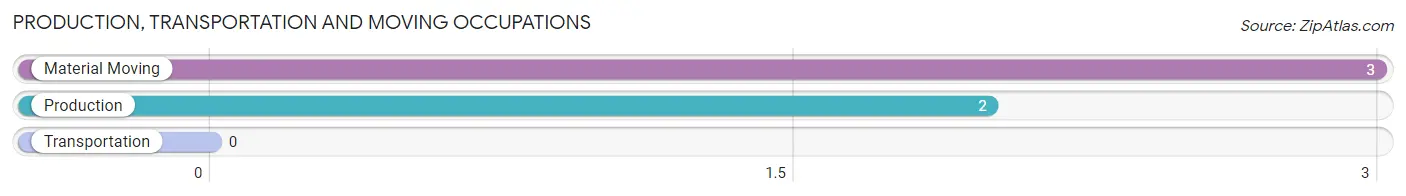
Production, Transportation and Moving Occupations
The most common Production, Transportation and Moving occupations in Double Spring are Material Moving (3 | 4.0%), and Production (2 | 2.7%).
Production, Transportation and Moving Occupations by Sex
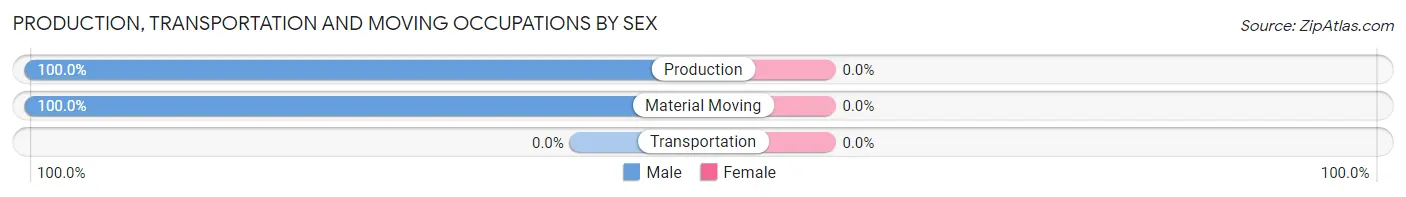
| Occupation | Male | Female |
| Production | 2 (100.0%) | 0 (0.0%) |
| Transportation | 0 (0.0%) | 0 (0.0%) |
| Material Moving | 3 (100.0%) | 0 (0.0%) |
| Total (Category) | 5 (100.0%) | 0 (0.0%) |
| Total (Overall) | 28 (37.3%) | 47 (62.7%) |
Employment Industries by Sex in Double Spring
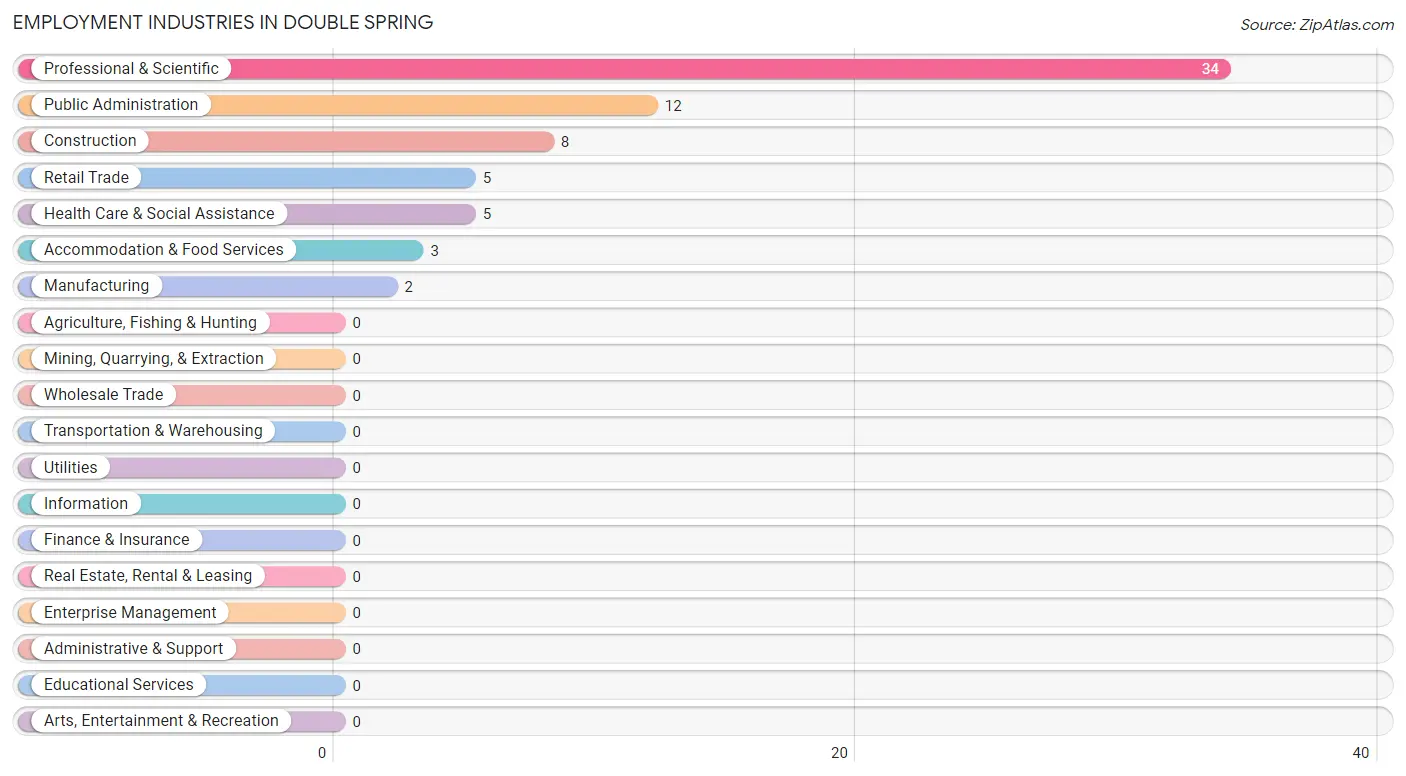
Employment Industries in Double Spring
The major employment industries in Double Spring include Professional & Scientific (34 | 45.3%), Public Administration (12 | 16.0%), Construction (8 | 10.7%), Retail Trade (5 | 6.7%), and Health Care & Social Assistance (5 | 6.7%).
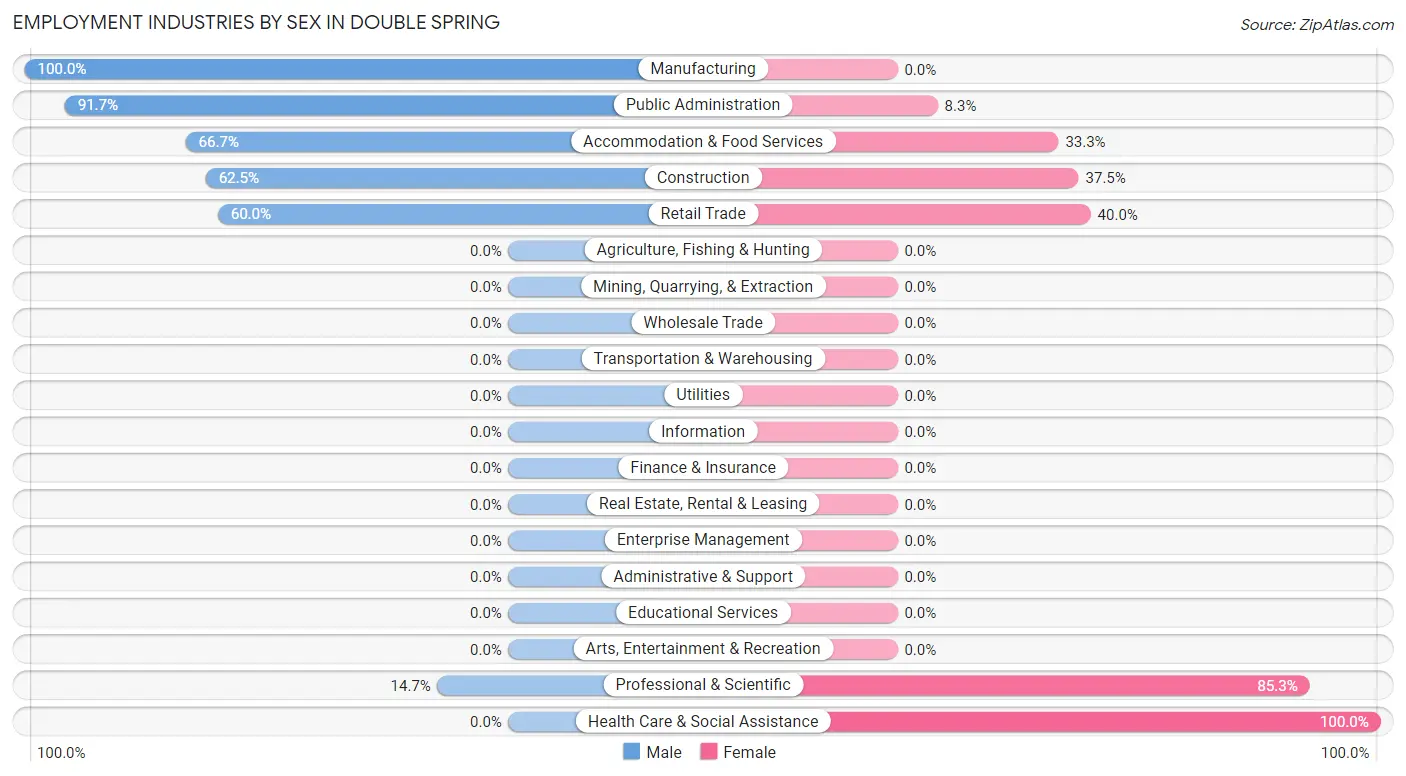
Employment Industries by Sex in Double Spring
The Double Spring industries that see more men than women are Manufacturing (100.0%), Public Administration (91.7%), and Accommodation & Food Services (66.7%), whereas the industries that tend to have a higher number of women are Health Care & Social Assistance (100.0%), Professional & Scientific (85.3%), and Retail Trade (40.0%).
| Industry | Male | Female |
| Agriculture, Fishing & Hunting | 0 (0.0%) | 0 (0.0%) |
| Mining, Quarrying, & Extraction | 0 (0.0%) | 0 (0.0%) |
| Construction | 5 (62.5%) | 3 (37.5%) |
| Manufacturing | 2 (100.0%) | 0 (0.0%) |
| Wholesale Trade | 0 (0.0%) | 0 (0.0%) |
| Retail Trade | 3 (60.0%) | 2 (40.0%) |
| Transportation & Warehousing | 0 (0.0%) | 0 (0.0%) |
| Utilities | 0 (0.0%) | 0 (0.0%) |
| Information | 0 (0.0%) | 0 (0.0%) |
| Finance & Insurance | 0 (0.0%) | 0 (0.0%) |
| Real Estate, Rental & Leasing | 0 (0.0%) | 0 (0.0%) |
| Professional & Scientific | 5 (14.7%) | 29 (85.3%) |
| Enterprise Management | 0 (0.0%) | 0 (0.0%) |
| Administrative & Support | 0 (0.0%) | 0 (0.0%) |
| Educational Services | 0 (0.0%) | 0 (0.0%) |
| Health Care & Social Assistance | 0 (0.0%) | 5 (100.0%) |
| Arts, Entertainment & Recreation | 0 (0.0%) | 0 (0.0%) |
| Accommodation & Food Services | 2 (66.7%) | 1 (33.3%) |
| Public Administration | 11 (91.7%) | 1 (8.3%) |
| Total | 28 (37.3%) | 47 (62.7%) |
Education in Double Spring
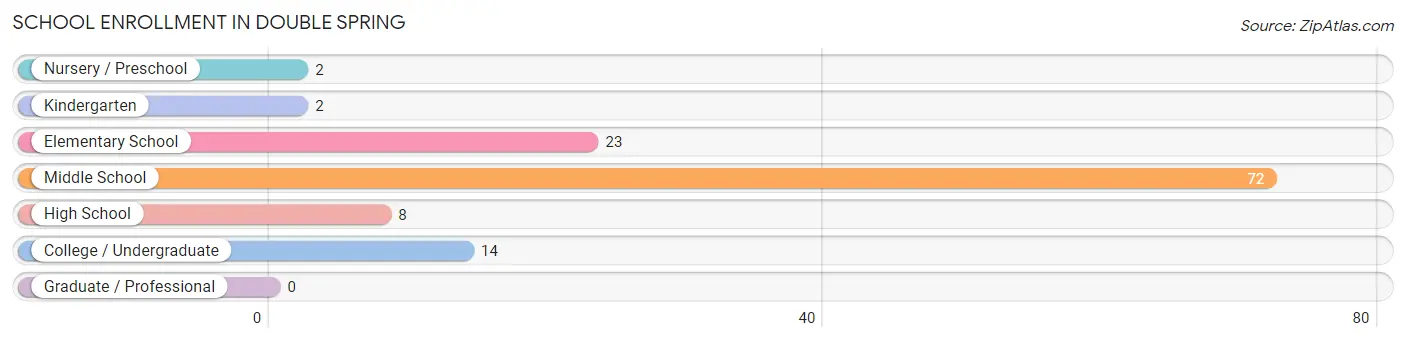
School Enrollment in Double Spring
The most common levels of schooling among the 121 students in Double Spring are middle school (72 | 59.5%), elementary school (23 | 19.0%), and college / undergraduate (14 | 11.6%).
| School Level | # Students | % Students |
| Nursery / Preschool | 2 | 1.7% |
| Kindergarten | 2 | 1.7% |
| Elementary School | 23 | 19.0% |
| Middle School | 72 | 59.5% |
| High School | 8 | 6.6% |
| College / Undergraduate | 14 | 11.6% |
| Graduate / Professional | 0 | 0.0% |
| Total | 121 | 100.0% |
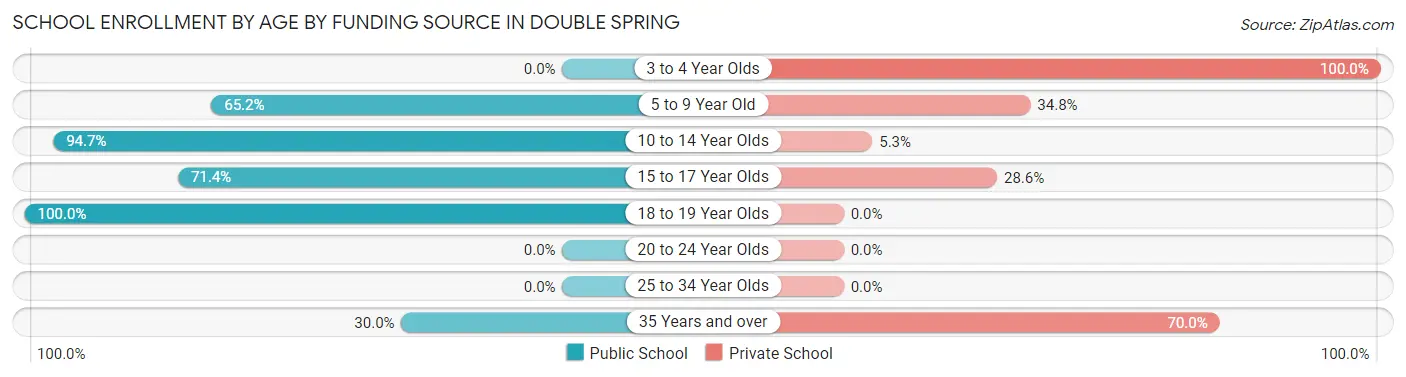
School Enrollment by Age by Funding Source in Double Spring
Out of a total of 121 students who are enrolled in schools in Double Spring, 23 (19.0%) attend a private institution, while the remaining 98 (81.0%) are enrolled in public schools. The age group of 3 to 4 year olds has the highest likelihood of being enrolled in private schools, with 2 (100.0% in the age bracket) enrolled. Conversely, the age group of 18 to 19 year olds has the lowest likelihood of being enrolled in a private school, with 4 (100.0% in the age bracket) attending a public institution.
| Age Bracket | Public School | Private School |
| 3 to 4 Year Olds | 0 (0.0%) | 2 (100.0%) |
| 5 to 9 Year Old | 15 (65.2%) | 8 (34.8%) |
| 10 to 14 Year Olds | 71 (94.7%) | 4 (5.3%) |
| 15 to 17 Year Olds | 5 (71.4%) | 2 (28.6%) |
| 18 to 19 Year Olds | 4 (100.0%) | 0 (0.0%) |
| 20 to 24 Year Olds | 0 (0.0%) | 0 (0.0%) |
| 25 to 34 Year Olds | 0 (0.0%) | 0 (0.0%) |
| 35 Years and over | 3 (30.0%) | 7 (70.0%) |
| Total | 98 (81.0%) | 23 (19.0%) |
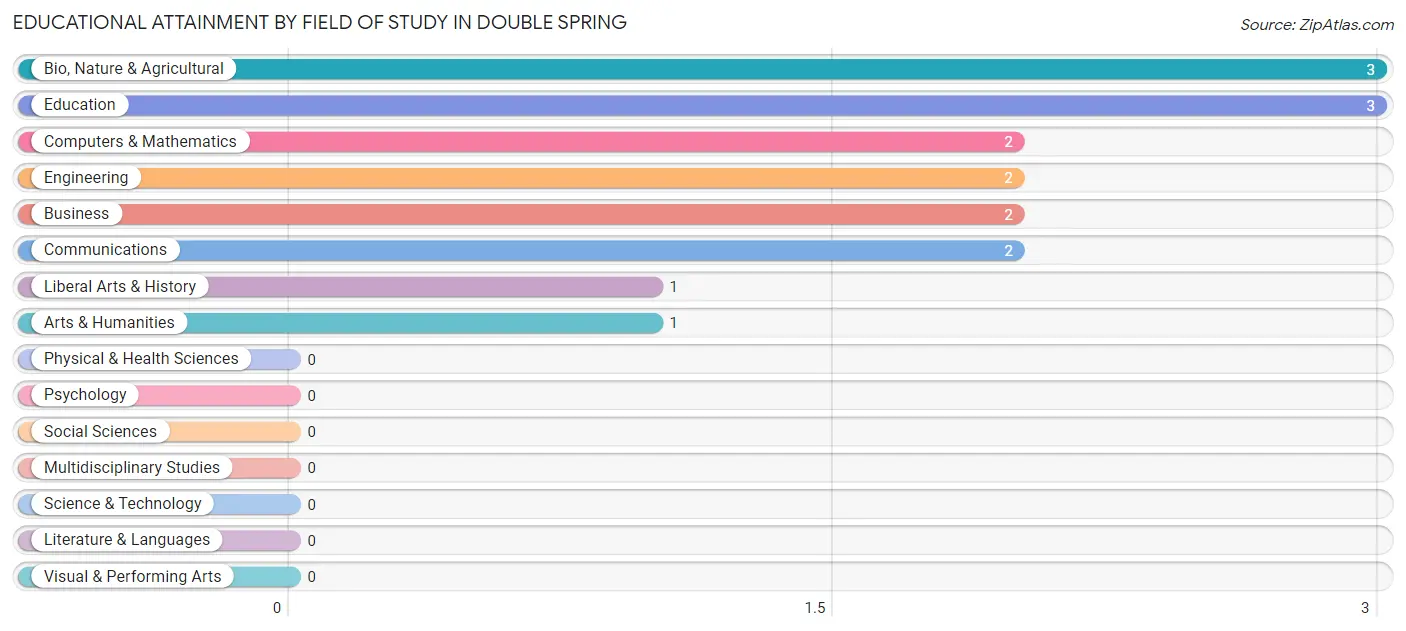
Educational Attainment by Field of Study in Double Spring
Bio, nature & agricultural (3 | 18.8%), education (3 | 18.8%), computers & mathematics (2 | 12.5%), engineering (2 | 12.5%), and business (2 | 12.5%) are the most common fields of study among 16 individuals in Double Spring who have obtained a bachelor's degree or higher.
| Field of Study | # Graduates | % Graduates |
| Computers & Mathematics | 2 | 12.5% |
| Bio, Nature & Agricultural | 3 | 18.8% |
| Physical & Health Sciences | 0 | 0.0% |
| Psychology | 0 | 0.0% |
| Social Sciences | 0 | 0.0% |
| Engineering | 2 | 12.5% |
| Multidisciplinary Studies | 0 | 0.0% |
| Science & Technology | 0 | 0.0% |
| Business | 2 | 12.5% |
| Education | 3 | 18.8% |
| Literature & Languages | 0 | 0.0% |
| Liberal Arts & History | 1 | 6.2% |
| Visual & Performing Arts | 0 | 0.0% |
| Communications | 2 | 12.5% |
| Arts & Humanities | 1 | 6.2% |
| Total | 16 | 100.0% |
Transportation & Commute in Double Spring
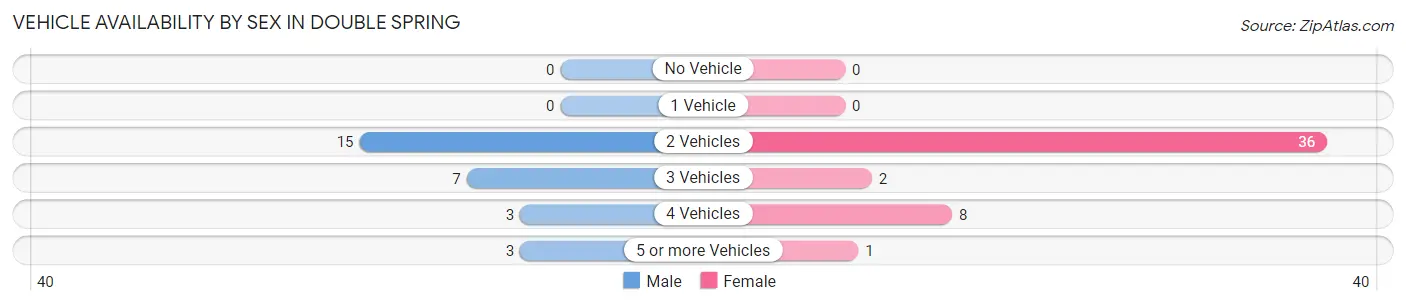
Vehicle Availability by Sex in Double Spring
The most prevalent vehicle ownership categories in Double Spring are males with 2 vehicles (15, accounting for 53.6%) and females with 2 vehicles (36, making up 31.9%).
| Vehicles Available | Male | Female |
| No Vehicle | 0 (0.0%) | 0 (0.0%) |
| 1 Vehicle | 0 (0.0%) | 0 (0.0%) |
| 2 Vehicles | 15 (53.6%) | 36 (76.6%) |
| 3 Vehicles | 7 (25.0%) | 2 (4.3%) |
| 4 Vehicles | 3 (10.7%) | 8 (17.0%) |
| 5 or more Vehicles | 3 (10.7%) | 1 (2.1%) |
| Total | 28 (100.0%) | 47 (100.0%) |
Commute Time in Double Spring
The most frequently occuring commute durations in Double Spring are 45 to 59 minutes (13 commuters, 38.2%), 10 to 14 minutes (7 commuters, 20.6%), and 20 to 24 minutes (4 commuters, 11.8%).
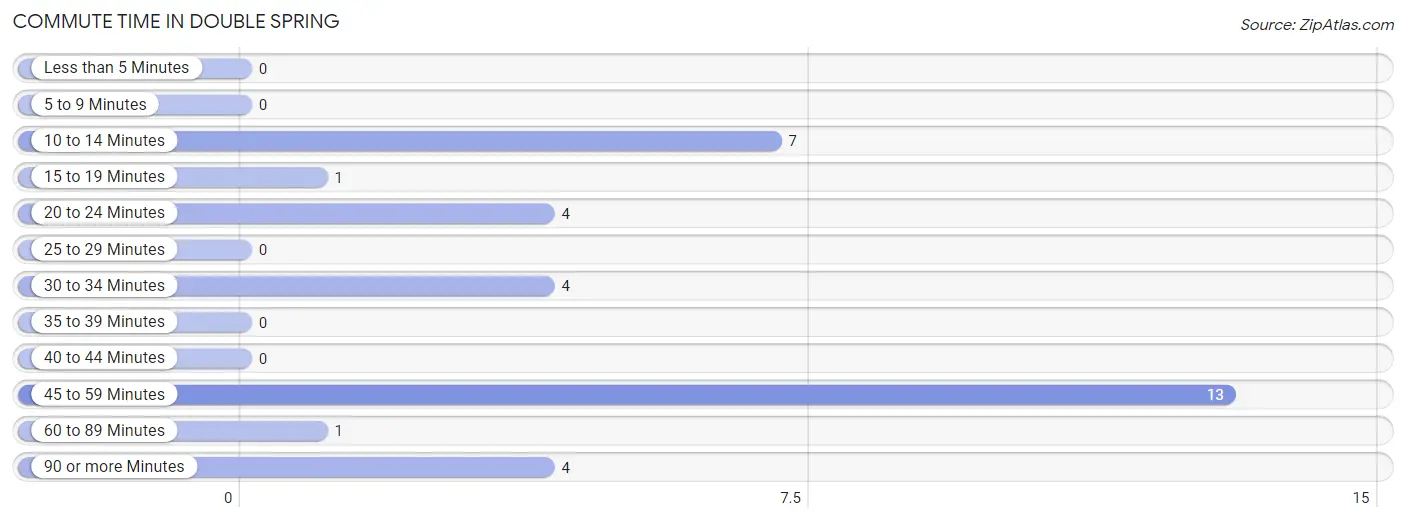
| Commute Time | # Commuters | % Commuters |
| Less than 5 Minutes | 0 | 0.0% |
| 5 to 9 Minutes | 0 | 0.0% |
| 10 to 14 Minutes | 7 | 20.6% |
| 15 to 19 Minutes | 1 | 2.9% |
| 20 to 24 Minutes | 4 | 11.8% |
| 25 to 29 Minutes | 0 | 0.0% |
| 30 to 34 Minutes | 4 | 11.8% |
| 35 to 39 Minutes | 0 | 0.0% |
| 40 to 44 Minutes | 0 | 0.0% |
| 45 to 59 Minutes | 13 | 38.2% |
| 60 to 89 Minutes | 1 | 2.9% |
| 90 or more Minutes | 4 | 11.8% |
Commute Time by Sex in Double Spring
The most common commute times in Double Spring are 45 to 59 minutes (12 commuters, 57.1%) for males and 10 to 14 minutes (7 commuters, 53.8%) for females.
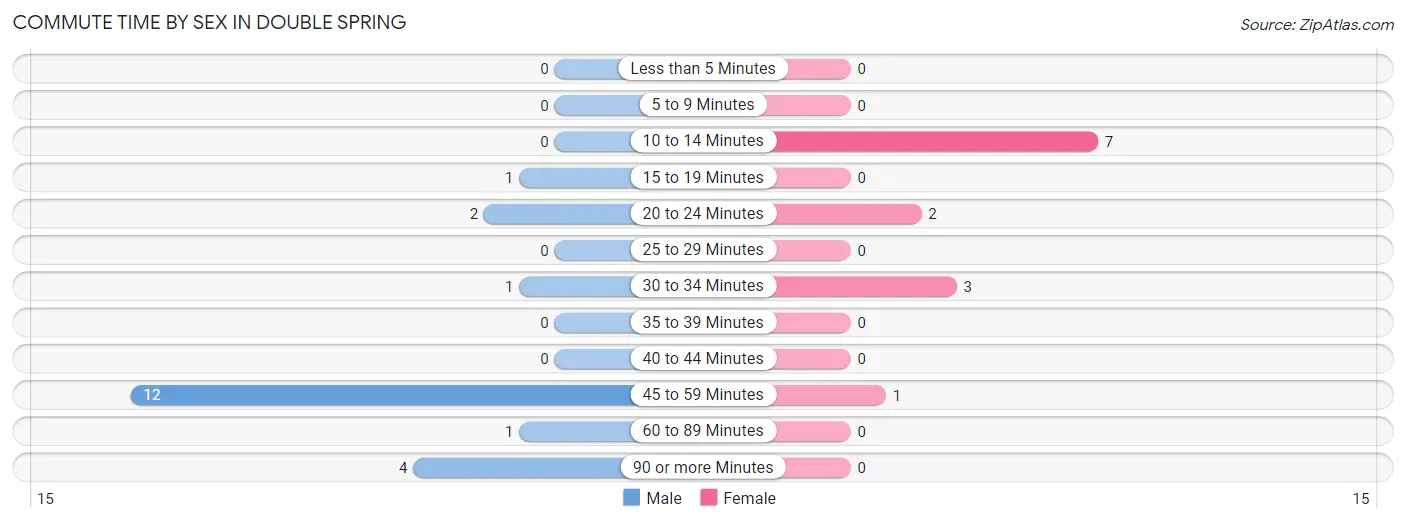
| Commute Time | Male | Female |
| Less than 5 Minutes | 0 (0.0%) | 0 (0.0%) |
| 5 to 9 Minutes | 0 (0.0%) | 0 (0.0%) |
| 10 to 14 Minutes | 0 (0.0%) | 7 (53.8%) |
| 15 to 19 Minutes | 1 (4.8%) | 0 (0.0%) |
| 20 to 24 Minutes | 2 (9.5%) | 2 (15.4%) |
| 25 to 29 Minutes | 0 (0.0%) | 0 (0.0%) |
| 30 to 34 Minutes | 1 (4.8%) | 3 (23.1%) |
| 35 to 39 Minutes | 0 (0.0%) | 0 (0.0%) |
| 40 to 44 Minutes | 0 (0.0%) | 0 (0.0%) |
| 45 to 59 Minutes | 12 (57.1%) | 1 (7.7%) |
| 60 to 89 Minutes | 1 (4.8%) | 0 (0.0%) |
| 90 or more Minutes | 4 (19.1%) | 0 (0.0%) |
Time of Departure to Work by Sex in Double Spring
The most frequent times of departure to work in Double Spring are 12:00 AM to 4:59 AM (9, 42.9%) for males and 7:30 AM to 7:59 AM (10, 76.9%) for females.
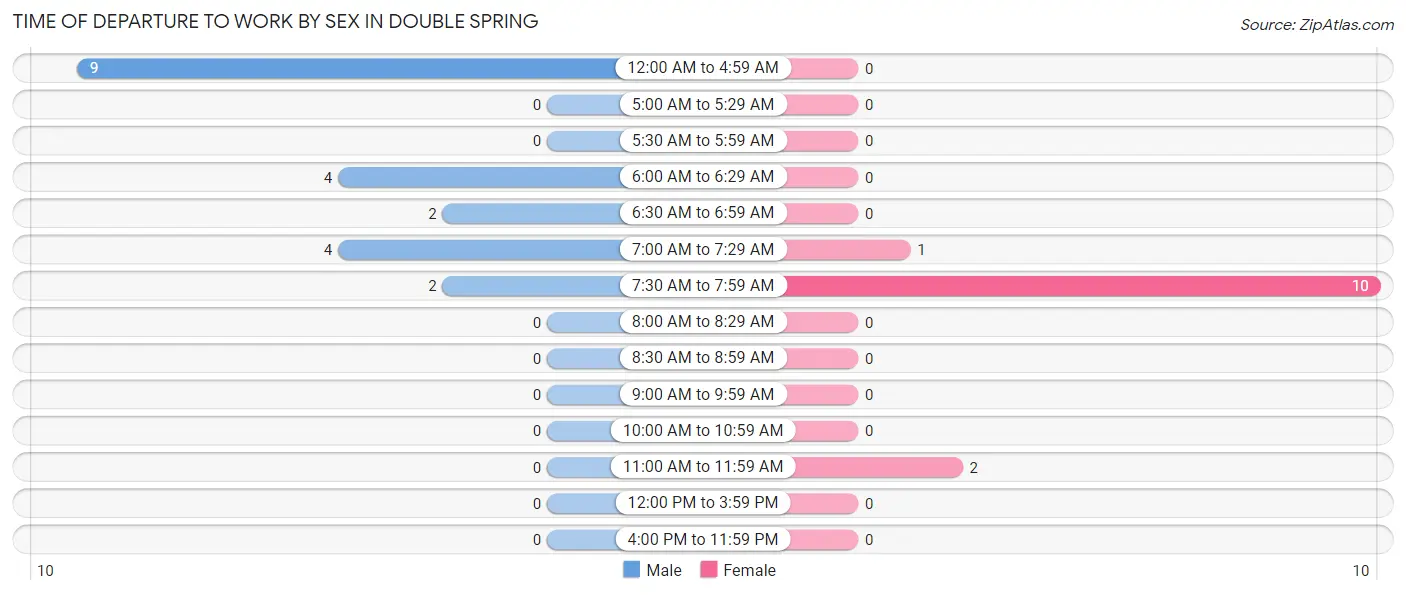
| Time of Departure | Male | Female |
| 12:00 AM to 4:59 AM | 9 (42.9%) | 0 (0.0%) |
| 5:00 AM to 5:29 AM | 0 (0.0%) | 0 (0.0%) |
| 5:30 AM to 5:59 AM | 0 (0.0%) | 0 (0.0%) |
| 6:00 AM to 6:29 AM | 4 (19.1%) | 0 (0.0%) |
| 6:30 AM to 6:59 AM | 2 (9.5%) | 0 (0.0%) |
| 7:00 AM to 7:29 AM | 4 (19.1%) | 1 (7.7%) |
| 7:30 AM to 7:59 AM | 2 (9.5%) | 10 (76.9%) |
| 8:00 AM to 8:29 AM | 0 (0.0%) | 0 (0.0%) |
| 8:30 AM to 8:59 AM | 0 (0.0%) | 0 (0.0%) |
| 9:00 AM to 9:59 AM | 0 (0.0%) | 0 (0.0%) |
| 10:00 AM to 10:59 AM | 0 (0.0%) | 0 (0.0%) |
| 11:00 AM to 11:59 AM | 0 (0.0%) | 2 (15.4%) |
| 12:00 PM to 3:59 PM | 0 (0.0%) | 0 (0.0%) |
| 4:00 PM to 11:59 PM | 0 (0.0%) | 0 (0.0%) |
| Total | 21 (100.0%) | 13 (100.0%) |
Housing Occupancy in Double Spring
Occupancy by Ownership in Double Spring
Of the total 68 dwellings in Double Spring, owner-occupied units account for 60 (88.2%), while renter-occupied units make up 8 (11.8%).
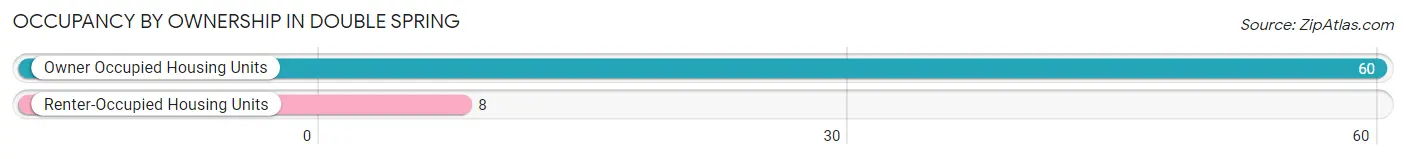
| Occupancy | # Housing Units | % Housing Units |
| Owner Occupied Housing Units | 60 | 88.2% |
| Renter-Occupied Housing Units | 8 | 11.8% |
| Total Occupied Housing Units | 68 | 100.0% |
Occupancy by Household Size in Double Spring
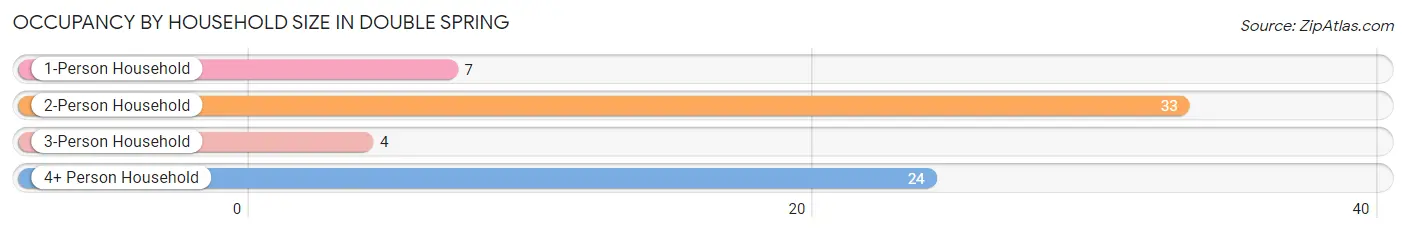
| Household Size | # Housing Units | % Housing Units |
| 1-Person Household | 7 | 10.3% |
| 2-Person Household | 33 | 48.5% |
| 3-Person Household | 4 | 5.9% |
| 4+ Person Household | 24 | 35.3% |
| Total Housing Units | 68 | 100.0% |
Occupancy by Ownership by Household Size in Double Spring
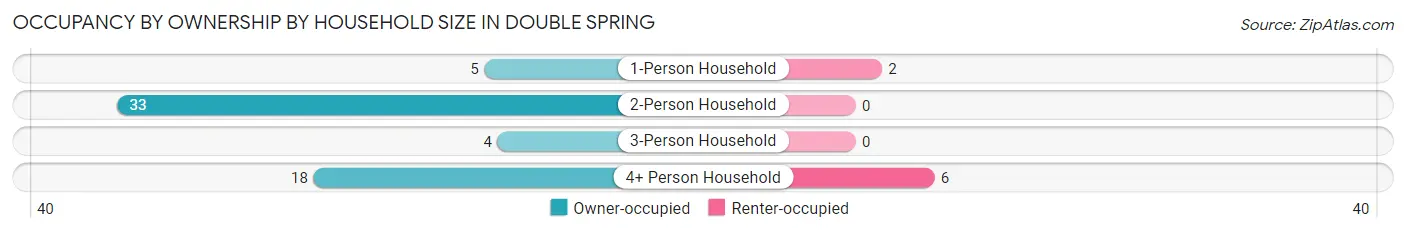
| Household Size | Owner-occupied | Renter-occupied |
| 1-Person Household | 5 (71.4%) | 2 (28.6%) |
| 2-Person Household | 33 (100.0%) | 0 (0.0%) |
| 3-Person Household | 4 (100.0%) | 0 (0.0%) |
| 4+ Person Household | 18 (75.0%) | 6 (25.0%) |
| Total Housing Units | 60 (88.2%) | 8 (11.8%) |
Occupancy by Educational Attainment in Double Spring
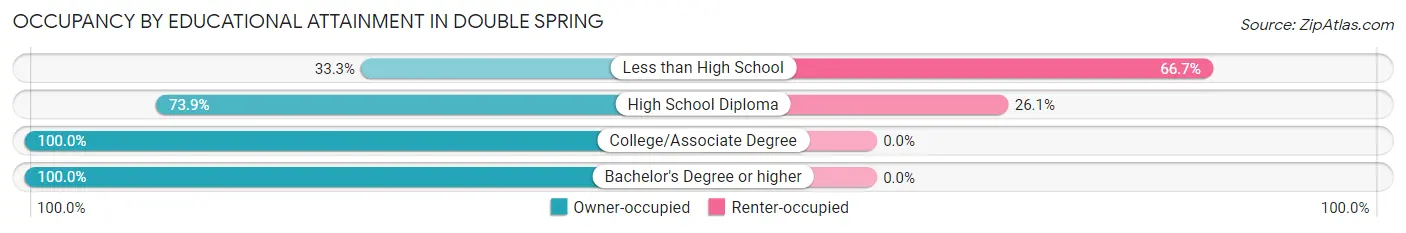
| Household Size | Owner-occupied | Renter-occupied |
| Less than High School | 1 (33.3%) | 2 (66.7%) |
| High School Diploma | 17 (73.9%) | 6 (26.1%) |
| College/Associate Degree | 33 (100.0%) | 0 (0.0%) |
| Bachelor's Degree or higher | 9 (100.0%) | 0 (0.0%) |
Occupancy by Age of Householder in Double Spring
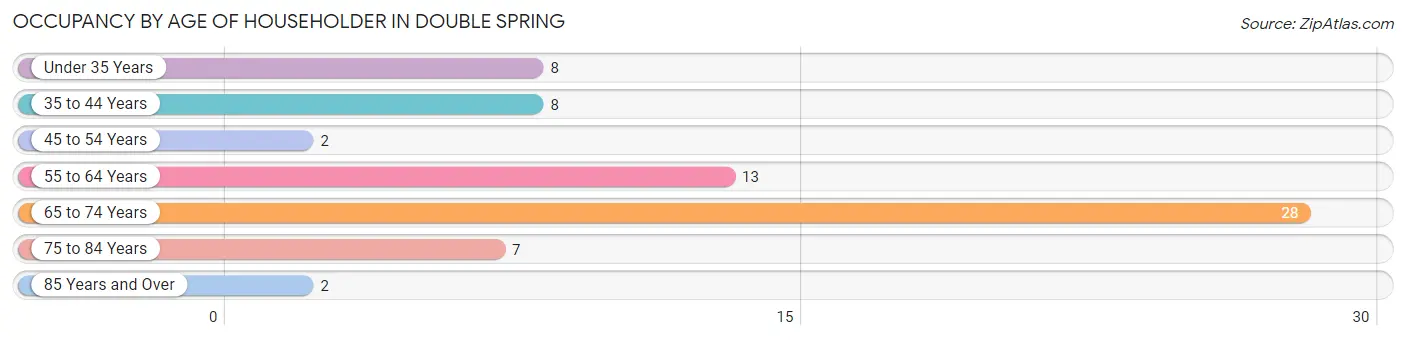
| Age Bracket | # Households | % Households |
| Under 35 Years | 8 | 11.8% |
| 35 to 44 Years | 8 | 11.8% |
| 45 to 54 Years | 2 | 2.9% |
| 55 to 64 Years | 13 | 19.1% |
| 65 to 74 Years | 28 | 41.2% |
| 75 to 84 Years | 7 | 10.3% |
| 85 Years and Over | 2 | 2.9% |
| Total | 68 | 100.0% |
Housing Finances in Double Spring
Median Income by Occupancy in Double Spring
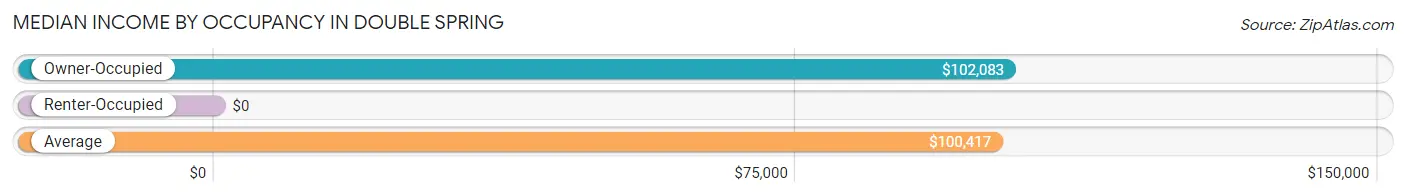
| Occupancy Type | # Households | Median Income |
| Owner-Occupied | 60 (88.2%) | $102,083 |
| Renter-Occupied | 8 (11.8%) | $0 |
| Average | 68 (100.0%) | $100,417 |
Occupancy by Householder Income Bracket in Double Spring
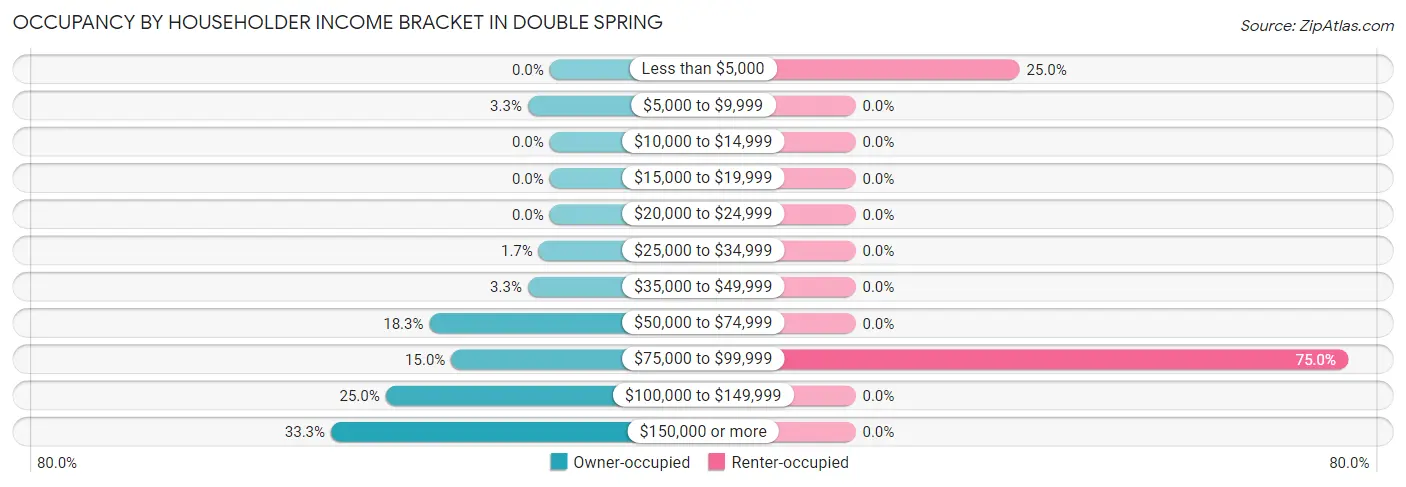
| Income Bracket | Owner-occupied | Renter-occupied |
| Less than $5,000 | 0 (0.0%) | 2 (25.0%) |
| $5,000 to $9,999 | 2 (3.3%) | 0 (0.0%) |
| $10,000 to $14,999 | 0 (0.0%) | 0 (0.0%) |
| $15,000 to $19,999 | 0 (0.0%) | 0 (0.0%) |
| $20,000 to $24,999 | 0 (0.0%) | 0 (0.0%) |
| $25,000 to $34,999 | 1 (1.7%) | 0 (0.0%) |
| $35,000 to $49,999 | 2 (3.3%) | 0 (0.0%) |
| $50,000 to $74,999 | 11 (18.3%) | 0 (0.0%) |
| $75,000 to $99,999 | 9 (15.0%) | 6 (75.0%) |
| $100,000 to $149,999 | 15 (25.0%) | 0 (0.0%) |
| $150,000 or more | 20 (33.3%) | 0 (0.0%) |
| Total | 60 (100.0%) | 8 (100.0%) |
Monthly Housing Cost Tiers in Double Spring
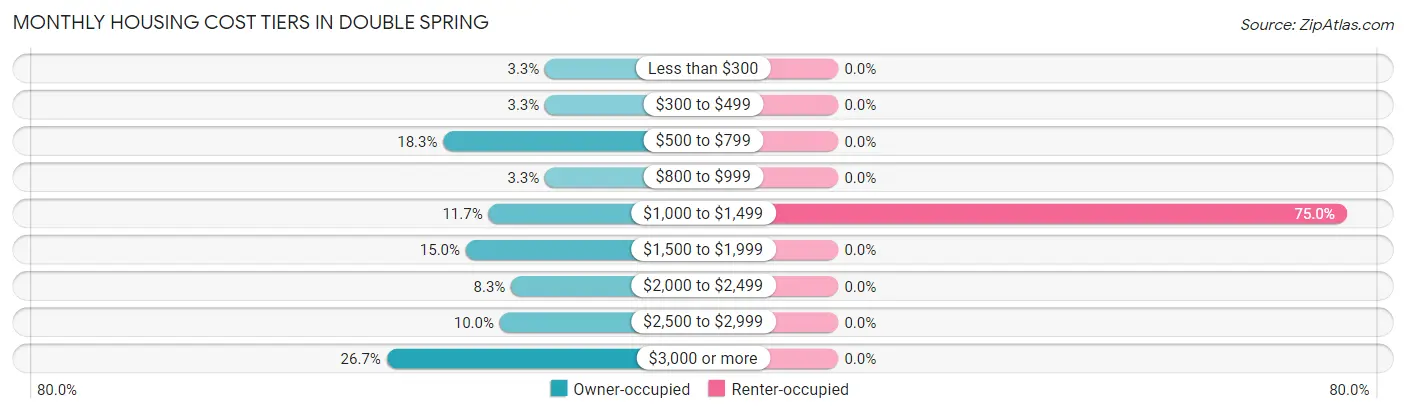
| Monthly Cost | Owner-occupied | Renter-occupied |
| Less than $300 | 2 (3.3%) | 0 (0.0%) |
| $300 to $499 | 2 (3.3%) | 0 (0.0%) |
| $500 to $799 | 11 (18.3%) | 0 (0.0%) |
| $800 to $999 | 2 (3.3%) | 0 (0.0%) |
| $1,000 to $1,499 | 7 (11.7%) | 6 (75.0%) |
| $1,500 to $1,999 | 9 (15.0%) | 0 (0.0%) |
| $2,000 to $2,499 | 5 (8.3%) | 0 (0.0%) |
| $2,500 to $2,999 | 6 (10.0%) | 0 (0.0%) |
| $3,000 or more | 16 (26.7%) | 0 (0.0%) |
| Total | 60 (100.0%) | 8 (100.0%) |
Physical Housing Characteristics in Double Spring
Housing Structures in Double Spring
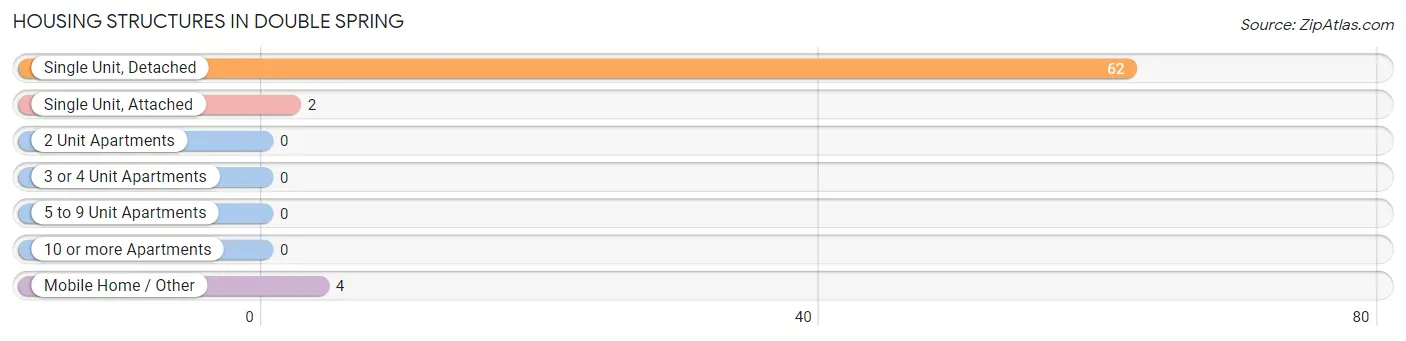
| Structure Type | # Housing Units | % Housing Units |
| Single Unit, Detached | 62 | 91.2% |
| Single Unit, Attached | 2 | 2.9% |
| 2 Unit Apartments | 0 | 0.0% |
| 3 or 4 Unit Apartments | 0 | 0.0% |
| 5 to 9 Unit Apartments | 0 | 0.0% |
| 10 or more Apartments | 0 | 0.0% |
| Mobile Home / Other | 4 | 5.9% |
| Total | 68 | 100.0% |
Housing Structures by Occupancy in Double Spring
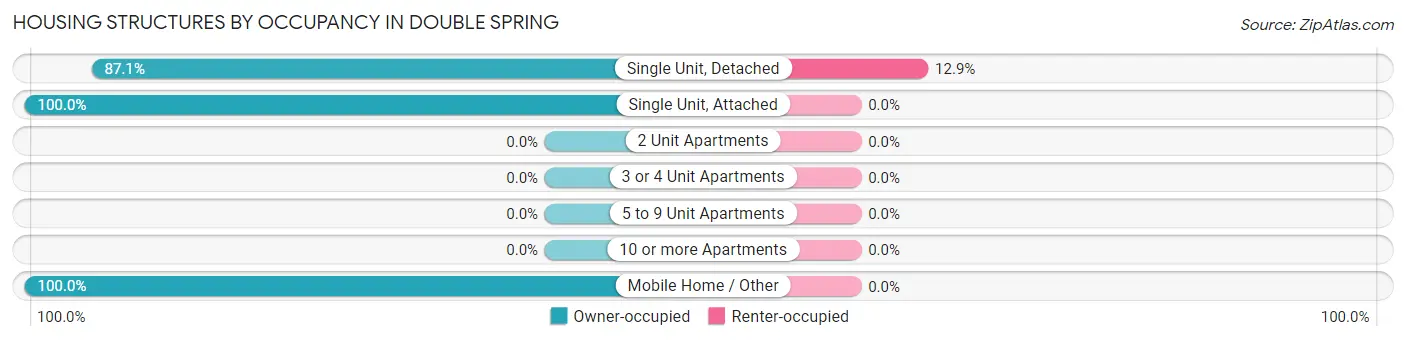
| Structure Type | Owner-occupied | Renter-occupied |
| Single Unit, Detached | 54 (87.1%) | 8 (12.9%) |
| Single Unit, Attached | 2 (100.0%) | 0 (0.0%) |
| 2 Unit Apartments | 0 (0.0%) | 0 (0.0%) |
| 3 or 4 Unit Apartments | 0 (0.0%) | 0 (0.0%) |
| 5 to 9 Unit Apartments | 0 (0.0%) | 0 (0.0%) |
| 10 or more Apartments | 0 (0.0%) | 0 (0.0%) |
| Mobile Home / Other | 4 (100.0%) | 0 (0.0%) |
| Total | 60 (88.2%) | 8 (11.8%) |
Housing Structures by Number of Rooms in Double Spring
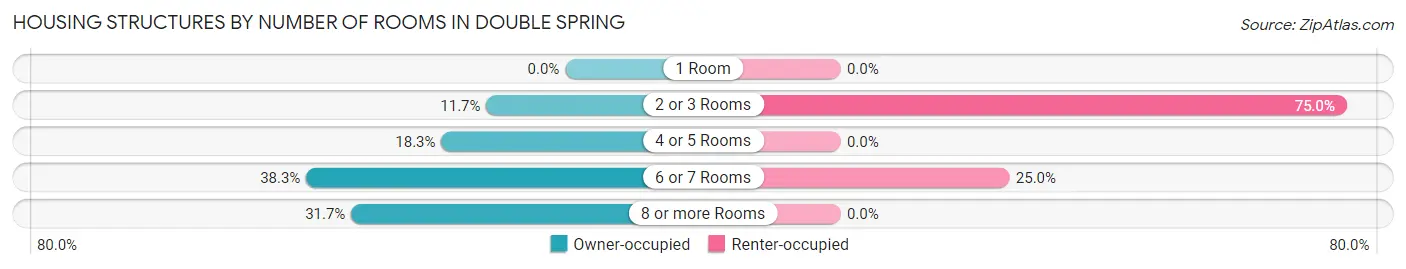
| Number of Rooms | Owner-occupied | Renter-occupied |
| 1 Room | 0 (0.0%) | 0 (0.0%) |
| 2 or 3 Rooms | 7 (11.7%) | 6 (75.0%) |
| 4 or 5 Rooms | 11 (18.3%) | 0 (0.0%) |
| 6 or 7 Rooms | 23 (38.3%) | 2 (25.0%) |
| 8 or more Rooms | 19 (31.7%) | 0 (0.0%) |
| Total | 60 (100.0%) | 8 (100.0%) |
Housing Structure by Heating Type in Double Spring
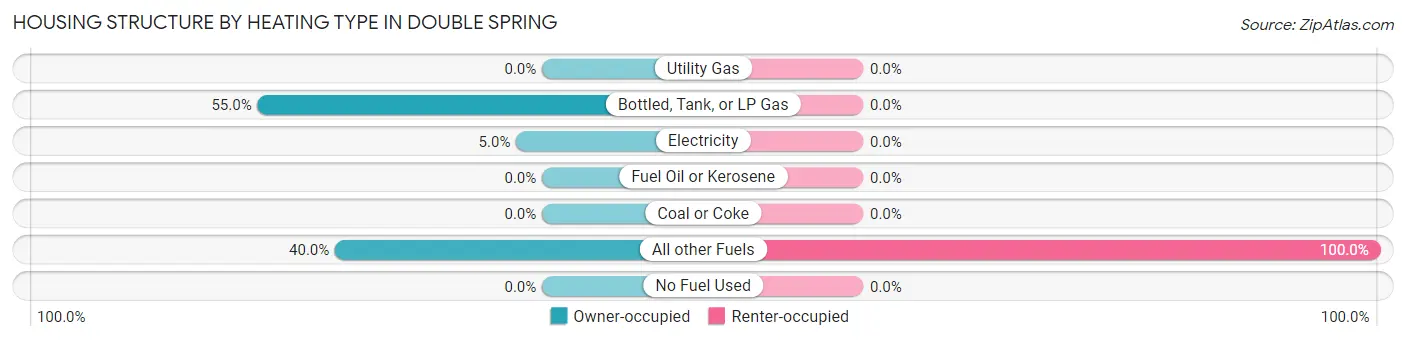
| Heating Type | Owner-occupied | Renter-occupied |
| Utility Gas | 0 (0.0%) | 0 (0.0%) |
| Bottled, Tank, or LP Gas | 33 (55.0%) | 0 (0.0%) |
| Electricity | 3 (5.0%) | 0 (0.0%) |
| Fuel Oil or Kerosene | 0 (0.0%) | 0 (0.0%) |
| Coal or Coke | 0 (0.0%) | 0 (0.0%) |
| All other Fuels | 24 (40.0%) | 8 (100.0%) |
| No Fuel Used | 0 (0.0%) | 0 (0.0%) |
| Total | 60 (100.0%) | 8 (100.0%) |
Household Vehicle Usage in Double Spring
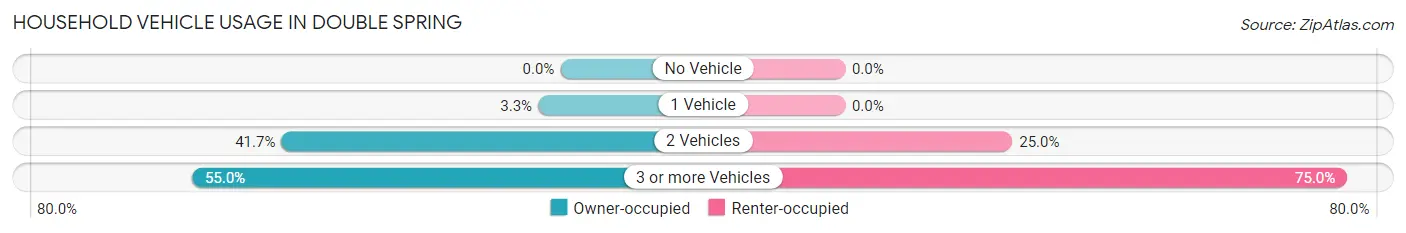
| Vehicles per Household | Owner-occupied | Renter-occupied |
| No Vehicle | 0 (0.0%) | 0 (0.0%) |
| 1 Vehicle | 2 (3.3%) | 0 (0.0%) |
| 2 Vehicles | 25 (41.7%) | 2 (25.0%) |
| 3 or more Vehicles | 33 (55.0%) | 6 (75.0%) |
| Total | 60 (100.0%) | 8 (100.0%) |
Real Estate & Mortgages in Double Spring
Real Estate and Mortgage Overview in Double Spring
| Characteristic | Without Mortgage | With Mortgage |
| Housing Units | 19 | 41 |
| Median Property Value | $670,500 | $576,400 |
| Median Household Income | $61,458 | $18 |
| Monthly Housing Costs | $708 | $16 |
| Real Estate Taxes | $4,125 | $0 |
Property Value by Mortgage Status in Double Spring

| Property Value | Without Mortgage | With Mortgage |
| Less than $50,000 | 0 (0.0%) | 2 (4.9%) |
| $50,000 to $99,999 | 0 (0.0%) | 0 (0.0%) |
| $100,000 to $299,999 | 0 (0.0%) | 1 (2.4%) |
| $300,000 to $499,999 | 2 (10.5%) | 12 (29.3%) |
| $500,000 to $749,999 | 11 (57.9%) | 18 (43.9%) |
| $750,000 to $999,999 | 2 (10.5%) | 5 (12.2%) |
| $1,000,000 or more | 4 (21.0%) | 3 (7.3%) |
| Total | 19 (100.0%) | 41 (100.0%) |
Household Income by Mortgage Status in Double Spring
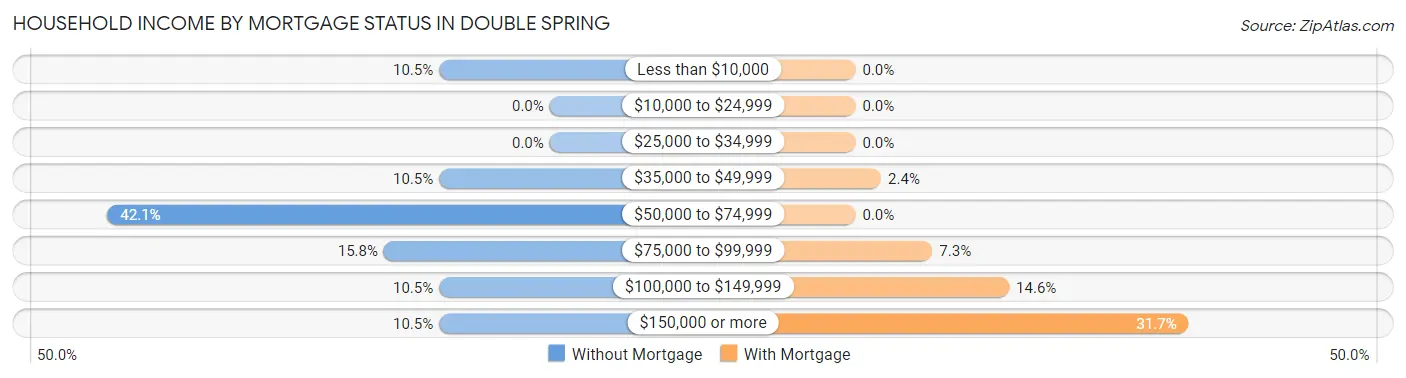
| Household Income | Without Mortgage | With Mortgage |
| Less than $10,000 | 2 (10.5%) | 0 (0.0%) |
| $10,000 to $24,999 | 0 (0.0%) | 0 (0.0%) |
| $25,000 to $34,999 | 0 (0.0%) | 0 (0.0%) |
| $35,000 to $49,999 | 2 (10.5%) | 1 (2.4%) |
| $50,000 to $74,999 | 8 (42.1%) | 0 (0.0%) |
| $75,000 to $99,999 | 3 (15.8%) | 3 (7.3%) |
| $100,000 to $149,999 | 2 (10.5%) | 6 (14.6%) |
| $150,000 or more | 2 (10.5%) | 13 (31.7%) |
| Total | 19 (100.0%) | 41 (100.0%) |
Property Value to Household Income Ratio in Double Spring
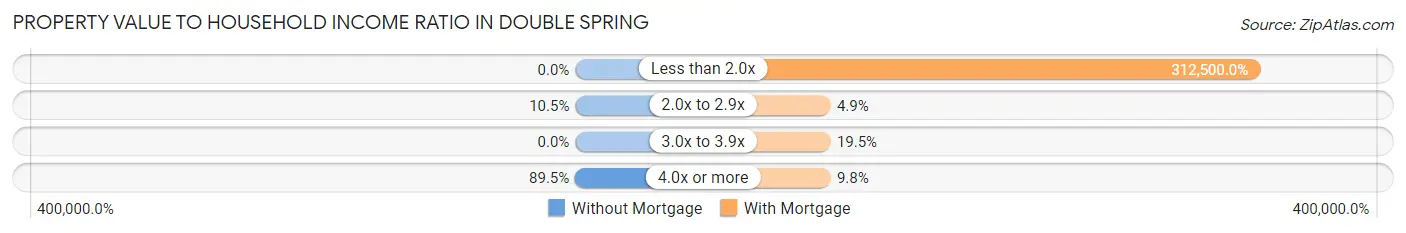
| Value-to-Income Ratio | Without Mortgage | With Mortgage |
| Less than 2.0x | 0 (0.0%) | 128,125 (312,500.0%) |
| 2.0x to 2.9x | 2 (10.5%) | 2 (4.9%) |
| 3.0x to 3.9x | 0 (0.0%) | 8 (19.5%) |
| 4.0x or more | 17 (89.5%) | 4 (9.8%) |
| Total | 19 (100.0%) | 41 (100.0%) |
Real Estate Taxes by Mortgage Status in Double Spring
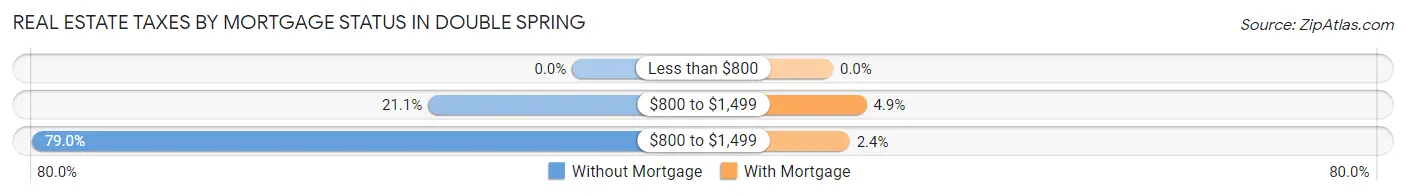
| Property Taxes | Without Mortgage | With Mortgage |
| Less than $800 | 0 (0.0%) | 0 (0.0%) |
| $800 to $1,499 | 4 (21.0%) | 2 (4.9%) |
| $800 to $1,499 | 15 (78.9%) | 1 (2.4%) |
| Total | 19 (100.0%) | 41 (100.0%) |
Health & Disability in Double Spring
Health Insurance Coverage by Age in Double Spring
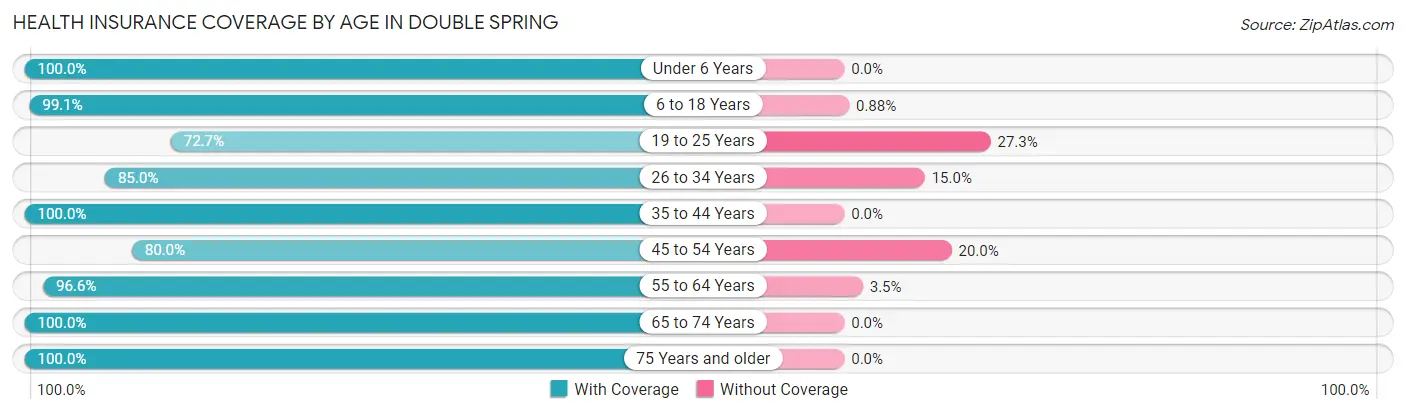
| Age Bracket | With Coverage | Without Coverage |
| Under 6 Years | 7 (100.0%) | 0 (0.0%) |
| 6 to 18 Years | 113 (99.1%) | 1 (0.9%) |
| 19 to 25 Years | 8 (72.7%) | 3 (27.3%) |
| 26 to 34 Years | 34 (85.0%) | 6 (15.0%) |
| 35 to 44 Years | 14 (100.0%) | 0 (0.0%) |
| 45 to 54 Years | 4 (80.0%) | 1 (20.0%) |
| 55 to 64 Years | 28 (96.6%) | 1 (3.5%) |
| 65 to 74 Years | 47 (100.0%) | 0 (0.0%) |
| 75 Years and older | 9 (100.0%) | 0 (0.0%) |
| Total | 264 (95.7%) | 12 (4.3%) |
Health Insurance Coverage by Citizenship Status in Double Spring
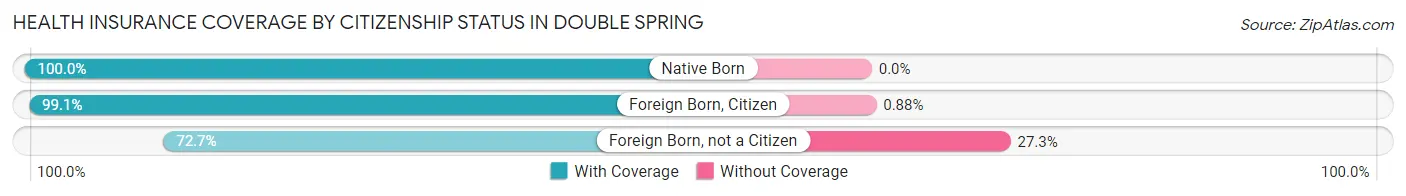
| Citizenship Status | With Coverage | Without Coverage |
| Native Born | 7 (100.0%) | 0 (0.0%) |
| Foreign Born, Citizen | 113 (99.1%) | 1 (0.9%) |
| Foreign Born, not a Citizen | 8 (72.7%) | 3 (27.3%) |
Health Insurance Coverage by Household Income in Double Spring
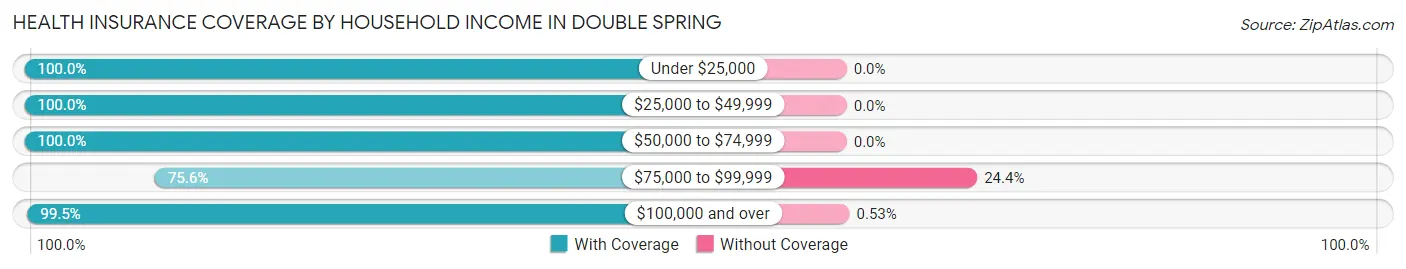
| Household Income | With Coverage | Without Coverage |
| Under $25,000 | 4 (100.0%) | 0 (0.0%) |
| $25,000 to $49,999 | 9 (100.0%) | 0 (0.0%) |
| $50,000 to $74,999 | 30 (100.0%) | 0 (0.0%) |
| $75,000 to $99,999 | 34 (75.6%) | 11 (24.4%) |
| $100,000 and over | 187 (99.5%) | 1 (0.5%) |
Public vs Private Health Insurance Coverage by Age in Double Spring
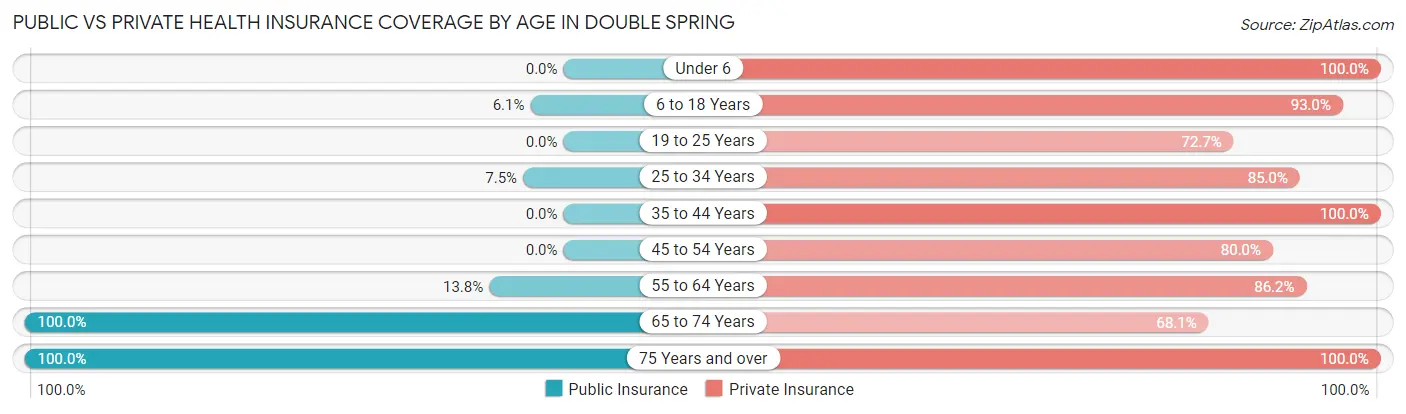
| Age Bracket | Public Insurance | Private Insurance |
| Under 6 | 0 (0.0%) | 7 (100.0%) |
| 6 to 18 Years | 7 (6.1%) | 106 (93.0%) |
| 19 to 25 Years | 0 (0.0%) | 8 (72.7%) |
| 25 to 34 Years | 3 (7.5%) | 34 (85.0%) |
| 35 to 44 Years | 0 (0.0%) | 14 (100.0%) |
| 45 to 54 Years | 0 (0.0%) | 4 (80.0%) |
| 55 to 64 Years | 4 (13.8%) | 25 (86.2%) |
| 65 to 74 Years | 47 (100.0%) | 32 (68.1%) |
| 75 Years and over | 9 (100.0%) | 9 (100.0%) |
| Total | 70 (25.4%) | 239 (86.6%) |
Disability Status by Sex by Age in Double Spring
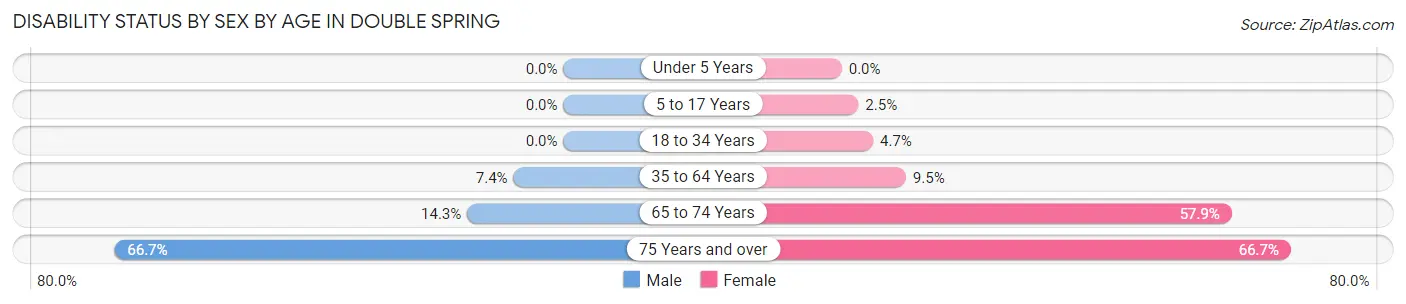
| Age Bracket | Male | Female |
| Under 5 Years | 0 (0.0%) | 0 (0.0%) |
| 5 to 17 Years | 0 (0.0%) | 2 (2.5%) |
| 18 to 34 Years | 0 (0.0%) | 2 (4.6%) |
| 35 to 64 Years | 2 (7.4%) | 2 (9.5%) |
| 65 to 74 Years | 4 (14.3%) | 11 (57.9%) |
| 75 Years and over | 4 (66.7%) | 2 (66.7%) |
Disability Class by Sex by Age in Double Spring
Disability Class: Hearing Difficulty
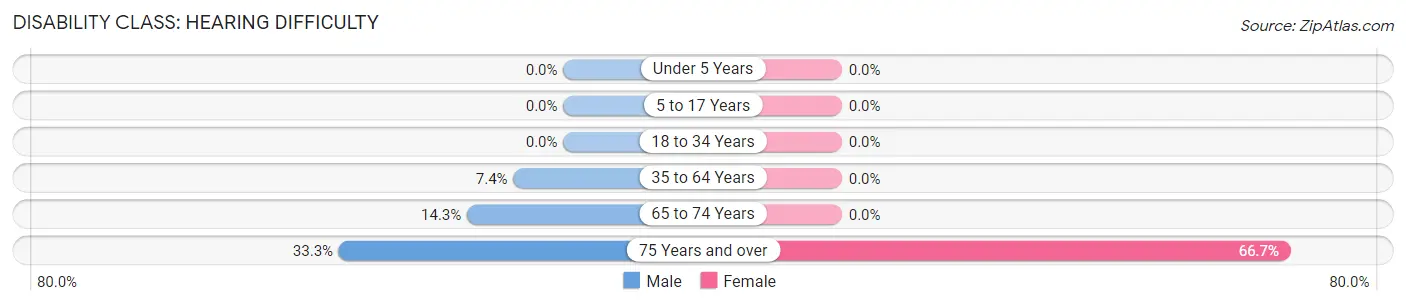
| Age Bracket | Male | Female |
| Under 5 Years | 0 (0.0%) | 0 (0.0%) |
| 5 to 17 Years | 0 (0.0%) | 0 (0.0%) |
| 18 to 34 Years | 0 (0.0%) | 0 (0.0%) |
| 35 to 64 Years | 2 (7.4%) | 0 (0.0%) |
| 65 to 74 Years | 4 (14.3%) | 0 (0.0%) |
| 75 Years and over | 2 (33.3%) | 2 (66.7%) |
Disability Class: Vision Difficulty
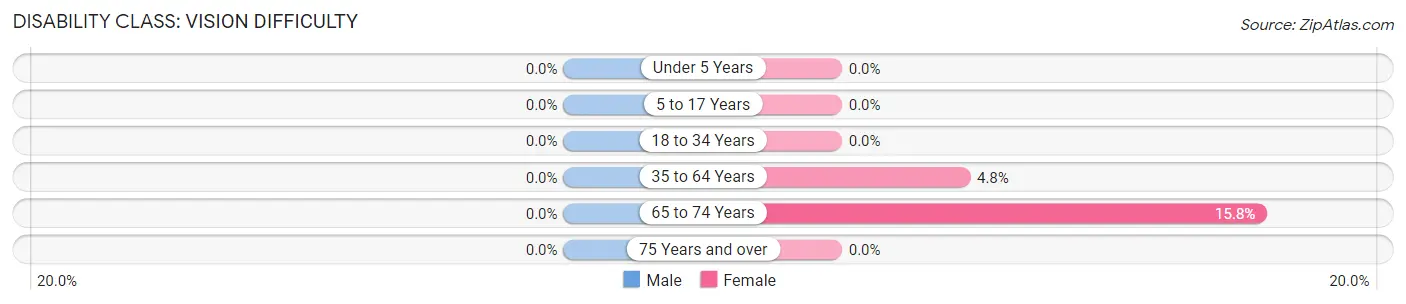
| Age Bracket | Male | Female |
| Under 5 Years | 0 (0.0%) | 0 (0.0%) |
| 5 to 17 Years | 0 (0.0%) | 0 (0.0%) |
| 18 to 34 Years | 0 (0.0%) | 0 (0.0%) |
| 35 to 64 Years | 0 (0.0%) | 1 (4.8%) |
| 65 to 74 Years | 0 (0.0%) | 3 (15.8%) |
| 75 Years and over | 0 (0.0%) | 0 (0.0%) |
Disability Class: Cognitive Difficulty
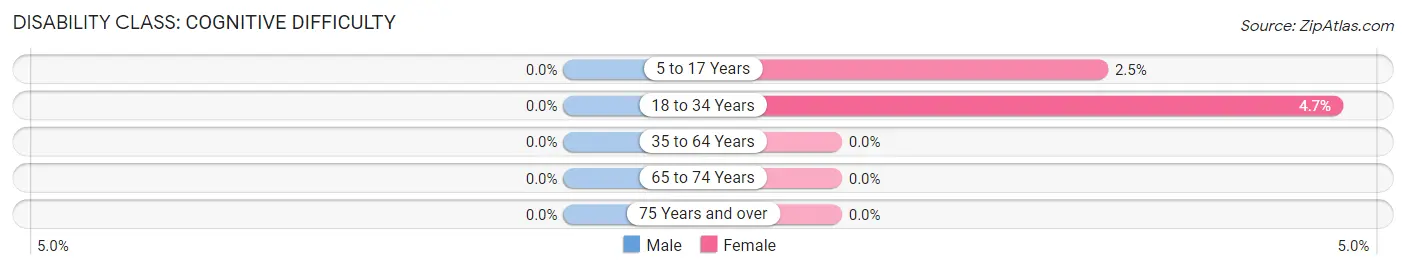
| Age Bracket | Male | Female |
| 5 to 17 Years | 0 (0.0%) | 2 (2.5%) |
| 18 to 34 Years | 0 (0.0%) | 2 (4.6%) |
| 35 to 64 Years | 0 (0.0%) | 0 (0.0%) |
| 65 to 74 Years | 0 (0.0%) | 0 (0.0%) |
| 75 Years and over | 0 (0.0%) | 0 (0.0%) |
Disability Class: Ambulatory Difficulty
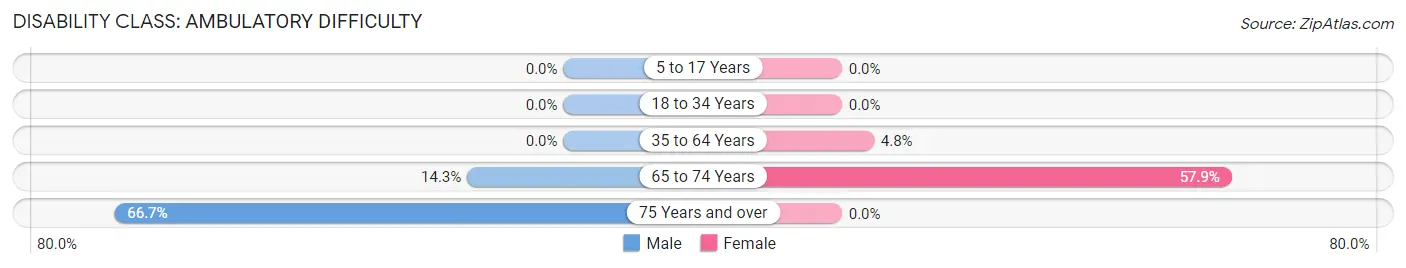
| Age Bracket | Male | Female |
| 5 to 17 Years | 0 (0.0%) | 0 (0.0%) |
| 18 to 34 Years | 0 (0.0%) | 0 (0.0%) |
| 35 to 64 Years | 0 (0.0%) | 1 (4.8%) |
| 65 to 74 Years | 4 (14.3%) | 11 (57.9%) |
| 75 Years and over | 4 (66.7%) | 0 (0.0%) |
Disability Class: Self-Care Difficulty
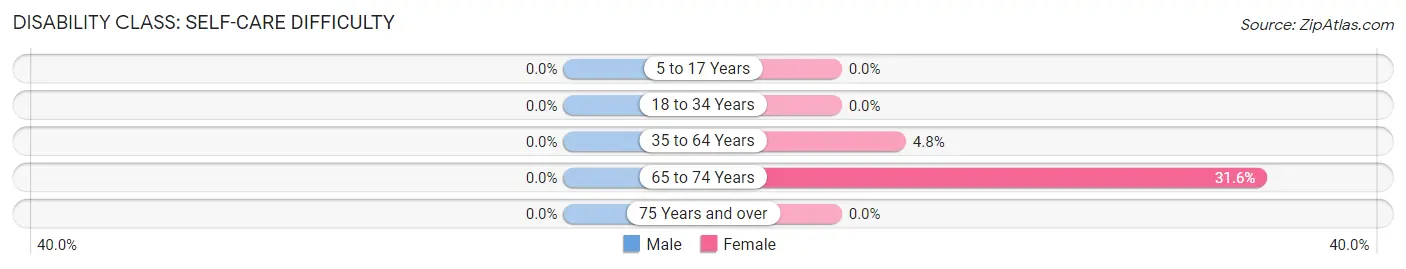
| Age Bracket | Male | Female |
| 5 to 17 Years | 0 (0.0%) | 0 (0.0%) |
| 18 to 34 Years | 0 (0.0%) | 0 (0.0%) |
| 35 to 64 Years | 0 (0.0%) | 1 (4.8%) |
| 65 to 74 Years | 0 (0.0%) | 6 (31.6%) |
| 75 Years and over | 0 (0.0%) | 0 (0.0%) |
Technology Access in Double Spring
Computing Device Access in Double Spring
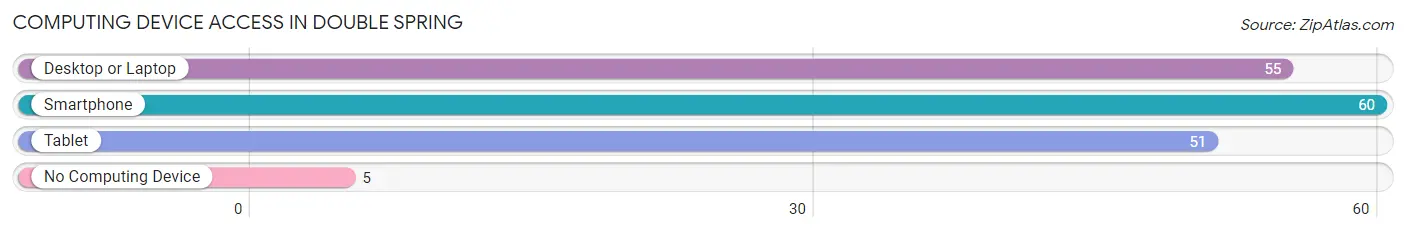
| Device Type | # Households | % Households |
| Desktop or Laptop | 55 | 80.9% |
| Smartphone | 60 | 88.2% |
| Tablet | 51 | 75.0% |
| No Computing Device | 5 | 7.3% |
| Total | 68 | 100.0% |
Internet Access in Double Spring
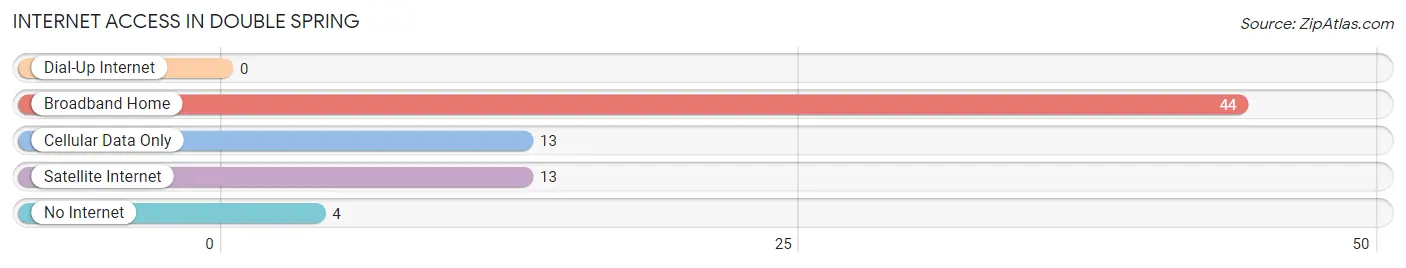
| Internet Type | # Households | % Households |
| Dial-Up Internet | 0 | 0.0% |
| Broadband Home | 44 | 64.7% |
| Cellular Data Only | 13 | 19.1% |
| Satellite Internet | 13 | 19.1% |
| No Internet | 4 | 5.9% |
| Total | 68 | 100.0% |
Double Spring Summary
Spring, Nevada is a small unincorporated community located in the northern part of the state, approximately 25 miles north of Reno. It is situated in the foothills of the Sierra Nevada Mountains, and is surrounded by the Humboldt-Toiyabe National Forest. The area is known for its natural beauty, and is home to a variety of wildlife, including deer, elk, and mountain lions.
History
The area that is now known as Double Spring was first settled in the late 1800s by ranchers and miners. The town was originally called “Double Springs” due to the two natural springs that were located nearby. The springs were used by the early settlers for drinking water and irrigation.
In the early 1900s, the town was renamed “Double Spring” and the post office was established in 1906. The town grew slowly over the years, and by the 1950s, it had a population of around 200 people.
Geography
Double Spring is located in the northern part of Nevada, approximately 25 miles north of Reno. It is situated in the foothills of the Sierra Nevada Mountains, and is surrounded by the Humboldt-Toiyabe National Forest. The area is known for its natural beauty, and is home to a variety of wildlife, including deer, elk, and mountain lions.
The climate in Double Spring is semi-arid, with hot summers and cold winters. The average annual temperature is around 50 degrees Fahrenheit, and the average annual precipitation is around 10 inches.
Economy
The economy of Double Spring is largely based on tourism and recreation. The area is popular with hikers, campers, and hunters, and there are several nearby ski resorts. The town also has a few small businesses, including a general store, a gas station, and a restaurant.
Demographics
As of the 2010 census, the population of Double Spring was 545. The racial makeup of the town was 95.2% White, 0.7% African American, 0.7% Native American, 0.4% Asian, 0.2% Pacific Islander, and 2.0% from other races. The median household income was $41,250, and the median family income was $45,625.
Conclusion
Double Spring, Nevada is a small unincorporated community located in the northern part of the state, approximately 25 miles north of Reno. It is situated in the foothills of the Sierra Nevada Mountains, and is surrounded by the Humboldt-Toiyabe National Forest. The area is known for its natural beauty, and is home to a variety of wildlife, including deer, elk, and mountain lions. The economy of Double Spring is largely based on tourism and recreation, and the town has a population of around 545 people.
Common Questions
What is Per Capita Income in Double Spring?
Per Capita income in Double Spring is $36,164.
What is the Median Family Income in Double Spring?
Median Family Income in Double Spring is $101,875.
What is the Median Household income in Double Spring?
Median Household Income in Double Spring is $100,417.
What is Income or Wage Gap in Double Spring?
Income or Wage Gap in Double Spring is 21.5%.
Women in Double Spring earn 78.5 cents for every dollar earned by a man.
What is Inequality or Gini Index in Double Spring?
Inequality or Gini Index in Double Spring is 0.34.
What is the Total Population of Double Spring?
Total Population of Double Spring is 276.
What is the Total Male Population of Double Spring?
Total Male Population of Double Spring is 107.
What is the Total Female Population of Double Spring?
Total Female Population of Double Spring is 169.
What is the Ratio of Males per 100 Females in Double Spring?
There are 63.31 Males per 100 Females in Double Spring.
What is the Ratio of Females per 100 Males in Double Spring?
There are 157.94 Females per 100 Males in Double Spring.
What is the Median Population Age in Double Spring?
Median Population Age in Double Spring is 30.0 Years.
What is the Average Family Size in Double Spring
Average Family Size in Double Spring is 4.3 People.
What is the Average Household Size in Double Spring
Average Household Size in Double Spring is 4.1 People.
How Large is the Labor Force in Double Spring?
There are 87 People in the Labor Forcein in Double Spring.
What is the Percentage of People in the Labor Force in Double Spring?
51.2% of People are in the Labor Force in Double Spring.
What is the Unemployment Rate in Double Spring?
Unemployment Rate in Double Spring is 13.8%.