Lemmon Valley, NV Map & Demographics
Lemmon Valley Map
Lemmon Valley Overview
$36,290
PER CAPITA INCOME
$86,969
AVG FAMILY INCOME
$87,052
AVG HOUSEHOLD INCOME
24.3%
WAGE / INCOME GAP [ % ]
75.7¢/ $1
WAGE / INCOME GAP [ $ ]
0.34
INEQUALITY / GINI INDEX
5,221
TOTAL POPULATION
2,919
MALE POPULATION
2,302
FEMALE POPULATION
126.80
MALES / 100 FEMALES
78.86
FEMALES / 100 MALES
43.1
MEDIAN AGE
3.1
AVG FAMILY SIZE
2.6
AVG HOUSEHOLD SIZE
2,892
LABOR FORCE [ PEOPLE ]
64.9%
PERCENT IN LABOR FORCE
0.9%
UNEMPLOYMENT RATE
Income in Lemmon Valley
Income Overview in Lemmon Valley
Per Capita Income in Lemmon Valley is $36,290, while median incomes of families and households are $86,969 and $87,052 respectively.
| Characteristic | Number | Measure |
| Per Capita Income | 5,221 | $36,290 |
| Median Family Income | 1,357 | $86,969 |
| Mean Family Income | 1,357 | $97,838 |
| Median Household Income | 1,982 | $87,052 |
| Mean Household Income | 1,982 | $90,974 |
| Income Deficit | 1,357 | $0 |
| Wage / Income Gap (%) | 5,221 | 24.32% |
| Wage / Income Gap ($) | 5,221 | 75.68¢ per $1 |
| Gini / Inequality Index | 5,221 | 0.34 |
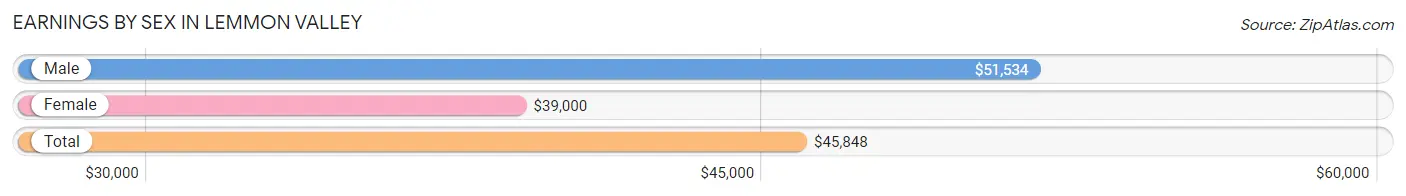
Earnings by Sex in Lemmon Valley
Average Earnings in Lemmon Valley are $45,848, $51,534 for men and $39,000 for women, a difference of 24.3%.
| Sex | Number | Average Earnings |
| Male | 1,698 (56.8%) | $51,534 |
| Female | 1,294 (43.2%) | $39,000 |
| Total | 2,992 (100.0%) | $45,848 |
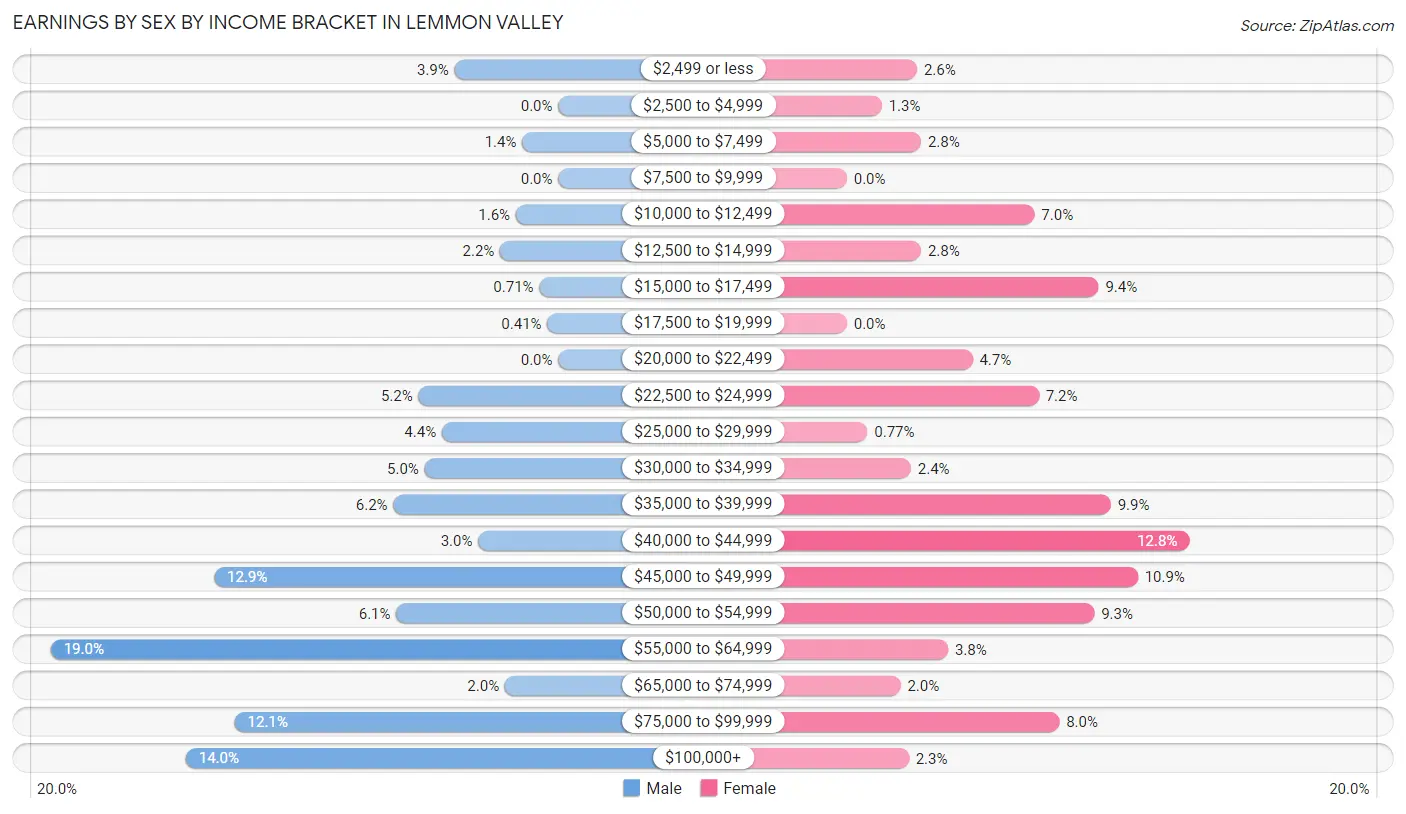
Earnings by Sex by Income Bracket in Lemmon Valley
The most common earnings brackets in Lemmon Valley are $55,000 to $64,999 for men (323 | 19.0%) and $40,000 to $44,999 for women (166 | 12.8%).
| Income | Male | Female |
| $2,499 or less | 66 (3.9%) | 34 (2.6%) |
| $2,500 to $4,999 | 0 (0.0%) | 17 (1.3%) |
| $5,000 to $7,499 | 23 (1.3%) | 36 (2.8%) |
| $7,500 to $9,999 | 0 (0.0%) | 0 (0.0%) |
| $10,000 to $12,499 | 27 (1.6%) | 91 (7.0%) |
| $12,500 to $14,999 | 37 (2.2%) | 36 (2.8%) |
| $15,000 to $17,499 | 12 (0.7%) | 122 (9.4%) |
| $17,500 to $19,999 | 7 (0.4%) | 0 (0.0%) |
| $20,000 to $22,499 | 0 (0.0%) | 61 (4.7%) |
| $22,500 to $24,999 | 89 (5.2%) | 93 (7.2%) |
| $25,000 to $29,999 | 74 (4.4%) | 10 (0.8%) |
| $30,000 to $34,999 | 85 (5.0%) | 31 (2.4%) |
| $35,000 to $39,999 | 105 (6.2%) | 128 (9.9%) |
| $40,000 to $44,999 | 51 (3.0%) | 166 (12.8%) |
| $45,000 to $49,999 | 219 (12.9%) | 141 (10.9%) |
| $50,000 to $54,999 | 103 (6.1%) | 120 (9.3%) |
| $55,000 to $64,999 | 323 (19.0%) | 49 (3.8%) |
| $65,000 to $74,999 | 34 (2.0%) | 26 (2.0%) |
| $75,000 to $99,999 | 206 (12.1%) | 103 (8.0%) |
| $100,000+ | 237 (14.0%) | 30 (2.3%) |
| Total | 1,698 (100.0%) | 1,294 (100.0%) |
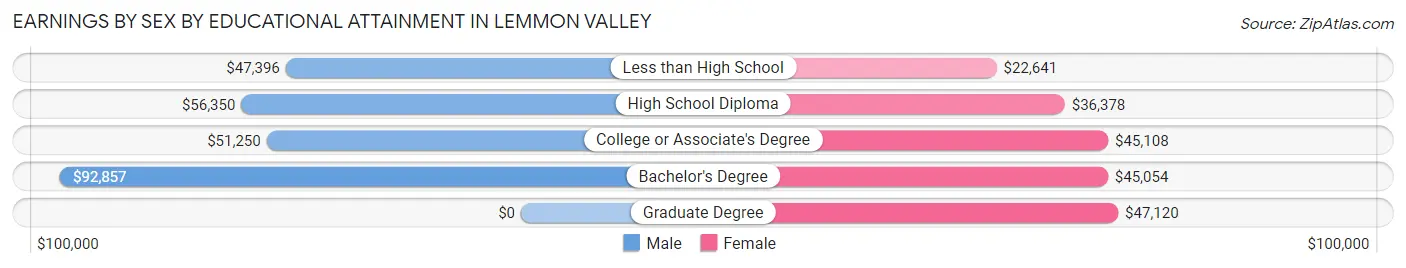
Earnings by Sex by Educational Attainment in Lemmon Valley
Average earnings in Lemmon Valley are $55,713 for men and $41,584 for women, a difference of 25.4%. Men with an educational attainment of bachelor's degree enjoy the highest average annual earnings of $92,857, while those with less than high school education earn the least with $47,396. Women with an educational attainment of graduate degree earn the most with the average annual earnings of $47,120, while those with less than high school education have the smallest earnings of $22,641.
| Educational Attainment | Male Income | Female Income |
| Less than High School | $47,396 | $22,641 |
| High School Diploma | $56,350 | $36,378 |
| College or Associate's Degree | $51,250 | $45,108 |
| Bachelor's Degree | $92,857 | $45,054 |
| Graduate Degree | - | - |
| Total | $55,713 | $41,584 |
Family Income in Lemmon Valley
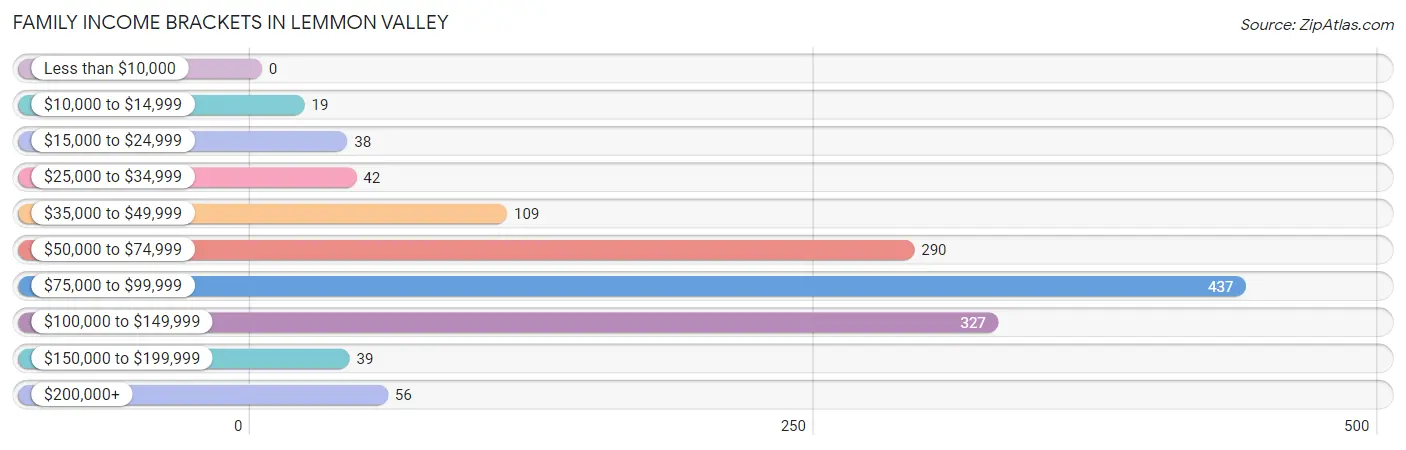
Family Income Brackets in Lemmon Valley
According to the Lemmon Valley family income data, there are 437 families falling into the $75,000 to $99,999 income range, which is the most common income bracket and makes up 32.2% of all families.
| Income Bracket | # Families | % Families |
| Less than $10,000 | 0 | 0.0% |
| $10,000 to $14,999 | 19 | 1.4% |
| $15,000 to $24,999 | 38 | 2.8% |
| $25,000 to $34,999 | 42 | 3.1% |
| $35,000 to $49,999 | 109 | 8.0% |
| $50,000 to $74,999 | 290 | 21.4% |
| $75,000 to $99,999 | 437 | 32.2% |
| $100,000 to $149,999 | 327 | 24.1% |
| $150,000 to $199,999 | 39 | 2.9% |
| $200,000+ | 56 | 4.1% |
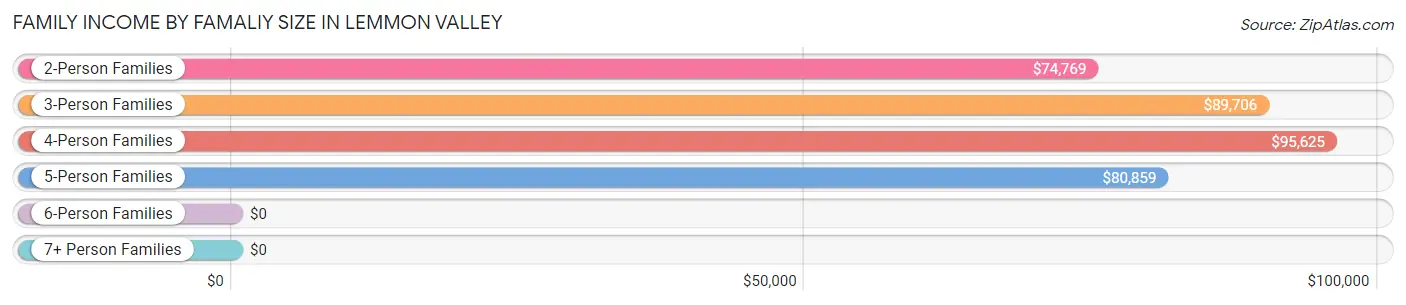
Family Income by Famaliy Size in Lemmon Valley
4-person families (321 | 23.7%) account for the highest median family income in Lemmon Valley with $95,625 per family, while 2-person families (595 | 43.9%) have the highest median income of $37,384 per family member.
| Income Bracket | # Families | Median Income |
| 2-Person Families | 595 (43.9%) | $74,769 |
| 3-Person Families | 280 (20.6%) | $89,706 |
| 4-Person Families | 321 (23.7%) | $95,625 |
| 5-Person Families | 161 (11.9%) | $80,859 |
| 6-Person Families | 0 (0.0%) | $0 |
| 7+ Person Families | 0 (0.0%) | $0 |
| Total | 1,357 (100.0%) | $86,969 |
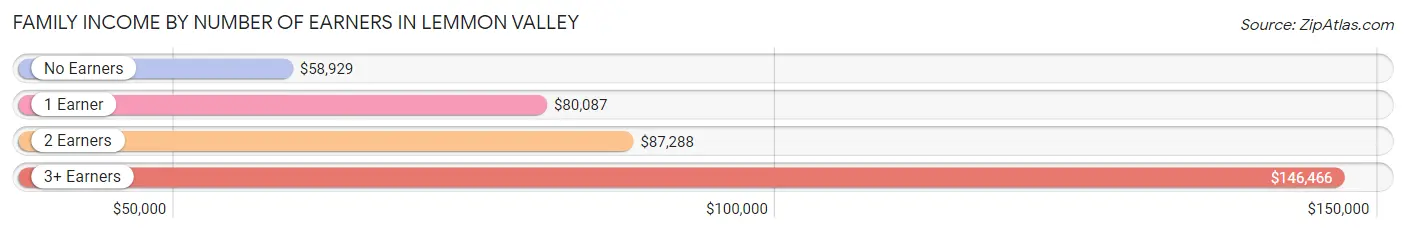
Family Income by Number of Earners in Lemmon Valley
The median family income in Lemmon Valley is $86,969, with families comprising 3+ earners (152) having the highest median family income of $146,466, while families with no earners (96) have the lowest median family income of $58,929, accounting for 11.2% and 7.1% of families, respectively.
| Number of Earners | # Families | Median Income |
| No Earners | 96 (7.1%) | $58,929 |
| 1 Earner | 573 (42.2%) | $80,087 |
| 2 Earners | 536 (39.5%) | $87,288 |
| 3+ Earners | 152 (11.2%) | $146,466 |
| Total | 1,357 (100.0%) | $86,969 |
Household Income in Lemmon Valley
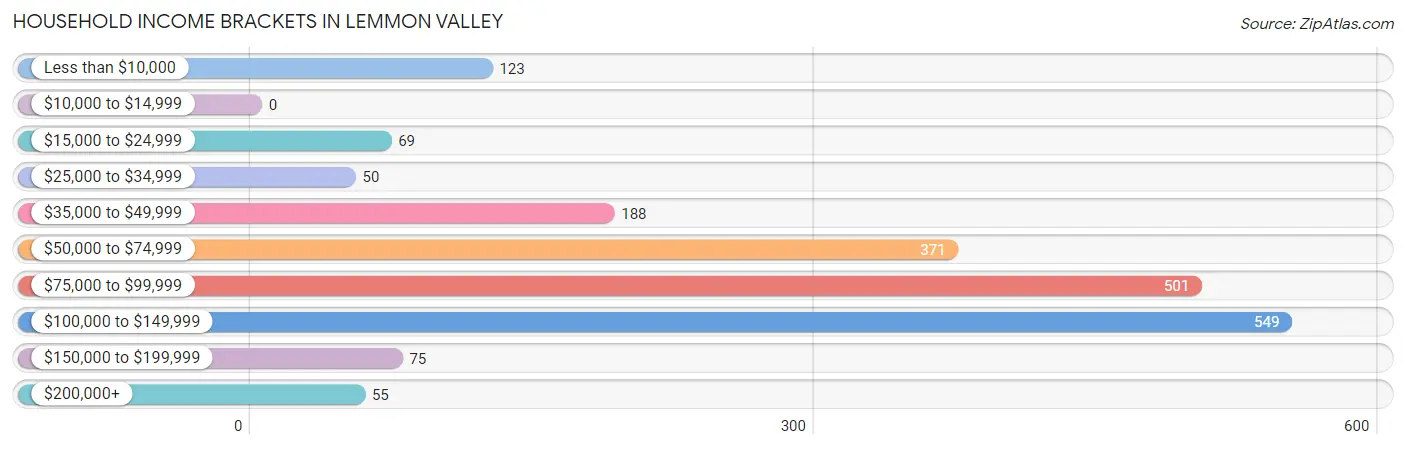
Household Income Brackets in Lemmon Valley
With 549 households falling in the category, the $100,000 to $149,999 income range is the most frequent in Lemmon Valley, accounting for 27.7% of all households.
| Income Bracket | # Households | % Households |
| Less than $10,000 | 123 | 6.2% |
| $10,000 to $14,999 | 0 | 0.0% |
| $15,000 to $24,999 | 69 | 3.5% |
| $25,000 to $34,999 | 50 | 2.5% |
| $35,000 to $49,999 | 188 | 9.5% |
| $50,000 to $74,999 | 371 | 18.7% |
| $75,000 to $99,999 | 501 | 25.3% |
| $100,000 to $149,999 | 549 | 27.7% |
| $150,000 to $199,999 | 75 | 3.8% |
| $200,000+ | 55 | 2.8% |
Household Income by Householder Age in Lemmon Valley
The median household income in Lemmon Valley is $87,052, with the highest median household income of $93,538 found in the 25 to 44 years age bracket for the primary householder. A total of 559 households (28.2%) fall into this category. Meanwhile, the 15 to 24 years age bracket for the primary householder has the lowest median household income of $0, with 29 households (1.5%) in this group.
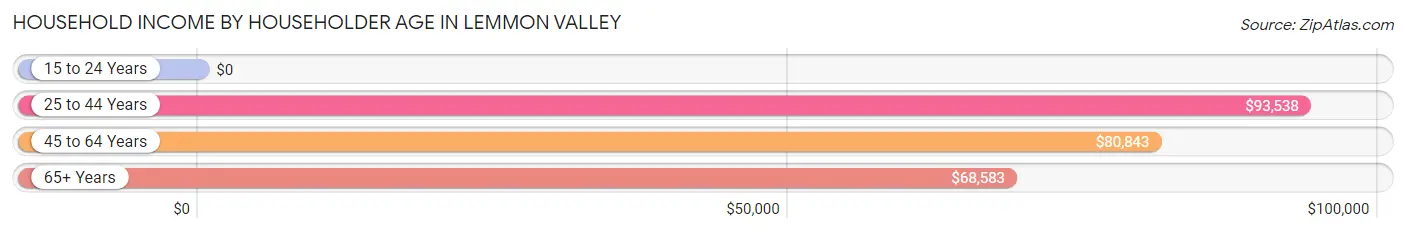
| Income Bracket | # Households | Median Income |
| 15 to 24 Years | 29 (1.5%) | $0 |
| 25 to 44 Years | 559 (28.2%) | $93,538 |
| 45 to 64 Years | 807 (40.7%) | $80,843 |
| 65+ Years | 587 (29.6%) | $68,583 |
| Total | 1,982 (100.0%) | $87,052 |
Poverty in Lemmon Valley
Income Below Poverty by Sex and Age in Lemmon Valley
With 4.4% poverty level for males and 6.2% for females among the residents of Lemmon Valley, 18 to 24 year old males and 75 year old and over females are the most vulnerable to poverty, with 54 males (27.8%) and 73 females (62.9%) in their respective age groups living below the poverty level.
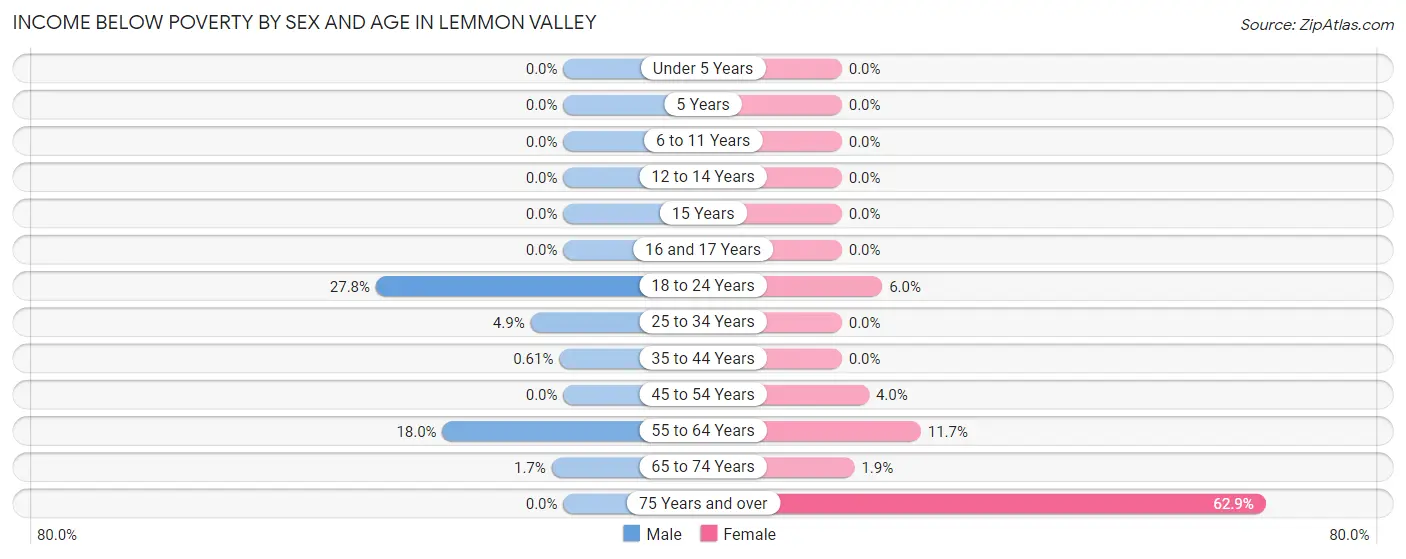
| Age Bracket | Male | Female |
| Under 5 Years | 0 (0.0%) | 0 (0.0%) |
| 5 Years | 0 (0.0%) | 0 (0.0%) |
| 6 to 11 Years | 0 (0.0%) | 0 (0.0%) |
| 12 to 14 Years | 0 (0.0%) | 0 (0.0%) |
| 15 Years | 0 (0.0%) | 0 (0.0%) |
| 16 and 17 Years | 0 (0.0%) | 0 (0.0%) |
| 18 to 24 Years | 54 (27.8%) | 9 (6.0%) |
| 25 to 34 Years | 21 (4.9%) | 0 (0.0%) |
| 35 to 44 Years | 3 (0.6%) | 0 (0.0%) |
| 45 to 54 Years | 0 (0.0%) | 19 (4.0%) |
| 55 to 64 Years | 42 (17.9%) | 36 (11.7%) |
| 65 to 74 Years | 9 (1.7%) | 6 (1.9%) |
| 75 Years and over | 0 (0.0%) | 73 (62.9%) |
| Total | 129 (4.4%) | 143 (6.2%) |
Income Above Poverty by Sex and Age in Lemmon Valley
According to the poverty statistics in Lemmon Valley, males aged under 5 years and females aged under 5 years are the age groups that are most secure financially, with 100.0% of males and 100.0% of females in these age groups living above the poverty line.
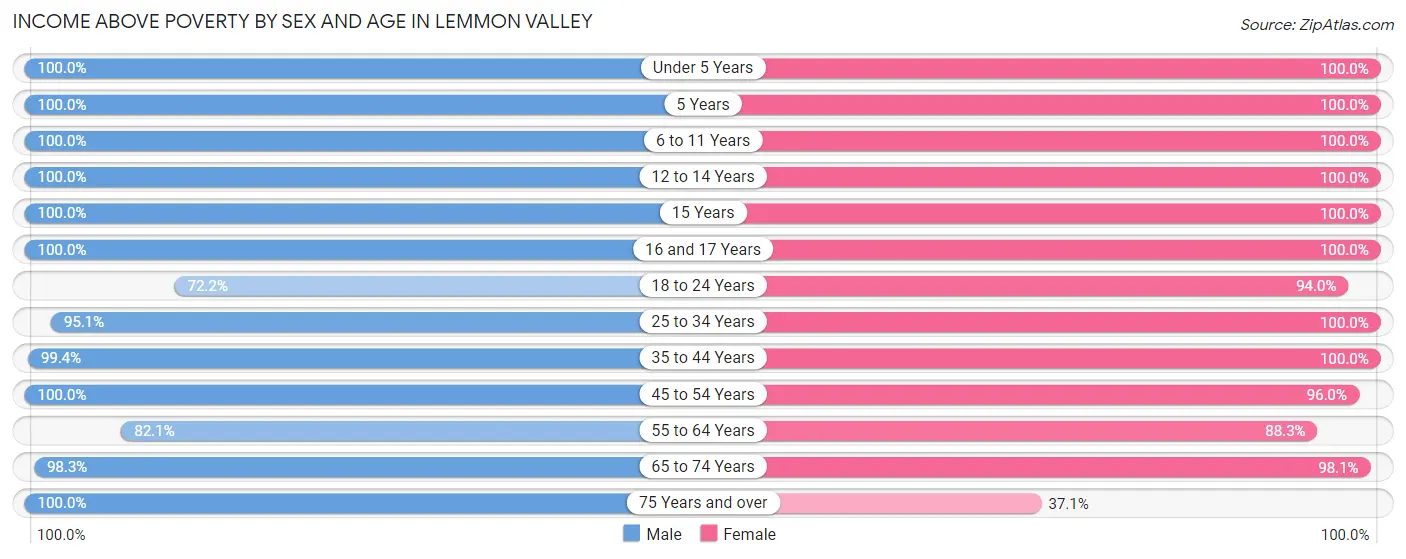
| Age Bracket | Male | Female |
| Under 5 Years | 11 (100.0%) | 51 (100.0%) |
| 5 Years | 27 (100.0%) | 42 (100.0%) |
| 6 to 11 Years | 189 (100.0%) | 132 (100.0%) |
| 12 to 14 Years | 137 (100.0%) | 45 (100.0%) |
| 15 Years | 80 (100.0%) | 39 (100.0%) |
| 16 and 17 Years | 80 (100.0%) | 52 (100.0%) |
| 18 to 24 Years | 140 (72.2%) | 141 (94.0%) |
| 25 to 34 Years | 409 (95.1%) | 371 (100.0%) |
| 35 to 44 Years | 485 (99.4%) | 194 (100.0%) |
| 45 to 54 Years | 477 (100.0%) | 453 (96.0%) |
| 55 to 64 Years | 192 (82.1%) | 271 (88.3%) |
| 65 to 74 Years | 508 (98.3%) | 313 (98.1%) |
| 75 Years and over | 55 (100.0%) | 43 (37.1%) |
| Total | 2,790 (95.6%) | 2,147 (93.8%) |
Income Below Poverty Among Married-Couple Families in Lemmon Valley
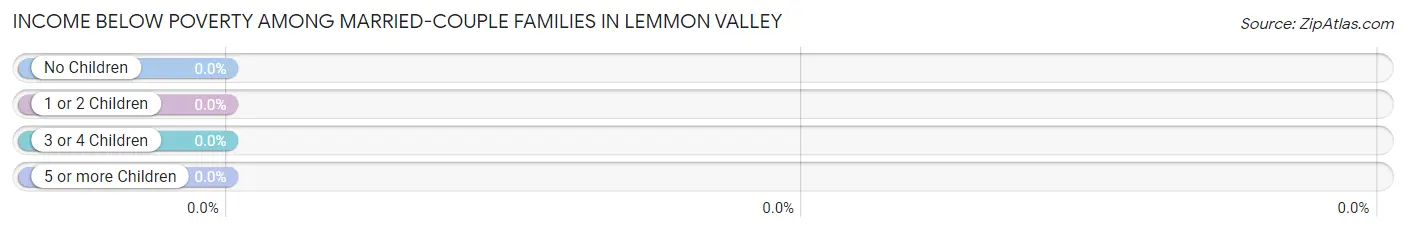
| Children | Above Poverty | Below Poverty |
| No Children | 665 (100.0%) | 0 (0.0%) |
| 1 or 2 Children | 491 (100.0%) | 0 (0.0%) |
| 3 or 4 Children | 0 (0.0%) | 0 (0.0%) |
| 5 or more Children | 0 (0.0%) | 0 (0.0%) |
| Total | 1,156 (100.0%) | 0 (0.0%) |
Income Below Poverty Among Single-Parent Households in Lemmon Valley
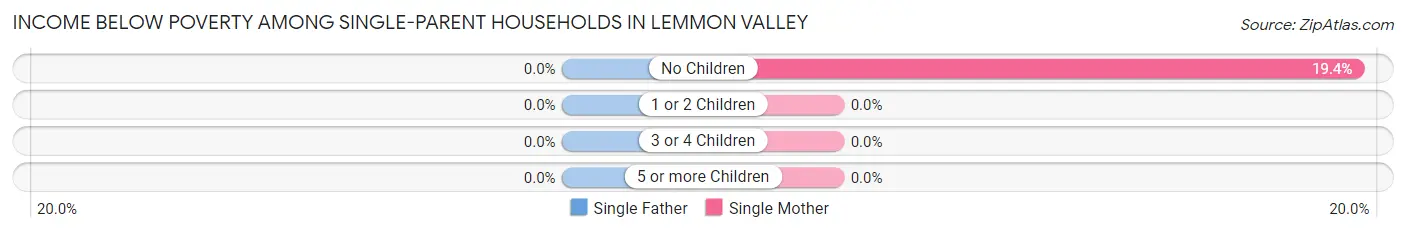
| Children | Single Father | Single Mother |
| No Children | 0 (0.0%) | 19 (19.4%) |
| 1 or 2 Children | 0 (0.0%) | 0 (0.0%) |
| 3 or 4 Children | 0 (0.0%) | 0 (0.0%) |
| 5 or more Children | 0 (0.0%) | 0 (0.0%) |
| Total | 0 (0.0%) | 19 (14.6%) |
Income Below Poverty Among Married-Couple vs Single-Parent Households in Lemmon Valley
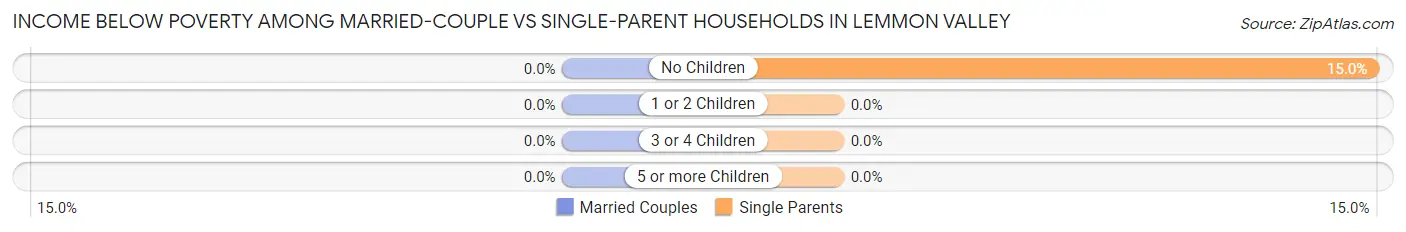
| Children | Married-Couple Families | Single-Parent Households |
| No Children | 0 (0.0%) | 19 (15.0%) |
| 1 or 2 Children | 0 (0.0%) | 0 (0.0%) |
| 3 or 4 Children | 0 (0.0%) | 0 (0.0%) |
| 5 or more Children | 0 (0.0%) | 0 (0.0%) |
| Total | 0 (0.0%) | 19 (9.5%) |
Race in Lemmon Valley
The most populous races in Lemmon Valley are White / Caucasian (4,251 | 81.4%), Hispanic or Latino (1,208 | 23.1%), and Some other Race (530 | 10.2%).
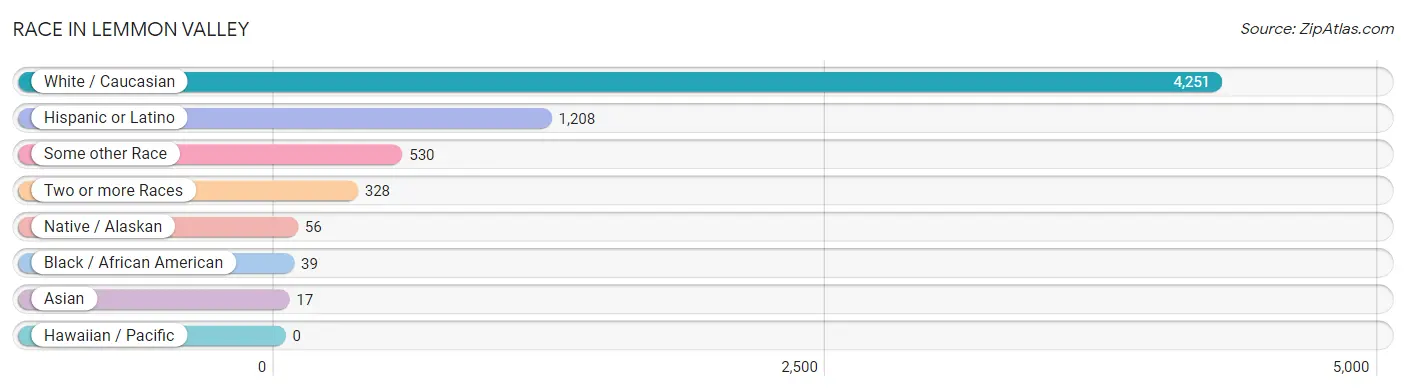
| Race | # Population | % Population |
| Asian | 17 | 0.3% |
| Black / African American | 39 | 0.7% |
| Hawaiian / Pacific | 0 | 0.0% |
| Hispanic or Latino | 1,208 | 23.1% |
| Native / Alaskan | 56 | 1.1% |
| White / Caucasian | 4,251 | 81.4% |
| Two or more Races | 328 | 6.3% |
| Some other Race | 530 | 10.2% |
| Total | 5,221 | 100.0% |
Ancestry in Lemmon Valley
The most populous ancestries reported in Lemmon Valley are Mexican (742 | 14.2%), German (592 | 11.3%), European (584 | 11.2%), English (530 | 10.2%), and Irish (506 | 9.7%), together accounting for 56.6% of all Lemmon Valley residents.
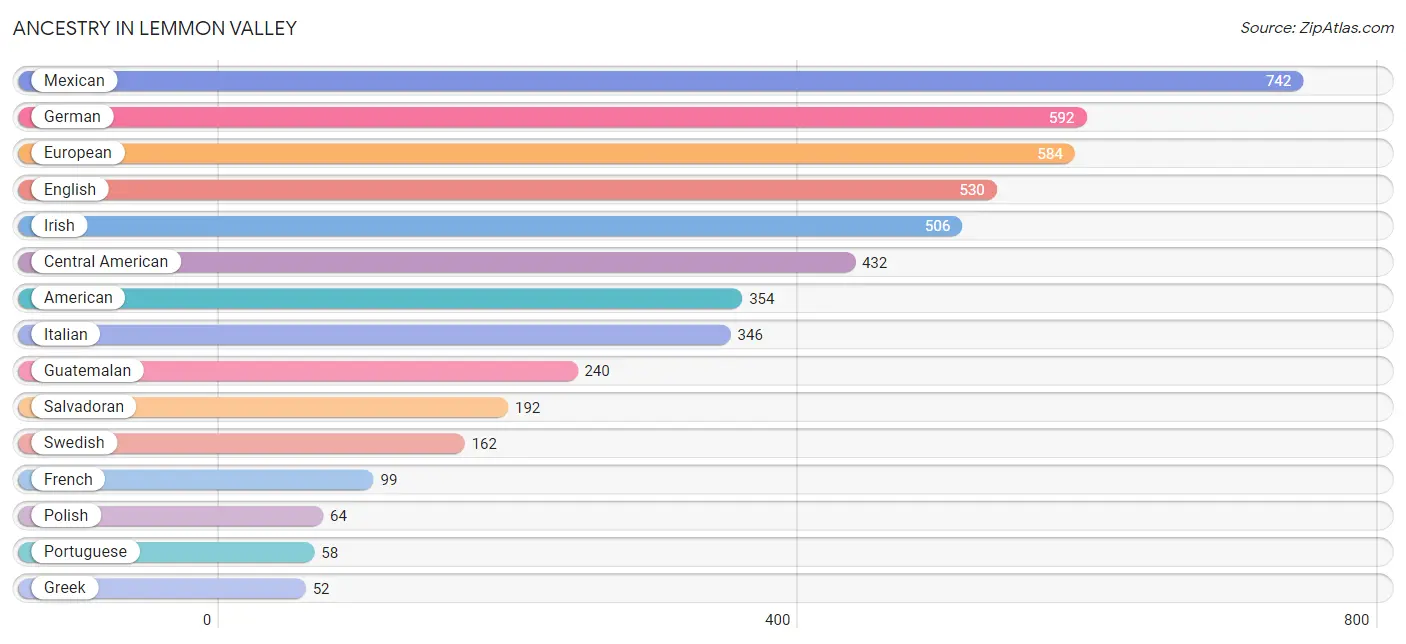
| Ancestry | # Population | % Population |
| American | 354 | 6.8% |
| Australian | 23 | 0.4% |
| Austrian | 46 | 0.9% |
| Central American | 432 | 8.3% |
| Czech | 10 | 0.2% |
| Danish | 13 | 0.3% |
| Dutch | 40 | 0.8% |
| English | 530 | 10.2% |
| European | 584 | 11.2% |
| Finnish | 16 | 0.3% |
| French | 99 | 1.9% |
| French Canadian | 9 | 0.2% |
| German | 592 | 11.3% |
| Greek | 52 | 1.0% |
| Guatemalan | 240 | 4.6% |
| Irish | 506 | 9.7% |
| Italian | 346 | 6.6% |
| Mexican | 742 | 14.2% |
| Pakistani | 40 | 0.8% |
| Polish | 64 | 1.2% |
| Portuguese | 58 | 1.1% |
| Puerto Rican | 34 | 0.6% |
| Romanian | 19 | 0.4% |
| Russian | 16 | 0.3% |
| Salvadoran | 192 | 3.7% |
| Scandinavian | 30 | 0.6% |
| Scotch-Irish | 14 | 0.3% |
| Scottish | 51 | 1.0% |
| Serbian | 9 | 0.2% |
| Shoshone | 5 | 0.1% |
| Swedish | 162 | 3.1% |
| Swiss | 47 | 0.9% |
| Welsh | 9 | 0.2% | View All 33 Rows |
Immigrants in Lemmon Valley
The most numerous immigrant groups reported in Lemmon Valley came from Central America (500 | 9.6%), Latin America (500 | 9.6%), Mexico (254 | 4.9%), Guatemala (126 | 2.4%), and El Salvador (120 | 2.3%), together accounting for 28.7% of all Lemmon Valley residents.
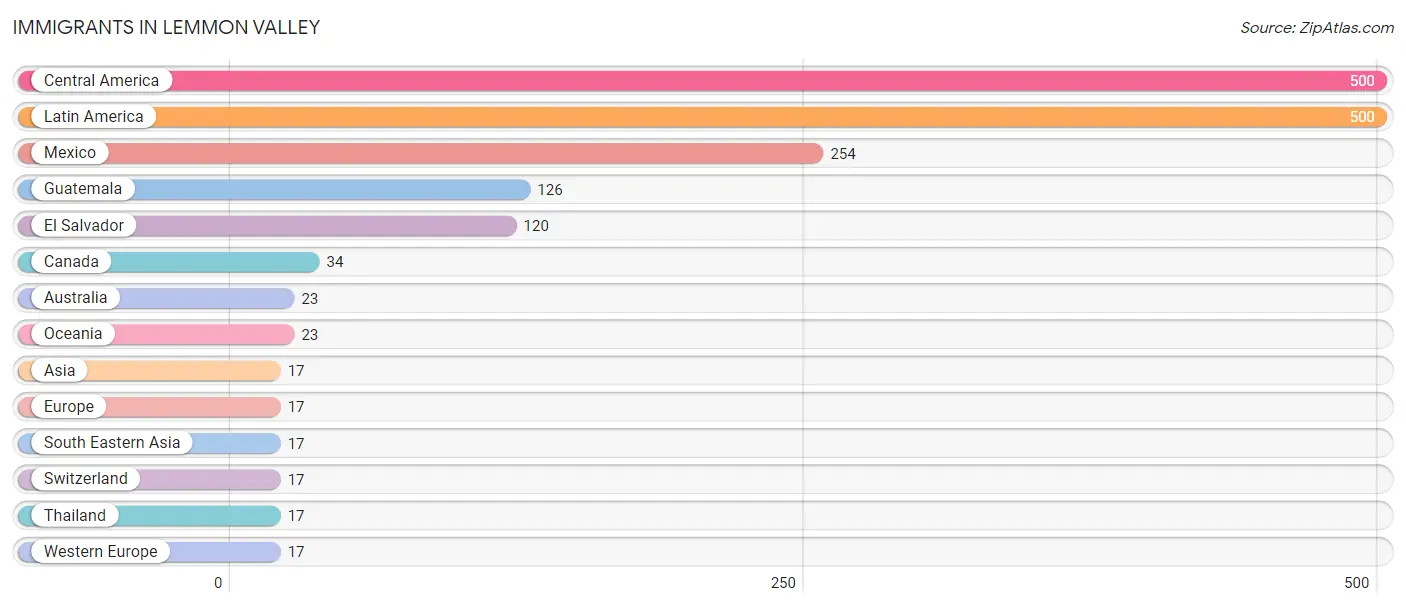
| Immigration Origin | # Population | % Population |
| Asia | 17 | 0.3% |
| Australia | 23 | 0.4% |
| Canada | 34 | 0.6% |
| Central America | 500 | 9.6% |
| El Salvador | 120 | 2.3% |
| Europe | 17 | 0.3% |
| Guatemala | 126 | 2.4% |
| Latin America | 500 | 9.6% |
| Mexico | 254 | 4.9% |
| Oceania | 23 | 0.4% |
| South Eastern Asia | 17 | 0.3% |
| Switzerland | 17 | 0.3% |
| Thailand | 17 | 0.3% |
| Western Europe | 17 | 0.3% | View All 14 Rows |
Sex and Age in Lemmon Valley
Sex and Age in Lemmon Valley
The most populous age groups in Lemmon Valley are 65 to 69 Years (423 | 14.5%) for men and 50 to 54 Years (285 | 12.4%) for women.
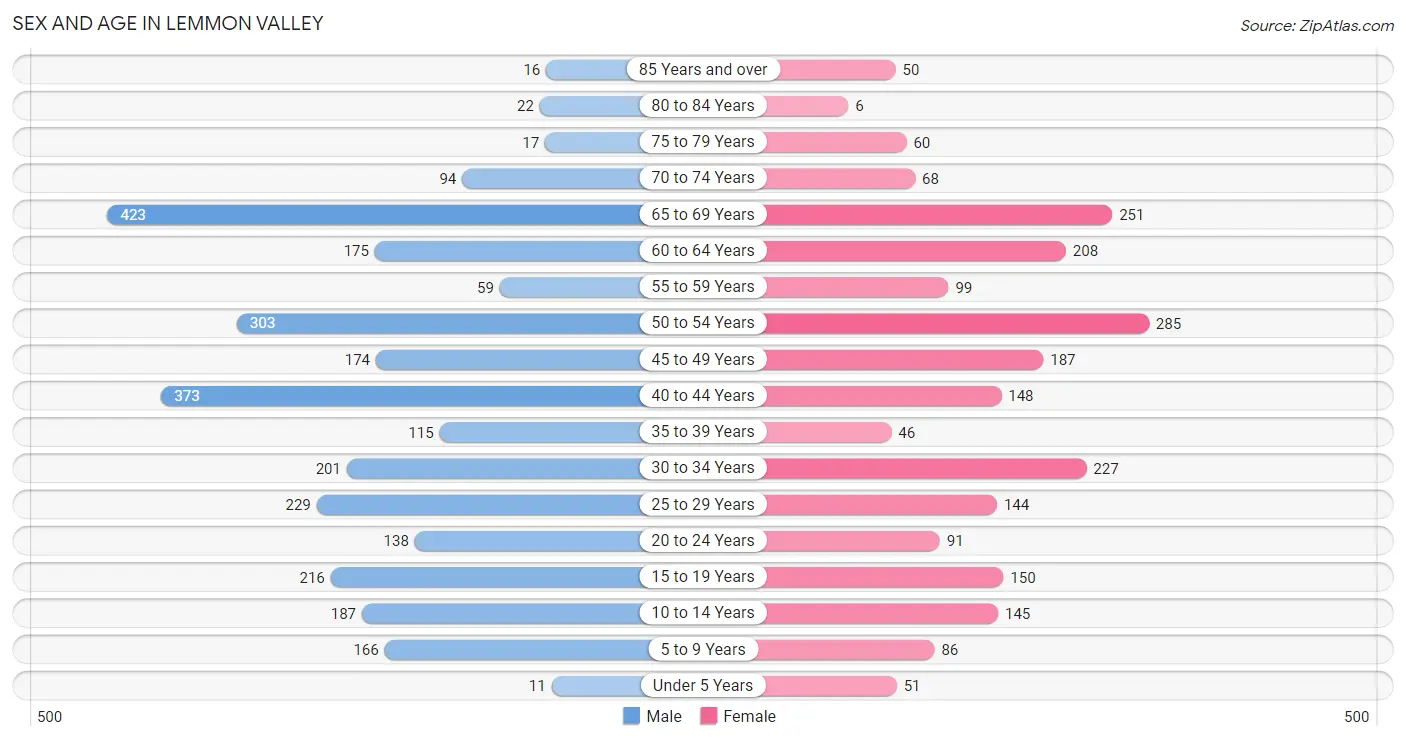
| Age Bracket | Male | Female |
| Under 5 Years | 11 (0.4%) | 51 (2.2%) |
| 5 to 9 Years | 166 (5.7%) | 86 (3.7%) |
| 10 to 14 Years | 187 (6.4%) | 145 (6.3%) |
| 15 to 19 Years | 216 (7.4%) | 150 (6.5%) |
| 20 to 24 Years | 138 (4.7%) | 91 (4.0%) |
| 25 to 29 Years | 229 (7.9%) | 144 (6.3%) |
| 30 to 34 Years | 201 (6.9%) | 227 (9.9%) |
| 35 to 39 Years | 115 (3.9%) | 46 (2.0%) |
| 40 to 44 Years | 373 (12.8%) | 148 (6.4%) |
| 45 to 49 Years | 174 (6.0%) | 187 (8.1%) |
| 50 to 54 Years | 303 (10.4%) | 285 (12.4%) |
| 55 to 59 Years | 59 (2.0%) | 99 (4.3%) |
| 60 to 64 Years | 175 (6.0%) | 208 (9.0%) |
| 65 to 69 Years | 423 (14.5%) | 251 (10.9%) |
| 70 to 74 Years | 94 (3.2%) | 68 (2.9%) |
| 75 to 79 Years | 17 (0.6%) | 60 (2.6%) |
| 80 to 84 Years | 22 (0.7%) | 6 (0.3%) |
| 85 Years and over | 16 (0.5%) | 50 (2.2%) |
| Total | 2,919 (100.0%) | 2,302 (100.0%) |
Families and Households in Lemmon Valley
Median Family Size in Lemmon Valley
The median family size in Lemmon Valley is 3.10 persons per family, with single male/father families (71 | 5.2%) accounting for the largest median family size of 3.92 persons per family. On the other hand, married-couple families (1,156 | 85.2%) represent the smallest median family size with 3.05 persons per family.
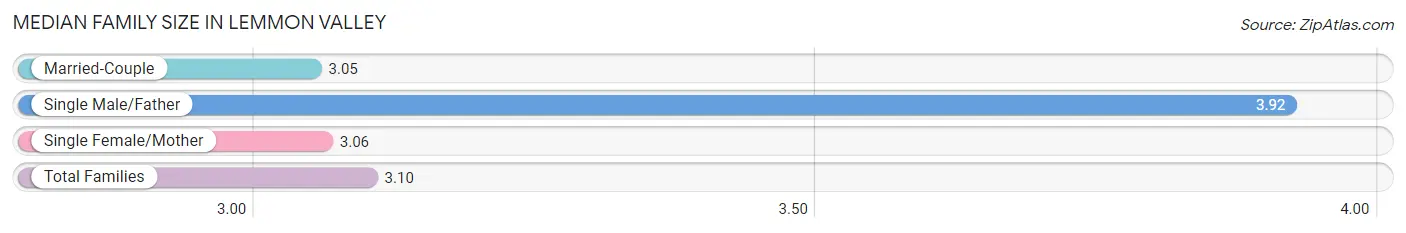
| Family Type | # Families | Family Size |
| Married-Couple | 1,156 (85.2%) | 3.05 |
| Single Male/Father | 71 (5.2%) | 3.92 |
| Single Female/Mother | 130 (9.6%) | 3.06 |
| Total Families | 1,357 (100.0%) | 3.10 |
Median Household Size in Lemmon Valley
The median household size in Lemmon Valley is 2.63 persons per household, with single male/father households (71 | 3.6%) accounting for the largest median household size of 4.52 persons per household. non-family households (625 | 31.5%) represent the smallest median household size with 1.45 persons per household.
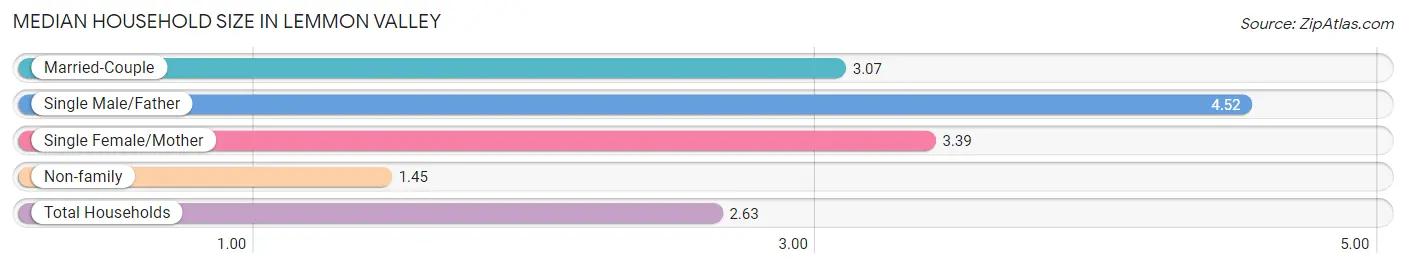
| Household Type | # Households | Household Size |
| Married-Couple | 1,156 (58.3%) | 3.07 |
| Single Male/Father | 71 (3.6%) | 4.52 |
| Single Female/Mother | 130 (6.6%) | 3.39 |
| Non-family | 625 (31.5%) | 1.45 |
| Total Households | 1,982 (100.0%) | 2.63 |
Household Size by Marriage Status in Lemmon Valley
Out of a total of 1,982 households in Lemmon Valley, 1,357 (68.5%) are family households, while 625 (31.5%) are nonfamily households. The most numerous type of family households are 2-person households, comprising 576, and the most common type of nonfamily households are 1-person households, comprising 465.
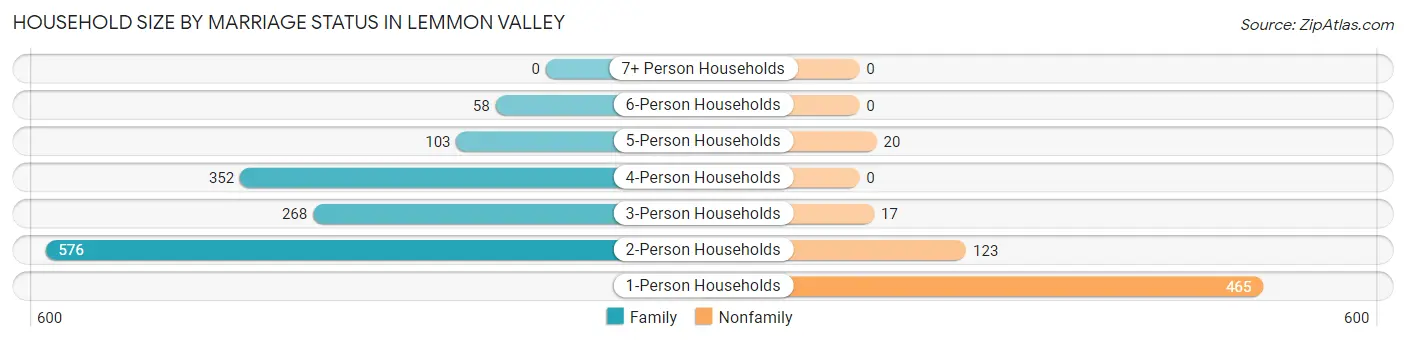
| Household Size | Family Households | Nonfamily Households |
| 1-Person Households | - | 465 (23.5%) |
| 2-Person Households | 576 (29.1%) | 123 (6.2%) |
| 3-Person Households | 268 (13.5%) | 17 (0.9%) |
| 4-Person Households | 352 (17.8%) | 0 (0.0%) |
| 5-Person Households | 103 (5.2%) | 20 (1.0%) |
| 6-Person Households | 58 (2.9%) | 0 (0.0%) |
| 7+ Person Households | 0 (0.0%) | 0 (0.0%) |
| Total | 1,357 (68.5%) | 625 (31.5%) |
Female Fertility in Lemmon Valley
Fertility by Age in Lemmon Valley
Average fertility rate in Lemmon Valley is 15.0 births per 1,000 women. Women in the age bracket of 20 to 34 years have the highest fertility rate with 32.0 births per 1,000 women. Women in the age bracket of 20 to 34 years acount for 100.0% of all women with births.
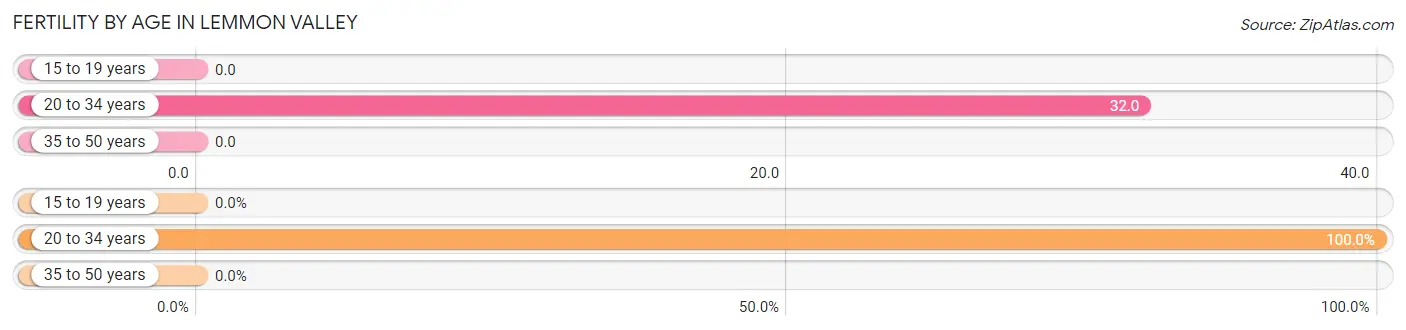
| Age Bracket | Women with Births | Births / 1,000 Women |
| 15 to 19 years | 0 (0.0%) | 0.0 |
| 20 to 34 years | 15 (100.0%) | 32.0 |
| 35 to 50 years | 0 (0.0%) | 0.0 |
| Total | 15 (100.0%) | 15.0 |
Fertility by Age by Marriage Status in Lemmon Valley
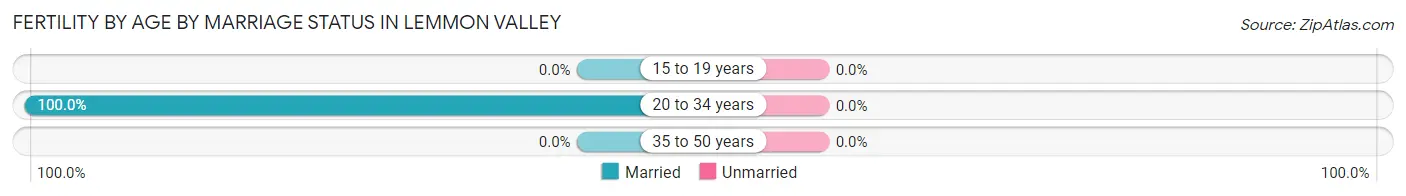
| Age Bracket | Married | Unmarried |
| 15 to 19 years | 0 (0.0%) | 0 (0.0%) |
| 20 to 34 years | 15 (100.0%) | 0 (0.0%) |
| 35 to 50 years | 0 (0.0%) | 0 (0.0%) |
| Total | 15 (100.0%) | 0 (0.0%) |
Fertility by Education in Lemmon Valley
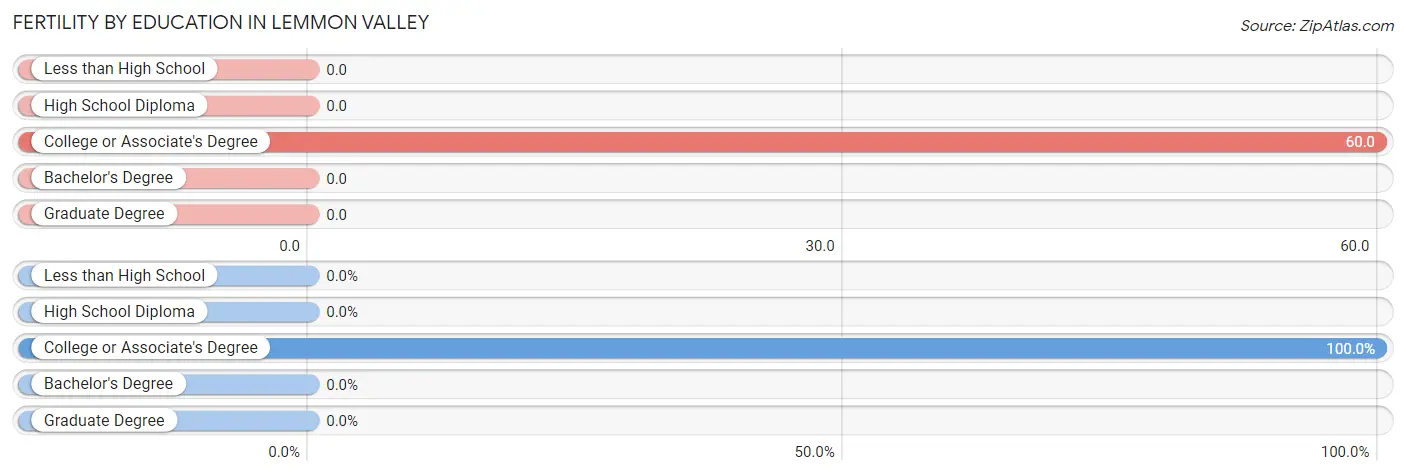
| Educational Attainment | Women with Births | Births / 1,000 Women |
| Less than High School | 0 (0.0%) | 0.0 |
| High School Diploma | 0 (0.0%) | 0.0 |
| College or Associate's Degree | 15 (100.0%) | 60.0 |
| Bachelor's Degree | 0 (0.0%) | 0.0 |
| Graduate Degree | 0 (0.0%) | 0.0 |
| Total | 15 (100.0%) | 15.0 |
Fertility by Education by Marriage Status in Lemmon Valley
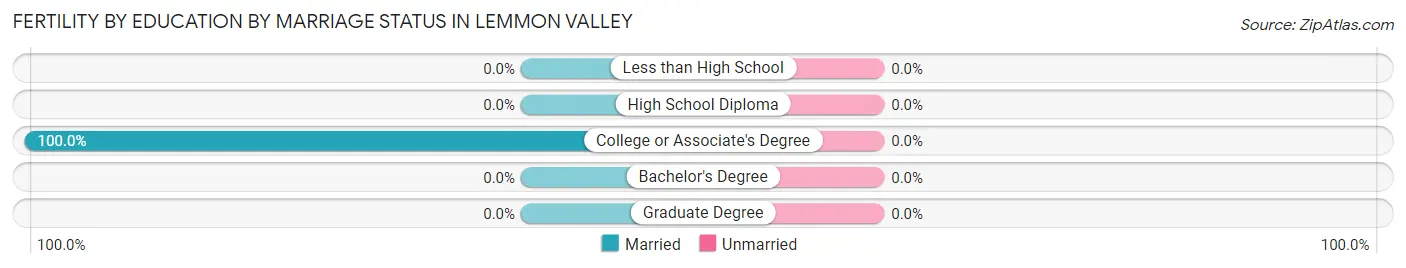
| Educational Attainment | Married | Unmarried |
| Less than High School | 0 (0.0%) | 0 (0.0%) |
| High School Diploma | 0 (0.0%) | 0 (0.0%) |
| College or Associate's Degree | 15 (100.0%) | 0 (0.0%) |
| Bachelor's Degree | 0 (0.0%) | 0 (0.0%) |
| Graduate Degree | 0 (0.0%) | 0 (0.0%) |
| Total | 15 (100.0%) | 0 (0.0%) |
Employment Characteristics in Lemmon Valley
Employment by Class of Employer in Lemmon Valley
Among the 2,769 employed individuals in Lemmon Valley, private company employees (1,682 | 60.7%), local government employees (333 | 12.0%), and self-employed (not incorporated) (206 | 7.4%) make up the most common classes of employment.
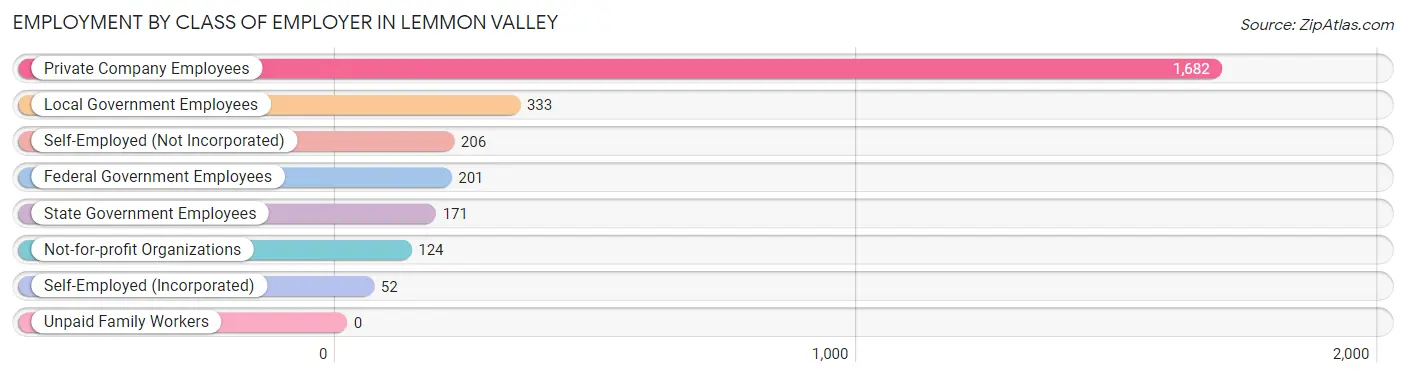
| Employer Class | # Employees | % Employees |
| Private Company Employees | 1,682 | 60.7% |
| Self-Employed (Incorporated) | 52 | 1.9% |
| Self-Employed (Not Incorporated) | 206 | 7.4% |
| Not-for-profit Organizations | 124 | 4.5% |
| Local Government Employees | 333 | 12.0% |
| State Government Employees | 171 | 6.2% |
| Federal Government Employees | 201 | 7.3% |
| Unpaid Family Workers | 0 | 0.0% |
| Total | 2,769 | 100.0% |
Employment Status by Age in Lemmon Valley
According to the labor force statistics for Lemmon Valley, out of the total population over 16 years of age (4,456), 64.9% or 2,892 individuals are in the labor force, with 0.9% or 26 of them unemployed. The age group with the highest labor force participation rate is 35 to 44 years, with 95.9% or 654 individuals in the labor force. Within the labor force, the 20 to 24 years age range has the highest percentage of unemployed individuals, with 12.7% or 27 of them being unemployed.
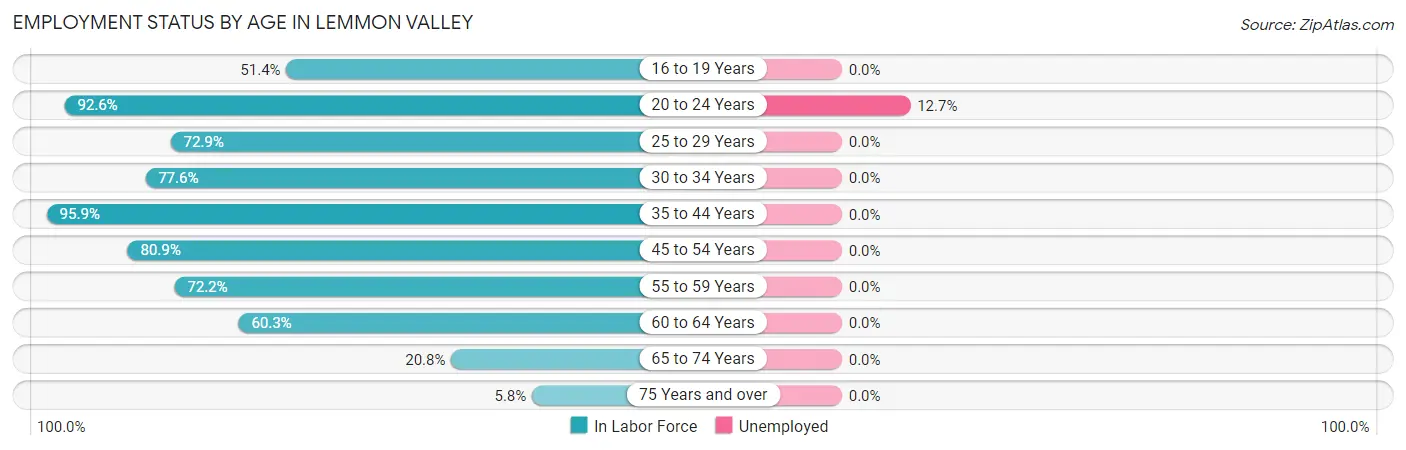
| Age Bracket | In Labor Force | Unemployed |
| 16 to 19 Years | 127 (51.4%) | 0 (0.0%) |
| 20 to 24 Years | 212 (92.6%) | 27 (12.7%) |
| 25 to 29 Years | 272 (72.9%) | 0 (0.0%) |
| 30 to 34 Years | 332 (77.6%) | 0 (0.0%) |
| 35 to 44 Years | 654 (95.9%) | 0 (0.0%) |
| 45 to 54 Years | 768 (80.9%) | 0 (0.0%) |
| 55 to 59 Years | 114 (72.2%) | 0 (0.0%) |
| 60 to 64 Years | 231 (60.3%) | 0 (0.0%) |
| 65 to 74 Years | 174 (20.8%) | 0 (0.0%) |
| 75 Years and over | 10 (5.8%) | 0 (0.0%) |
| Total | 2,892 (64.9%) | 26 (0.9%) |
Employment Status by Educational Attainment in Lemmon Valley
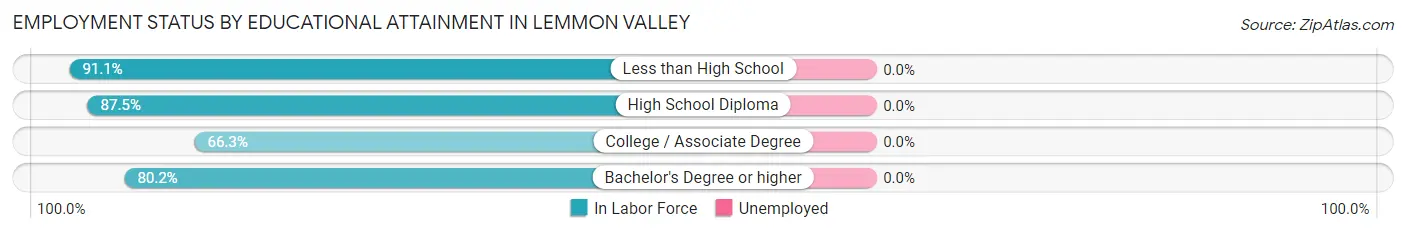
| Educational Attainment | In Labor Force | Unemployed |
| Less than High School | 441 (91.1%) | 0 (0.0%) |
| High School Diploma | 872 (87.5%) | 0 (0.0%) |
| College / Associate Degree | 664 (66.3%) | 0 (0.0%) |
| Bachelor's Degree or higher | 394 (80.2%) | 0 (0.0%) |
| Total | 2,372 (79.8%) | 0 (0.0%) |
Employment Occupations by Sex in Lemmon Valley
Management, Business, Science and Arts Occupations
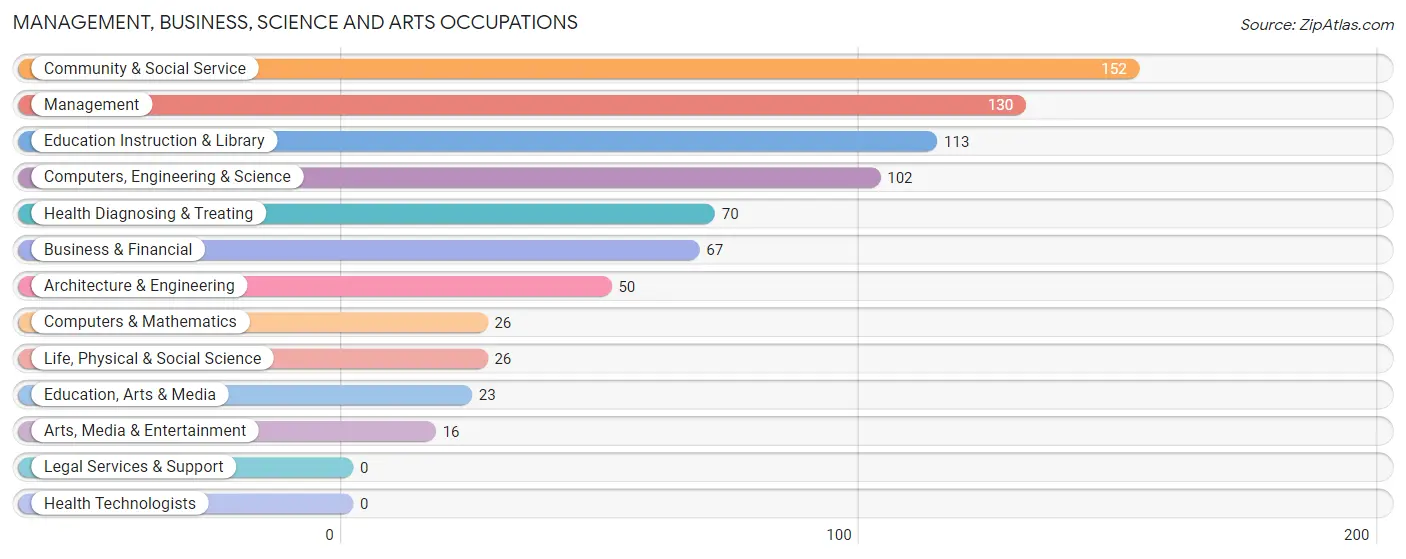
The most common Management, Business, Science and Arts occupations in Lemmon Valley are Community & Social Service (152 | 5.3%), Management (130 | 4.6%), Education Instruction & Library (113 | 4.0%), Computers, Engineering & Science (102 | 3.6%), and Health Diagnosing & Treating (70 | 2.5%).
Management, Business, Science and Arts Occupations by Sex
Within the Management, Business, Science and Arts occupations in Lemmon Valley, the most male-oriented occupations are Life, Physical & Social Science (100.0%), Arts, Media & Entertainment (100.0%), and Architecture & Engineering (68.0%), while the most female-oriented occupations are Computers & Mathematics (100.0%), Education, Arts & Media (100.0%), and Health Diagnosing & Treating (75.7%).
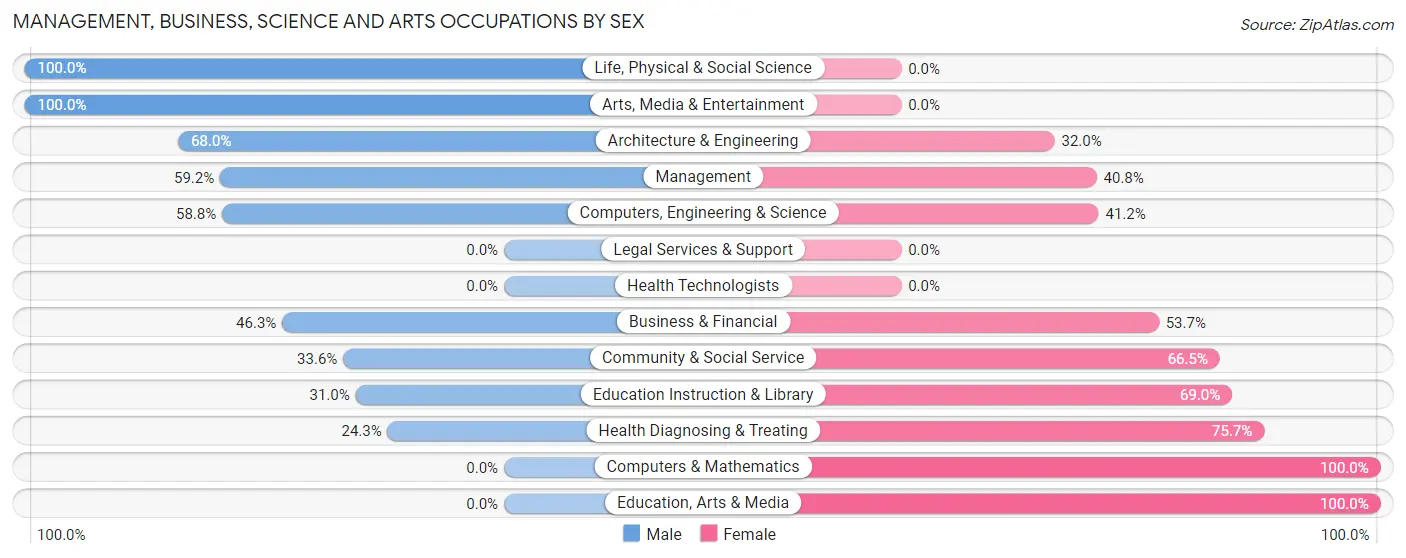
| Occupation | Male | Female |
| Management | 77 (59.2%) | 53 (40.8%) |
| Business & Financial | 31 (46.3%) | 36 (53.7%) |
| Computers, Engineering & Science | 60 (58.8%) | 42 (41.2%) |
| Computers & Mathematics | 0 (0.0%) | 26 (100.0%) |
| Architecture & Engineering | 34 (68.0%) | 16 (32.0%) |
| Life, Physical & Social Science | 26 (100.0%) | 0 (0.0%) |
| Community & Social Service | 51 (33.6%) | 101 (66.4%) |
| Education, Arts & Media | 0 (0.0%) | 23 (100.0%) |
| Legal Services & Support | 0 (0.0%) | 0 (0.0%) |
| Education Instruction & Library | 35 (31.0%) | 78 (69.0%) |
| Arts, Media & Entertainment | 16 (100.0%) | 0 (0.0%) |
| Health Diagnosing & Treating | 17 (24.3%) | 53 (75.7%) |
| Health Technologists | 0 (0.0%) | 0 (0.0%) |
| Total (Category) | 236 (45.3%) | 285 (54.7%) |
| Total (Overall) | 1,566 (55.0%) | 1,281 (45.0%) |
Services Occupations
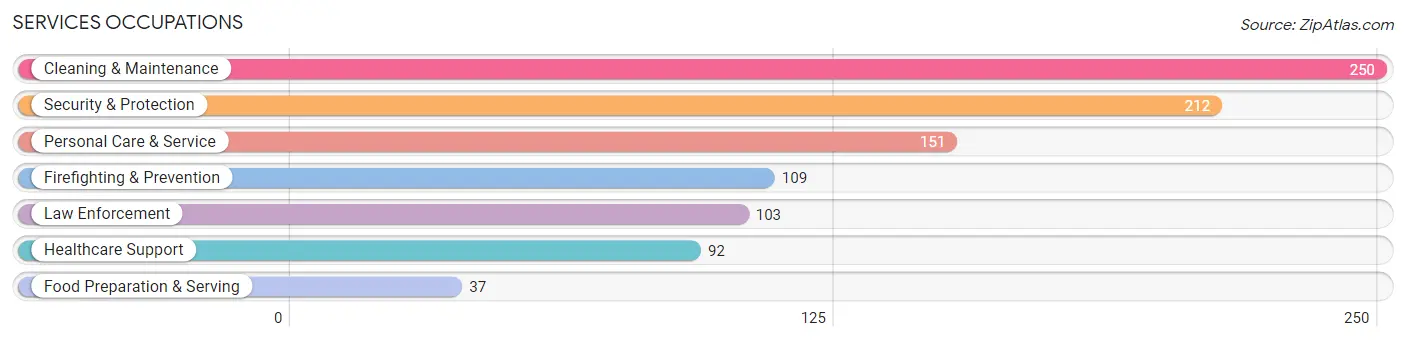
The most common Services occupations in Lemmon Valley are Cleaning & Maintenance (250 | 8.8%), Security & Protection (212 | 7.4%), Personal Care & Service (151 | 5.3%), Firefighting & Prevention (109 | 3.8%), and Law Enforcement (103 | 3.6%).
Services Occupations by Sex
Within the Services occupations in Lemmon Valley, the most male-oriented occupations are Law Enforcement (100.0%), Security & Protection (65.6%), and Cleaning & Maintenance (48.0%), while the most female-oriented occupations are Personal Care & Service (100.0%), Healthcare Support (88.0%), and Firefighting & Prevention (67.0%).
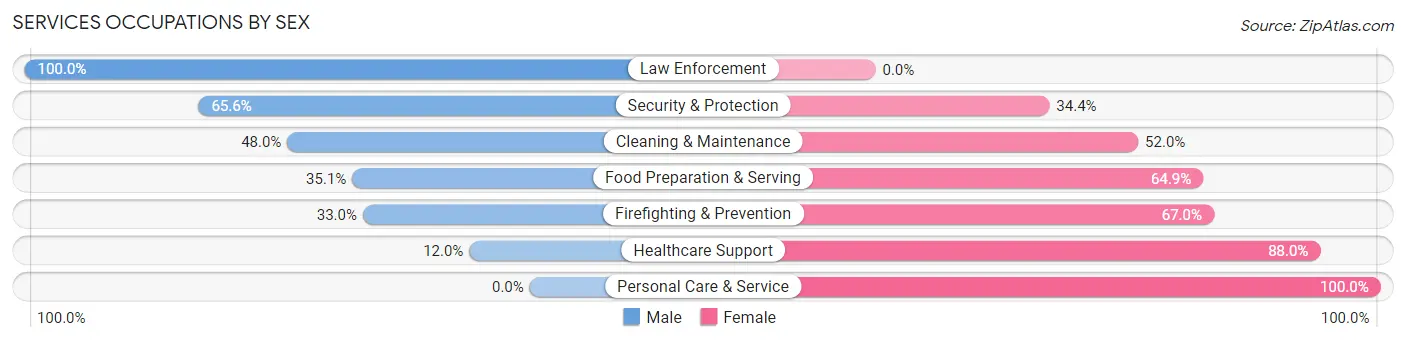
| Occupation | Male | Female |
| Healthcare Support | 11 (12.0%) | 81 (88.0%) |
| Security & Protection | 139 (65.6%) | 73 (34.4%) |
| Firefighting & Prevention | 36 (33.0%) | 73 (67.0%) |
| Law Enforcement | 103 (100.0%) | 0 (0.0%) |
| Food Preparation & Serving | 13 (35.1%) | 24 (64.9%) |
| Cleaning & Maintenance | 120 (48.0%) | 130 (52.0%) |
| Personal Care & Service | 0 (0.0%) | 151 (100.0%) |
| Total (Category) | 283 (38.1%) | 459 (61.9%) |
| Total (Overall) | 1,566 (55.0%) | 1,281 (45.0%) |
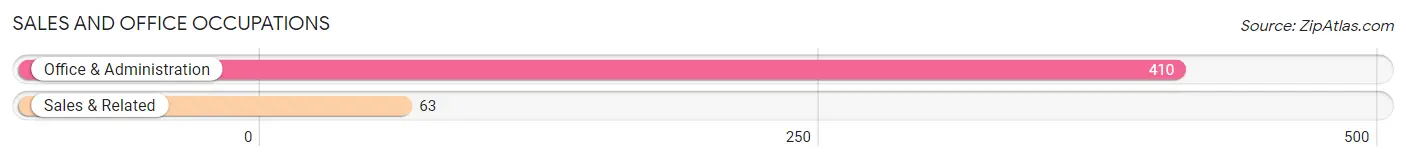
Sales and Office Occupations
The most common Sales and Office occupations in Lemmon Valley are Office & Administration (410 | 14.4%), and Sales & Related (63 | 2.2%).
Sales and Office Occupations by Sex
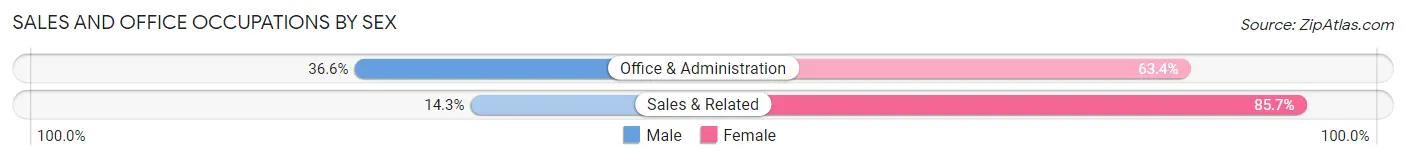
| Occupation | Male | Female |
| Sales & Related | 9 (14.3%) | 54 (85.7%) |
| Office & Administration | 150 (36.6%) | 260 (63.4%) |
| Total (Category) | 159 (33.6%) | 314 (66.4%) |
| Total (Overall) | 1,566 (55.0%) | 1,281 (45.0%) |
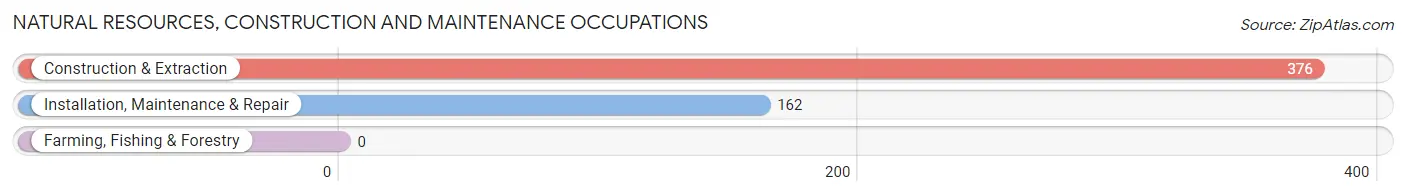
Natural Resources, Construction and Maintenance Occupations
The most common Natural Resources, Construction and Maintenance occupations in Lemmon Valley are Construction & Extraction (376 | 13.2%), and Installation, Maintenance & Repair (162 | 5.7%).
Natural Resources, Construction and Maintenance Occupations by Sex
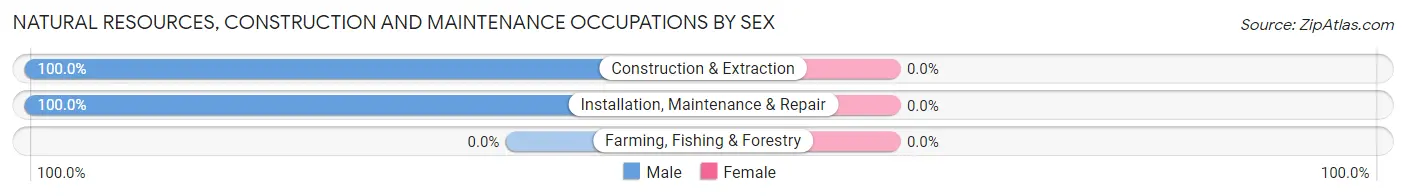
| Occupation | Male | Female |
| Farming, Fishing & Forestry | 0 (0.0%) | 0 (0.0%) |
| Construction & Extraction | 376 (100.0%) | 0 (0.0%) |
| Installation, Maintenance & Repair | 162 (100.0%) | 0 (0.0%) |
| Total (Category) | 538 (100.0%) | 0 (0.0%) |
| Total (Overall) | 1,566 (55.0%) | 1,281 (45.0%) |
Production, Transportation and Moving Occupations
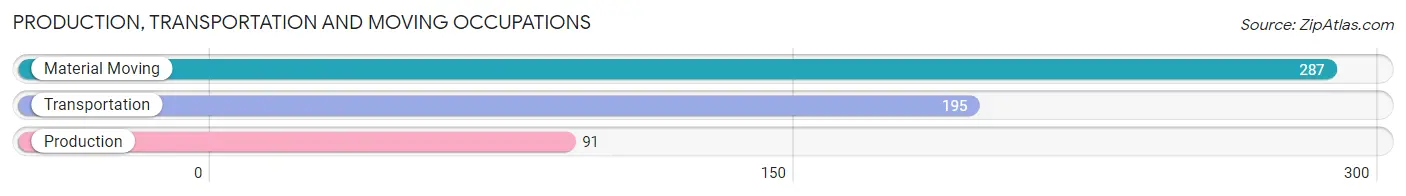
The most common Production, Transportation and Moving occupations in Lemmon Valley are Material Moving (287 | 10.1%), Transportation (195 | 6.9%), and Production (91 | 3.2%).
Production, Transportation and Moving Occupations by Sex
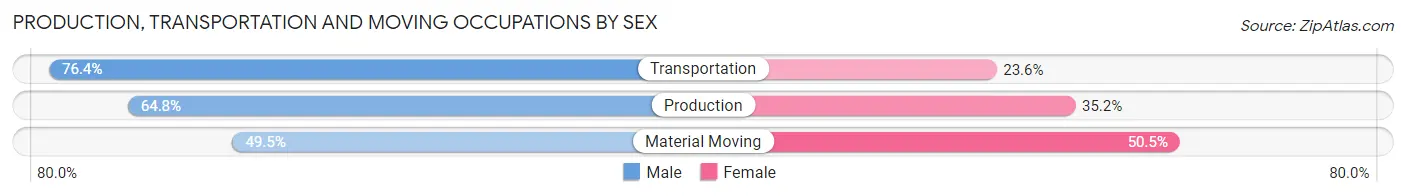
| Occupation | Male | Female |
| Production | 59 (64.8%) | 32 (35.2%) |
| Transportation | 149 (76.4%) | 46 (23.6%) |
| Material Moving | 142 (49.5%) | 145 (50.5%) |
| Total (Category) | 350 (61.1%) | 223 (38.9%) |
| Total (Overall) | 1,566 (55.0%) | 1,281 (45.0%) |
Employment Industries by Sex in Lemmon Valley
Employment Industries in Lemmon Valley
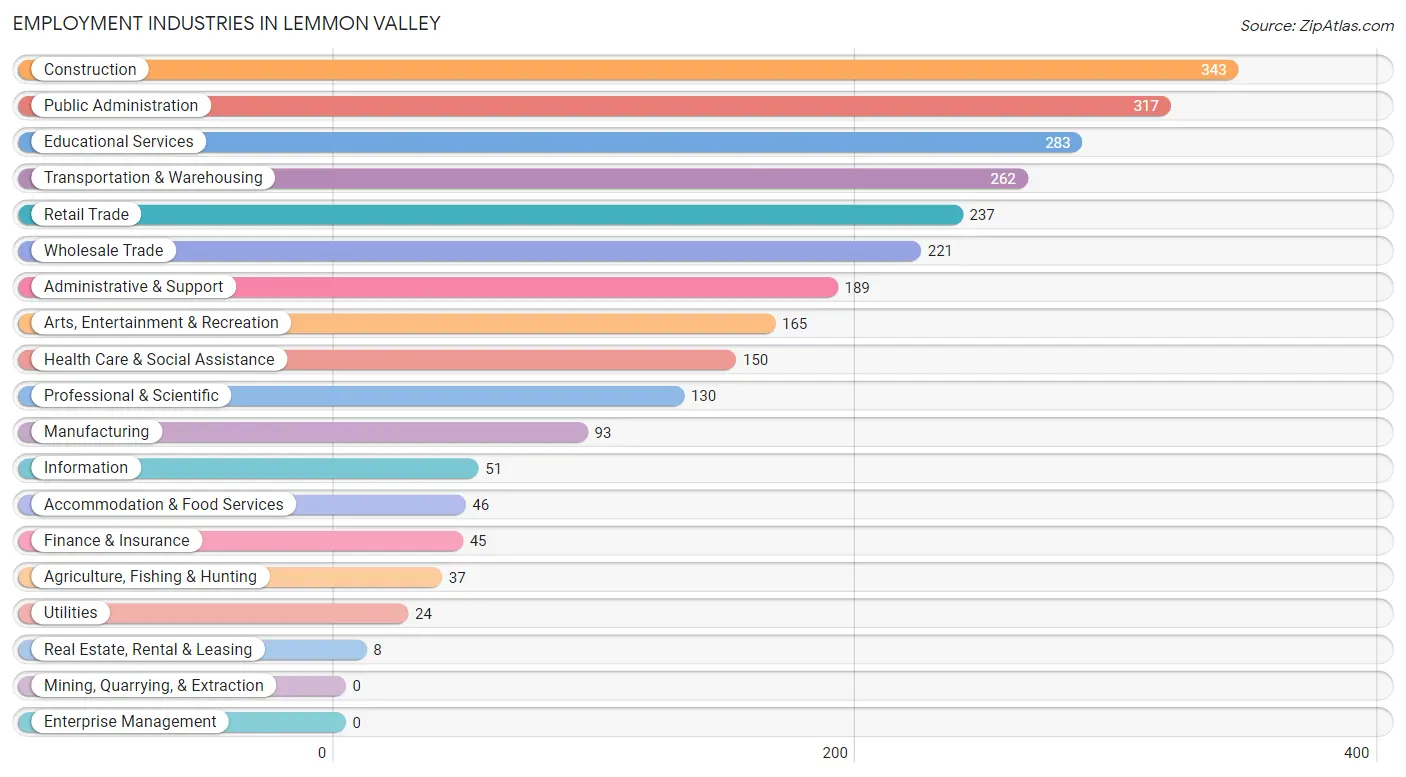
The major employment industries in Lemmon Valley include Construction (343 | 12.0%), Public Administration (317 | 11.1%), Educational Services (283 | 9.9%), Transportation & Warehousing (262 | 9.2%), and Retail Trade (237 | 8.3%).
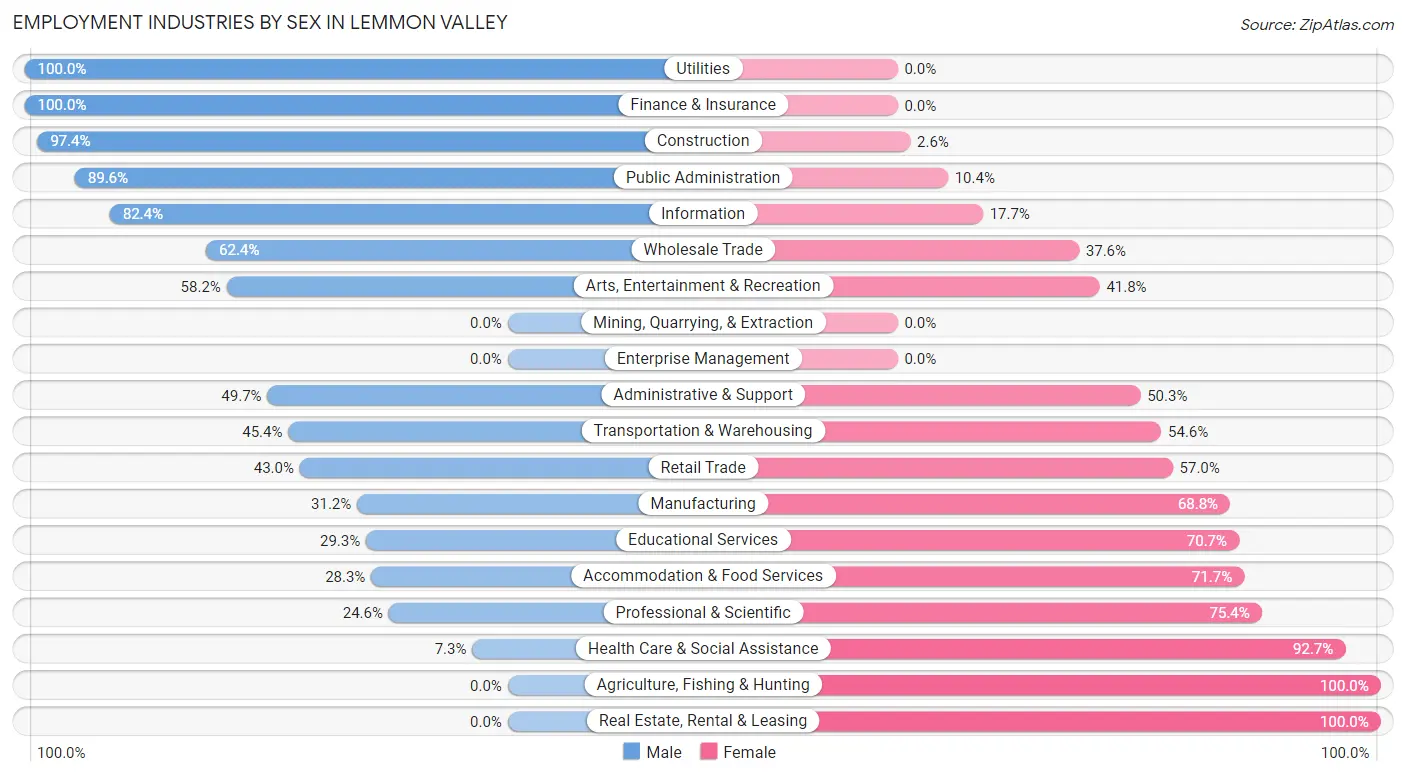
Employment Industries by Sex in Lemmon Valley
The Lemmon Valley industries that see more men than women are Utilities (100.0%), Finance & Insurance (100.0%), and Construction (97.4%), whereas the industries that tend to have a higher number of women are Agriculture, Fishing & Hunting (100.0%), Real Estate, Rental & Leasing (100.0%), and Health Care & Social Assistance (92.7%).
| Industry | Male | Female |
| Agriculture, Fishing & Hunting | 0 (0.0%) | 37 (100.0%) |
| Mining, Quarrying, & Extraction | 0 (0.0%) | 0 (0.0%) |
| Construction | 334 (97.4%) | 9 (2.6%) |
| Manufacturing | 29 (31.2%) | 64 (68.8%) |
| Wholesale Trade | 138 (62.4%) | 83 (37.6%) |
| Retail Trade | 102 (43.0%) | 135 (57.0%) |
| Transportation & Warehousing | 119 (45.4%) | 143 (54.6%) |
| Utilities | 24 (100.0%) | 0 (0.0%) |
| Information | 42 (82.4%) | 9 (17.6%) |
| Finance & Insurance | 45 (100.0%) | 0 (0.0%) |
| Real Estate, Rental & Leasing | 0 (0.0%) | 8 (100.0%) |
| Professional & Scientific | 32 (24.6%) | 98 (75.4%) |
| Enterprise Management | 0 (0.0%) | 0 (0.0%) |
| Administrative & Support | 94 (49.7%) | 95 (50.3%) |
| Educational Services | 83 (29.3%) | 200 (70.7%) |
| Health Care & Social Assistance | 11 (7.3%) | 139 (92.7%) |
| Arts, Entertainment & Recreation | 96 (58.2%) | 69 (41.8%) |
| Accommodation & Food Services | 13 (28.3%) | 33 (71.7%) |
| Public Administration | 284 (89.6%) | 33 (10.4%) |
| Total | 1,566 (55.0%) | 1,281 (45.0%) |
Education in Lemmon Valley
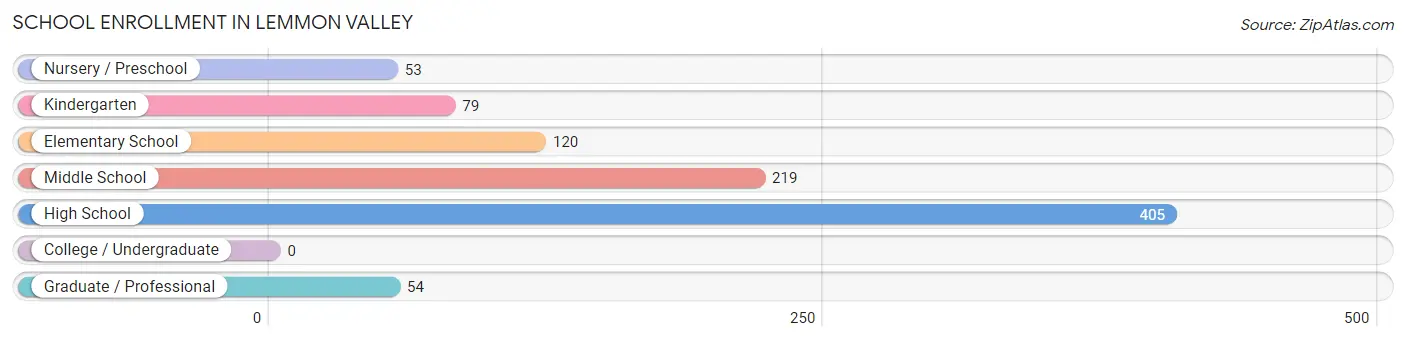
School Enrollment in Lemmon Valley
The most common levels of schooling among the 930 students in Lemmon Valley are high school (405 | 43.5%), middle school (219 | 23.5%), and elementary school (120 | 12.9%).
| School Level | # Students | % Students |
| Nursery / Preschool | 53 | 5.7% |
| Kindergarten | 79 | 8.5% |
| Elementary School | 120 | 12.9% |
| Middle School | 219 | 23.5% |
| High School | 405 | 43.5% |
| College / Undergraduate | 0 | 0.0% |
| Graduate / Professional | 54 | 5.8% |
| Total | 930 | 100.0% |
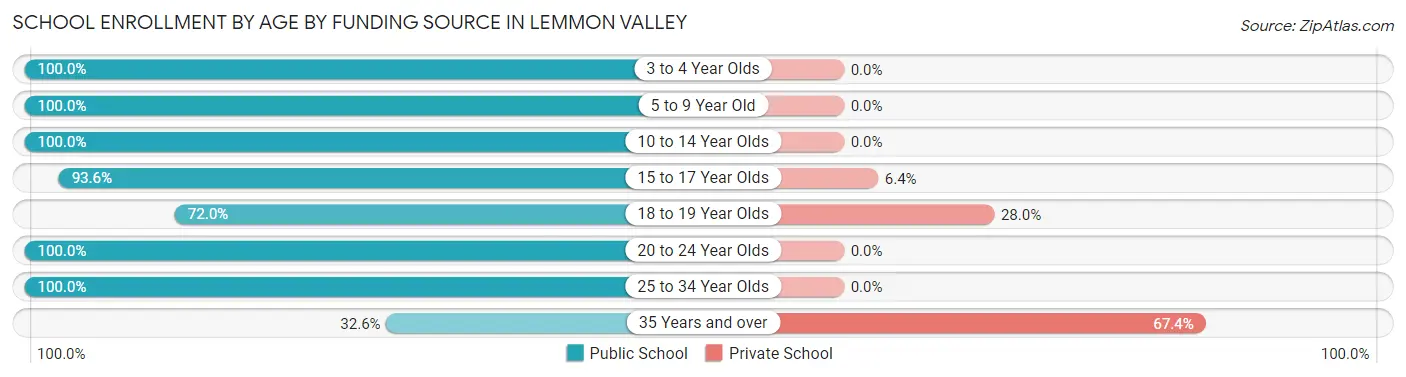
School Enrollment by Age by Funding Source in Lemmon Valley
Out of a total of 930 students who are enrolled in schools in Lemmon Valley, 61 (6.6%) attend a private institution, while the remaining 869 (93.4%) are enrolled in public schools. The age group of 35 years and over has the highest likelihood of being enrolled in private schools, with 31 (67.4% in the age bracket) enrolled. Conversely, the age group of 3 to 4 year olds has the lowest likelihood of being enrolled in a private school, with 11 (100.0% in the age bracket) attending a public institution.
| Age Bracket | Public School | Private School |
| 3 to 4 Year Olds | 11 (100.0%) | 0 (0.0%) |
| 5 to 9 Year Old | 241 (100.0%) | 0 (0.0%) |
| 10 to 14 Year Olds | 307 (100.0%) | 0 (0.0%) |
| 15 to 17 Year Olds | 235 (93.6%) | 16 (6.4%) |
| 18 to 19 Year Olds | 36 (72.0%) | 14 (28.0%) |
| 20 to 24 Year Olds | 16 (100.0%) | 0 (0.0%) |
| 25 to 34 Year Olds | 8 (100.0%) | 0 (0.0%) |
| 35 Years and over | 15 (32.6%) | 31 (67.4%) |
| Total | 869 (93.4%) | 61 (6.6%) |
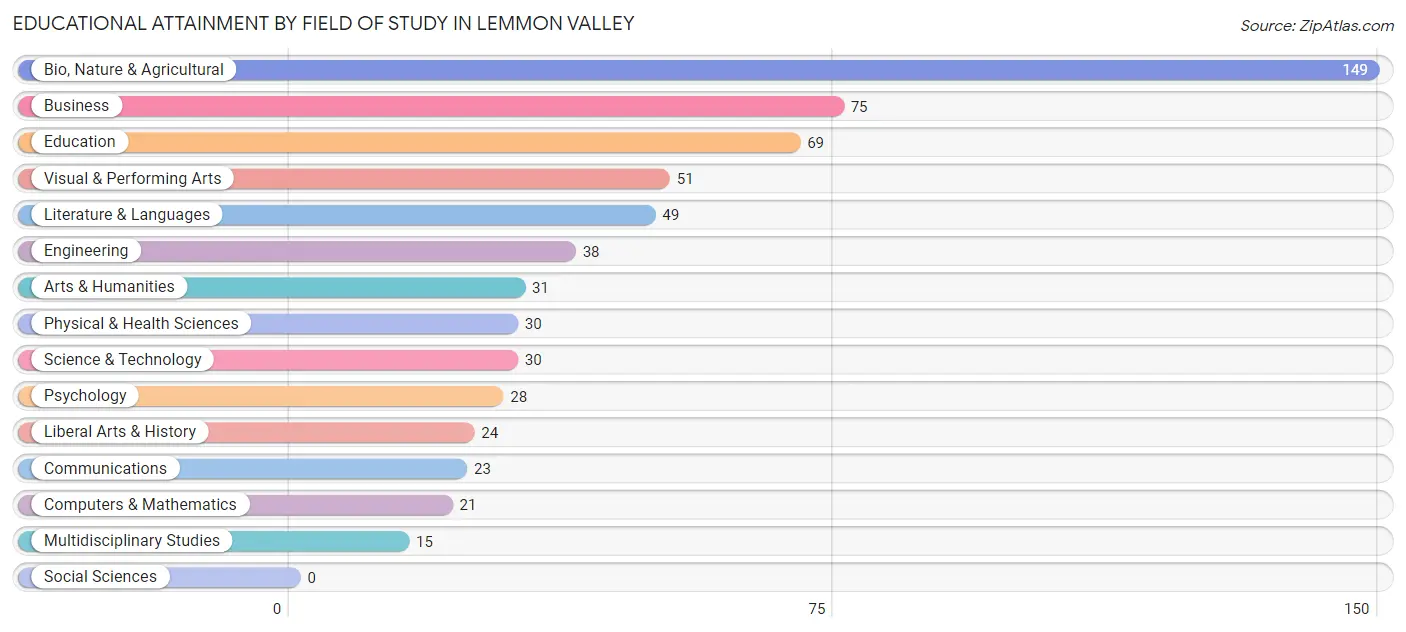
Educational Attainment by Field of Study in Lemmon Valley
Bio, nature & agricultural (149 | 23.5%), business (75 | 11.8%), education (69 | 10.9%), visual & performing arts (51 | 8.1%), and literature & languages (49 | 7.7%) are the most common fields of study among 633 individuals in Lemmon Valley who have obtained a bachelor's degree or higher.
| Field of Study | # Graduates | % Graduates |
| Computers & Mathematics | 21 | 3.3% |
| Bio, Nature & Agricultural | 149 | 23.5% |
| Physical & Health Sciences | 30 | 4.7% |
| Psychology | 28 | 4.4% |
| Social Sciences | 0 | 0.0% |
| Engineering | 38 | 6.0% |
| Multidisciplinary Studies | 15 | 2.4% |
| Science & Technology | 30 | 4.7% |
| Business | 75 | 11.8% |
| Education | 69 | 10.9% |
| Literature & Languages | 49 | 7.7% |
| Liberal Arts & History | 24 | 3.8% |
| Visual & Performing Arts | 51 | 8.1% |
| Communications | 23 | 3.6% |
| Arts & Humanities | 31 | 4.9% |
| Total | 633 | 100.0% |
Transportation & Commute in Lemmon Valley
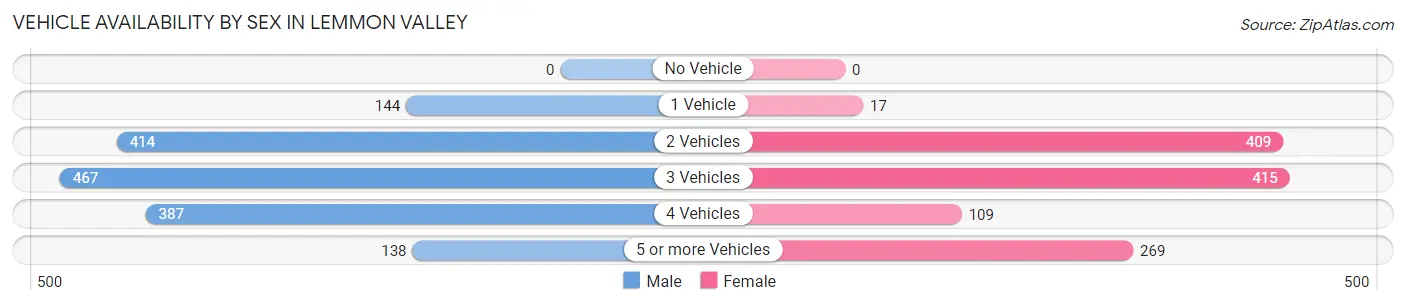
Vehicle Availability by Sex in Lemmon Valley
The most prevalent vehicle ownership categories in Lemmon Valley are males with 3 vehicles (467, accounting for 30.1%) and females with 3 vehicles (415, making up 38.3%).
| Vehicles Available | Male | Female |
| No Vehicle | 0 (0.0%) | 0 (0.0%) |
| 1 Vehicle | 144 (9.3%) | 17 (1.4%) |
| 2 Vehicles | 414 (26.7%) | 409 (33.6%) |
| 3 Vehicles | 467 (30.1%) | 415 (34.0%) |
| 4 Vehicles | 387 (25.0%) | 109 (8.9%) |
| 5 or more Vehicles | 138 (8.9%) | 269 (22.1%) |
| Total | 1,550 (100.0%) | 1,219 (100.0%) |
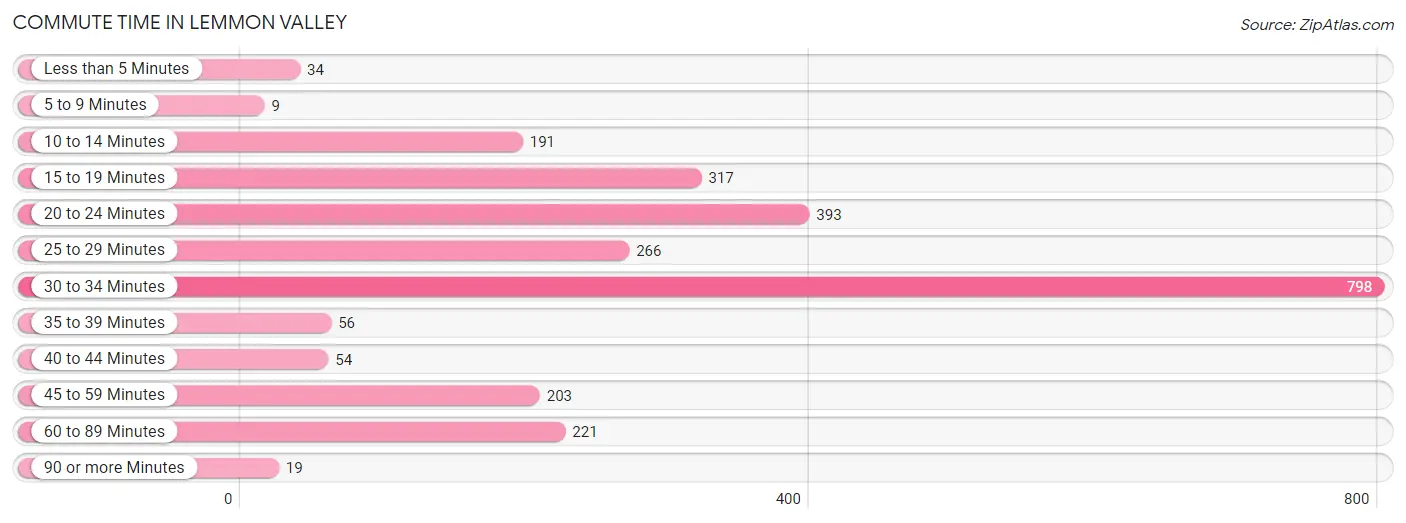
Commute Time in Lemmon Valley
The most frequently occuring commute durations in Lemmon Valley are 30 to 34 minutes (798 commuters, 31.2%), 20 to 24 minutes (393 commuters, 15.3%), and 15 to 19 minutes (317 commuters, 12.4%).
| Commute Time | # Commuters | % Commuters |
| Less than 5 Minutes | 34 | 1.3% |
| 5 to 9 Minutes | 9 | 0.4% |
| 10 to 14 Minutes | 191 | 7.5% |
| 15 to 19 Minutes | 317 | 12.4% |
| 20 to 24 Minutes | 393 | 15.3% |
| 25 to 29 Minutes | 266 | 10.4% |
| 30 to 34 Minutes | 798 | 31.2% |
| 35 to 39 Minutes | 56 | 2.2% |
| 40 to 44 Minutes | 54 | 2.1% |
| 45 to 59 Minutes | 203 | 7.9% |
| 60 to 89 Minutes | 221 | 8.6% |
| 90 or more Minutes | 19 | 0.7% |
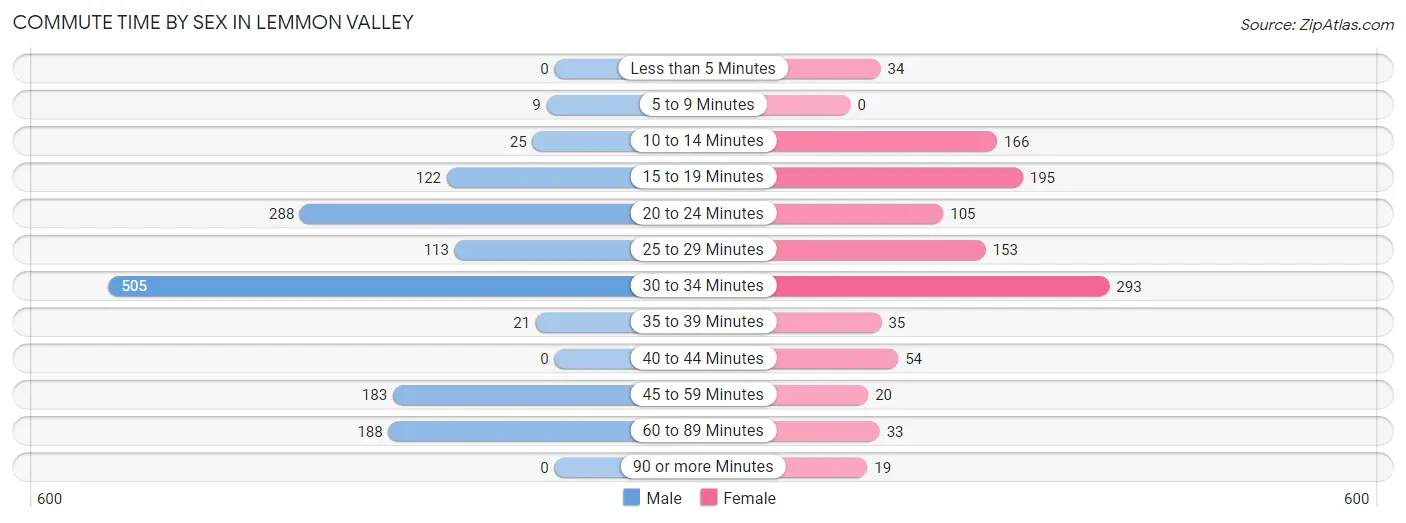
Commute Time by Sex in Lemmon Valley
The most common commute times in Lemmon Valley are 30 to 34 minutes (505 commuters, 34.7%) for males and 30 to 34 minutes (293 commuters, 26.5%) for females.
| Commute Time | Male | Female |
| Less than 5 Minutes | 0 (0.0%) | 34 (3.1%) |
| 5 to 9 Minutes | 9 (0.6%) | 0 (0.0%) |
| 10 to 14 Minutes | 25 (1.7%) | 166 (15.0%) |
| 15 to 19 Minutes | 122 (8.4%) | 195 (17.6%) |
| 20 to 24 Minutes | 288 (19.8%) | 105 (9.5%) |
| 25 to 29 Minutes | 113 (7.8%) | 153 (13.8%) |
| 30 to 34 Minutes | 505 (34.7%) | 293 (26.5%) |
| 35 to 39 Minutes | 21 (1.4%) | 35 (3.2%) |
| 40 to 44 Minutes | 0 (0.0%) | 54 (4.9%) |
| 45 to 59 Minutes | 183 (12.6%) | 20 (1.8%) |
| 60 to 89 Minutes | 188 (12.9%) | 33 (3.0%) |
| 90 or more Minutes | 0 (0.0%) | 19 (1.7%) |
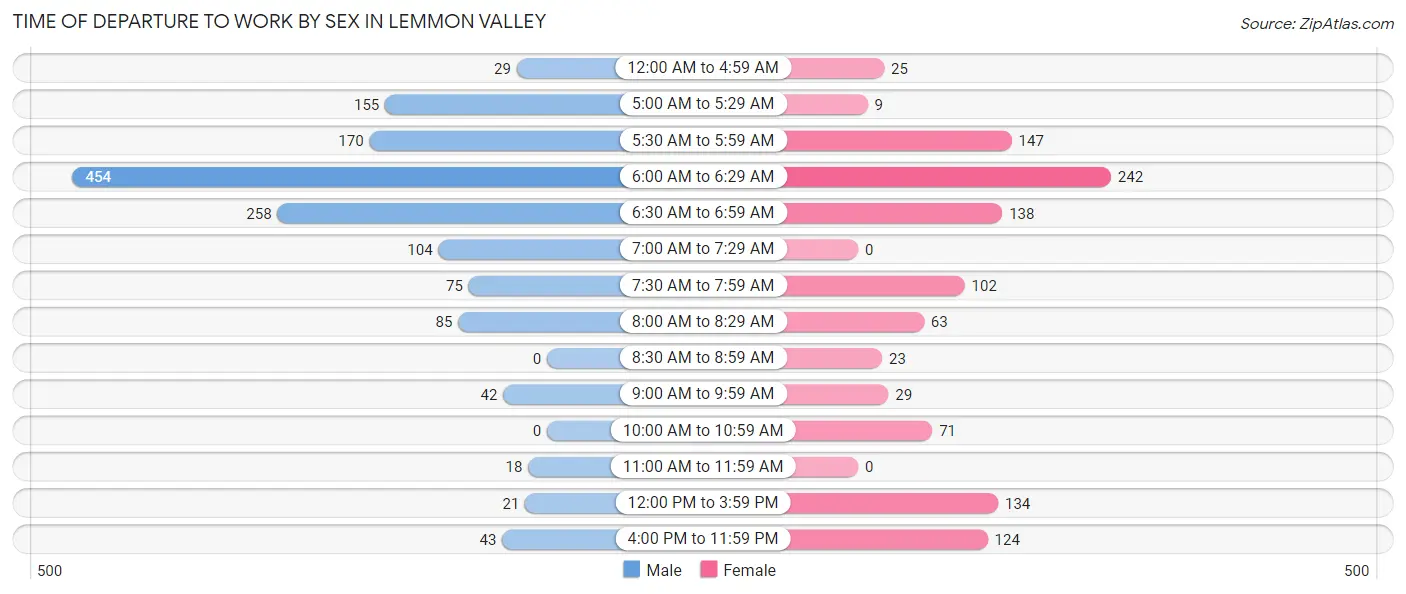
Time of Departure to Work by Sex in Lemmon Valley
The most frequent times of departure to work in Lemmon Valley are 6:00 AM to 6:29 AM (454, 31.2%) for males and 6:00 AM to 6:29 AM (242, 21.9%) for females.
| Time of Departure | Male | Female |
| 12:00 AM to 4:59 AM | 29 (2.0%) | 25 (2.3%) |
| 5:00 AM to 5:29 AM | 155 (10.7%) | 9 (0.8%) |
| 5:30 AM to 5:59 AM | 170 (11.7%) | 147 (13.3%) |
| 6:00 AM to 6:29 AM | 454 (31.2%) | 242 (21.9%) |
| 6:30 AM to 6:59 AM | 258 (17.7%) | 138 (12.5%) |
| 7:00 AM to 7:29 AM | 104 (7.1%) | 0 (0.0%) |
| 7:30 AM to 7:59 AM | 75 (5.2%) | 102 (9.2%) |
| 8:00 AM to 8:29 AM | 85 (5.9%) | 63 (5.7%) |
| 8:30 AM to 8:59 AM | 0 (0.0%) | 23 (2.1%) |
| 9:00 AM to 9:59 AM | 42 (2.9%) | 29 (2.6%) |
| 10:00 AM to 10:59 AM | 0 (0.0%) | 71 (6.4%) |
| 11:00 AM to 11:59 AM | 18 (1.2%) | 0 (0.0%) |
| 12:00 PM to 3:59 PM | 21 (1.4%) | 134 (12.1%) |
| 4:00 PM to 11:59 PM | 43 (3.0%) | 124 (11.2%) |
| Total | 1,454 (100.0%) | 1,107 (100.0%) |
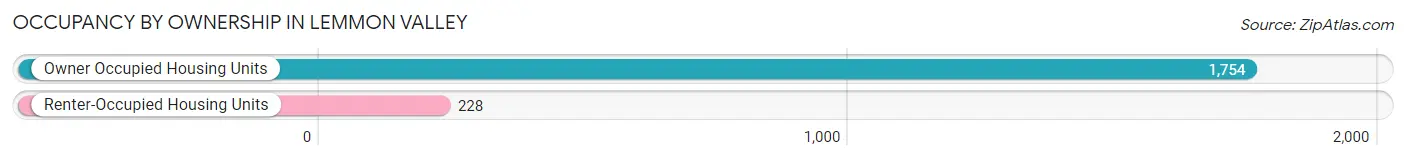
Housing Occupancy in Lemmon Valley
Occupancy by Ownership in Lemmon Valley
Of the total 1,982 dwellings in Lemmon Valley, owner-occupied units account for 1,754 (88.5%), while renter-occupied units make up 228 (11.5%).
| Occupancy | # Housing Units | % Housing Units |
| Owner Occupied Housing Units | 1,754 | 88.5% |
| Renter-Occupied Housing Units | 228 | 11.5% |
| Total Occupied Housing Units | 1,982 | 100.0% |
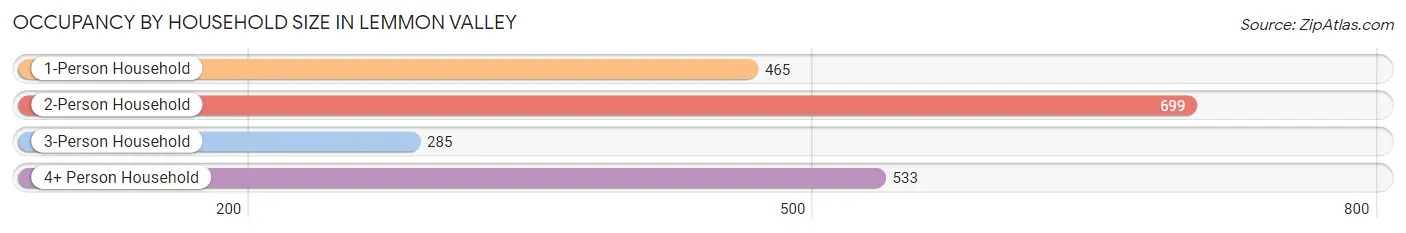
Occupancy by Household Size in Lemmon Valley
| Household Size | # Housing Units | % Housing Units |
| 1-Person Household | 465 | 23.5% |
| 2-Person Household | 699 | 35.3% |
| 3-Person Household | 285 | 14.4% |
| 4+ Person Household | 533 | 26.9% |
| Total Housing Units | 1,982 | 100.0% |
Occupancy by Ownership by Household Size in Lemmon Valley
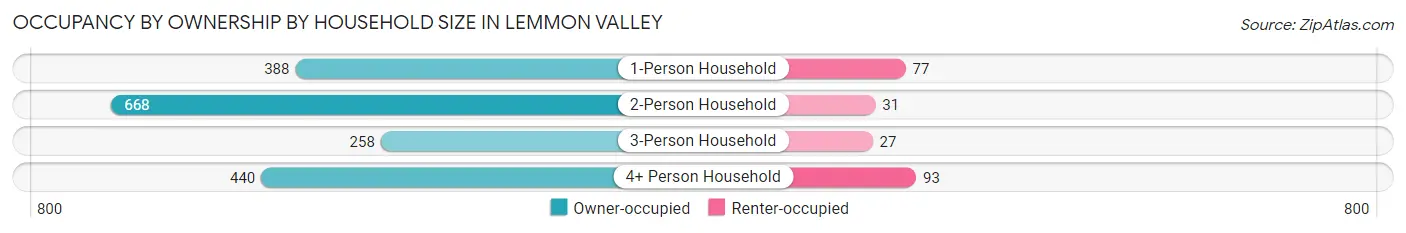
| Household Size | Owner-occupied | Renter-occupied |
| 1-Person Household | 388 (83.4%) | 77 (16.6%) |
| 2-Person Household | 668 (95.6%) | 31 (4.4%) |
| 3-Person Household | 258 (90.5%) | 27 (9.5%) |
| 4+ Person Household | 440 (82.6%) | 93 (17.4%) |
| Total Housing Units | 1,754 (88.5%) | 228 (11.5%) |
Occupancy by Educational Attainment in Lemmon Valley
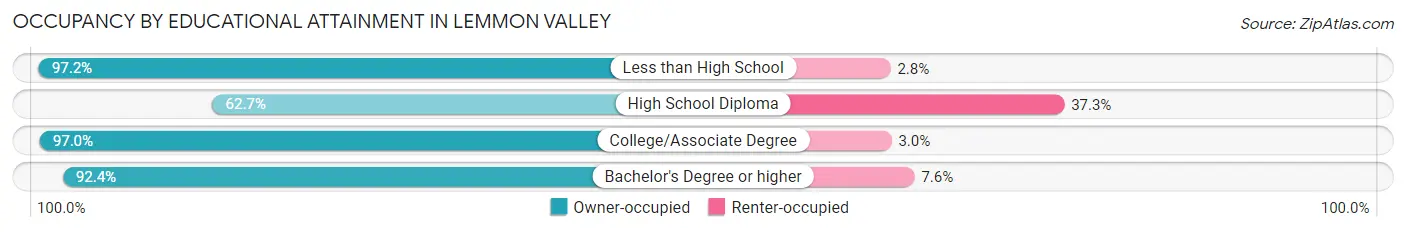
| Household Size | Owner-occupied | Renter-occupied |
| Less than High School | 274 (97.2%) | 8 (2.8%) |
| High School Diploma | 281 (62.7%) | 167 (37.3%) |
| College/Associate Degree | 895 (97.0%) | 28 (3.0%) |
| Bachelor's Degree or higher | 304 (92.4%) | 25 (7.6%) |
Occupancy by Age of Householder in Lemmon Valley
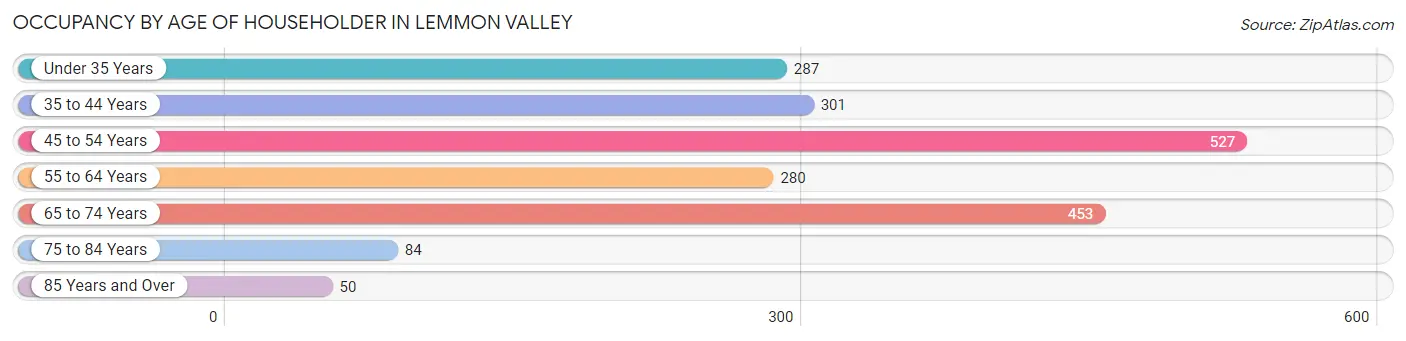
| Age Bracket | # Households | % Households |
| Under 35 Years | 287 | 14.5% |
| 35 to 44 Years | 301 | 15.2% |
| 45 to 54 Years | 527 | 26.6% |
| 55 to 64 Years | 280 | 14.1% |
| 65 to 74 Years | 453 | 22.9% |
| 75 to 84 Years | 84 | 4.2% |
| 85 Years and Over | 50 | 2.5% |
| Total | 1,982 | 100.0% |
Housing Finances in Lemmon Valley
Median Income by Occupancy in Lemmon Valley
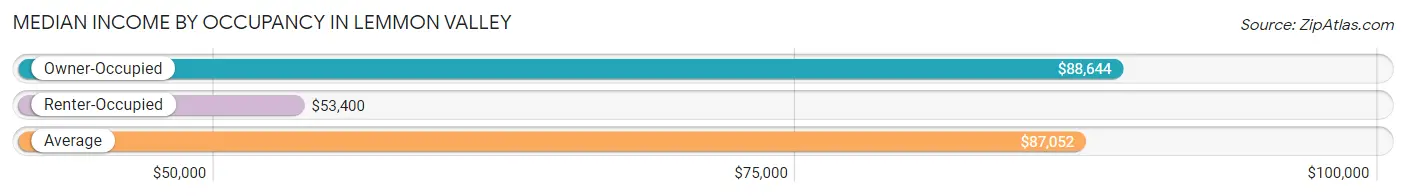
| Occupancy Type | # Households | Median Income |
| Owner-Occupied | 1,754 (88.5%) | $88,644 |
| Renter-Occupied | 228 (11.5%) | $53,400 |
| Average | 1,982 (100.0%) | $87,052 |
Occupancy by Householder Income Bracket in Lemmon Valley
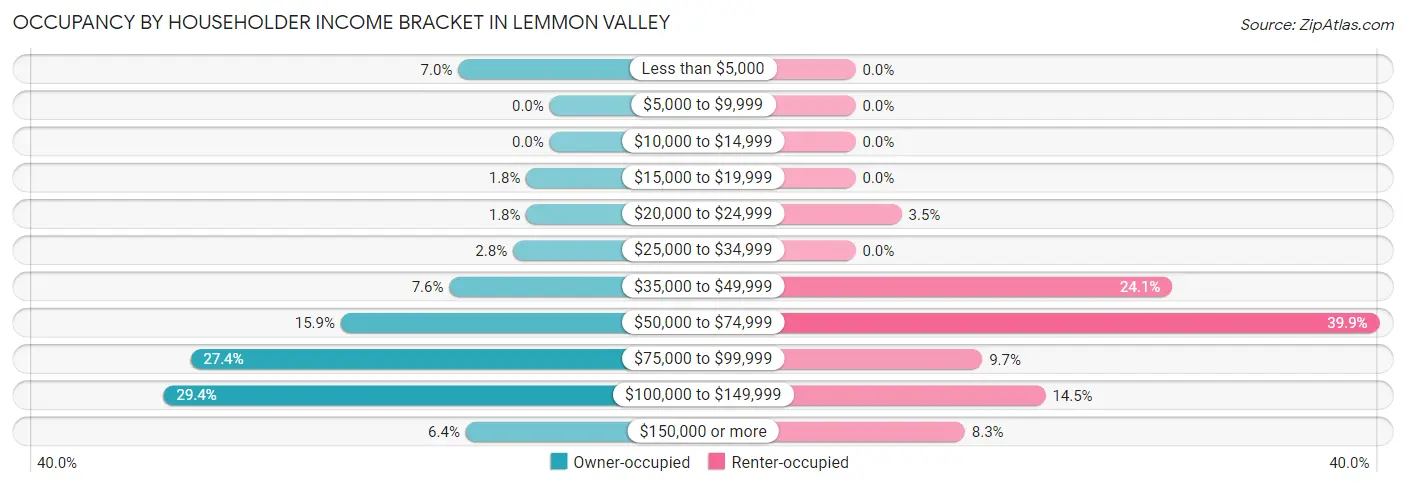
| Income Bracket | Owner-occupied | Renter-occupied |
| Less than $5,000 | 122 (7.0%) | 0 (0.0%) |
| $5,000 to $9,999 | 0 (0.0%) | 0 (0.0%) |
| $10,000 to $14,999 | 0 (0.0%) | 0 (0.0%) |
| $15,000 to $19,999 | 31 (1.8%) | 0 (0.0%) |
| $20,000 to $24,999 | 31 (1.8%) | 8 (3.5%) |
| $25,000 to $34,999 | 49 (2.8%) | 0 (0.0%) |
| $35,000 to $49,999 | 134 (7.6%) | 55 (24.1%) |
| $50,000 to $74,999 | 279 (15.9%) | 91 (39.9%) |
| $75,000 to $99,999 | 480 (27.4%) | 22 (9.7%) |
| $100,000 to $149,999 | 516 (29.4%) | 33 (14.5%) |
| $150,000 or more | 112 (6.4%) | 19 (8.3%) |
| Total | 1,754 (100.0%) | 228 (100.0%) |
Monthly Housing Cost Tiers in Lemmon Valley
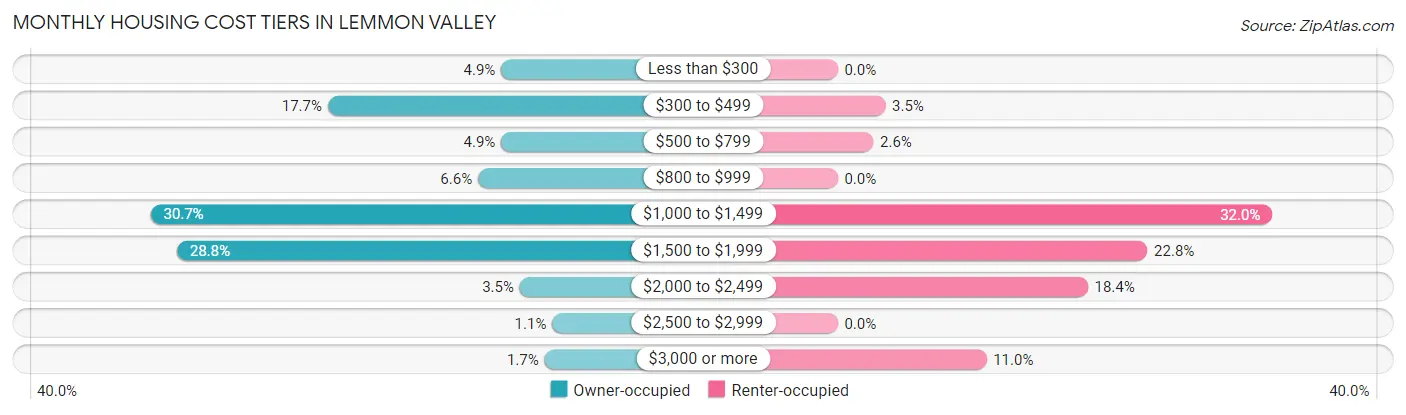
| Monthly Cost | Owner-occupied | Renter-occupied |
| Less than $300 | 86 (4.9%) | 0 (0.0%) |
| $300 to $499 | 310 (17.7%) | 8 (3.5%) |
| $500 to $799 | 86 (4.9%) | 6 (2.6%) |
| $800 to $999 | 116 (6.6%) | 0 (0.0%) |
| $1,000 to $1,499 | 539 (30.7%) | 73 (32.0%) |
| $1,500 to $1,999 | 505 (28.8%) | 52 (22.8%) |
| $2,000 to $2,499 | 62 (3.5%) | 42 (18.4%) |
| $2,500 to $2,999 | 20 (1.1%) | 0 (0.0%) |
| $3,000 or more | 30 (1.7%) | 25 (11.0%) |
| Total | 1,754 (100.0%) | 228 (100.0%) |
Physical Housing Characteristics in Lemmon Valley
Housing Structures in Lemmon Valley
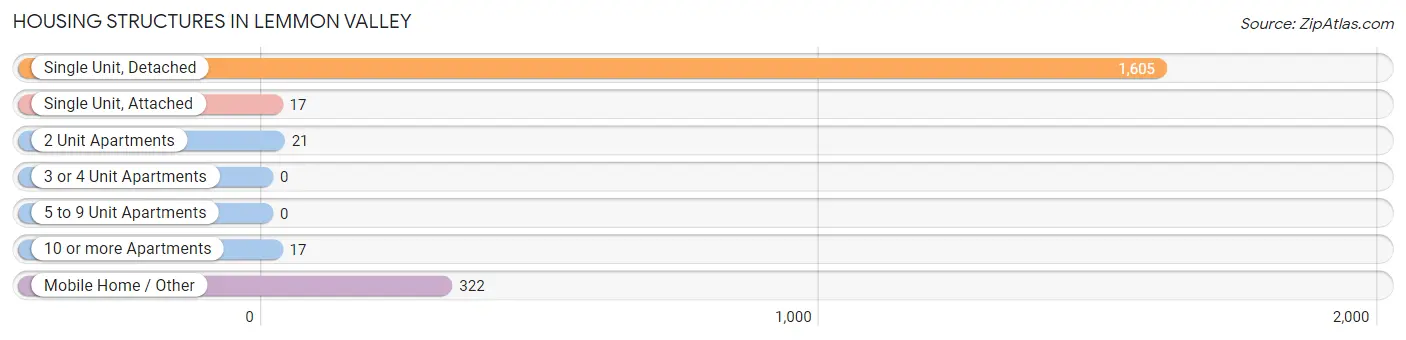
| Structure Type | # Housing Units | % Housing Units |
| Single Unit, Detached | 1,605 | 81.0% |
| Single Unit, Attached | 17 | 0.9% |
| 2 Unit Apartments | 21 | 1.1% |
| 3 or 4 Unit Apartments | 0 | 0.0% |
| 5 to 9 Unit Apartments | 0 | 0.0% |
| 10 or more Apartments | 17 | 0.9% |
| Mobile Home / Other | 322 | 16.3% |
| Total | 1,982 | 100.0% |
Housing Structures by Occupancy in Lemmon Valley
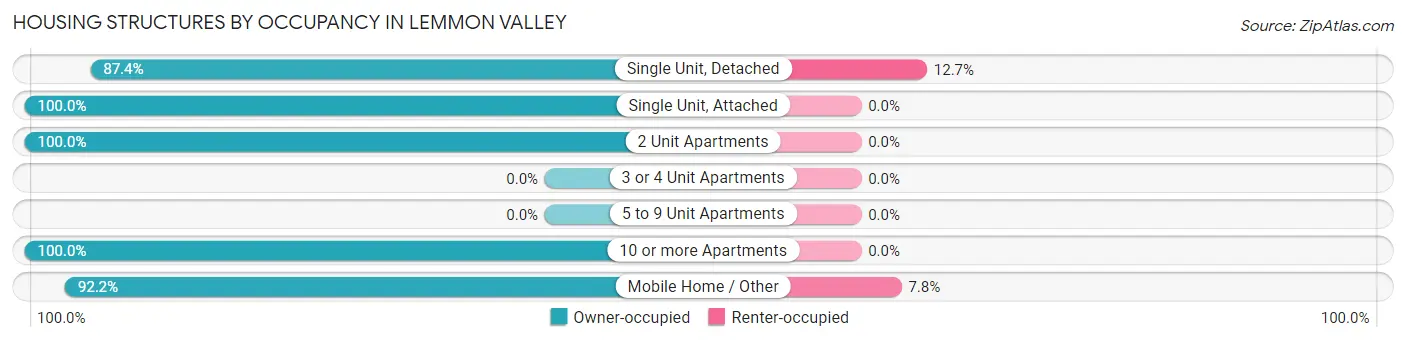
| Structure Type | Owner-occupied | Renter-occupied |
| Single Unit, Detached | 1,402 (87.4%) | 203 (12.7%) |
| Single Unit, Attached | 17 (100.0%) | 0 (0.0%) |
| 2 Unit Apartments | 21 (100.0%) | 0 (0.0%) |
| 3 or 4 Unit Apartments | 0 (0.0%) | 0 (0.0%) |
| 5 to 9 Unit Apartments | 0 (0.0%) | 0 (0.0%) |
| 10 or more Apartments | 17 (100.0%) | 0 (0.0%) |
| Mobile Home / Other | 297 (92.2%) | 25 (7.8%) |
| Total | 1,754 (88.5%) | 228 (11.5%) |
Housing Structures by Number of Rooms in Lemmon Valley
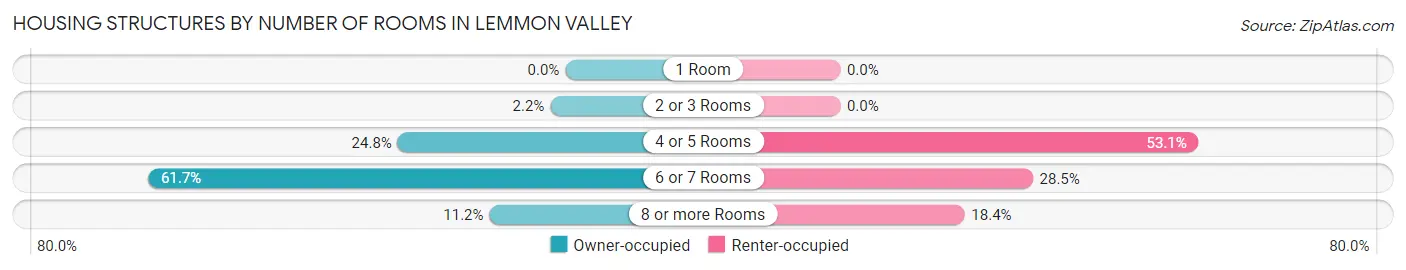
| Number of Rooms | Owner-occupied | Renter-occupied |
| 1 Room | 0 (0.0%) | 0 (0.0%) |
| 2 or 3 Rooms | 39 (2.2%) | 0 (0.0%) |
| 4 or 5 Rooms | 435 (24.8%) | 121 (53.1%) |
| 6 or 7 Rooms | 1,083 (61.7%) | 65 (28.5%) |
| 8 or more Rooms | 197 (11.2%) | 42 (18.4%) |
| Total | 1,754 (100.0%) | 228 (100.0%) |
Housing Structure by Heating Type in Lemmon Valley
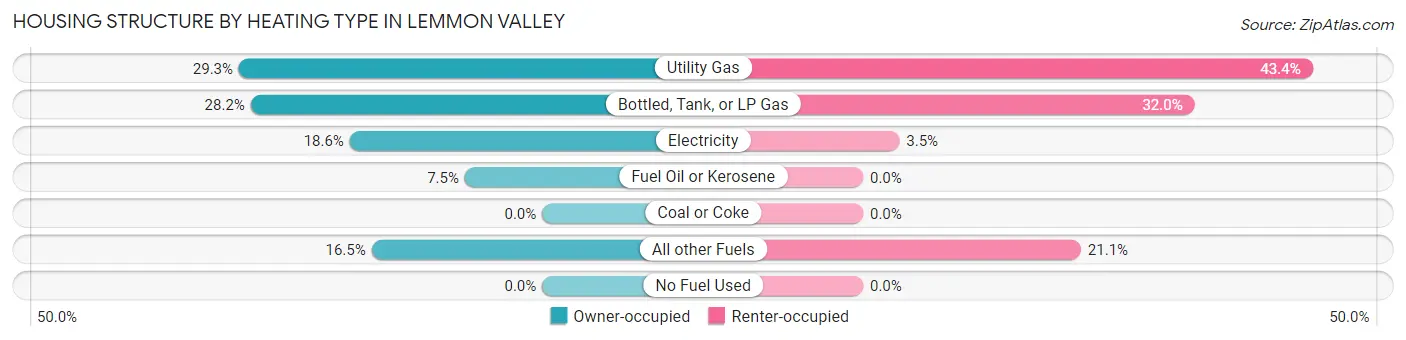
| Heating Type | Owner-occupied | Renter-occupied |
| Utility Gas | 514 (29.3%) | 99 (43.4%) |
| Bottled, Tank, or LP Gas | 494 (28.2%) | 73 (32.0%) |
| Electricity | 326 (18.6%) | 8 (3.5%) |
| Fuel Oil or Kerosene | 131 (7.5%) | 0 (0.0%) |
| Coal or Coke | 0 (0.0%) | 0 (0.0%) |
| All other Fuels | 289 (16.5%) | 48 (21.0%) |
| No Fuel Used | 0 (0.0%) | 0 (0.0%) |
| Total | 1,754 (100.0%) | 228 (100.0%) |
Household Vehicle Usage in Lemmon Valley
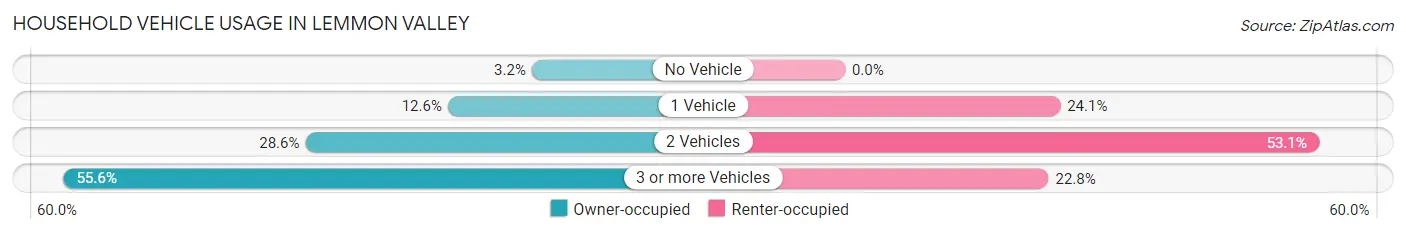
| Vehicles per Household | Owner-occupied | Renter-occupied |
| No Vehicle | 56 (3.2%) | 0 (0.0%) |
| 1 Vehicle | 221 (12.6%) | 55 (24.1%) |
| 2 Vehicles | 501 (28.6%) | 121 (53.1%) |
| 3 or more Vehicles | 976 (55.6%) | 52 (22.8%) |
| Total | 1,754 (100.0%) | 228 (100.0%) |
Real Estate & Mortgages in Lemmon Valley
Real Estate and Mortgage Overview in Lemmon Valley
| Characteristic | Without Mortgage | With Mortgage |
| Housing Units | 497 | 1,257 |
| Median Property Value | $319,100 | $328,200 |
| Median Household Income | $100,169 | $42 |
| Monthly Housing Costs | $417 | $13 |
| Real Estate Taxes | $975 | $47 |
Property Value by Mortgage Status in Lemmon Valley
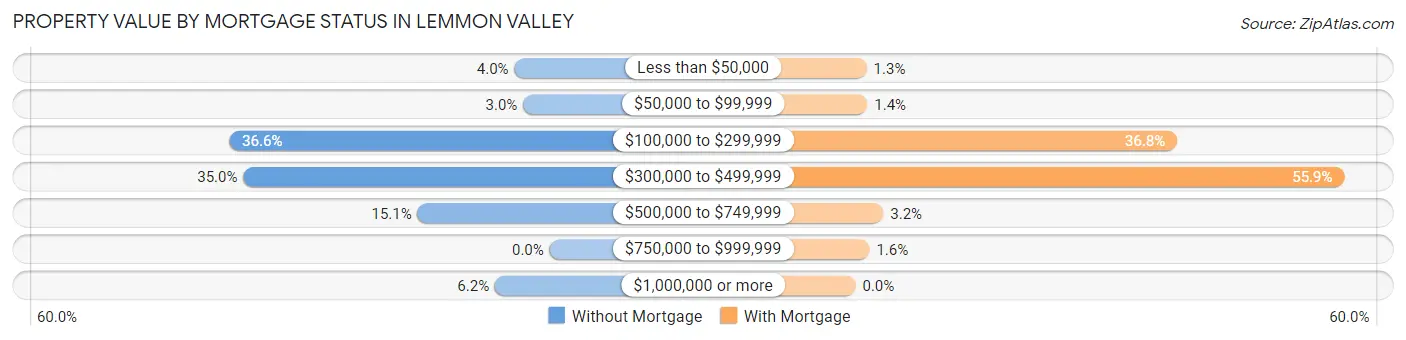
| Property Value | Without Mortgage | With Mortgage |
| Less than $50,000 | 20 (4.0%) | 16 (1.3%) |
| $50,000 to $99,999 | 15 (3.0%) | 17 (1.3%) |
| $100,000 to $299,999 | 182 (36.6%) | 462 (36.7%) |
| $300,000 to $499,999 | 174 (35.0%) | 702 (55.8%) |
| $500,000 to $749,999 | 75 (15.1%) | 40 (3.2%) |
| $750,000 to $999,999 | 0 (0.0%) | 20 (1.6%) |
| $1,000,000 or more | 31 (6.2%) | 0 (0.0%) |
| Total | 497 (100.0%) | 1,257 (100.0%) |
Household Income by Mortgage Status in Lemmon Valley
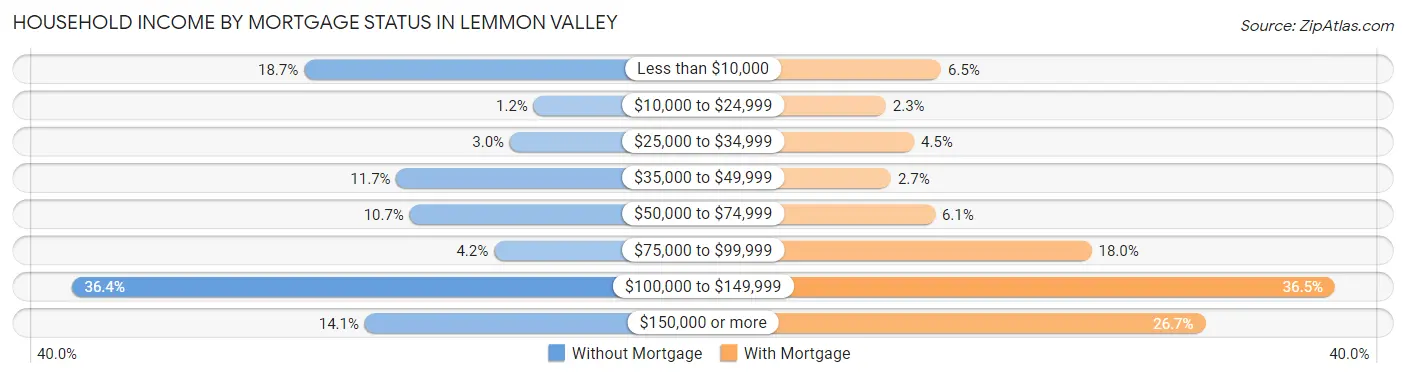
| Household Income | Without Mortgage | With Mortgage |
| Less than $10,000 | 93 (18.7%) | 82 (6.5%) |
| $10,000 to $24,999 | 6 (1.2%) | 29 (2.3%) |
| $25,000 to $34,999 | 15 (3.0%) | 56 (4.5%) |
| $35,000 to $49,999 | 58 (11.7%) | 34 (2.7%) |
| $50,000 to $74,999 | 53 (10.7%) | 76 (6.0%) |
| $75,000 to $99,999 | 21 (4.2%) | 226 (18.0%) |
| $100,000 to $149,999 | 181 (36.4%) | 459 (36.5%) |
| $150,000 or more | 70 (14.1%) | 335 (26.7%) |
| Total | 497 (100.0%) | 1,257 (100.0%) |
Property Value to Household Income Ratio in Lemmon Valley
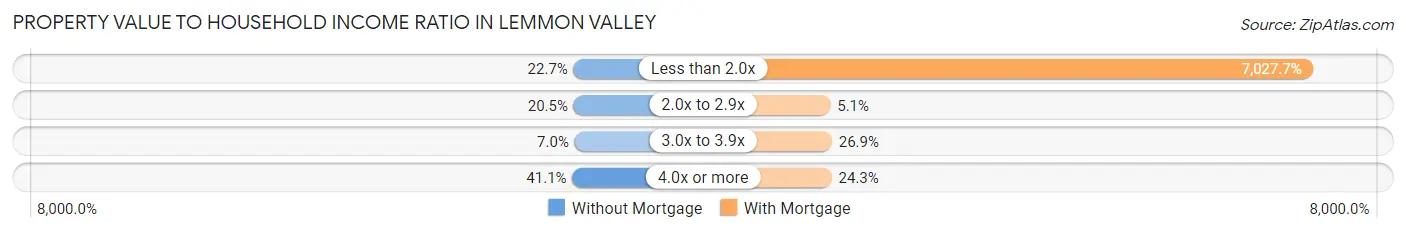
| Value-to-Income Ratio | Without Mortgage | With Mortgage |
| Less than 2.0x | 113 (22.7%) | 88,338 (7,027.7%) |
| 2.0x to 2.9x | 102 (20.5%) | 64 (5.1%) |
| 3.0x to 3.9x | 35 (7.0%) | 338 (26.9%) |
| 4.0x or more | 204 (41.0%) | 306 (24.3%) |
| Total | 497 (100.0%) | 1,257 (100.0%) |
Real Estate Taxes by Mortgage Status in Lemmon Valley
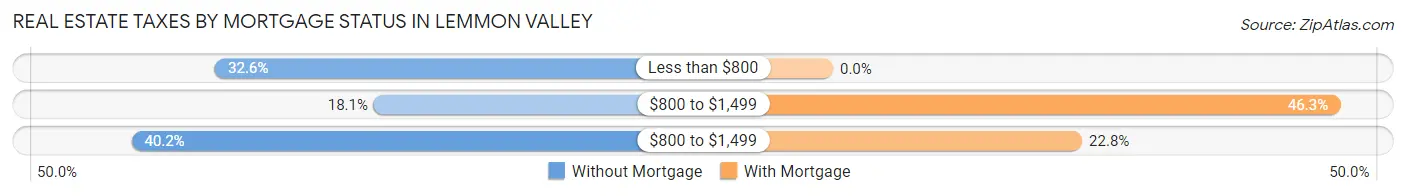
| Property Taxes | Without Mortgage | With Mortgage |
| Less than $800 | 162 (32.6%) | 0 (0.0%) |
| $800 to $1,499 | 90 (18.1%) | 582 (46.3%) |
| $800 to $1,499 | 200 (40.2%) | 286 (22.8%) |
| Total | 497 (100.0%) | 1,257 (100.0%) |
Health & Disability in Lemmon Valley
Health Insurance Coverage by Age in Lemmon Valley
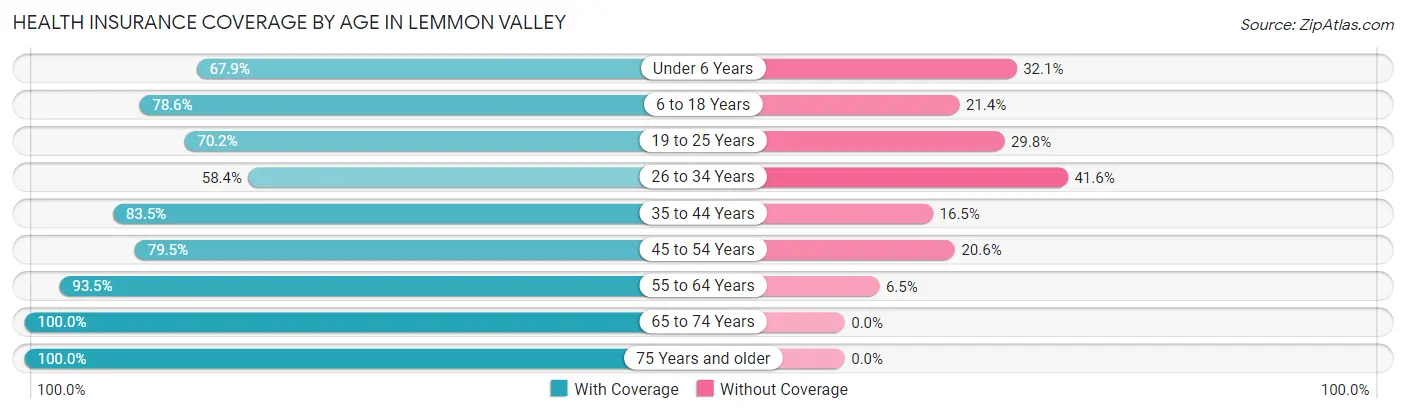
| Age Bracket | With Coverage | Without Coverage |
| Under 6 Years | 89 (67.9%) | 42 (32.1%) |
| 6 to 18 Years | 669 (78.6%) | 182 (21.4%) |
| 19 to 25 Years | 250 (70.2%) | 106 (29.8%) |
| 26 to 34 Years | 411 (58.4%) | 293 (41.6%) |
| 35 to 44 Years | 553 (83.5%) | 109 (16.5%) |
| 45 to 54 Years | 754 (79.4%) | 195 (20.5%) |
| 55 to 64 Years | 506 (93.5%) | 35 (6.5%) |
| 65 to 74 Years | 836 (100.0%) | 0 (0.0%) |
| 75 Years and older | 171 (100.0%) | 0 (0.0%) |
| Total | 4,239 (81.5%) | 962 (18.5%) |
Health Insurance Coverage by Citizenship Status in Lemmon Valley
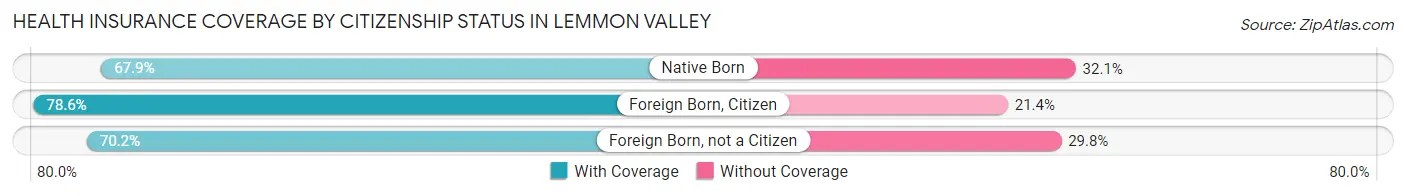
| Citizenship Status | With Coverage | Without Coverage |
| Native Born | 89 (67.9%) | 42 (32.1%) |
| Foreign Born, Citizen | 669 (78.6%) | 182 (21.4%) |
| Foreign Born, not a Citizen | 250 (70.2%) | 106 (29.8%) |
Health Insurance Coverage by Household Income in Lemmon Valley
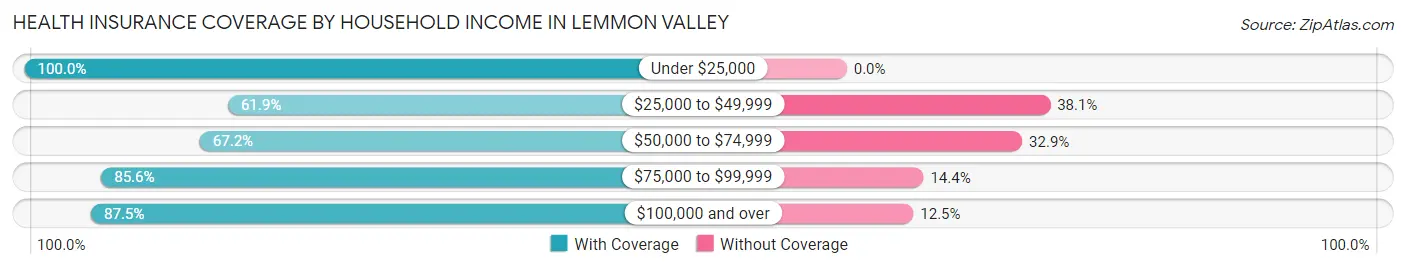
| Household Income | With Coverage | Without Coverage |
| Under $25,000 | 252 (100.0%) | 0 (0.0%) |
| $25,000 to $49,999 | 216 (61.9%) | 133 (38.1%) |
| $50,000 to $74,999 | 748 (67.1%) | 366 (32.9%) |
| $75,000 to $99,999 | 1,293 (85.6%) | 217 (14.4%) |
| $100,000 and over | 1,727 (87.5%) | 246 (12.5%) |
Public vs Private Health Insurance Coverage by Age in Lemmon Valley
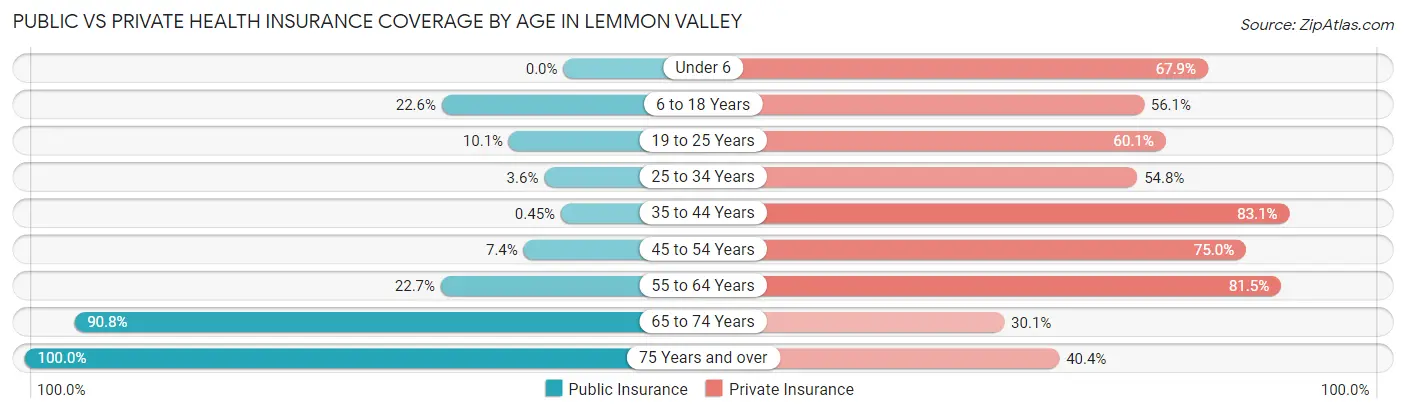
| Age Bracket | Public Insurance | Private Insurance |
| Under 6 | 0 (0.0%) | 89 (67.9%) |
| 6 to 18 Years | 192 (22.6%) | 477 (56.0%) |
| 19 to 25 Years | 36 (10.1%) | 214 (60.1%) |
| 25 to 34 Years | 25 (3.5%) | 386 (54.8%) |
| 35 to 44 Years | 3 (0.4%) | 550 (83.1%) |
| 45 to 54 Years | 70 (7.4%) | 712 (75.0%) |
| 55 to 64 Years | 123 (22.7%) | 441 (81.5%) |
| 65 to 74 Years | 759 (90.8%) | 252 (30.1%) |
| 75 Years and over | 171 (100.0%) | 69 (40.4%) |
| Total | 1,379 (26.5%) | 3,190 (61.3%) |
Disability Status by Sex by Age in Lemmon Valley
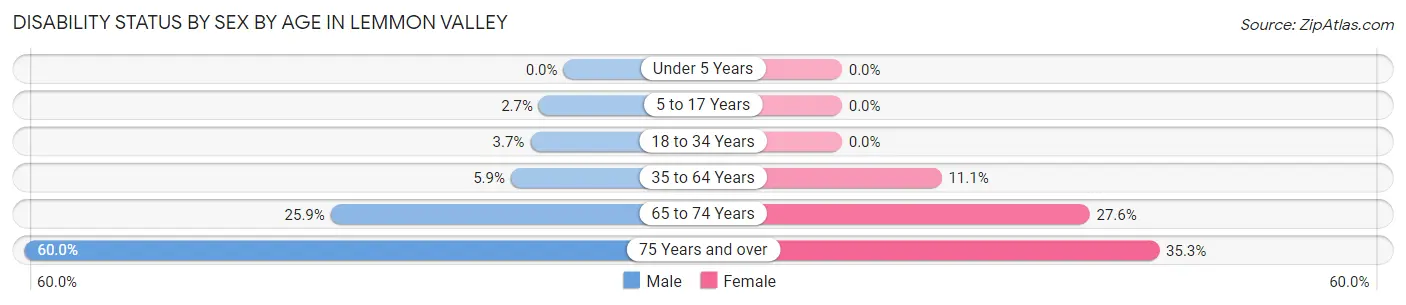
| Age Bracket | Male | Female |
| Under 5 Years | 0 (0.0%) | 0 (0.0%) |
| 5 to 17 Years | 14 (2.7%) | 0 (0.0%) |
| 18 to 34 Years | 23 (3.7%) | 0 (0.0%) |
| 35 to 64 Years | 69 (5.9%) | 108 (11.1%) |
| 65 to 74 Years | 134 (25.9%) | 88 (27.6%) |
| 75 Years and over | 33 (60.0%) | 41 (35.3%) |
Disability Class by Sex by Age in Lemmon Valley
Disability Class: Hearing Difficulty
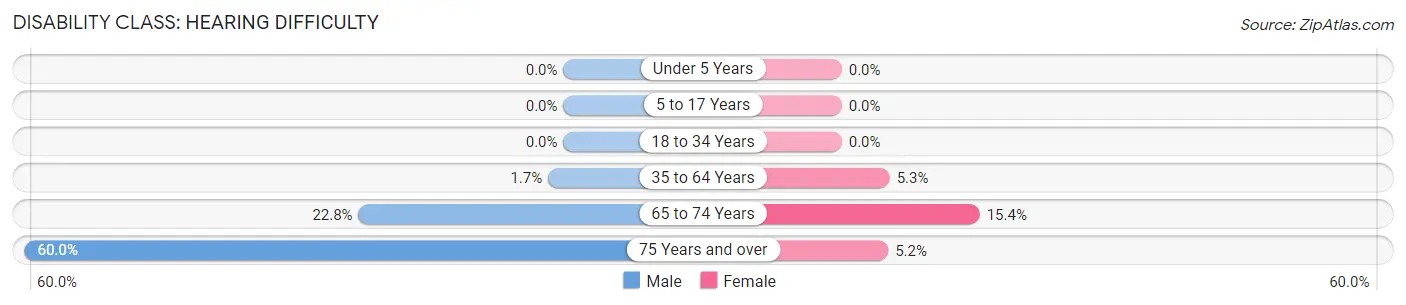
| Age Bracket | Male | Female |
| Under 5 Years | 0 (0.0%) | 0 (0.0%) |
| 5 to 17 Years | 0 (0.0%) | 0 (0.0%) |
| 18 to 34 Years | 0 (0.0%) | 0 (0.0%) |
| 35 to 64 Years | 20 (1.7%) | 52 (5.3%) |
| 65 to 74 Years | 118 (22.8%) | 49 (15.4%) |
| 75 Years and over | 33 (60.0%) | 6 (5.2%) |
Disability Class: Vision Difficulty
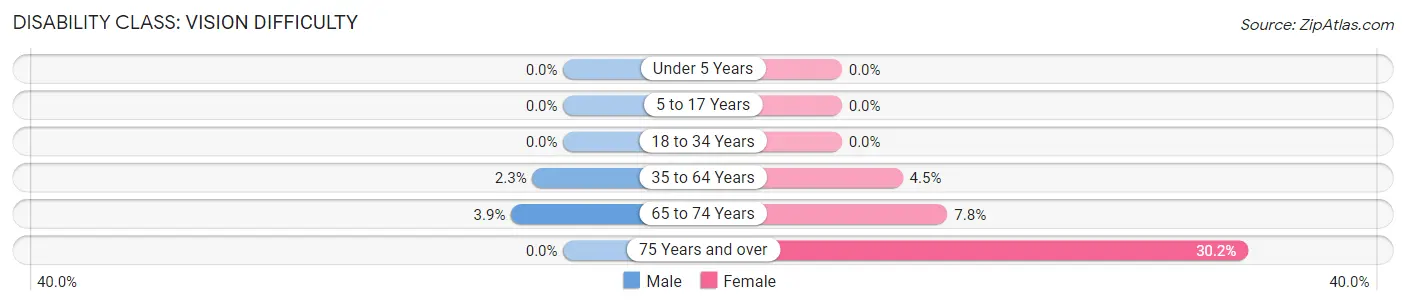
| Age Bracket | Male | Female |
| Under 5 Years | 0 (0.0%) | 0 (0.0%) |
| 5 to 17 Years | 0 (0.0%) | 0 (0.0%) |
| 18 to 34 Years | 0 (0.0%) | 0 (0.0%) |
| 35 to 64 Years | 27 (2.3%) | 44 (4.5%) |
| 65 to 74 Years | 20 (3.9%) | 25 (7.8%) |
| 75 Years and over | 0 (0.0%) | 35 (30.2%) |
Disability Class: Cognitive Difficulty
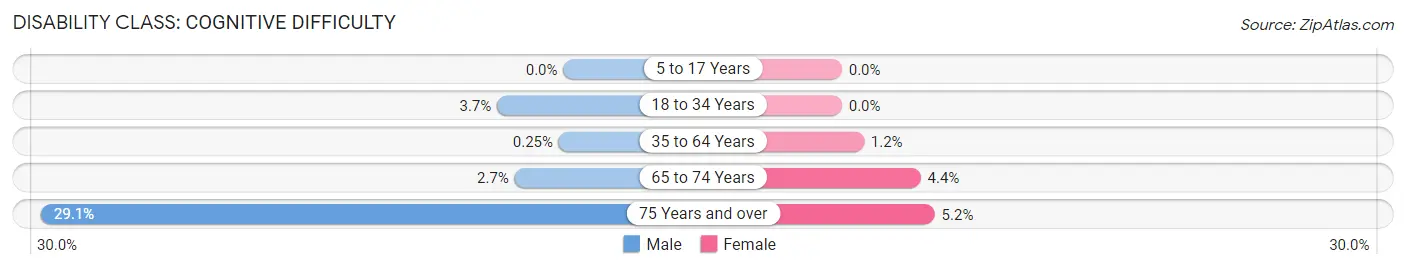
| Age Bracket | Male | Female |
| 5 to 17 Years | 0 (0.0%) | 0 (0.0%) |
| 18 to 34 Years | 23 (3.7%) | 0 (0.0%) |
| 35 to 64 Years | 3 (0.3%) | 12 (1.2%) |
| 65 to 74 Years | 14 (2.7%) | 14 (4.4%) |
| 75 Years and over | 16 (29.1%) | 6 (5.2%) |
Disability Class: Ambulatory Difficulty
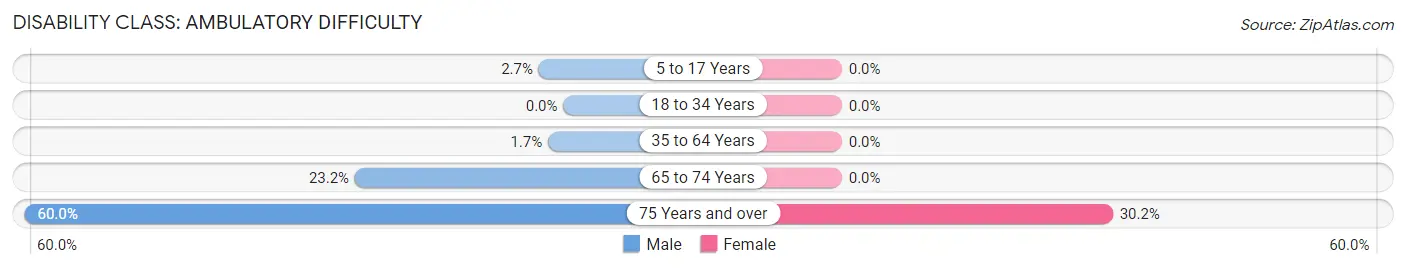
| Age Bracket | Male | Female |
| 5 to 17 Years | 14 (2.7%) | 0 (0.0%) |
| 18 to 34 Years | 0 (0.0%) | 0 (0.0%) |
| 35 to 64 Years | 20 (1.7%) | 0 (0.0%) |
| 65 to 74 Years | 120 (23.2%) | 0 (0.0%) |
| 75 Years and over | 33 (60.0%) | 35 (30.2%) |
Disability Class: Self-Care Difficulty
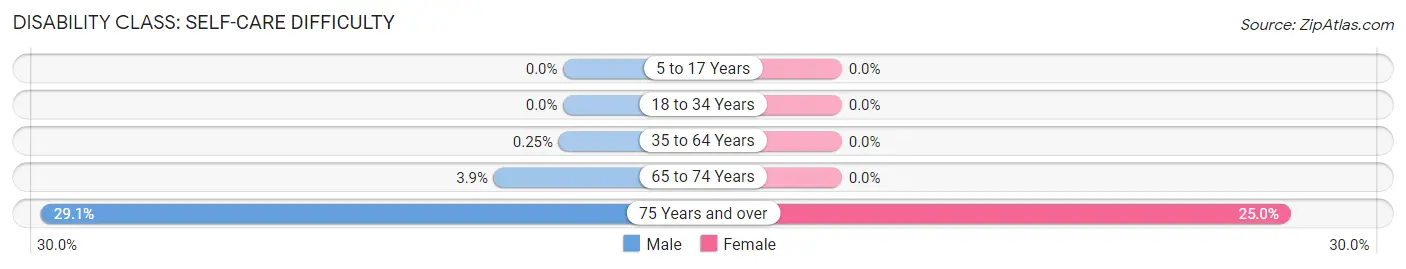
| Age Bracket | Male | Female |
| 5 to 17 Years | 0 (0.0%) | 0 (0.0%) |
| 18 to 34 Years | 0 (0.0%) | 0 (0.0%) |
| 35 to 64 Years | 3 (0.3%) | 0 (0.0%) |
| 65 to 74 Years | 20 (3.9%) | 0 (0.0%) |
| 75 Years and over | 16 (29.1%) | 29 (25.0%) |
Technology Access in Lemmon Valley
Computing Device Access in Lemmon Valley
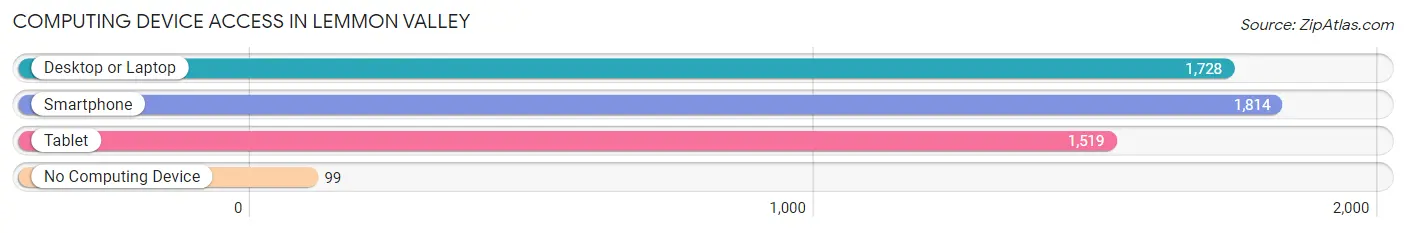
| Device Type | # Households | % Households |
| Desktop or Laptop | 1,728 | 87.2% |
| Smartphone | 1,814 | 91.5% |
| Tablet | 1,519 | 76.6% |
| No Computing Device | 99 | 5.0% |
| Total | 1,982 | 100.0% |
Internet Access in Lemmon Valley
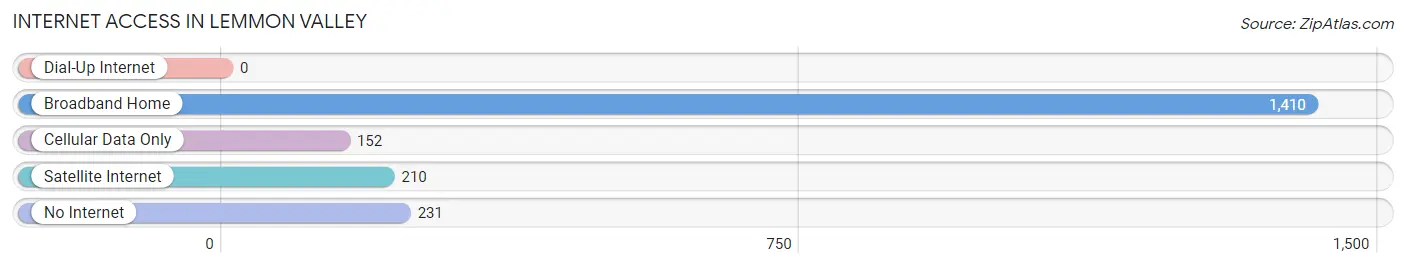
| Internet Type | # Households | % Households |
| Dial-Up Internet | 0 | 0.0% |
| Broadband Home | 1,410 | 71.1% |
| Cellular Data Only | 152 | 7.7% |
| Satellite Internet | 210 | 10.6% |
| No Internet | 231 | 11.7% |
| Total | 1,982 | 100.0% |
Lemmon Valley Summary
Lemmon Valley is an unincorporated community located in Washoe County, Nevada, United States. It is located in the Reno-Sparks metropolitan area, and is part of the Reno–Sparks–Fernley Combined Statistical Area. The population of Lemmon Valley was estimated to be 8,945 in 2019.
History
Lemmon Valley was originally inhabited by the Washoe people, who lived in the area for thousands of years before the arrival of European settlers. The first European settlers arrived in the area in the late 19th century, and the community was named after Lemuel Lemmon, who was one of the first settlers. The area was primarily used for ranching and farming, and the first post office was established in 1891.
In the early 20th century, the area began to develop as a residential community, and the first school was built in the area in 1912. The community continued to grow throughout the 20th century, and in the 1950s, the area was annexed by the City of Reno.
Geography
Lemmon Valley is located in the western part of Washoe County, Nevada, and is part of the Reno–Sparks–Fernley Combined Statistical Area. The community is situated in the Sierra Nevada mountain range, and is located at an elevation of 4,890 feet (1,490 m). The area is located approximately 10 miles (16 km) north of Reno, and is bordered by the cities of Sparks and Sun Valley.
The climate in Lemmon Valley is classified as semi-arid, with hot summers and cold winters. The average annual temperature is 54°F (12°C), and the average annual precipitation is 8.5 inches (216 mm).
Economy
The economy of Lemmon Valley is primarily based on the service industry, with many residents employed in the retail, hospitality, and healthcare sectors. The area is also home to several manufacturing companies, including a large paper mill and a metal fabrication plant.
The area is also home to several agricultural operations, including cattle ranches, vineyards, and farms. The area is also home to several wineries, and the local economy is supported by tourism.
Demographics
As of 2019, the population of Lemmon Valley was estimated to be 8,945. The racial makeup of the community was 79.3% White, 8.2% Hispanic or Latino, 6.2% Asian, 4.2% African American, and 2.1% Native American. The median household income was $60,945, and the median home value was $310,000.
Conclusion
Lemmon Valley is an unincorporated community located in Washoe County, Nevada, United States. It is located in the Reno-Sparks metropolitan area, and is part of the Reno–Sparks–Fernley Combined Statistical Area. The population of Lemmon Valley was estimated to be 8,945 in 2019. The economy of Lemmon Valley is primarily based on the service industry, with many residents employed in the retail, hospitality, and healthcare sectors. The racial makeup of the community was 79.3% White, 8.2% Hispanic or Latino, 6.2% Asian, 4.2% African American, and 2.1% Native American. The median household income was $60,945, and the median home value was $310,000. Lemmon Valley is a vibrant community with a rich history and a diverse economy.
Common Questions
What is Per Capita Income in Lemmon Valley?
Per Capita income in Lemmon Valley is $36,290.
What is the Median Family Income in Lemmon Valley?
Median Family Income in Lemmon Valley is $86,969.
What is the Median Household income in Lemmon Valley?
Median Household Income in Lemmon Valley is $87,052.
What is Income or Wage Gap in Lemmon Valley?
Income or Wage Gap in Lemmon Valley is 24.3%.
Women in Lemmon Valley earn 75.7 cents for every dollar earned by a man.
What is Inequality or Gini Index in Lemmon Valley?
Inequality or Gini Index in Lemmon Valley is 0.34.
What is the Total Population of Lemmon Valley?
Total Population of Lemmon Valley is 5,221.
What is the Total Male Population of Lemmon Valley?
Total Male Population of Lemmon Valley is 2,919.
What is the Total Female Population of Lemmon Valley?
Total Female Population of Lemmon Valley is 2,302.
What is the Ratio of Males per 100 Females in Lemmon Valley?
There are 126.80 Males per 100 Females in Lemmon Valley.
What is the Ratio of Females per 100 Males in Lemmon Valley?
There are 78.86 Females per 100 Males in Lemmon Valley.
What is the Median Population Age in Lemmon Valley?
Median Population Age in Lemmon Valley is 43.1 Years.
What is the Average Family Size in Lemmon Valley
Average Family Size in Lemmon Valley is 3.1 People.
What is the Average Household Size in Lemmon Valley
Average Household Size in Lemmon Valley is 2.6 People.
How Large is the Labor Force in Lemmon Valley?
There are 2,892 People in the Labor Forcein in Lemmon Valley.
What is the Percentage of People in the Labor Force in Lemmon Valley?
64.9% of People are in the Labor Force in Lemmon Valley.
What is the Unemployment Rate in Lemmon Valley?
Unemployment Rate in Lemmon Valley is 0.9%.