Zip Codes with the Highest Percentage of Population Employed in Security & Protection in Las Vegas, NV

RELATED REPORTS & OPTIONS

Security & Protection
Population
Families and Households
Female Fertility
Female Fertility (Unmarried)
Race (Community Size)
Race (Percentage)
Ancestry (Community Size)
AfghanAfricanAlaska NativeAlbanianAleutAmericanApacheArabArapahoArgentineanArmenianAssyrian / Chaldean / SyriacAustralianAustrianBangladeshiBarbadianBasqueBelgianBelizeanBhutaneseBlackfeetBolivianBrazilianBritishBritish West IndianBulgarianBurmeseCajunCambodianCanadianCape VerdeanCelticCentral AmericanCentral American IndianCherokeeCheyenneChickasawChileanChineseChippewaChoctawColombianComancheCosta RicanCreeCreekCroatianCubanCzechCzechoslovakianDanishDelawareDominicanDutchDutch West IndianEastern EuropeanEcuadorianEgyptianEnglishEstonianEthiopianEuropeanFijianFilipinoFinnishFrenchFrench American IndianFrench CanadianGermanGerman RussianGhanaianGreekGuamanian / ChamorroGuatemalanGuyaneseHaitianHonduranHopiHungarianIcelanderIndian (Asian)IndonesianInupiatIranianIraqiIrishIroquoisIsraeliItalianJamaicanJapaneseJordanianKenyanKoreanLaotianLatvianLebaneseLiberianLithuanianLuxembourgerMacedonianMalaysianMalteseMenomineeMexicanMexican American IndianMongolianMoroccanNative HawaiianNavajoNew ZealanderNicaraguanNigerianNorthern EuropeanNorwegianOkinawanOsagePaiutePakistaniPalestinianPanamanianParaguayanPennsylvania GermanPeruvianPimaPolishPortuguesePotawatomiPuebloPuerto RicanPuget Sound SalishRomanianRussianSalvadoranSamoanScandinavianScotch-IrishScottishSeminoleSenegaleseSerbianShoshoneSierra LeoneanSiouxSlavicSlovakSloveneSomaliSouth AfricanSouth AmericanSouth American IndianSoviet UnionSpaniardSpanishSpanish AmericanSpanish American IndianSri LankanSubsaharan AfricanSudaneseSwedishSwissSyrianThaiTlingit-HaidaTohono O'OdhamTonganTrinidadian and TobagonianTurkishU.S. Virgin IslanderUgandanUkrainianUruguayanUteVenezuelanVietnameseWelshWest IndianYaquiYugoslavianYumanYup'ikZimbabwean
Ancestry (Percentage)
AfghanAfricanAlaska NativeAlbanianAleutAmericanApacheArabArapahoArgentineanArmenianAssyrian / Chaldean / SyriacAustralianAustrianBangladeshiBarbadianBasqueBelgianBelizeanBhutaneseBlackfeetBolivianBrazilianBritishBritish West IndianBulgarianBurmeseCajunCambodianCanadianCape VerdeanCelticCentral AmericanCentral American IndianCherokeeCheyenneChickasawChileanChineseChippewaChoctawColombianComancheCosta RicanCreeCreekCroatianCubanCzechCzechoslovakianDanishDelawareDominicanDutchDutch West IndianEastern EuropeanEcuadorianEgyptianEnglishEstonianEthiopianEuropeanFijianFilipinoFinnishFrenchFrench American IndianFrench CanadianGermanGerman RussianGhanaianGreekGuamanian / ChamorroGuatemalanGuyaneseHaitianHonduranHopiHungarianIcelanderIndian (Asian)IndonesianInupiatIranianIraqiIrishIroquoisIsraeliItalianJamaicanJapaneseJordanianKenyanKoreanLaotianLatvianLebaneseLiberianLithuanianLuxembourgerMacedonianMalaysianMalteseMenomineeMexicanMexican American IndianMongolianMoroccanNative HawaiianNavajoNew ZealanderNicaraguanNigerianNorthern EuropeanNorwegianOkinawanOsagePaiutePakistaniPalestinianPanamanianParaguayanPennsylvania GermanPeruvianPimaPolishPortuguesePotawatomiPuebloPuerto RicanPuget Sound SalishRomanianRussianSalvadoranSamoanScandinavianScotch-IrishScottishSeminoleSenegaleseSerbianShoshoneSierra LeoneanSiouxSlavicSlovakSloveneSomaliSouth AfricanSouth AmericanSouth American IndianSoviet UnionSpaniardSpanishSpanish AmericanSpanish American IndianSri LankanSubsaharan AfricanSudaneseSwedishSwissSyrianThaiTlingit-HaidaTohono O'OdhamTonganTrinidadian and TobagonianTurkishU.S. Virgin IslanderUgandanUkrainianUruguayanUteVenezuelanVietnameseWelshWest IndianYaquiYugoslavianYumanYup'ikZimbabwean
Immigrant Origin (Total)
AfghanistanAfricaAlbaniaArgentinaArmeniaAsiaAustraliaAustriaBahamasBangladeshBarbadosBelarusBelgiumBelizeBoliviaBosnia and HerzegovinaBrazilBulgariaBurma / MyanmarCambodiaCameroonCanadaCaribbeanCentral AmericaChileChinaColombiaCosta RicaCroatiaCubaCzechoslovakiaDenmarkDominican RepublicEastern AfricaEastern AsiaEastern EuropeEcuadorEgyptEl SalvadorEnglandEritreaEthiopiaEuropeFijiFranceGermanyGhanaGreeceGuatemalaGuyanaHaitiHondurasHong KongHungaryIndiaIndonesiaIranIraqIrelandIsraelItalyJamaicaJapanJordanKazakhstanKenyaKoreaLaosLatin AmericaLatviaLebanonLiberiaLithuaniaMalaysiaMexicoMicronesiaMiddle AfricaMoldovaMoroccoNepalNetherlandsNicaraguaNigeriaNorth MacedoniaNorthern AfricaNorthern EuropeNorwayOceaniaPakistanPanamaPeruPhilippinesPolandPortugalRomaniaRussiaSaudi ArabiaScotlandSenegalSerbiaSierra LeoneSingaporeSomaliaSouth AfricaSouth AmericaSouth Central AsiaSouth Eastern AsiaSouthern EuropeSpainSri LankaSudanSwedenSwitzerlandSyriaTaiwanThailandTrinidad and TobagoTurkeyUgandaUkraineUruguayUzbekistanVenezuelaVietnamWest IndiesWestern AfricaWestern AsiaWestern EuropeYemenZaireZimbabwe
Immigrant Origin (Percentage)
AfghanistanAfricaAlbaniaArgentinaArmeniaAsiaAustraliaAustriaBahamasBangladeshBarbadosBelarusBelgiumBelizeBoliviaBosnia and HerzegovinaBrazilBulgariaBurma / MyanmarCambodiaCameroonCanadaCaribbeanCentral AmericaChileChinaColombiaCosta RicaCroatiaCubaCzechoslovakiaDenmarkDominican RepublicEastern AfricaEastern AsiaEastern EuropeEcuadorEgyptEl SalvadorEnglandEritreaEthiopiaEuropeFijiFranceGermanyGhanaGreeceGuatemalaGuyanaHaitiHondurasHong KongHungaryIndiaIndonesiaIranIraqIrelandIsraelItalyJamaicaJapanJordanKazakhstanKenyaKoreaLaosLatin AmericaLatviaLebanonLiberiaLithuaniaMalaysiaMexicoMicronesiaMiddle AfricaMoldovaMoroccoNepalNetherlandsNicaraguaNigeriaNorth MacedoniaNorthern AfricaNorthern EuropeNorwayOceaniaPakistanPanamaPeruPhilippinesPolandPortugalRomaniaRussiaSaudi ArabiaScotlandSenegalSerbiaSierra LeoneSingaporeSomaliaSouth AfricaSouth AmericaSouth Central AsiaSouth Eastern AsiaSouthern EuropeSpainSri LankaSudanSwedenSwitzerlandSyriaTaiwanThailandTrinidad and TobagoTurkeyUgandaUkraineUruguayUzbekistanVenezuelaVietnamWest IndiesWestern AfricaWestern AsiaWestern EuropeYemenZaireZimbabwe
Income
Income (Families)
Income (Households)
Poverty
Poverty (Families)
Unemployment
Employment Occupations
Employment Industries
Employer Class
Commute Time
Commute Means
School Enrollment
Education by Degree Field
Occupancy
Finances
Physical Characteristics
Las Vegas
Compare Zip Codes
Comparison Subject

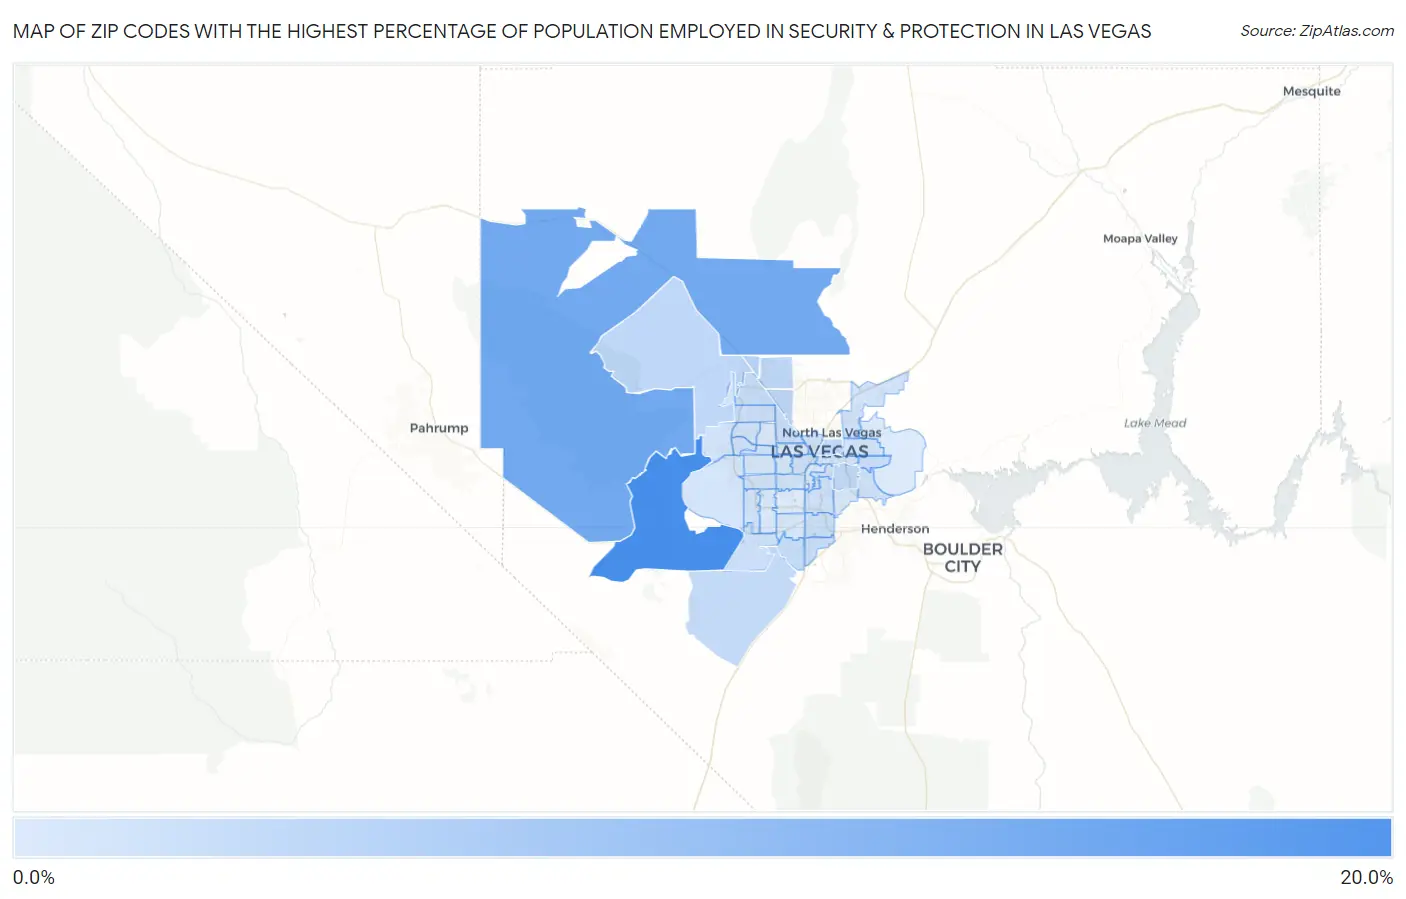
Map of Zip Codes with the Highest Percentage of Population Employed in Security & Protection in Las Vegas

0.0%
20.0%
Zip Codes with the Highest Percentage of Population Employed in Security & Protection in Las Vegas Map

Zip Codes with the Highest Percentage of Population Employed in Security & Protection in Las Vegas, NV

Zip Code % Employed vs State vs National
1.8916117.9%3.0%(+14.9)#22.1%(+15.8)#258
2.8912412.8%3.0%(+9.80)#72.1%(+10.7)#486
3.891435.3%3.0%(+2.28)#182.1%(+3.16)#2,626
4.891314.6%3.0%(+1.57)#282.1%(+2.46)#3,433
5.891664.6%3.0%(+1.53)#292.1%(+2.41)#3,504
6.891304.5%3.0%(+1.46)#302.1%(+2.34)#3,626
7.891214.2%3.0%(+1.20)#352.1%(+2.08)#4,072
8.891794.0%3.0%(+1.02)#392.1%(+1.90)#4,402
9.891013.9%3.0%(+0.894)#412.1%(+1.78)#4,636
10.891413.8%3.0%(+0.819)#432.1%(+1.70)#4,808
11.891493.8%3.0%(+0.738)#462.1%(+1.62)#4,978
12.891833.5%3.0%(+0.460)#542.1%(+1.34)#5,688
13.891423.4%3.0%(+0.415)#552.1%(+1.30)#5,816
14.891293.3%3.0%(+0.254)#602.1%(+1.14)#6,290
15.891083.3%3.0%(+0.236)#612.1%(+1.12)#6,355
16.891233.3%3.0%(+0.228)#622.1%(+1.11)#6,375
17.891783.1%3.0%(+0.066)#652.1%(+0.948)#6,901
18.891193.0%3.0%(-0.060)#692.1%(+0.822)#7,338
19.891023.0%3.0%(-0.079)#702.1%(+0.804)#7,421
20.891452.9%3.0%(-0.155)#732.1%(+0.727)#7,753
21.891342.8%3.0%(-0.185)#752.1%(+0.698)#7,883
22.891062.8%3.0%(-0.264)#762.1%(+0.619)#8,250
23.891692.8%3.0%(-0.276)#772.1%(+0.606)#8,299
24.891442.8%3.0%(-0.280)#782.1%(+0.603)#8,310
25.891222.7%3.0%(-0.296)#802.1%(+0.587)#8,381
26.891472.7%3.0%(-0.322)#812.1%(+0.561)#8,492
27.891152.6%3.0%(-0.420)#842.1%(+0.463)#8,954
28.891482.6%3.0%(-0.458)#852.1%(+0.425)#9,135
29.891042.5%3.0%(-0.520)#882.1%(+0.363)#9,456
30.891382.5%3.0%(-0.559)#892.1%(+0.324)#9,663
31.891032.5%3.0%(-0.566)#902.1%(+0.317)#9,698
32.891352.4%3.0%(-0.602)#912.1%(+0.281)#9,902
33.891462.3%3.0%(-0.744)#942.1%(+0.138)#10,726
34.891102.2%3.0%(-0.789)#952.1%(+0.093)#11,001
35.891392.2%3.0%(-0.821)#962.1%(+0.062)#11,195
36.891172.2%3.0%(-0.880)#982.1%(+0.003)#11,563
37.891132.0%3.0%(-1.05)#1042.1%(-0.170)#12,697
38.891201.9%3.0%(-1.14)#1052.1%(-0.261)#13,322
39.891281.8%3.0%(-1.24)#1072.1%(-0.355)#13,999
40.891091.8%3.0%(-1.27)#1092.1%(-0.387)#14,216
41.891071.6%3.0%(-1.43)#1112.1%(-0.548)#15,411
42.891561.4%3.0%(-1.60)#1152.1%(-0.714)#16,704
43.891181.4%3.0%(-1.64)#1172.1%(-0.756)#17,009

Common Questions

What are the Top 10 Zip Codes with the Highest Percentage of Population Employed in Security & Protection in Las Vegas, NV?
Top 10 Zip Codes with the Highest Percentage of Population Employed in Security & Protection in Las Vegas, NV are:
#1
17.9%
#2
12.8%
#3
5.3%
#4
4.6%
#5
4.6%
#6
4.5%
#7
4.2%
#8
4.0%
#9
3.9%
#10
3.8%
What zip code has the Highest Percentage of Population Employed in Security & Protection in Las Vegas, NV?
89161 has the Highest Percentage of Population Employed in Security & Protection in Las Vegas, NV with 17.9%.
What is the Percentage of Population Employed in Security & Protection in Las Vegas, NV?
Percentage of Population Employed in Security & Protection in Las Vegas is 3.2%.
What is the Percentage of Population Employed in Security & Protection in Nevada?
Percentage of Population Employed in Security & Protection in Nevada is 3.0%.
What is the Percentage of Population Employed in Security & Protection in the United States?
Percentage of Population Employed in Security & Protection in the United States is 2.1%.