Sandy Valley, NV Map & Demographics
Sandy Valley Map
Sandy Valley Overview
$67,037
PER CAPITA INCOME
$99,036
AVG FAMILY INCOME
$86,042
AVG HOUSEHOLD INCOME
0.58
INEQUALITY / GINI INDEX
1,914
TOTAL POPULATION
1,060
MALE POPULATION
854
FEMALE POPULATION
124.12
MALES / 100 FEMALES
80.57
FEMALES / 100 MALES
57.4
MEDIAN AGE
2.7
AVG FAMILY SIZE
2.2
AVG HOUSEHOLD SIZE
705
LABOR FORCE [ PEOPLE ]
38.8%
PERCENT IN LABOR FORCE
10.7%
UNEMPLOYMENT RATE
Income in Sandy Valley
Income Overview in Sandy Valley
Per Capita Income in Sandy Valley is $67,037, while median incomes of families and households are $99,036 and $86,042 respectively.
| Characteristic | Number | Measure |
| Per Capita Income | 1,914 | $67,037 |
| Median Family Income | 543 | $99,036 |
| Mean Family Income | 543 | $173,065 |
| Median Household Income | 881 | $86,042 |
| Mean Household Income | 881 | $131,506 |
| Income Deficit | 543 | $0 |
| Wage / Income Gap (%) | 1,914 | 0.00% |
| Wage / Income Gap ($) | 1,914 | 100.00¢ per $1 |
| Gini / Inequality Index | 1,914 | 0.58 |
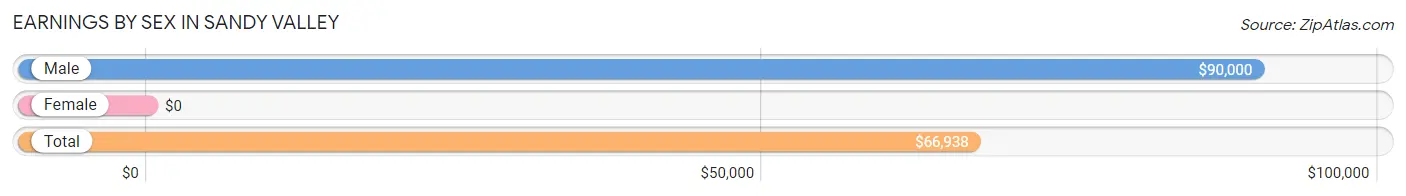
Earnings by Sex in Sandy Valley
| Sex | Number | Average Earnings |
| Male | 528 (64.6%) | $90,000 |
| Female | 289 (35.4%) | $0 |
| Total | 817 (100.0%) | $66,938 |
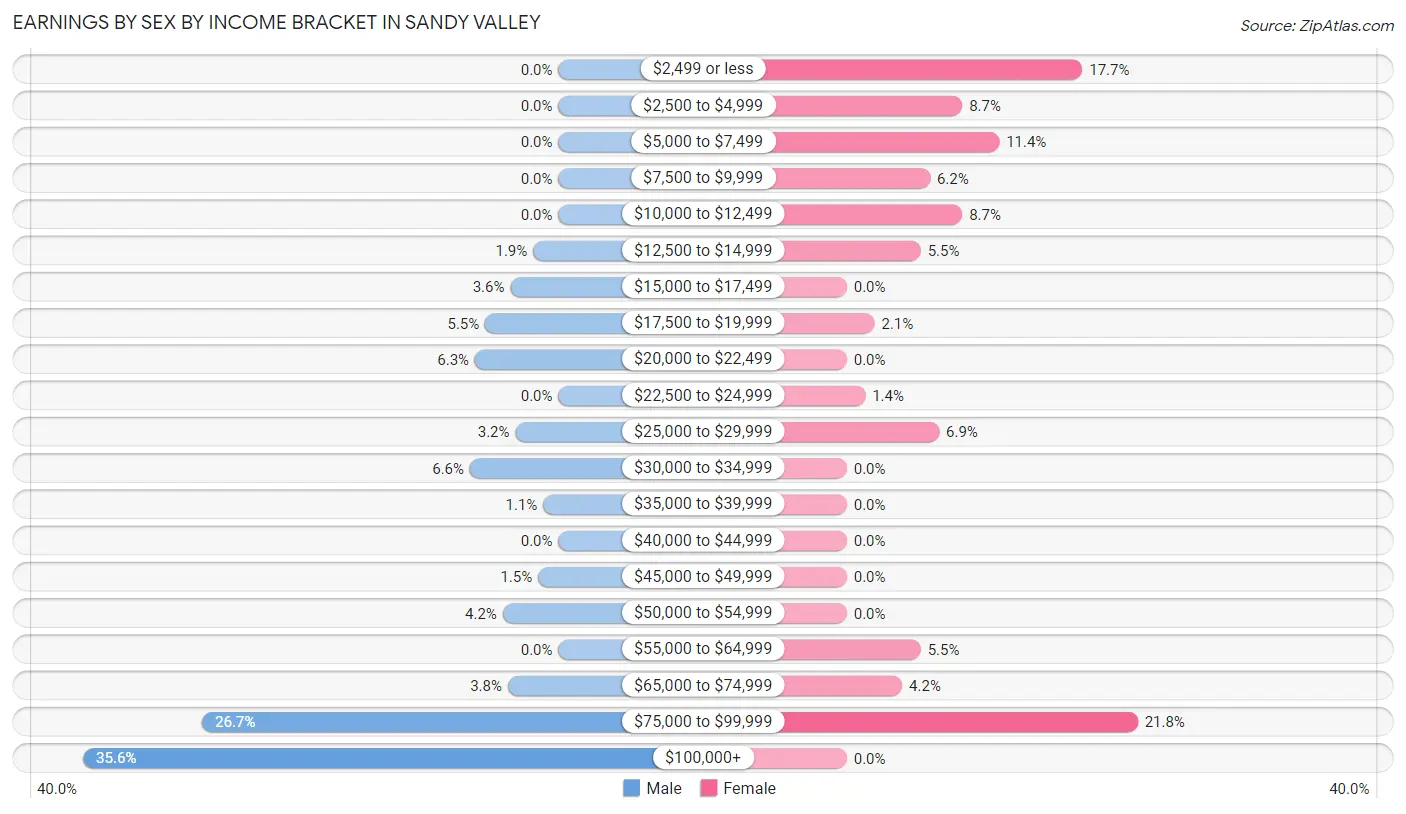
Earnings by Sex by Income Bracket in Sandy Valley
The most common earnings brackets in Sandy Valley are $100,000+ for men (188 | 35.6%) and $75,000 to $99,999 for women (63 | 21.8%).
| Income | Male | Female |
| $2,499 or less | 0 (0.0%) | 51 (17.6%) |
| $2,500 to $4,999 | 0 (0.0%) | 25 (8.6%) |
| $5,000 to $7,499 | 0 (0.0%) | 33 (11.4%) |
| $7,500 to $9,999 | 0 (0.0%) | 18 (6.2%) |
| $10,000 to $12,499 | 0 (0.0%) | 25 (8.6%) |
| $12,500 to $14,999 | 10 (1.9%) | 16 (5.5%) |
| $15,000 to $17,499 | 19 (3.6%) | 0 (0.0%) |
| $17,500 to $19,999 | 29 (5.5%) | 6 (2.1%) |
| $20,000 to $22,499 | 33 (6.2%) | 0 (0.0%) |
| $22,500 to $24,999 | 0 (0.0%) | 4 (1.4%) |
| $25,000 to $29,999 | 17 (3.2%) | 20 (6.9%) |
| $30,000 to $34,999 | 35 (6.6%) | 0 (0.0%) |
| $35,000 to $39,999 | 6 (1.1%) | 0 (0.0%) |
| $40,000 to $44,999 | 0 (0.0%) | 0 (0.0%) |
| $45,000 to $49,999 | 8 (1.5%) | 0 (0.0%) |
| $50,000 to $54,999 | 22 (4.2%) | 0 (0.0%) |
| $55,000 to $64,999 | 0 (0.0%) | 16 (5.5%) |
| $65,000 to $74,999 | 20 (3.8%) | 12 (4.2%) |
| $75,000 to $99,999 | 141 (26.7%) | 63 (21.8%) |
| $100,000+ | 188 (35.6%) | 0 (0.0%) |
| Total | 528 (100.0%) | 289 (100.0%) |
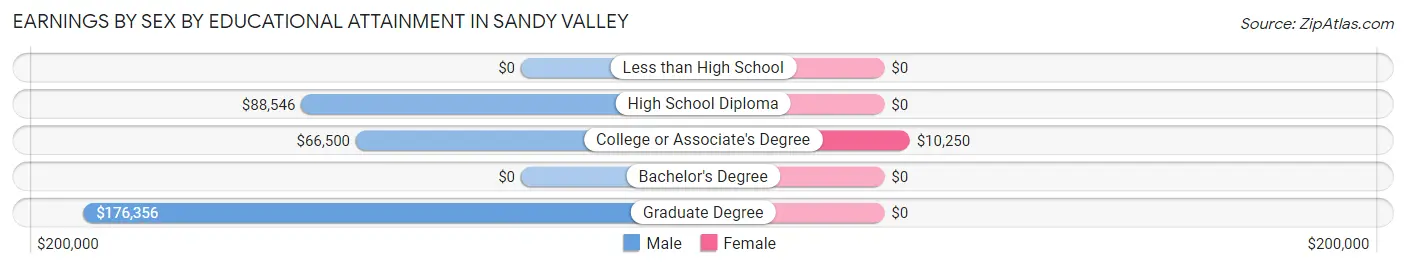
Earnings by Sex by Educational Attainment in Sandy Valley
| Educational Attainment | Male Income | Female Income |
| Less than High School | - | - |
| High School Diploma | $88,546 | $0 |
| College or Associate's Degree | $66,500 | $10,250 |
| Bachelor's Degree | - | - |
| Graduate Degree | $176,356 | $0 |
| Total | $91,731 | $0 |
Family Income in Sandy Valley
Family Income Brackets in Sandy Valley
According to the Sandy Valley family income data, there are 133 families falling into the $100,000 to $149,999 income range, which is the most common income bracket and makes up 24.5% of all families.
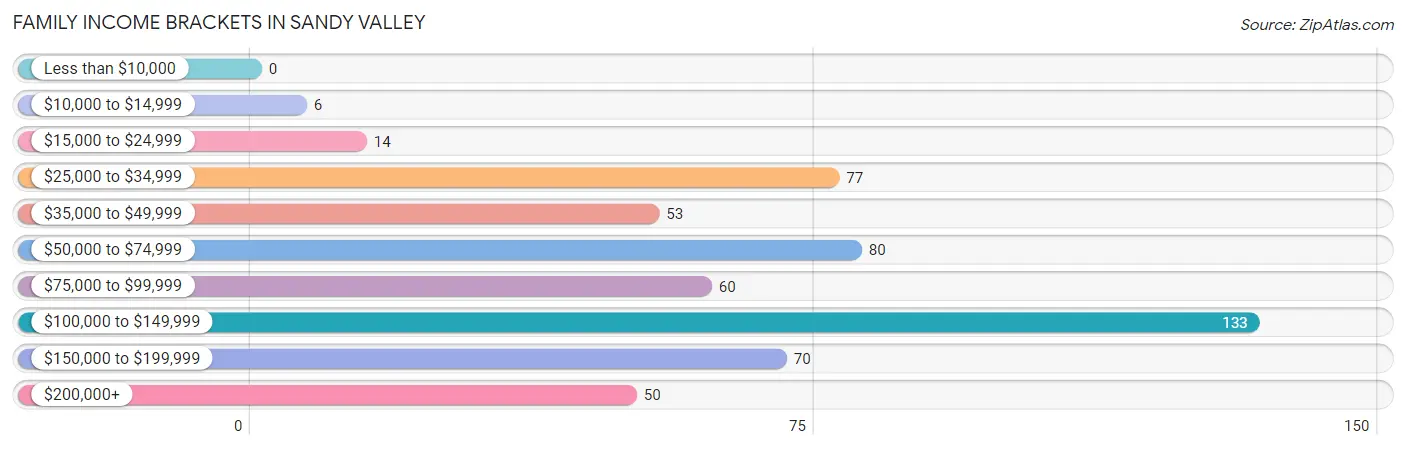
| Income Bracket | # Families | % Families |
| Less than $10,000 | 0 | 0.0% |
| $10,000 to $14,999 | 6 | 1.1% |
| $15,000 to $24,999 | 14 | 2.6% |
| $25,000 to $34,999 | 77 | 14.2% |
| $35,000 to $49,999 | 53 | 9.8% |
| $50,000 to $74,999 | 80 | 14.7% |
| $75,000 to $99,999 | 60 | 11.0% |
| $100,000 to $149,999 | 133 | 24.5% |
| $150,000 to $199,999 | 70 | 12.9% |
| $200,000+ | 50 | 9.2% |
Family Income by Famaliy Size in Sandy Valley
5-person families (30 | 5.5%) account for the highest median family income in Sandy Valley with $122,794 per family, while 2-person families (382 | 70.4%) have the highest median income of $49,870 per family member.
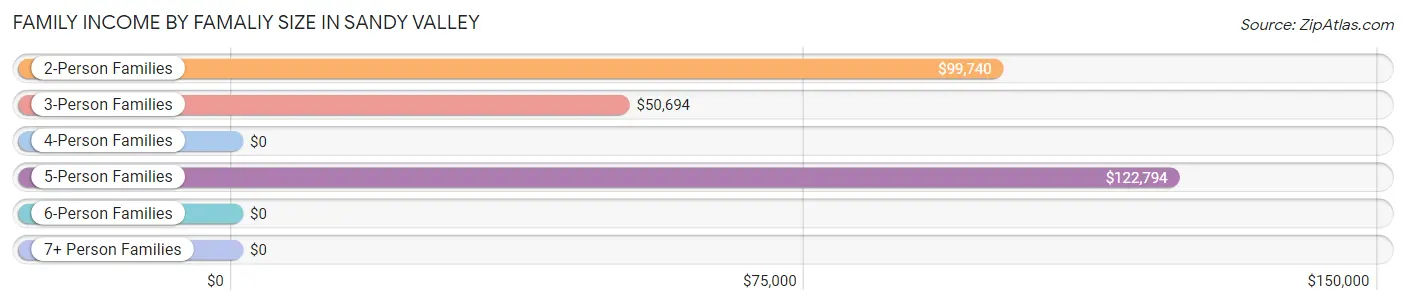
| Income Bracket | # Families | Median Income |
| 2-Person Families | 382 (70.4%) | $99,740 |
| 3-Person Families | 88 (16.2%) | $50,694 |
| 4-Person Families | 14 (2.6%) | $0 |
| 5-Person Families | 30 (5.5%) | $122,794 |
| 6-Person Families | 29 (5.3%) | $0 |
| 7+ Person Families | 0 (0.0%) | $0 |
| Total | 543 (100.0%) | $99,036 |
Family Income by Number of Earners in Sandy Valley
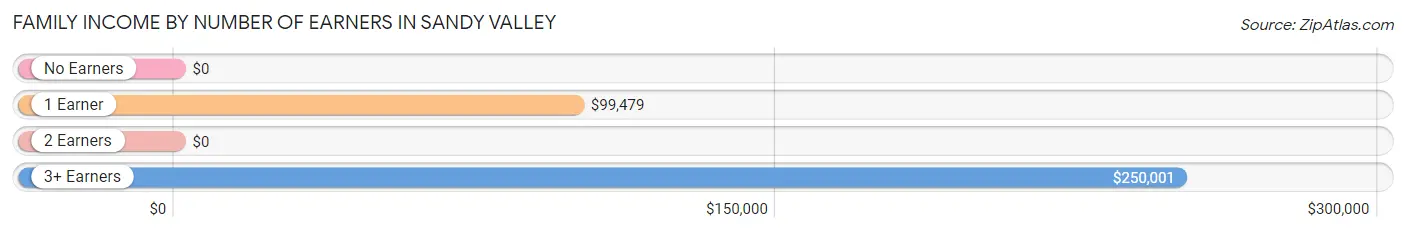
| Number of Earners | # Families | Median Income |
| No Earners | 169 (31.1%) | $0 |
| 1 Earner | 202 (37.2%) | $99,479 |
| 2 Earners | 122 (22.5%) | $0 |
| 3+ Earners | 50 (9.2%) | $250,001 |
| Total | 543 (100.0%) | $99,036 |
Household Income in Sandy Valley
Household Income Brackets in Sandy Valley
With 175 households falling in the category, the $15,000 to $24,999 income range is the most frequent in Sandy Valley, accounting for 19.9% of all households.
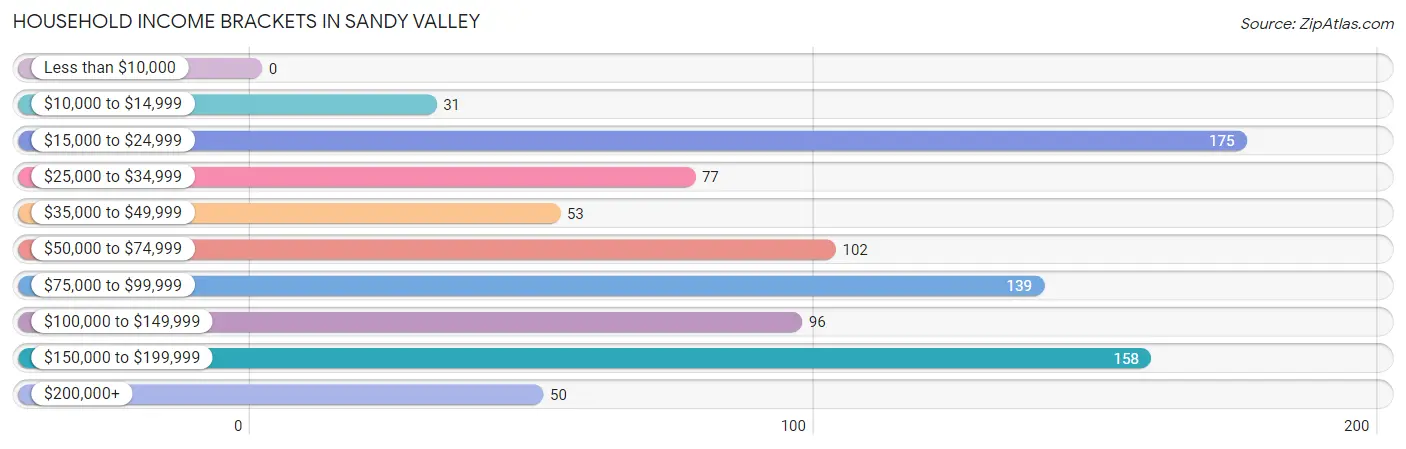
| Income Bracket | # Households | % Households |
| Less than $10,000 | 0 | 0.0% |
| $10,000 to $14,999 | 31 | 3.5% |
| $15,000 to $24,999 | 175 | 19.9% |
| $25,000 to $34,999 | 77 | 8.7% |
| $35,000 to $49,999 | 53 | 6.0% |
| $50,000 to $74,999 | 102 | 11.6% |
| $75,000 to $99,999 | 139 | 15.8% |
| $100,000 to $149,999 | 96 | 10.9% |
| $150,000 to $199,999 | 158 | 17.9% |
| $200,000+ | 50 | 5.7% |
Household Income by Householder Age in Sandy Valley
The median household income in Sandy Valley is $86,042, with the highest median household income of $99,479 found in the 25 to 44 years age bracket for the primary householder. A total of 96 households (10.9%) fall into this category. Meanwhile, the 15 to 24 years age bracket for the primary householder has the lowest median household income of $0, with 39 households (4.4%) in this group.
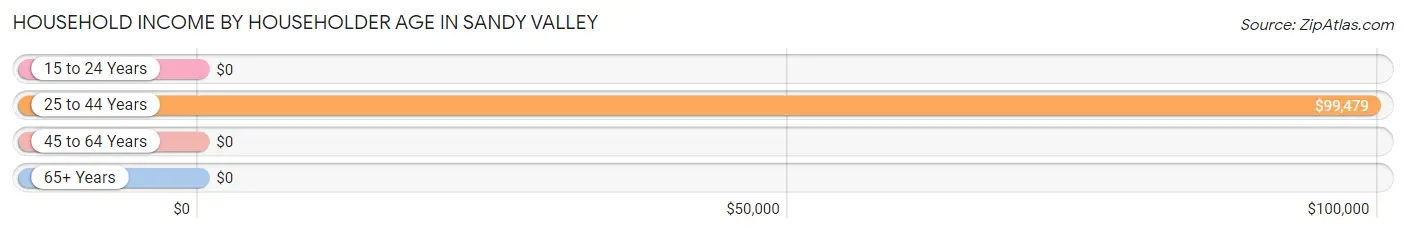
| Income Bracket | # Households | Median Income |
| 15 to 24 Years | 39 (4.4%) | $0 |
| 25 to 44 Years | 96 (10.9%) | $99,479 |
| 45 to 64 Years | 533 (60.5%) | $0 |
| 65+ Years | 213 (24.2%) | $0 |
| Total | 881 (100.0%) | $86,042 |
Poverty in Sandy Valley
Income Below Poverty by Sex and Age in Sandy Valley
With 4.2% poverty level for males and 11.5% for females among the residents of Sandy Valley, 18 to 24 year old males and 75 year old and over females are the most vulnerable to poverty, with 17 males (9.6%) and 14 females (41.2%) in their respective age groups living below the poverty level.
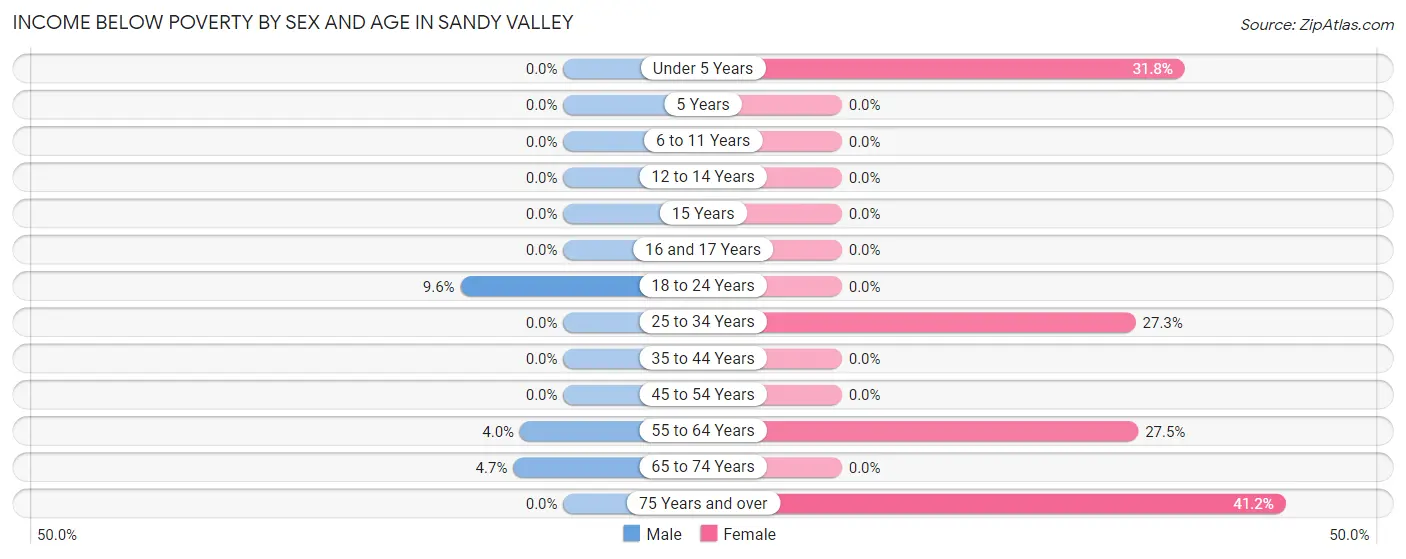
| Age Bracket | Male | Female |
| Under 5 Years | 0 (0.0%) | 14 (31.8%) |
| 5 Years | 0 (0.0%) | 0 (0.0%) |
| 6 to 11 Years | 0 (0.0%) | 0 (0.0%) |
| 12 to 14 Years | 0 (0.0%) | 0 (0.0%) |
| 15 Years | 0 (0.0%) | 0 (0.0%) |
| 16 and 17 Years | 0 (0.0%) | 0 (0.0%) |
| 18 to 24 Years | 17 (9.6%) | 0 (0.0%) |
| 25 to 34 Years | 0 (0.0%) | 18 (27.3%) |
| 35 to 44 Years | 0 (0.0%) | 0 (0.0%) |
| 45 to 54 Years | 0 (0.0%) | 0 (0.0%) |
| 55 to 64 Years | 21 (4.0%) | 52 (27.5%) |
| 65 to 74 Years | 6 (4.6%) | 0 (0.0%) |
| 75 Years and over | 0 (0.0%) | 14 (41.2%) |
| Total | 44 (4.2%) | 98 (11.5%) |
Income Above Poverty by Sex and Age in Sandy Valley
According to the poverty statistics in Sandy Valley, males aged under 5 years and females aged 12 to 14 years are the age groups that are most secure financially, with 100.0% of males and 100.0% of females in these age groups living above the poverty line.
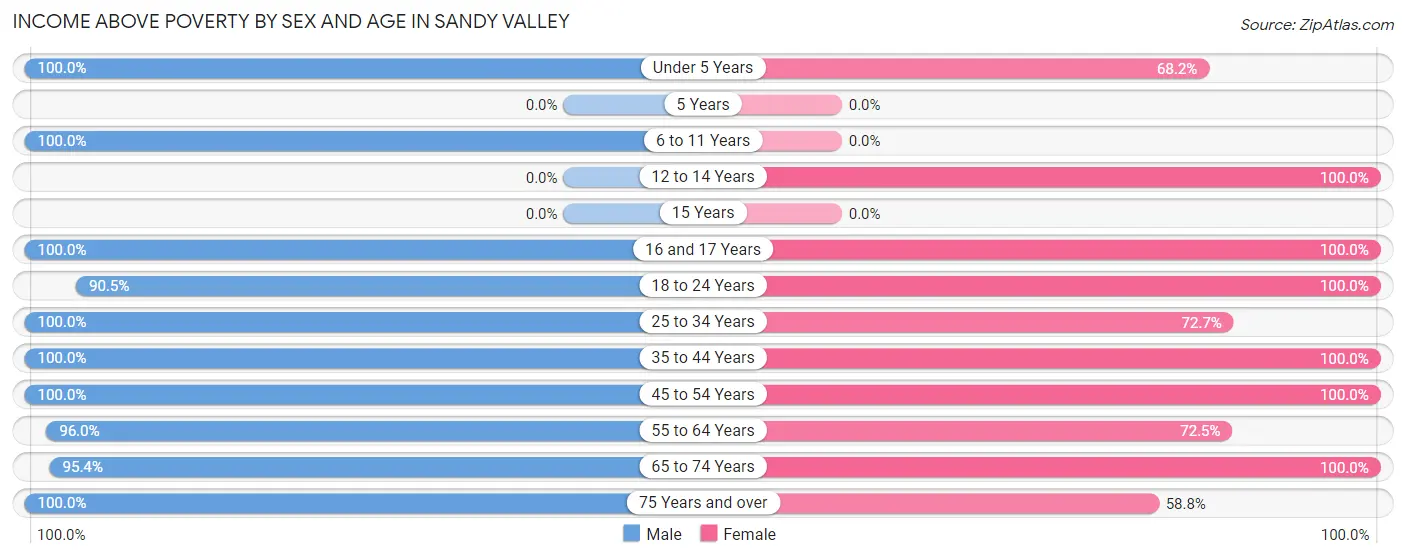
| Age Bracket | Male | Female |
| Under 5 Years | 12 (100.0%) | 30 (68.2%) |
| 5 Years | 0 (0.0%) | 0 (0.0%) |
| 6 to 11 Years | 14 (100.0%) | 0 (0.0%) |
| 12 to 14 Years | 0 (0.0%) | 28 (100.0%) |
| 15 Years | 0 (0.0%) | 0 (0.0%) |
| 16 and 17 Years | 11 (100.0%) | 20 (100.0%) |
| 18 to 24 Years | 161 (90.4%) | 11 (100.0%) |
| 25 to 34 Years | 14 (100.0%) | 48 (72.7%) |
| 35 to 44 Years | 78 (100.0%) | 41 (100.0%) |
| 45 to 54 Years | 78 (100.0%) | 131 (100.0%) |
| 55 to 64 Years | 500 (96.0%) | 137 (72.5%) |
| 65 to 74 Years | 123 (95.4%) | 290 (100.0%) |
| 75 Years and over | 25 (100.0%) | 20 (58.8%) |
| Total | 1,016 (95.9%) | 756 (88.5%) |
Income Below Poverty Among Married-Couple Families in Sandy Valley
The poverty statistics for married-couple families in Sandy Valley show that 1.3% or 6 of the total 468 families live below the poverty line. Families with no children have the highest poverty rate of 1.5%, comprising of 6 families. On the other hand, families with 1 or 2 children have the lowest poverty rate of 0.0%, which includes 0 families.
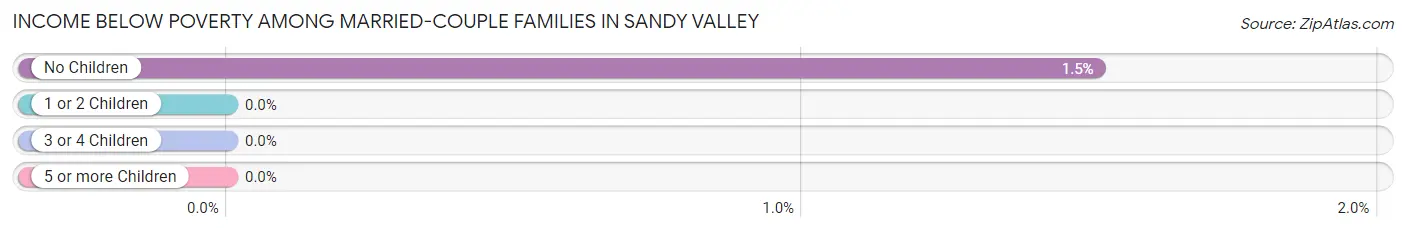
| Children | Above Poverty | Below Poverty |
| No Children | 391 (98.5%) | 6 (1.5%) |
| 1 or 2 Children | 62 (100.0%) | 0 (0.0%) |
| 3 or 4 Children | 9 (100.0%) | 0 (0.0%) |
| 5 or more Children | 0 (0.0%) | 0 (0.0%) |
| Total | 462 (98.7%) | 6 (1.3%) |
Income Below Poverty Among Single-Parent Households in Sandy Valley
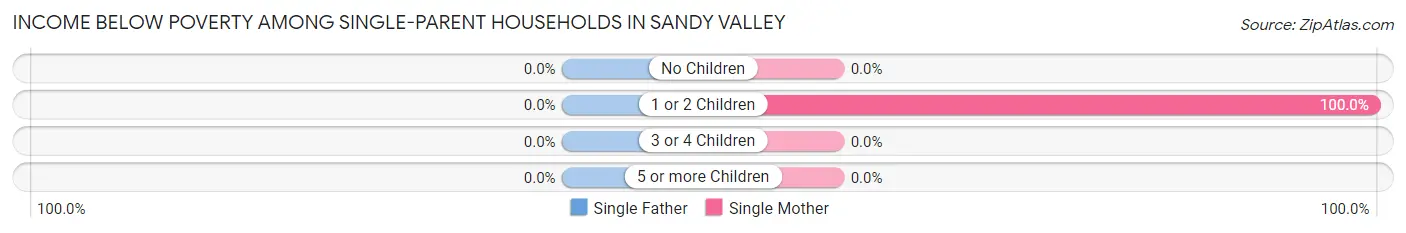
| Children | Single Father | Single Mother |
| No Children | 0 (0.0%) | 0 (0.0%) |
| 1 or 2 Children | 0 (0.0%) | 14 (100.0%) |
| 3 or 4 Children | 0 (0.0%) | 0 (0.0%) |
| 5 or more Children | 0 (0.0%) | 0 (0.0%) |
| Total | 0 (0.0%) | 14 (18.7%) |
Income Below Poverty Among Married-Couple vs Single-Parent Households in Sandy Valley
The poverty data for Sandy Valley shows that 6 of the married-couple family households (1.3%) and 14 of the single-parent households (18.7%) are living below the poverty level. Within the married-couple family households, those with no children have the highest poverty rate, with 6 households (1.5%) falling below the poverty line. Among the single-parent households, those with 1 or 2 children have the highest poverty rate, with 14 household (100.0%) living below poverty.
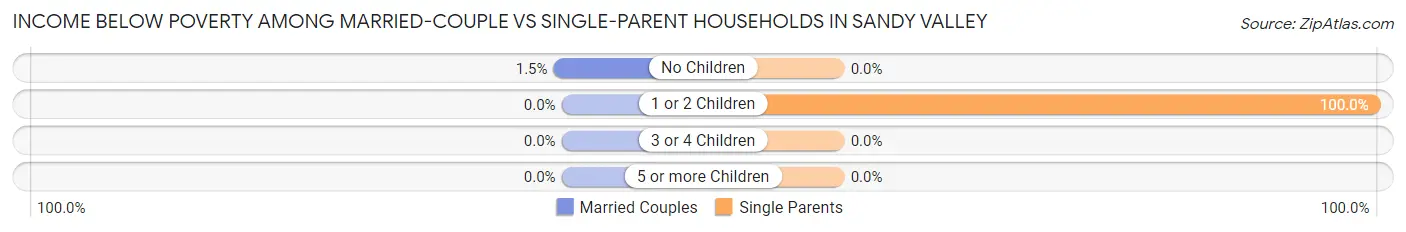
| Children | Married-Couple Families | Single-Parent Households |
| No Children | 6 (1.5%) | 0 (0.0%) |
| 1 or 2 Children | 0 (0.0%) | 14 (100.0%) |
| 3 or 4 Children | 0 (0.0%) | 0 (0.0%) |
| 5 or more Children | 0 (0.0%) | 0 (0.0%) |
| Total | 6 (1.3%) | 14 (18.7%) |
Race in Sandy Valley
The most populous races in Sandy Valley are White / Caucasian (1,689 | 88.2%), Hispanic or Latino (234 | 12.2%), and Asian (90 | 4.7%).
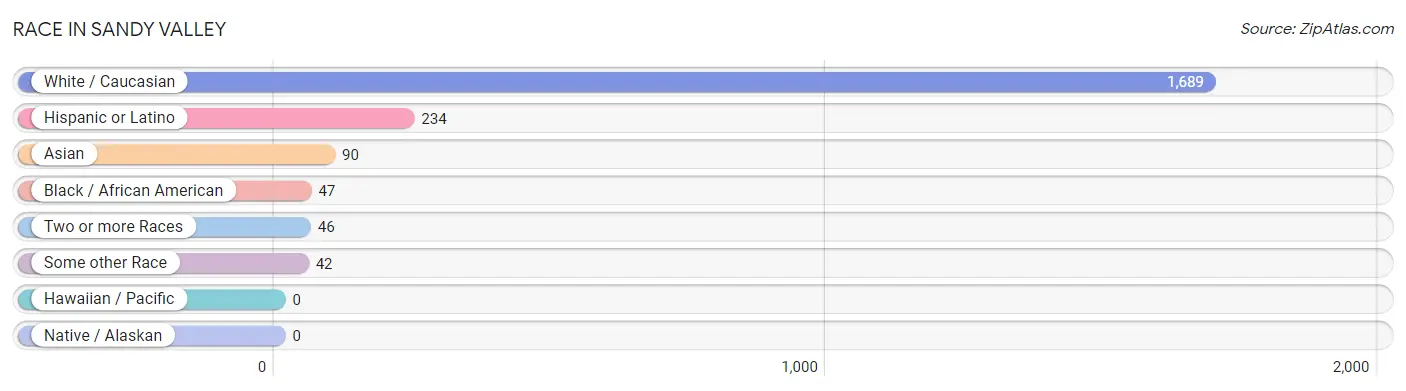
| Race | # Population | % Population |
| Asian | 90 | 4.7% |
| Black / African American | 47 | 2.5% |
| Hawaiian / Pacific | 0 | 0.0% |
| Hispanic or Latino | 234 | 12.2% |
| Native / Alaskan | 0 | 0.0% |
| White / Caucasian | 1,689 | 88.2% |
| Two or more Races | 46 | 2.4% |
| Some other Race | 42 | 2.2% |
| Total | 1,914 | 100.0% |
Ancestry in Sandy Valley
The most populous ancestries reported in Sandy Valley are German (501 | 26.2%), Mexican (234 | 12.2%), Irish (137 | 7.2%), English (97 | 5.1%), and Korean (77 | 4.0%), together accounting for 54.7% of all Sandy Valley residents.
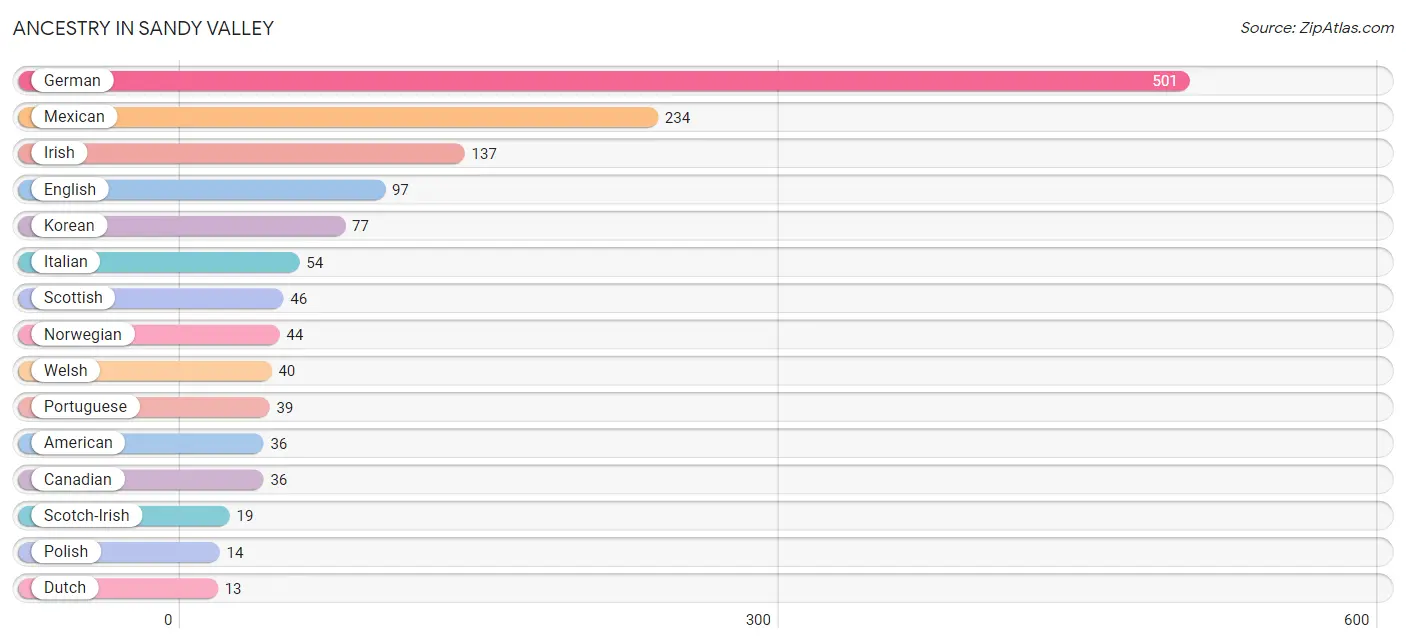
| Ancestry | # Population | % Population |
| American | 36 | 1.9% |
| Canadian | 36 | 1.9% |
| Cypriot | 11 | 0.6% |
| Dutch | 13 | 0.7% |
| Eastern European | 6 | 0.3% |
| English | 97 | 5.1% |
| German | 501 | 26.2% |
| Irish | 137 | 7.2% |
| Italian | 54 | 2.8% |
| Korean | 77 | 4.0% |
| Laotian | 13 | 0.7% |
| Mexican | 234 | 12.2% |
| Norwegian | 44 | 2.3% |
| Polish | 14 | 0.7% |
| Portuguese | 39 | 2.0% |
| Scotch-Irish | 19 | 1.0% |
| Scottish | 46 | 2.4% |
| Welsh | 40 | 2.1% | View All 18 Rows |
Immigrants in Sandy Valley
The most numerous immigrant groups reported in Sandy Valley came from Latin America (83 | 4.3%), Central America (78 | 4.1%), Mexico (78 | 4.1%), Asia (48 | 2.5%), and Philippines (29 | 1.5%), together accounting for 16.5% of all Sandy Valley residents.
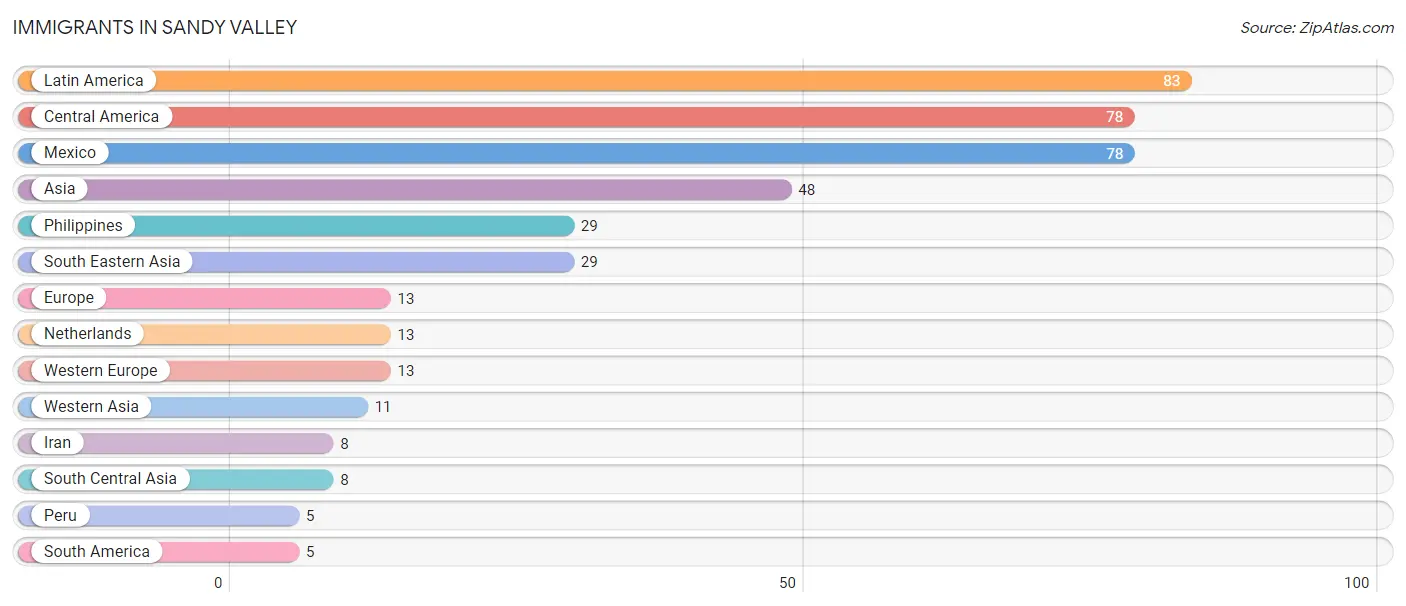
| Immigration Origin | # Population | % Population |
| Asia | 48 | 2.5% |
| Central America | 78 | 4.1% |
| Europe | 13 | 0.7% |
| Iran | 8 | 0.4% |
| Latin America | 83 | 4.3% |
| Mexico | 78 | 4.1% |
| Netherlands | 13 | 0.7% |
| Peru | 5 | 0.3% |
| Philippines | 29 | 1.5% |
| South America | 5 | 0.3% |
| South Central Asia | 8 | 0.4% |
| South Eastern Asia | 29 | 1.5% |
| Western Asia | 11 | 0.6% |
| Western Europe | 13 | 0.7% | View All 14 Rows |
Sex and Age in Sandy Valley
Sex and Age in Sandy Valley
The most populous age groups in Sandy Valley are 55 to 59 Years (381 | 35.9%) for men and 70 to 74 Years (157 | 18.4%) for women.
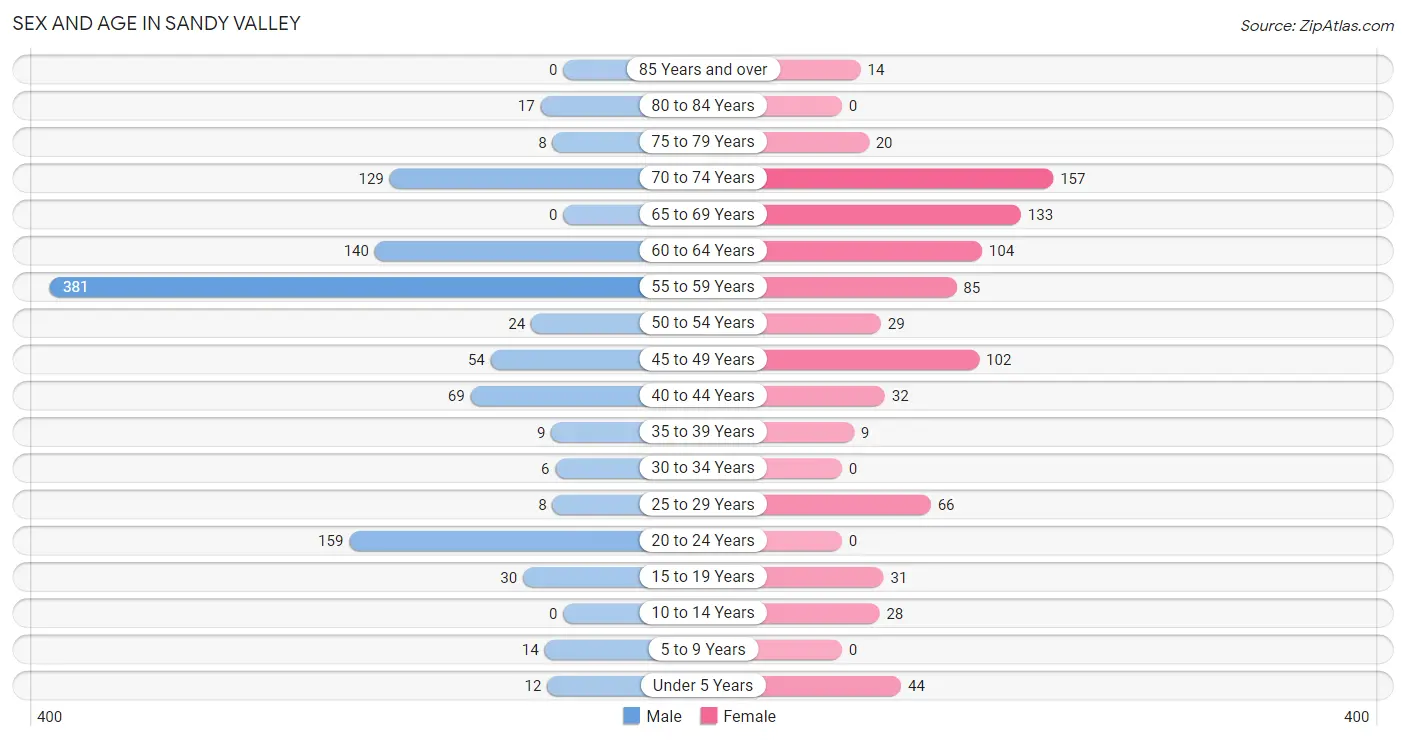
| Age Bracket | Male | Female |
| Under 5 Years | 12 (1.1%) | 44 (5.1%) |
| 5 to 9 Years | 14 (1.3%) | 0 (0.0%) |
| 10 to 14 Years | 0 (0.0%) | 28 (3.3%) |
| 15 to 19 Years | 30 (2.8%) | 31 (3.6%) |
| 20 to 24 Years | 159 (15.0%) | 0 (0.0%) |
| 25 to 29 Years | 8 (0.7%) | 66 (7.7%) |
| 30 to 34 Years | 6 (0.6%) | 0 (0.0%) |
| 35 to 39 Years | 9 (0.9%) | 9 (1.1%) |
| 40 to 44 Years | 69 (6.5%) | 32 (3.7%) |
| 45 to 49 Years | 54 (5.1%) | 102 (11.9%) |
| 50 to 54 Years | 24 (2.3%) | 29 (3.4%) |
| 55 to 59 Years | 381 (35.9%) | 85 (10.0%) |
| 60 to 64 Years | 140 (13.2%) | 104 (12.2%) |
| 65 to 69 Years | 0 (0.0%) | 133 (15.6%) |
| 70 to 74 Years | 129 (12.2%) | 157 (18.4%) |
| 75 to 79 Years | 8 (0.7%) | 20 (2.3%) |
| 80 to 84 Years | 17 (1.6%) | 0 (0.0%) |
| 85 Years and over | 0 (0.0%) | 14 (1.6%) |
| Total | 1,060 (100.0%) | 854 (100.0%) |
Families and Households in Sandy Valley
Median Family Size in Sandy Valley
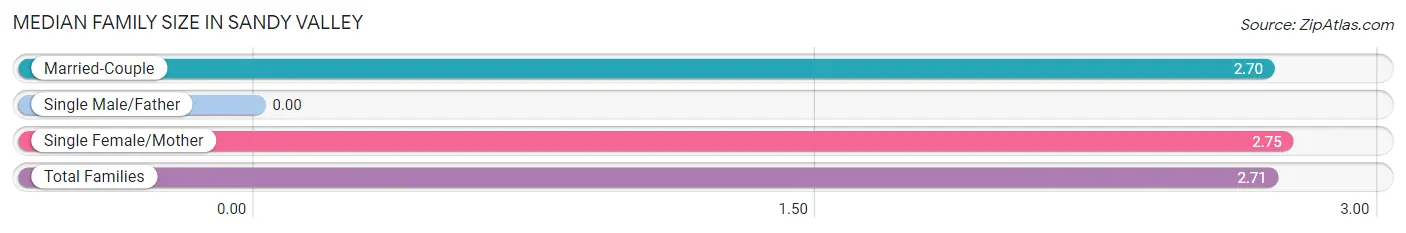
| Family Type | # Families | Family Size |
| Married-Couple | 468 (86.2%) | 2.70 |
| Single Male/Father | 0 (0.0%) | - |
| Single Female/Mother | 75 (13.8%) | 2.75 |
| Total Families | 543 (100.0%) | 2.71 |
Median Household Size in Sandy Valley
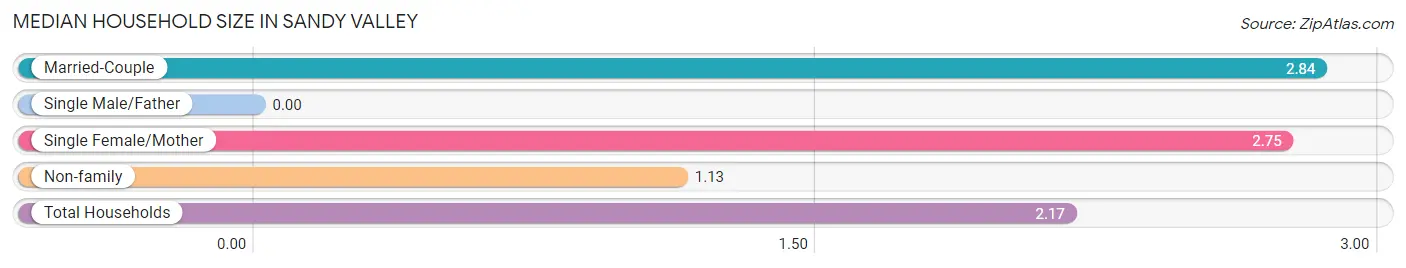
| Household Type | # Households | Household Size |
| Married-Couple | 468 (53.1%) | 2.84 |
| Single Male/Father | 0 (0.0%) | - |
| Single Female/Mother | 75 (8.5%) | 2.75 |
| Non-family | 338 (38.4%) | 1.13 |
| Total Households | 881 (100.0%) | 2.17 |
Household Size by Marriage Status in Sandy Valley
Out of a total of 881 households in Sandy Valley, 543 (61.6%) are family households, while 338 (38.4%) are nonfamily households. The most numerous type of family households are 2-person households, comprising 327, and the most common type of nonfamily households are 1-person households, comprising 313.
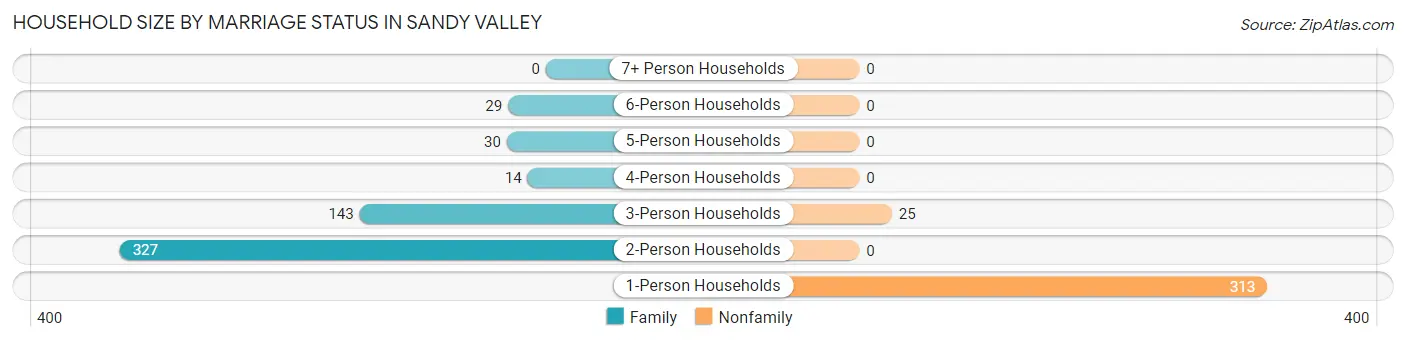
| Household Size | Family Households | Nonfamily Households |
| 1-Person Households | - | 313 (35.5%) |
| 2-Person Households | 327 (37.1%) | 0 (0.0%) |
| 3-Person Households | 143 (16.2%) | 25 (2.8%) |
| 4-Person Households | 14 (1.6%) | 0 (0.0%) |
| 5-Person Households | 30 (3.4%) | 0 (0.0%) |
| 6-Person Households | 29 (3.3%) | 0 (0.0%) |
| 7+ Person Households | 0 (0.0%) | 0 (0.0%) |
| Total | 543 (61.6%) | 338 (38.4%) |
Female Fertility in Sandy Valley
Fertility by Age in Sandy Valley
| Age Bracket | Women with Births | Births / 1,000 Women |
| 15 to 19 years | 0 (0.0%) | 0.0 |
| 20 to 34 years | 0 (0.0%) | 0.0 |
| 35 to 50 years | 0 (0.0%) | 0.0 |
| Total | 0 (0.0%) | 0.0 |
Fertility by Age by Marriage Status in Sandy Valley
| Age Bracket | Married | Unmarried |
| 15 to 19 years | 0 (0.0%) | 0 (0.0%) |
| 20 to 34 years | 0 (0.0%) | 0 (0.0%) |
| 35 to 50 years | 0 (0.0%) | 0 (0.0%) |
| Total | 0 (0.0%) | 0 (0.0%) |
Fertility by Education in Sandy Valley
| Educational Attainment | Women with Births | Births / 1,000 Women |
| Less than High School | 0 (0.0%) | 0.0 |
| High School Diploma | 0 (0.0%) | 0.0 |
| College or Associate's Degree | 0 (0.0%) | 0.0 |
| Bachelor's Degree | 0 (0.0%) | 0.0 |
| Graduate Degree | 0 (0.0%) | 0.0 |
| Total | 0 (0.0%) | 0.0 |
Fertility by Education by Marriage Status in Sandy Valley
| Educational Attainment | Married | Unmarried |
| Less than High School | 0 (0.0%) | 0 (0.0%) |
| High School Diploma | 0 (0.0%) | 0 (0.0%) |
| College or Associate's Degree | 0 (0.0%) | 0 (0.0%) |
| Bachelor's Degree | 0 (0.0%) | 0 (0.0%) |
| Graduate Degree | 0 (0.0%) | 0 (0.0%) |
| Total | 0 (0.0%) | 0 (0.0%) |
Employment Characteristics in Sandy Valley
Employment by Class of Employer in Sandy Valley
Among the 630 employed individuals in Sandy Valley, private company employees (332 | 52.7%), self-employed (not incorporated) (94 | 14.9%), and local government employees (65 | 10.3%) make up the most common classes of employment.
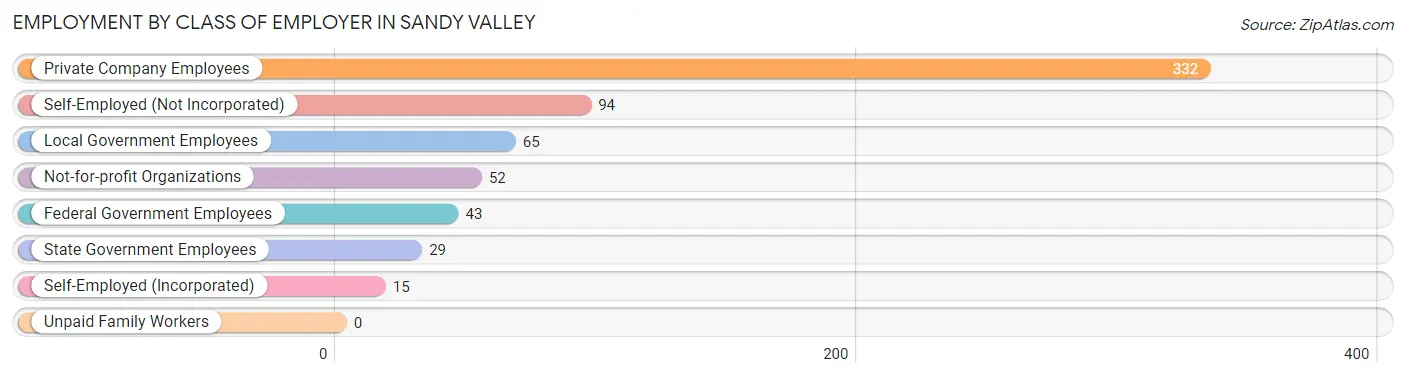
| Employer Class | # Employees | % Employees |
| Private Company Employees | 332 | 52.7% |
| Self-Employed (Incorporated) | 15 | 2.4% |
| Self-Employed (Not Incorporated) | 94 | 14.9% |
| Not-for-profit Organizations | 52 | 8.3% |
| Local Government Employees | 65 | 10.3% |
| State Government Employees | 29 | 4.6% |
| Federal Government Employees | 43 | 6.8% |
| Unpaid Family Workers | 0 | 0.0% |
| Total | 630 | 100.0% |
Employment Status by Age in Sandy Valley
According to the labor force statistics for Sandy Valley, out of the total population over 16 years of age (1,816), 38.8% or 705 individuals are in the labor force, with 10.7% or 75 of them unemployed. The age group with the highest labor force participation rate is 25 to 29 years, with 100.0% or 74 individuals in the labor force. Within the labor force, the 20 to 24 years age range has the highest percentage of unemployed individuals, with 54.2% or 42 of them being unemployed.
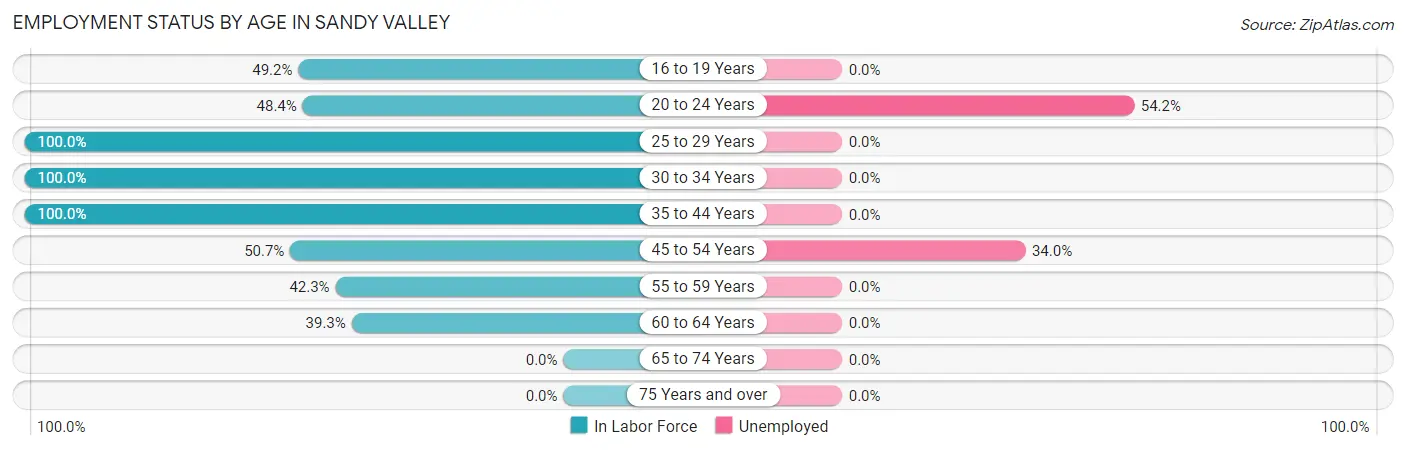
| Age Bracket | In Labor Force | Unemployed |
| 16 to 19 Years | 30 (49.2%) | 0 (0.0%) |
| 20 to 24 Years | 77 (48.4%) | 42 (54.2%) |
| 25 to 29 Years | 74 (100.0%) | 0 (0.0%) |
| 30 to 34 Years | 6 (100.0%) | 0 (0.0%) |
| 35 to 44 Years | 119 (100.0%) | 0 (0.0%) |
| 45 to 54 Years | 106 (50.7%) | 36 (34.0%) |
| 55 to 59 Years | 197 (42.3%) | 0 (0.0%) |
| 60 to 64 Years | 96 (39.3%) | 0 (0.0%) |
| 65 to 74 Years | 0 (0.0%) | 0 (0.0%) |
| 75 Years and over | 0 (0.0%) | 0 (0.0%) |
| Total | 705 (38.8%) | 75 (10.7%) |
Employment Status by Educational Attainment in Sandy Valley
According to labor force statistics for Sandy Valley, 53.5% of individuals (598) out of the total population between 25 and 64 years of age (1,118) are in the labor force, with 6.0% or 36 of them being unemployed. The group with the highest labor force participation rate are those with the educational attainment of less than high school, with 87.8% or 43 individuals in the labor force. Within the labor force, individuals with college / associate degree education have the highest percentage of unemployment, with 15.4% or 36 of them being unemployed.
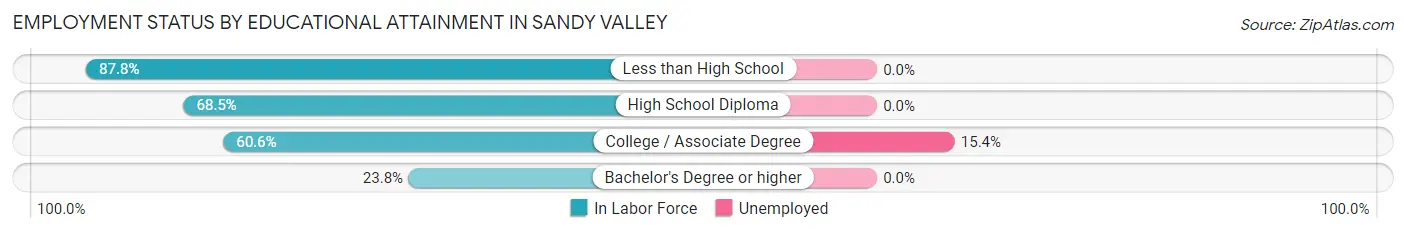
| Educational Attainment | In Labor Force | Unemployed |
| Less than High School | 43 (87.8%) | 0 (0.0%) |
| High School Diploma | 243 (68.5%) | 0 (0.0%) |
| College / Associate Degree | 234 (60.6%) | 59 (15.4%) |
| Bachelor's Degree or higher | 78 (23.8%) | 0 (0.0%) |
| Total | 598 (53.5%) | 67 (6.0%) |
Employment Occupations by Sex in Sandy Valley
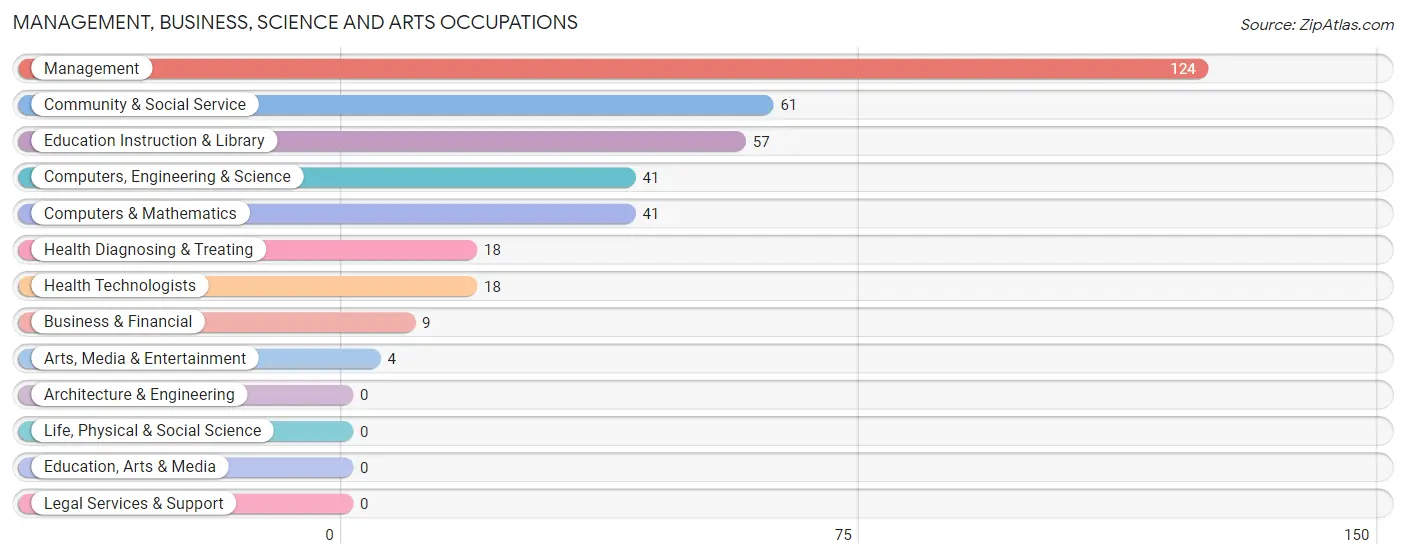
Management, Business, Science and Arts Occupations
The most common Management, Business, Science and Arts occupations in Sandy Valley are Management (124 | 19.8%), Community & Social Service (61 | 9.8%), Education Instruction & Library (57 | 9.1%), Computers, Engineering & Science (41 | 6.6%), and Computers & Mathematics (41 | 6.6%).
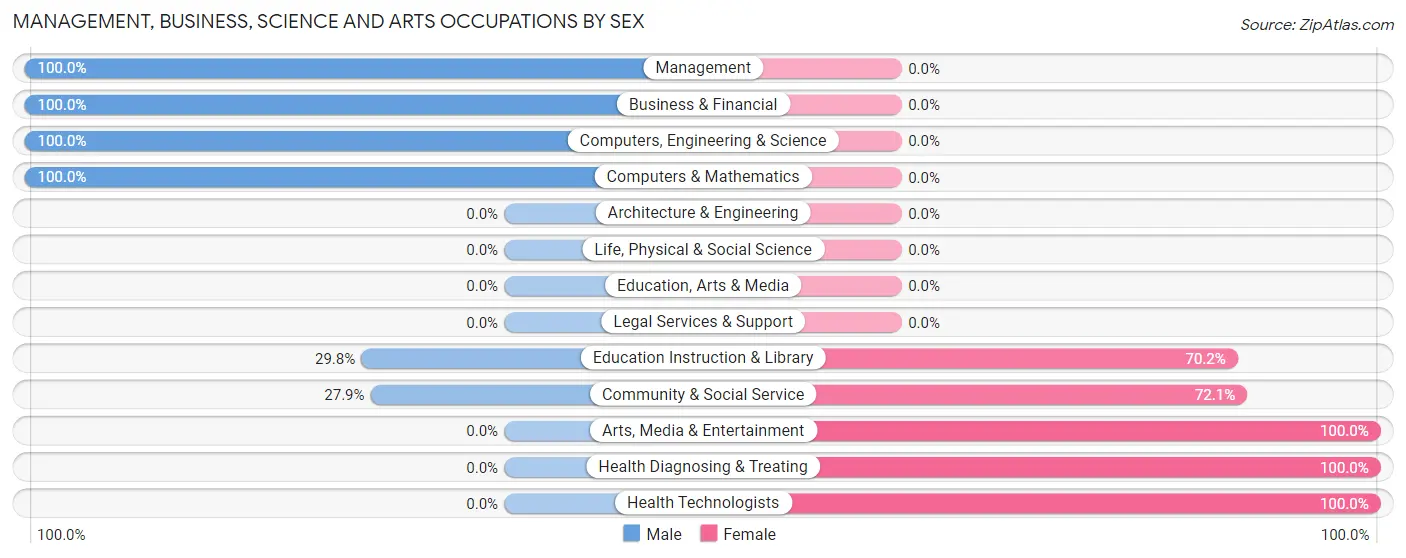
Management, Business, Science and Arts Occupations by Sex
Within the Management, Business, Science and Arts occupations in Sandy Valley, the most male-oriented occupations are Management (100.0%), Business & Financial (100.0%), and Computers, Engineering & Science (100.0%), while the most female-oriented occupations are Arts, Media & Entertainment (100.0%), Health Diagnosing & Treating (100.0%), and Health Technologists (100.0%).
| Occupation | Male | Female |
| Management | 124 (100.0%) | 0 (0.0%) |
| Business & Financial | 9 (100.0%) | 0 (0.0%) |
| Computers, Engineering & Science | 41 (100.0%) | 0 (0.0%) |
| Computers & Mathematics | 41 (100.0%) | 0 (0.0%) |
| Architecture & Engineering | 0 (0.0%) | 0 (0.0%) |
| Life, Physical & Social Science | 0 (0.0%) | 0 (0.0%) |
| Community & Social Service | 17 (27.9%) | 44 (72.1%) |
| Education, Arts & Media | 0 (0.0%) | 0 (0.0%) |
| Legal Services & Support | 0 (0.0%) | 0 (0.0%) |
| Education Instruction & Library | 17 (29.8%) | 40 (70.2%) |
| Arts, Media & Entertainment | 0 (0.0%) | 4 (100.0%) |
| Health Diagnosing & Treating | 0 (0.0%) | 18 (100.0%) |
| Health Technologists | 0 (0.0%) | 18 (100.0%) |
| Total (Category) | 191 (75.5%) | 62 (24.5%) |
| Total (Overall) | 421 (67.4%) | 204 (32.6%) |
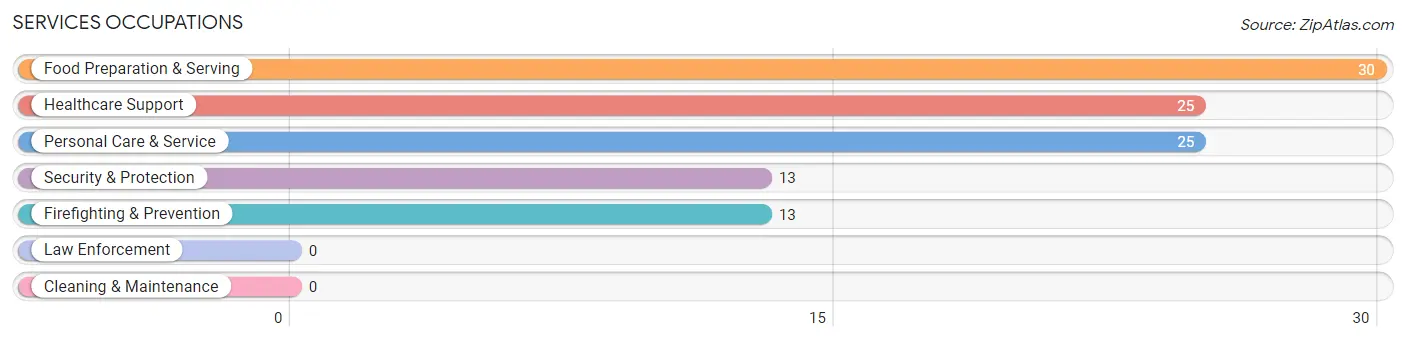
Services Occupations
The most common Services occupations in Sandy Valley are Food Preparation & Serving (30 | 4.8%), Healthcare Support (25 | 4.0%), Personal Care & Service (25 | 4.0%), Security & Protection (13 | 2.1%), and Firefighting & Prevention (13 | 2.1%).
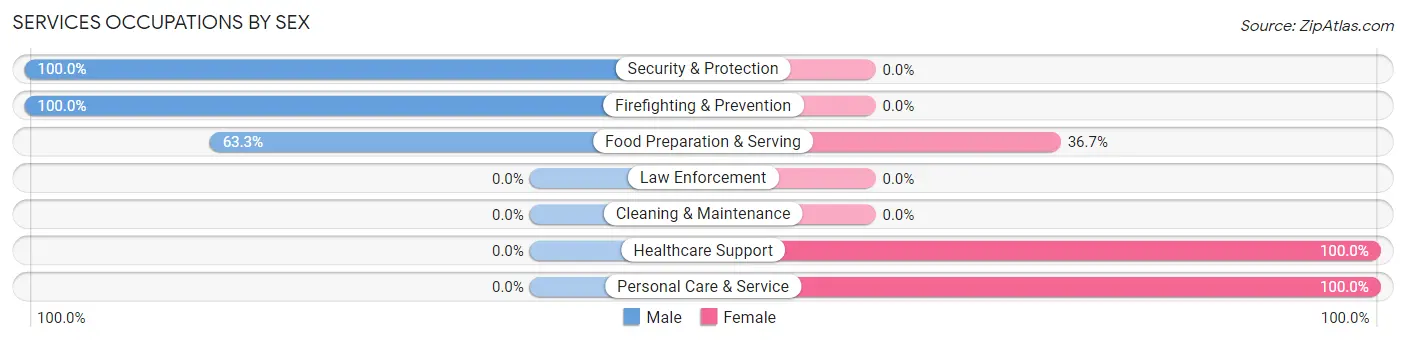
Services Occupations by Sex
Within the Services occupations in Sandy Valley, the most male-oriented occupations are Security & Protection (100.0%), Firefighting & Prevention (100.0%), and Food Preparation & Serving (63.3%), while the most female-oriented occupations are Healthcare Support (100.0%), Personal Care & Service (100.0%), and Food Preparation & Serving (36.7%).
| Occupation | Male | Female |
| Healthcare Support | 0 (0.0%) | 25 (100.0%) |
| Security & Protection | 13 (100.0%) | 0 (0.0%) |
| Firefighting & Prevention | 13 (100.0%) | 0 (0.0%) |
| Law Enforcement | 0 (0.0%) | 0 (0.0%) |
| Food Preparation & Serving | 19 (63.3%) | 11 (36.7%) |
| Cleaning & Maintenance | 0 (0.0%) | 0 (0.0%) |
| Personal Care & Service | 0 (0.0%) | 25 (100.0%) |
| Total (Category) | 32 (34.4%) | 61 (65.6%) |
| Total (Overall) | 421 (67.4%) | 204 (32.6%) |
Sales and Office Occupations
The most common Sales and Office occupations in Sandy Valley are Sales & Related (85 | 13.6%), and Office & Administration (20 | 3.2%).
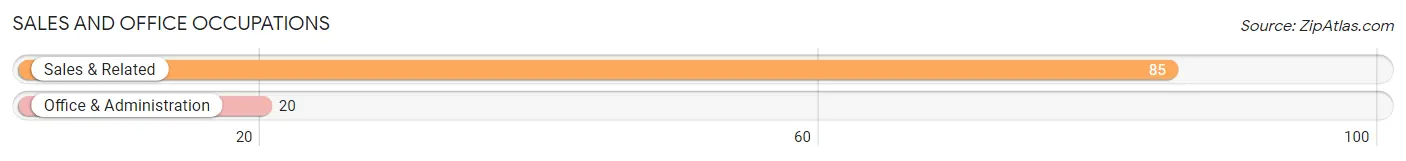
Sales and Office Occupations by Sex
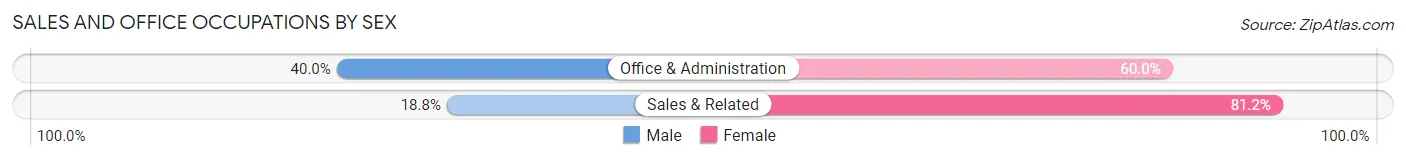
| Occupation | Male | Female |
| Sales & Related | 16 (18.8%) | 69 (81.2%) |
| Office & Administration | 8 (40.0%) | 12 (60.0%) |
| Total (Category) | 24 (22.9%) | 81 (77.1%) |
| Total (Overall) | 421 (67.4%) | 204 (32.6%) |
Natural Resources, Construction and Maintenance Occupations
The most common Natural Resources, Construction and Maintenance occupations in Sandy Valley are Construction & Extraction (52 | 8.3%), and Installation, Maintenance & Repair (22 | 3.5%).
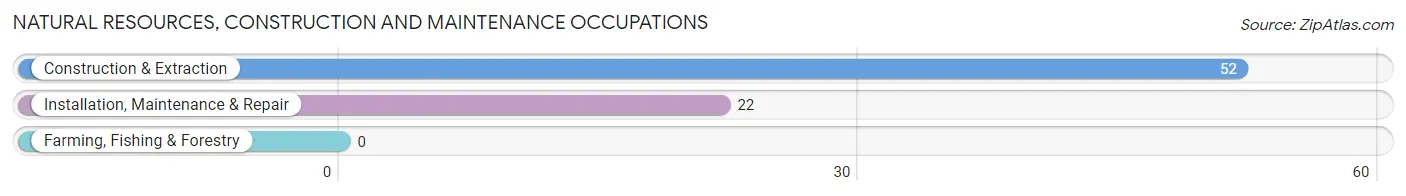
Natural Resources, Construction and Maintenance Occupations by Sex
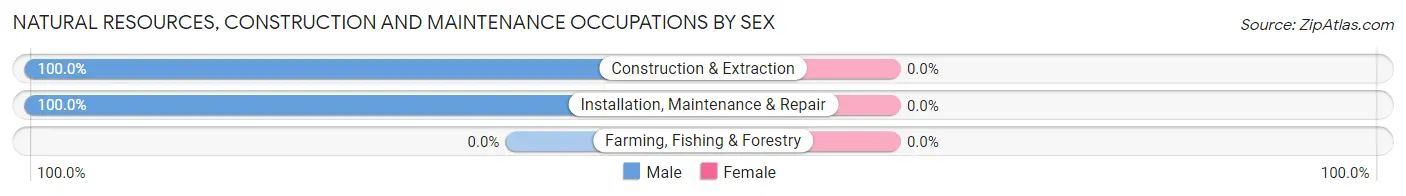
| Occupation | Male | Female |
| Farming, Fishing & Forestry | 0 (0.0%) | 0 (0.0%) |
| Construction & Extraction | 52 (100.0%) | 0 (0.0%) |
| Installation, Maintenance & Repair | 22 (100.0%) | 0 (0.0%) |
| Total (Category) | 74 (100.0%) | 0 (0.0%) |
| Total (Overall) | 421 (67.4%) | 204 (32.6%) |
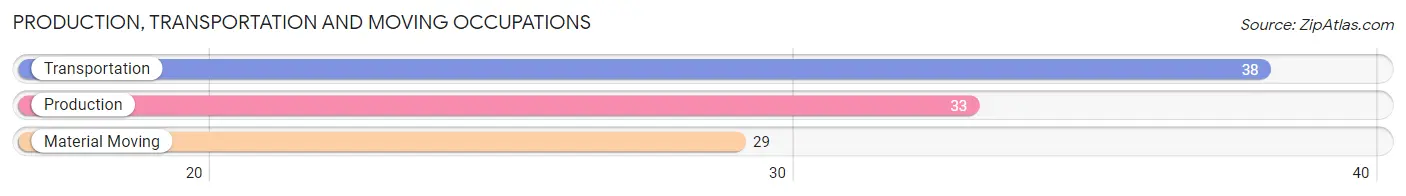
Production, Transportation and Moving Occupations
The most common Production, Transportation and Moving occupations in Sandy Valley are Transportation (38 | 6.1%), Production (33 | 5.3%), and Material Moving (29 | 4.6%).
Production, Transportation and Moving Occupations by Sex
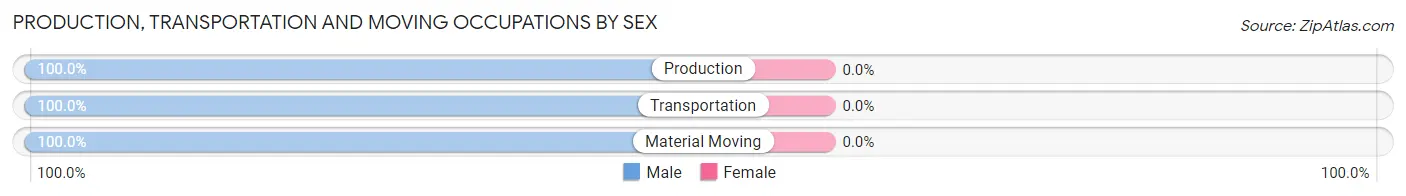
| Occupation | Male | Female |
| Production | 33 (100.0%) | 0 (0.0%) |
| Transportation | 38 (100.0%) | 0 (0.0%) |
| Material Moving | 29 (100.0%) | 0 (0.0%) |
| Total (Category) | 100 (100.0%) | 0 (0.0%) |
| Total (Overall) | 421 (67.4%) | 204 (32.6%) |
Employment Industries by Sex in Sandy Valley
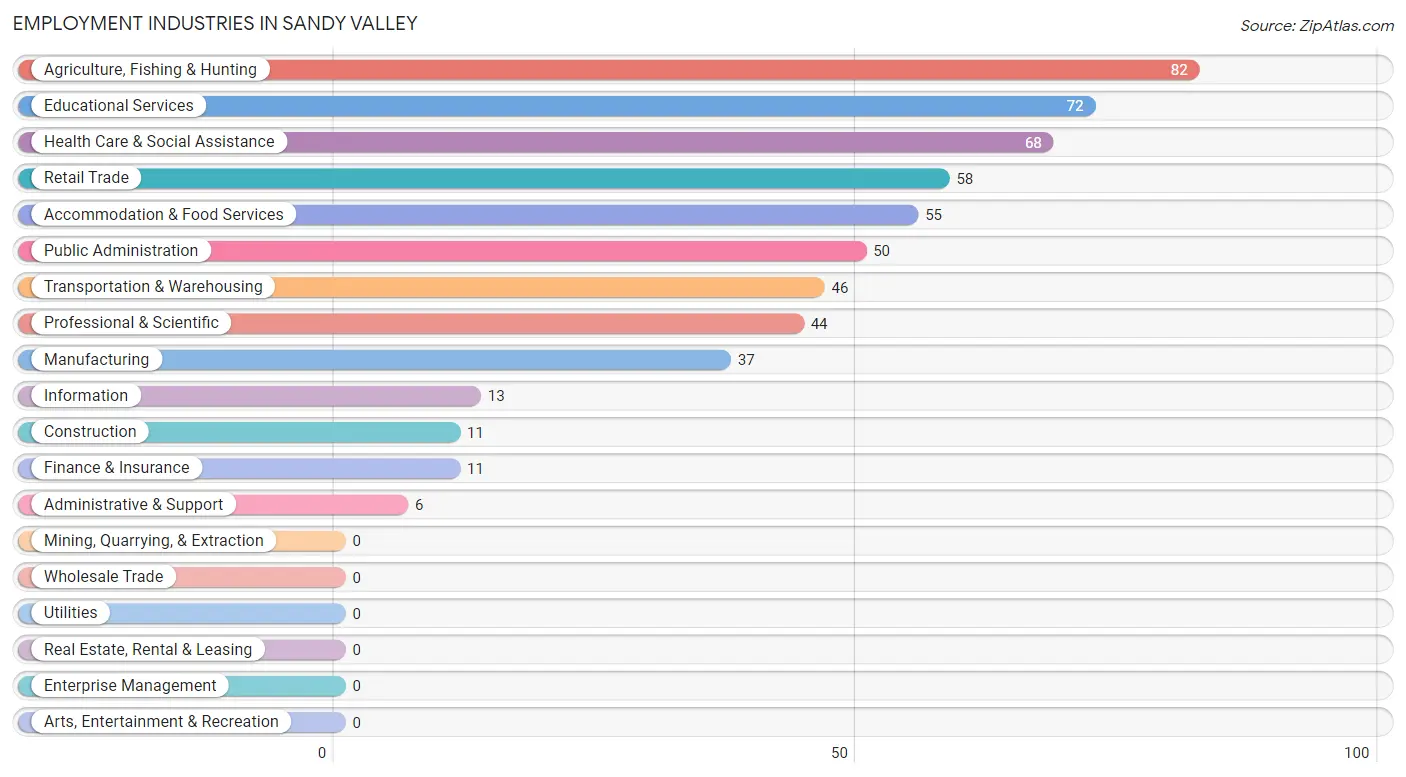
Employment Industries in Sandy Valley
The major employment industries in Sandy Valley include Agriculture, Fishing & Hunting (82 | 13.1%), Educational Services (72 | 11.5%), Health Care & Social Assistance (68 | 10.9%), Retail Trade (58 | 9.3%), and Accommodation & Food Services (55 | 8.8%).
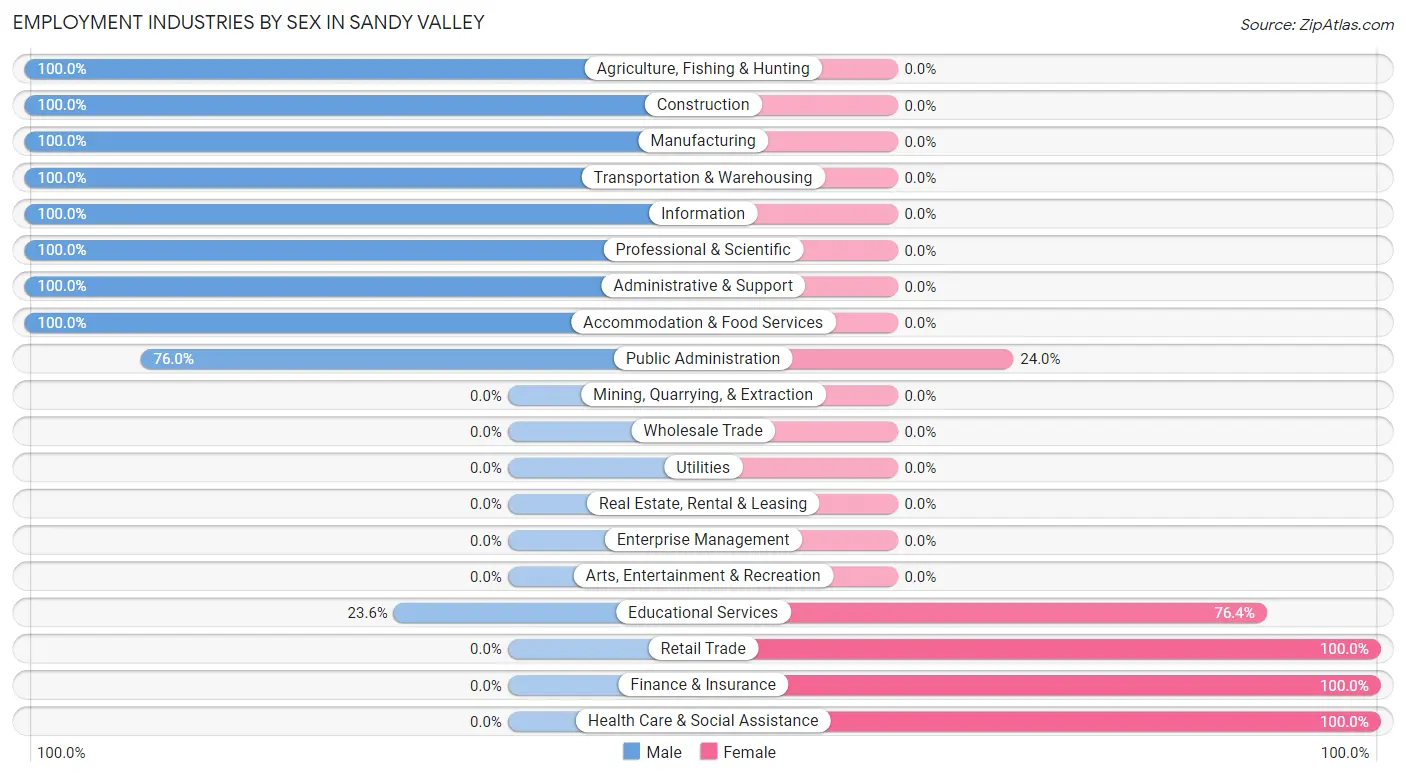
Employment Industries by Sex in Sandy Valley
The Sandy Valley industries that see more men than women are Agriculture, Fishing & Hunting (100.0%), Construction (100.0%), and Manufacturing (100.0%), whereas the industries that tend to have a higher number of women are Retail Trade (100.0%), Finance & Insurance (100.0%), and Health Care & Social Assistance (100.0%).
| Industry | Male | Female |
| Agriculture, Fishing & Hunting | 82 (100.0%) | 0 (0.0%) |
| Mining, Quarrying, & Extraction | 0 (0.0%) | 0 (0.0%) |
| Construction | 11 (100.0%) | 0 (0.0%) |
| Manufacturing | 37 (100.0%) | 0 (0.0%) |
| Wholesale Trade | 0 (0.0%) | 0 (0.0%) |
| Retail Trade | 0 (0.0%) | 58 (100.0%) |
| Transportation & Warehousing | 46 (100.0%) | 0 (0.0%) |
| Utilities | 0 (0.0%) | 0 (0.0%) |
| Information | 13 (100.0%) | 0 (0.0%) |
| Finance & Insurance | 0 (0.0%) | 11 (100.0%) |
| Real Estate, Rental & Leasing | 0 (0.0%) | 0 (0.0%) |
| Professional & Scientific | 44 (100.0%) | 0 (0.0%) |
| Enterprise Management | 0 (0.0%) | 0 (0.0%) |
| Administrative & Support | 6 (100.0%) | 0 (0.0%) |
| Educational Services | 17 (23.6%) | 55 (76.4%) |
| Health Care & Social Assistance | 0 (0.0%) | 68 (100.0%) |
| Arts, Entertainment & Recreation | 0 (0.0%) | 0 (0.0%) |
| Accommodation & Food Services | 55 (100.0%) | 0 (0.0%) |
| Public Administration | 38 (76.0%) | 12 (24.0%) |
| Total | 421 (67.4%) | 204 (32.6%) |
Education in Sandy Valley
School Enrollment in Sandy Valley
The most common levels of schooling among the 158 students in Sandy Valley are high school (42 | 26.6%), graduate / professional (39 | 24.7%), and nursery / preschool (30 | 19.0%).
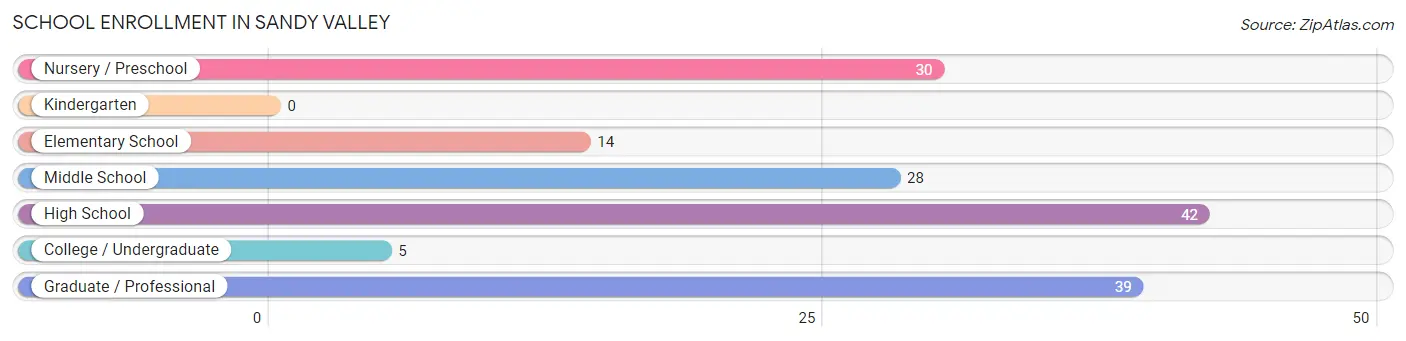
| School Level | # Students | % Students |
| Nursery / Preschool | 30 | 19.0% |
| Kindergarten | 0 | 0.0% |
| Elementary School | 14 | 8.9% |
| Middle School | 28 | 17.7% |
| High School | 42 | 26.6% |
| College / Undergraduate | 5 | 3.2% |
| Graduate / Professional | 39 | 24.7% |
| Total | 158 | 100.0% |
School Enrollment by Age by Funding Source in Sandy Valley
Out of a total of 158 students who are enrolled in schools in Sandy Valley, 59 (37.3%) attend a private institution, while the remaining 99 (62.7%) are enrolled in public schools. The age group of 20 to 24 year olds has the highest likelihood of being enrolled in private schools, with 39 (88.6% in the age bracket) enrolled. Conversely, the age group of 3 to 4 year olds has the lowest likelihood of being enrolled in a private school, with 30 (100.0% in the age bracket) attending a public institution.
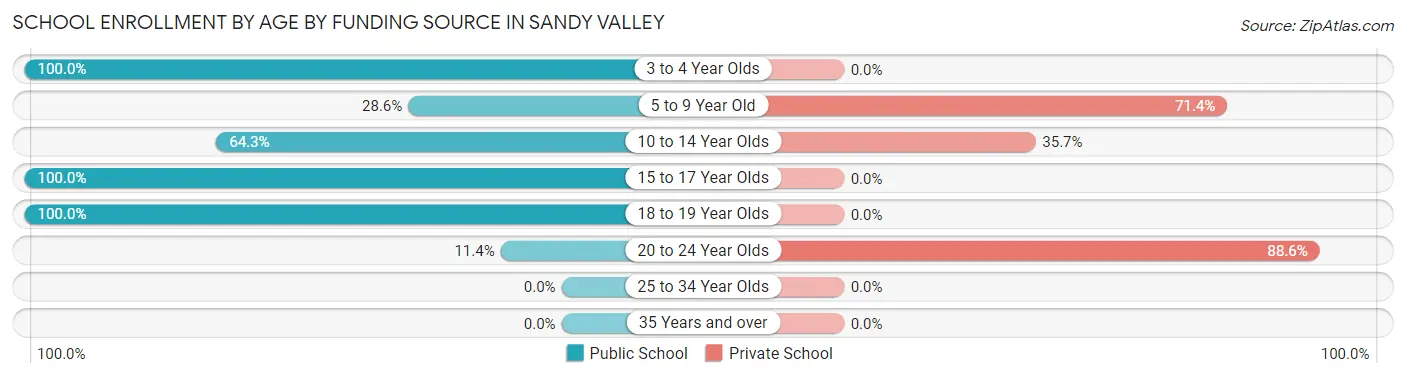
| Age Bracket | Public School | Private School |
| 3 to 4 Year Olds | 30 (100.0%) | 0 (0.0%) |
| 5 to 9 Year Old | 4 (28.6%) | 10 (71.4%) |
| 10 to 14 Year Olds | 18 (64.3%) | 10 (35.7%) |
| 15 to 17 Year Olds | 31 (100.0%) | 0 (0.0%) |
| 18 to 19 Year Olds | 11 (100.0%) | 0 (0.0%) |
| 20 to 24 Year Olds | 5 (11.4%) | 39 (88.6%) |
| 25 to 34 Year Olds | 0 (0.0%) | 0 (0.0%) |
| 35 Years and over | 0 (0.0%) | 0 (0.0%) |
| Total | 99 (62.7%) | 59 (37.3%) |
Educational Attainment by Field of Study in Sandy Valley
Social sciences (200 | 43.5%), business (96 | 20.9%), engineering (47 | 10.2%), literature & languages (34 | 7.4%), and science & technology (33 | 7.2%) are the most common fields of study among 460 individuals in Sandy Valley who have obtained a bachelor's degree or higher.
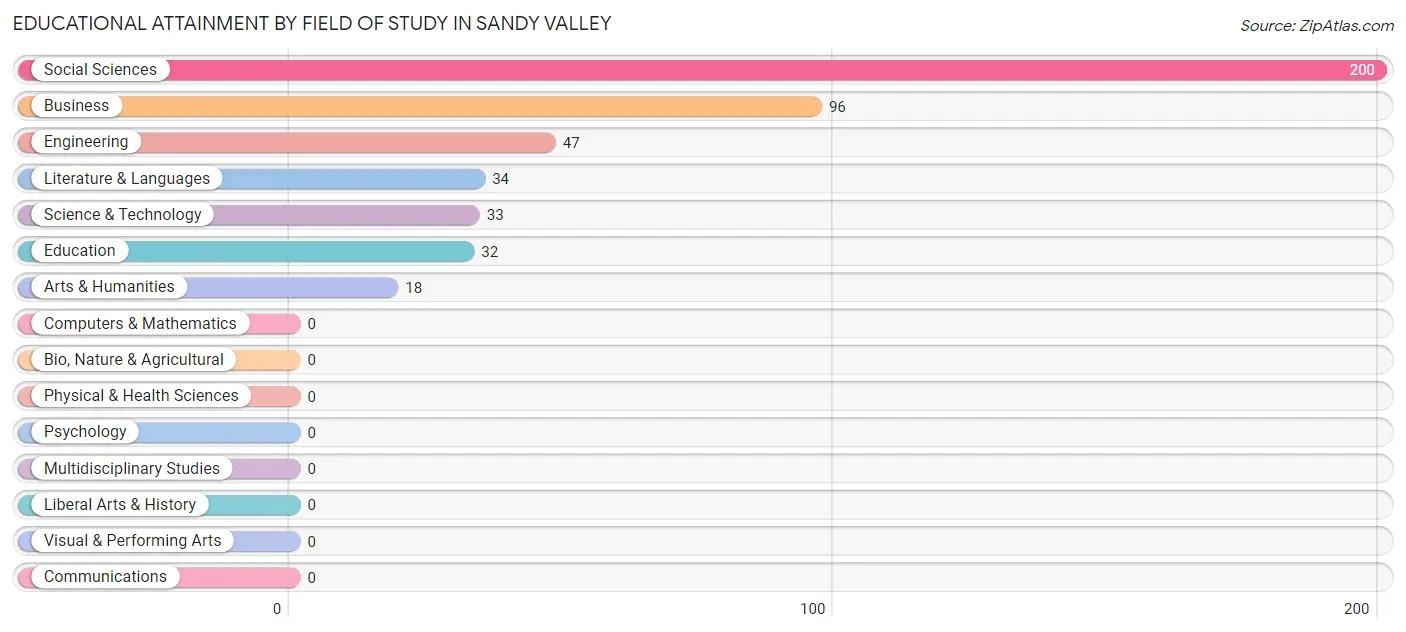
| Field of Study | # Graduates | % Graduates |
| Computers & Mathematics | 0 | 0.0% |
| Bio, Nature & Agricultural | 0 | 0.0% |
| Physical & Health Sciences | 0 | 0.0% |
| Psychology | 0 | 0.0% |
| Social Sciences | 200 | 43.5% |
| Engineering | 47 | 10.2% |
| Multidisciplinary Studies | 0 | 0.0% |
| Science & Technology | 33 | 7.2% |
| Business | 96 | 20.9% |
| Education | 32 | 7.0% |
| Literature & Languages | 34 | 7.4% |
| Liberal Arts & History | 0 | 0.0% |
| Visual & Performing Arts | 0 | 0.0% |
| Communications | 0 | 0.0% |
| Arts & Humanities | 18 | 3.9% |
| Total | 460 | 100.0% |
Transportation & Commute in Sandy Valley
Vehicle Availability by Sex in Sandy Valley
The most prevalent vehicle ownership categories in Sandy Valley are males with 5 or more vehicles (186, accounting for 43.7%) and females with 5 or more vehicles (50, making up 91.2%).
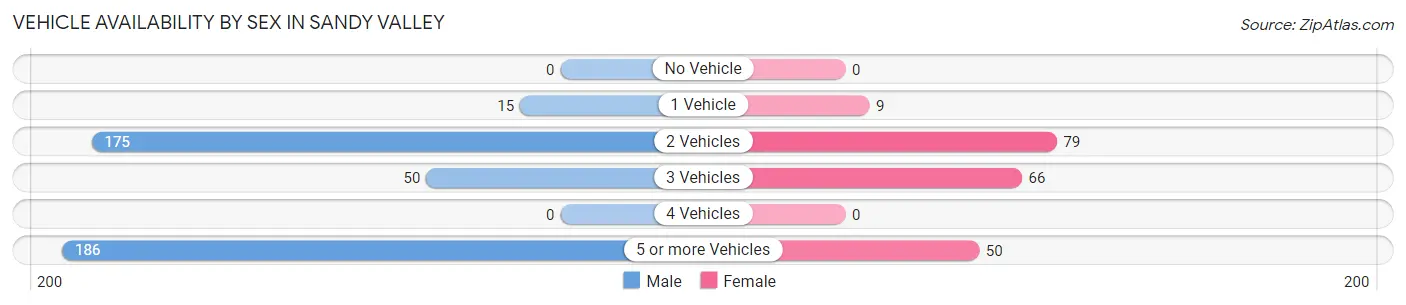
| Vehicles Available | Male | Female |
| No Vehicle | 0 (0.0%) | 0 (0.0%) |
| 1 Vehicle | 15 (3.5%) | 9 (4.4%) |
| 2 Vehicles | 175 (41.1%) | 79 (38.7%) |
| 3 Vehicles | 50 (11.7%) | 66 (32.4%) |
| 4 Vehicles | 0 (0.0%) | 0 (0.0%) |
| 5 or more Vehicles | 186 (43.7%) | 50 (24.5%) |
| Total | 426 (100.0%) | 204 (100.0%) |
Commute Time in Sandy Valley
The most frequently occuring commute durations in Sandy Valley are 60 to 89 minutes (184 commuters, 33.4%), 5 to 9 minutes (113 commuters, 20.5%), and 10 to 14 minutes (77 commuters, 14.0%).
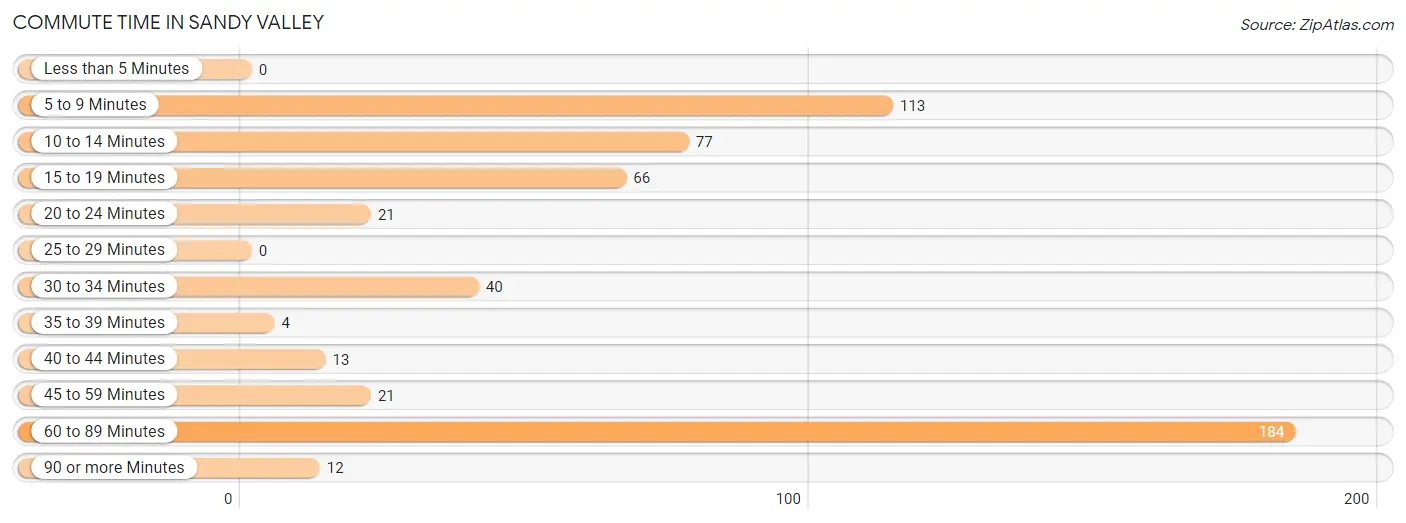
| Commute Time | # Commuters | % Commuters |
| Less than 5 Minutes | 0 | 0.0% |
| 5 to 9 Minutes | 113 | 20.5% |
| 10 to 14 Minutes | 77 | 14.0% |
| 15 to 19 Minutes | 66 | 12.0% |
| 20 to 24 Minutes | 21 | 3.8% |
| 25 to 29 Minutes | 0 | 0.0% |
| 30 to 34 Minutes | 40 | 7.3% |
| 35 to 39 Minutes | 4 | 0.7% |
| 40 to 44 Minutes | 13 | 2.4% |
| 45 to 59 Minutes | 21 | 3.8% |
| 60 to 89 Minutes | 184 | 33.4% |
| 90 or more Minutes | 12 | 2.2% |
Commute Time by Sex in Sandy Valley
The most common commute times in Sandy Valley are 60 to 89 minutes (173 commuters, 46.5%) for males and 10 to 14 minutes (77 commuters, 43.0%) for females.
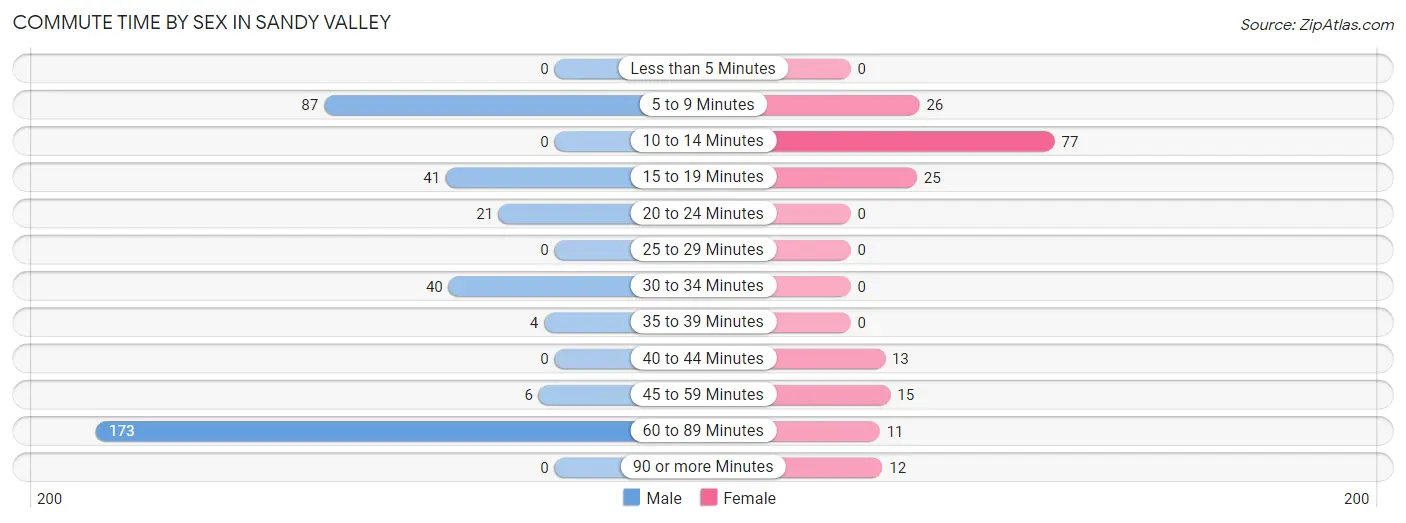
| Commute Time | Male | Female |
| Less than 5 Minutes | 0 (0.0%) | 0 (0.0%) |
| 5 to 9 Minutes | 87 (23.4%) | 26 (14.5%) |
| 10 to 14 Minutes | 0 (0.0%) | 77 (43.0%) |
| 15 to 19 Minutes | 41 (11.0%) | 25 (14.0%) |
| 20 to 24 Minutes | 21 (5.7%) | 0 (0.0%) |
| 25 to 29 Minutes | 0 (0.0%) | 0 (0.0%) |
| 30 to 34 Minutes | 40 (10.7%) | 0 (0.0%) |
| 35 to 39 Minutes | 4 (1.1%) | 0 (0.0%) |
| 40 to 44 Minutes | 0 (0.0%) | 13 (7.3%) |
| 45 to 59 Minutes | 6 (1.6%) | 15 (8.4%) |
| 60 to 89 Minutes | 173 (46.5%) | 11 (6.1%) |
| 90 or more Minutes | 0 (0.0%) | 12 (6.7%) |
Time of Departure to Work by Sex in Sandy Valley
The most frequent times of departure to work in Sandy Valley are 4:00 PM to 11:59 PM (80, 21.5%) for males and 9:00 AM to 9:59 AM (48, 26.8%) for females.
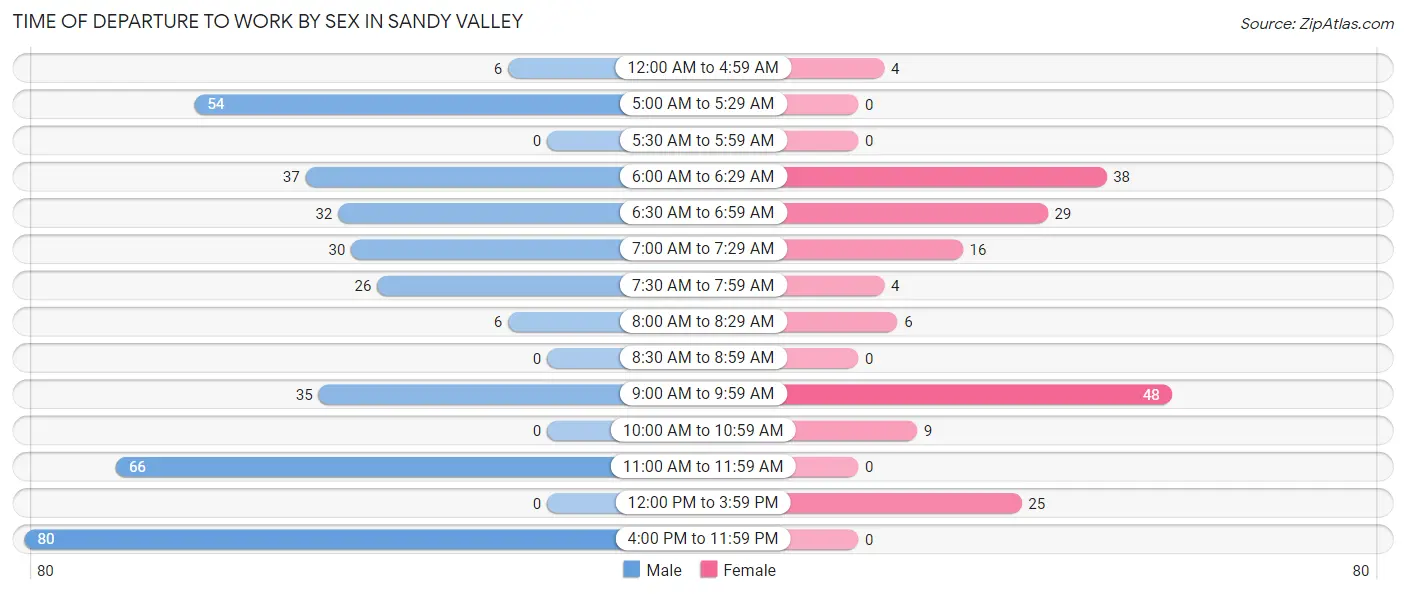
| Time of Departure | Male | Female |
| 12:00 AM to 4:59 AM | 6 (1.6%) | 4 (2.2%) |
| 5:00 AM to 5:29 AM | 54 (14.5%) | 0 (0.0%) |
| 5:30 AM to 5:59 AM | 0 (0.0%) | 0 (0.0%) |
| 6:00 AM to 6:29 AM | 37 (10.0%) | 38 (21.2%) |
| 6:30 AM to 6:59 AM | 32 (8.6%) | 29 (16.2%) |
| 7:00 AM to 7:29 AM | 30 (8.1%) | 16 (8.9%) |
| 7:30 AM to 7:59 AM | 26 (7.0%) | 4 (2.2%) |
| 8:00 AM to 8:29 AM | 6 (1.6%) | 6 (3.4%) |
| 8:30 AM to 8:59 AM | 0 (0.0%) | 0 (0.0%) |
| 9:00 AM to 9:59 AM | 35 (9.4%) | 48 (26.8%) |
| 10:00 AM to 10:59 AM | 0 (0.0%) | 9 (5.0%) |
| 11:00 AM to 11:59 AM | 66 (17.7%) | 0 (0.0%) |
| 12:00 PM to 3:59 PM | 0 (0.0%) | 25 (14.0%) |
| 4:00 PM to 11:59 PM | 80 (21.5%) | 0 (0.0%) |
| Total | 372 (100.0%) | 179 (100.0%) |
Housing Occupancy in Sandy Valley
Occupancy by Ownership in Sandy Valley
Of the total 881 dwellings in Sandy Valley, owner-occupied units account for 807 (91.6%), while renter-occupied units make up 74 (8.4%).
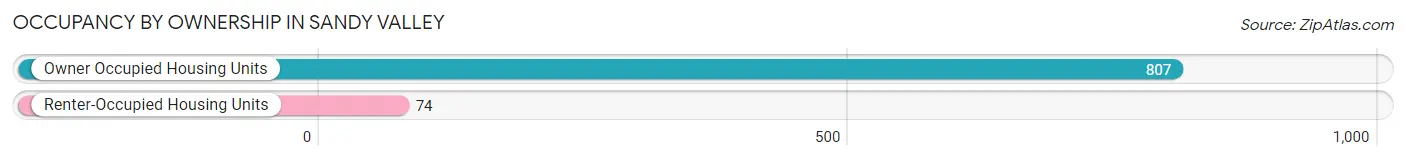
| Occupancy | # Housing Units | % Housing Units |
| Owner Occupied Housing Units | 807 | 91.6% |
| Renter-Occupied Housing Units | 74 | 8.4% |
| Total Occupied Housing Units | 881 | 100.0% |
Occupancy by Household Size in Sandy Valley
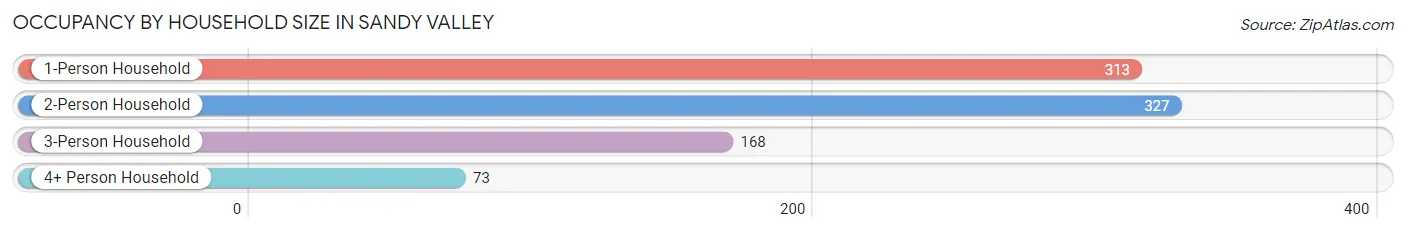
| Household Size | # Housing Units | % Housing Units |
| 1-Person Household | 313 | 35.5% |
| 2-Person Household | 327 | 37.1% |
| 3-Person Household | 168 | 19.1% |
| 4+ Person Household | 73 | 8.3% |
| Total Housing Units | 881 | 100.0% |
Occupancy by Ownership by Household Size in Sandy Valley
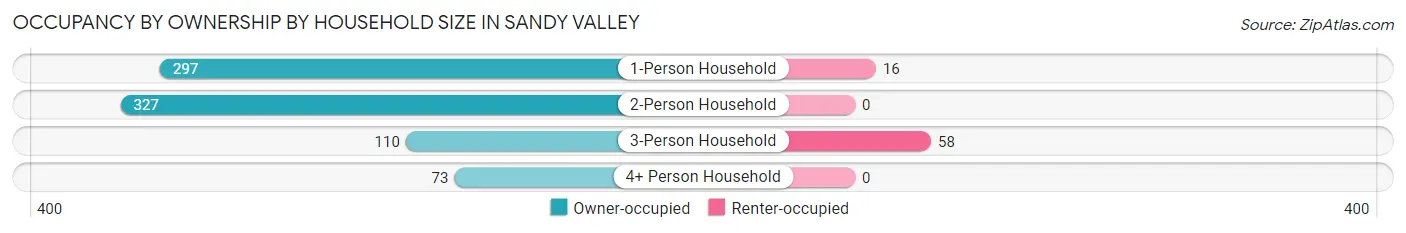
| Household Size | Owner-occupied | Renter-occupied |
| 1-Person Household | 297 (94.9%) | 16 (5.1%) |
| 2-Person Household | 327 (100.0%) | 0 (0.0%) |
| 3-Person Household | 110 (65.5%) | 58 (34.5%) |
| 4+ Person Household | 73 (100.0%) | 0 (0.0%) |
| Total Housing Units | 807 (91.6%) | 74 (8.4%) |
Occupancy by Educational Attainment in Sandy Valley
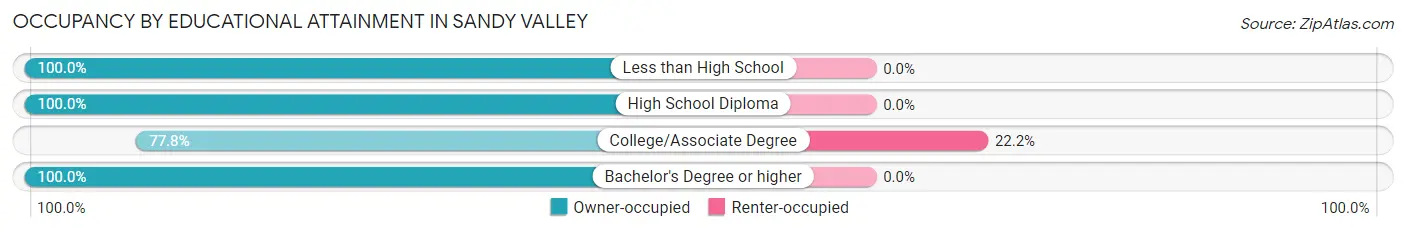
| Household Size | Owner-occupied | Renter-occupied |
| Less than High School | 25 (100.0%) | 0 (0.0%) |
| High School Diploma | 208 (100.0%) | 0 (0.0%) |
| College/Associate Degree | 260 (77.8%) | 74 (22.2%) |
| Bachelor's Degree or higher | 314 (100.0%) | 0 (0.0%) |
Occupancy by Age of Householder in Sandy Valley
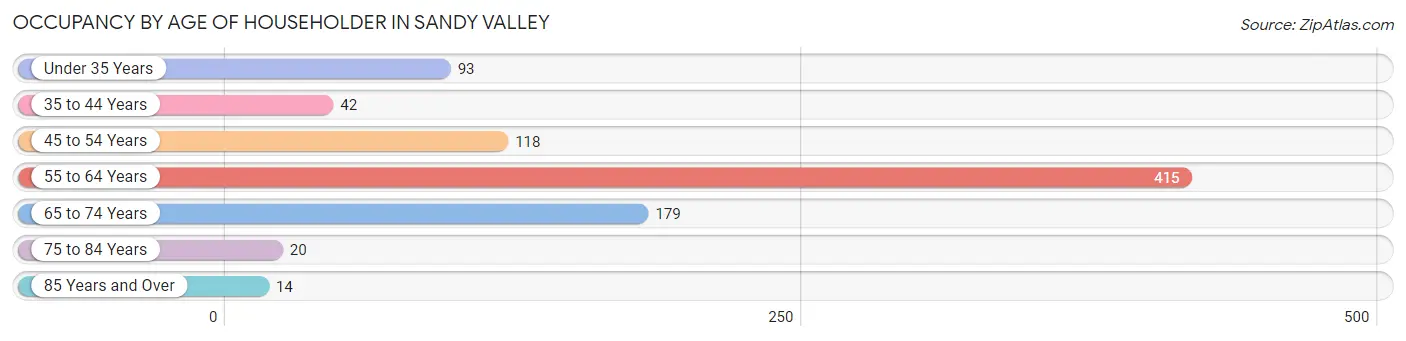
| Age Bracket | # Households | % Households |
| Under 35 Years | 93 | 10.6% |
| 35 to 44 Years | 42 | 4.8% |
| 45 to 54 Years | 118 | 13.4% |
| 55 to 64 Years | 415 | 47.1% |
| 65 to 74 Years | 179 | 20.3% |
| 75 to 84 Years | 20 | 2.3% |
| 85 Years and Over | 14 | 1.6% |
| Total | 881 | 100.0% |
Housing Finances in Sandy Valley
Median Income by Occupancy in Sandy Valley
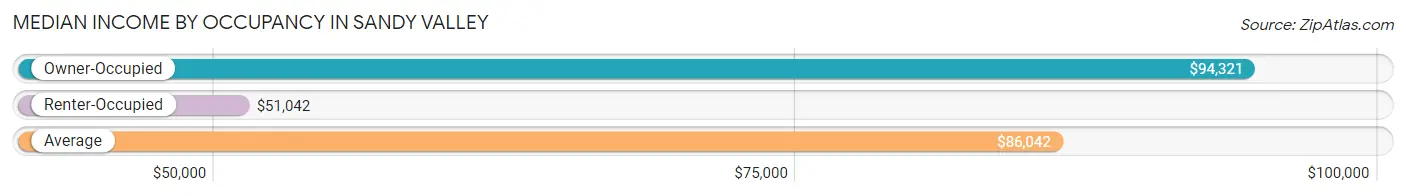
| Occupancy Type | # Households | Median Income |
| Owner-Occupied | 807 (91.6%) | $94,321 |
| Renter-Occupied | 74 (8.4%) | $51,042 |
| Average | 881 (100.0%) | $86,042 |
Occupancy by Householder Income Bracket in Sandy Valley
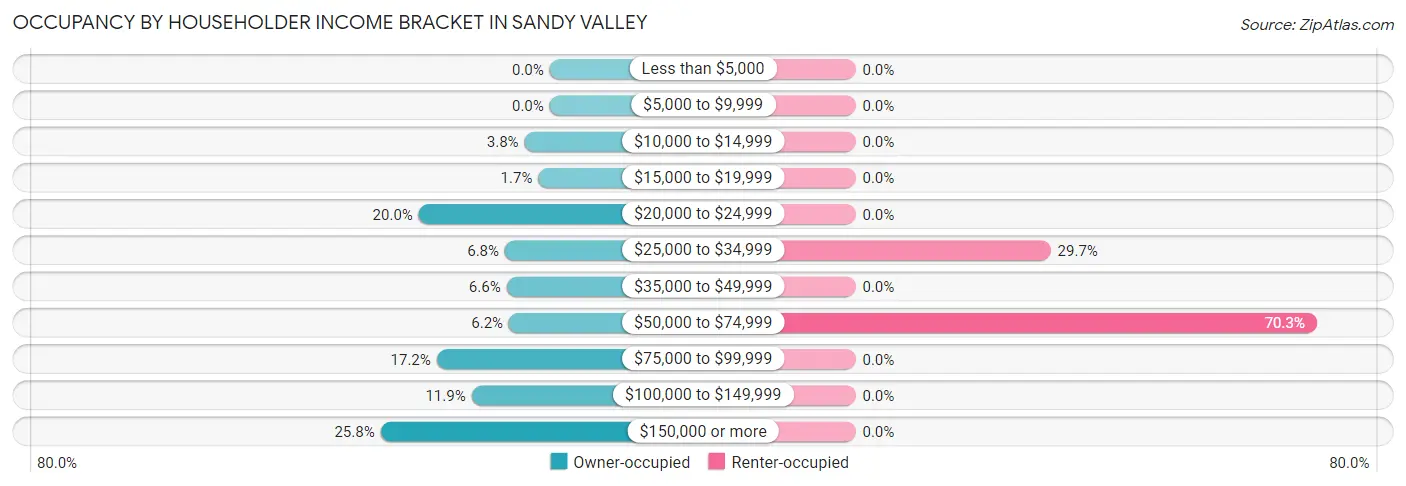
| Income Bracket | Owner-occupied | Renter-occupied |
| Less than $5,000 | 0 (0.0%) | 0 (0.0%) |
| $5,000 to $9,999 | 0 (0.0%) | 0 (0.0%) |
| $10,000 to $14,999 | 31 (3.8%) | 0 (0.0%) |
| $15,000 to $19,999 | 14 (1.7%) | 0 (0.0%) |
| $20,000 to $24,999 | 161 (20.0%) | 0 (0.0%) |
| $25,000 to $34,999 | 55 (6.8%) | 22 (29.7%) |
| $35,000 to $49,999 | 53 (6.6%) | 0 (0.0%) |
| $50,000 to $74,999 | 50 (6.2%) | 52 (70.3%) |
| $75,000 to $99,999 | 139 (17.2%) | 0 (0.0%) |
| $100,000 to $149,999 | 96 (11.9%) | 0 (0.0%) |
| $150,000 or more | 208 (25.8%) | 0 (0.0%) |
| Total | 807 (100.0%) | 74 (100.0%) |
Monthly Housing Cost Tiers in Sandy Valley
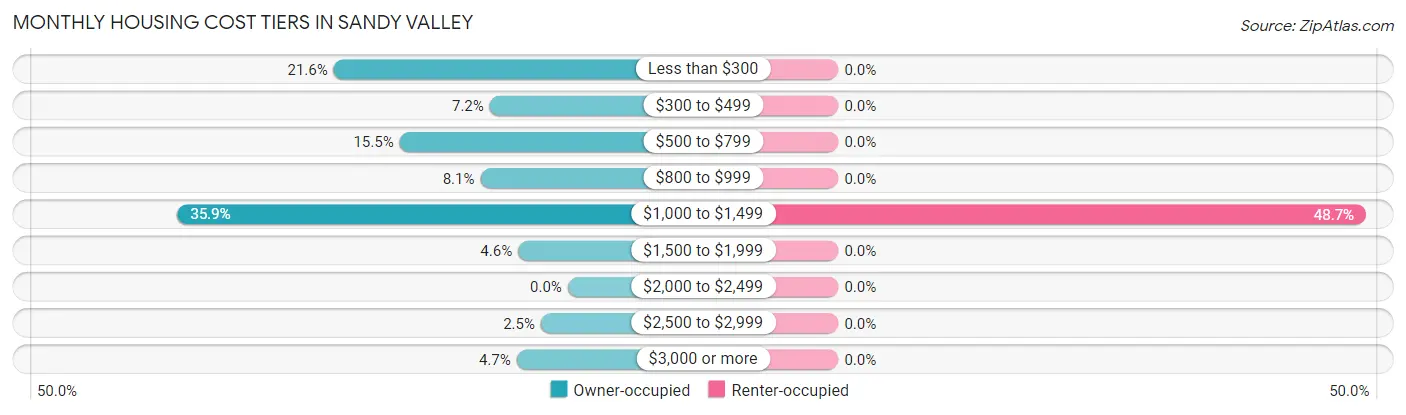
| Monthly Cost | Owner-occupied | Renter-occupied |
| Less than $300 | 174 (21.6%) | 0 (0.0%) |
| $300 to $499 | 58 (7.2%) | 0 (0.0%) |
| $500 to $799 | 125 (15.5%) | 0 (0.0%) |
| $800 to $999 | 65 (8.1%) | 0 (0.0%) |
| $1,000 to $1,499 | 290 (35.9%) | 36 (48.6%) |
| $1,500 to $1,999 | 37 (4.6%) | 0 (0.0%) |
| $2,000 to $2,499 | 0 (0.0%) | 0 (0.0%) |
| $2,500 to $2,999 | 20 (2.5%) | 0 (0.0%) |
| $3,000 or more | 38 (4.7%) | 0 (0.0%) |
| Total | 807 (100.0%) | 74 (100.0%) |
Physical Housing Characteristics in Sandy Valley
Housing Structures in Sandy Valley
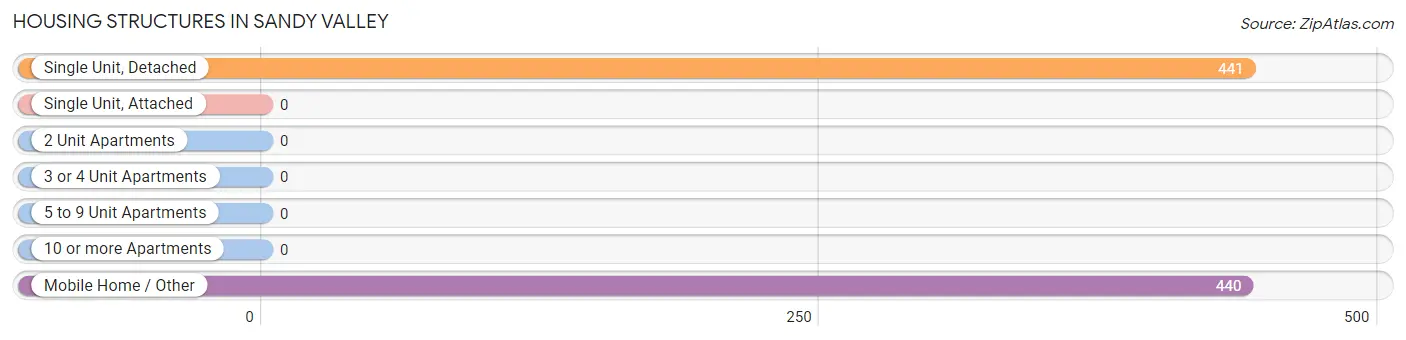
| Structure Type | # Housing Units | % Housing Units |
| Single Unit, Detached | 441 | 50.1% |
| Single Unit, Attached | 0 | 0.0% |
| 2 Unit Apartments | 0 | 0.0% |
| 3 or 4 Unit Apartments | 0 | 0.0% |
| 5 to 9 Unit Apartments | 0 | 0.0% |
| 10 or more Apartments | 0 | 0.0% |
| Mobile Home / Other | 440 | 49.9% |
| Total | 881 | 100.0% |
Housing Structures by Occupancy in Sandy Valley
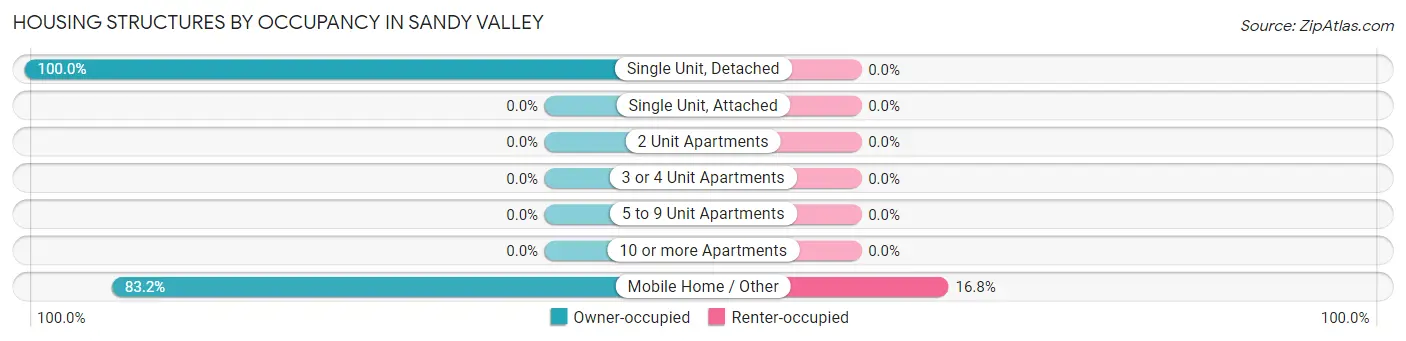
| Structure Type | Owner-occupied | Renter-occupied |
| Single Unit, Detached | 441 (100.0%) | 0 (0.0%) |
| Single Unit, Attached | 0 (0.0%) | 0 (0.0%) |
| 2 Unit Apartments | 0 (0.0%) | 0 (0.0%) |
| 3 or 4 Unit Apartments | 0 (0.0%) | 0 (0.0%) |
| 5 to 9 Unit Apartments | 0 (0.0%) | 0 (0.0%) |
| 10 or more Apartments | 0 (0.0%) | 0 (0.0%) |
| Mobile Home / Other | 366 (83.2%) | 74 (16.8%) |
| Total | 807 (91.6%) | 74 (8.4%) |
Housing Structures by Number of Rooms in Sandy Valley
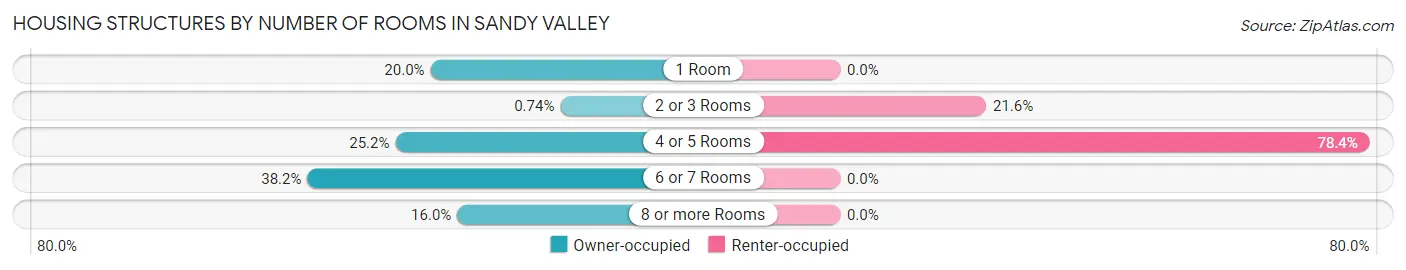
| Number of Rooms | Owner-occupied | Renter-occupied |
| 1 Room | 161 (20.0%) | 0 (0.0%) |
| 2 or 3 Rooms | 6 (0.7%) | 16 (21.6%) |
| 4 or 5 Rooms | 203 (25.2%) | 58 (78.4%) |
| 6 or 7 Rooms | 308 (38.2%) | 0 (0.0%) |
| 8 or more Rooms | 129 (16.0%) | 0 (0.0%) |
| Total | 807 (100.0%) | 74 (100.0%) |
Housing Structure by Heating Type in Sandy Valley
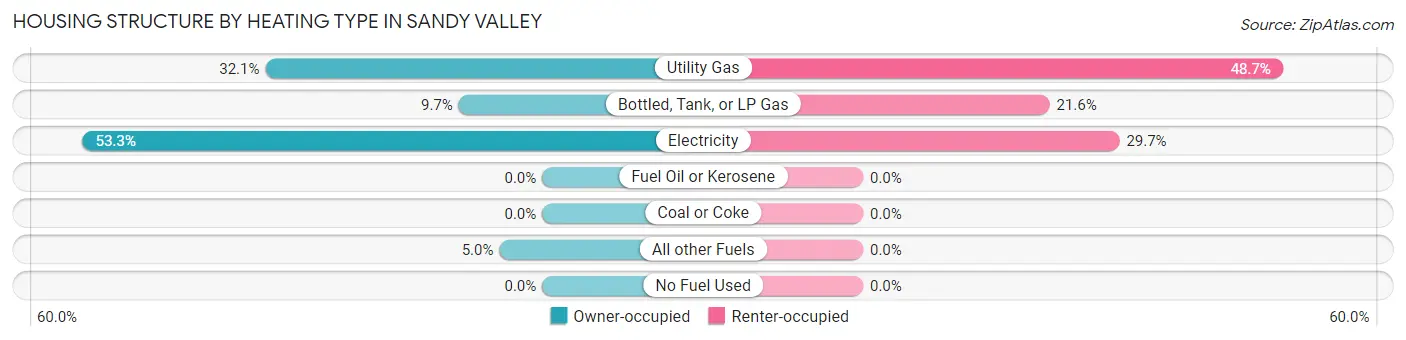
| Heating Type | Owner-occupied | Renter-occupied |
| Utility Gas | 259 (32.1%) | 36 (48.6%) |
| Bottled, Tank, or LP Gas | 78 (9.7%) | 16 (21.6%) |
| Electricity | 430 (53.3%) | 22 (29.7%) |
| Fuel Oil or Kerosene | 0 (0.0%) | 0 (0.0%) |
| Coal or Coke | 0 (0.0%) | 0 (0.0%) |
| All other Fuels | 40 (5.0%) | 0 (0.0%) |
| No Fuel Used | 0 (0.0%) | 0 (0.0%) |
| Total | 807 (100.0%) | 74 (100.0%) |
Household Vehicle Usage in Sandy Valley
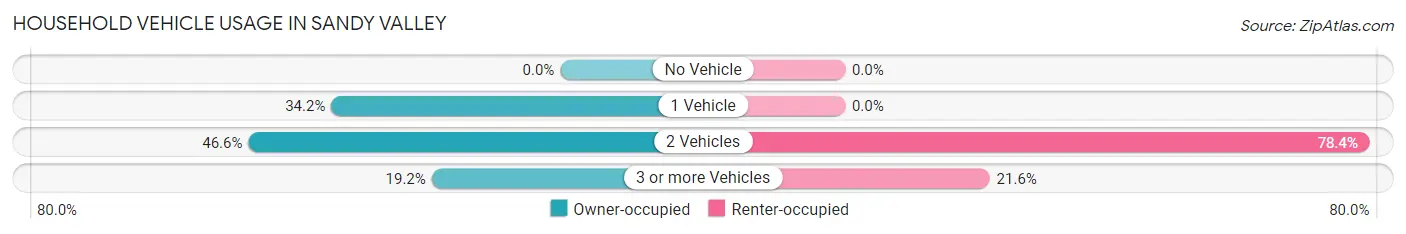
| Vehicles per Household | Owner-occupied | Renter-occupied |
| No Vehicle | 0 (0.0%) | 0 (0.0%) |
| 1 Vehicle | 276 (34.2%) | 0 (0.0%) |
| 2 Vehicles | 376 (46.6%) | 58 (78.4%) |
| 3 or more Vehicles | 155 (19.2%) | 16 (21.6%) |
| Total | 807 (100.0%) | 74 (100.0%) |
Real Estate & Mortgages in Sandy Valley
Real Estate and Mortgage Overview in Sandy Valley
| Characteristic | Without Mortgage | With Mortgage |
| Housing Units | 399 | 408 |
| Median Property Value | $252,600 | $247,100 |
| Median Household Income | - | - |
| Monthly Housing Costs | - | - |
| Real Estate Taxes | - | - |
Property Value by Mortgage Status in Sandy Valley
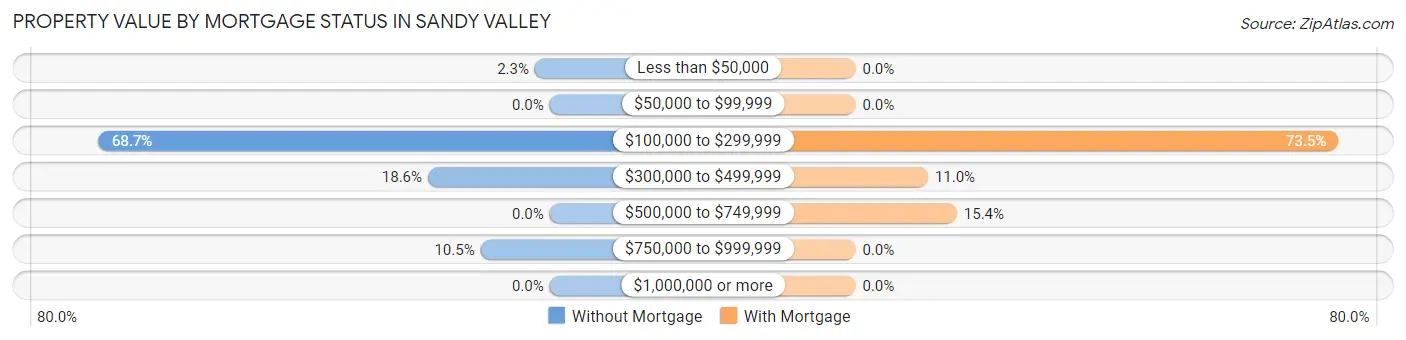
| Property Value | Without Mortgage | With Mortgage |
| Less than $50,000 | 9 (2.3%) | 0 (0.0%) |
| $50,000 to $99,999 | 0 (0.0%) | 0 (0.0%) |
| $100,000 to $299,999 | 274 (68.7%) | 300 (73.5%) |
| $300,000 to $499,999 | 74 (18.5%) | 45 (11.0%) |
| $500,000 to $749,999 | 0 (0.0%) | 63 (15.4%) |
| $750,000 to $999,999 | 42 (10.5%) | 0 (0.0%) |
| $1,000,000 or more | 0 (0.0%) | 0 (0.0%) |
| Total | 399 (100.0%) | 408 (100.0%) |
Household Income by Mortgage Status in Sandy Valley
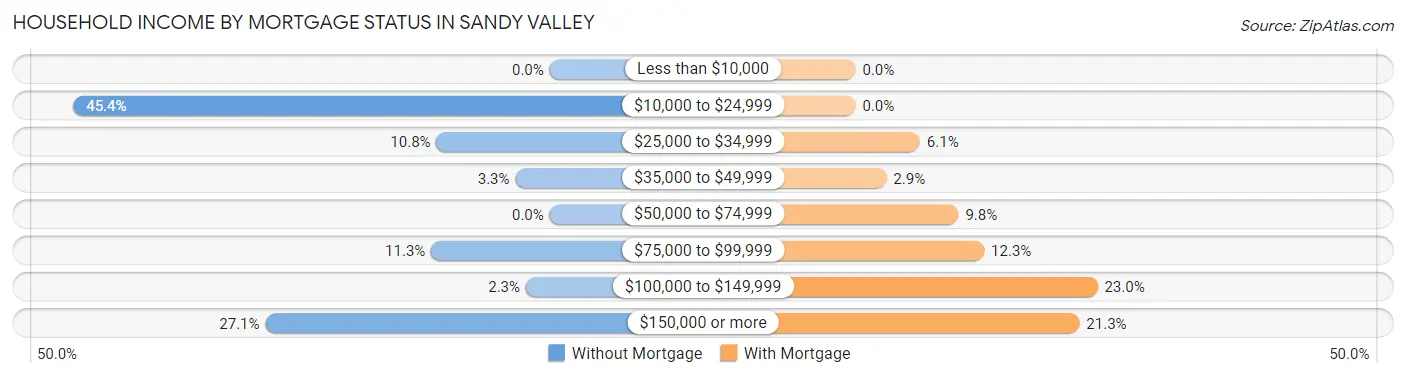
| Household Income | Without Mortgage | With Mortgage |
| Less than $10,000 | 0 (0.0%) | 0 (0.0%) |
| $10,000 to $24,999 | 181 (45.4%) | 0 (0.0%) |
| $25,000 to $34,999 | 43 (10.8%) | 25 (6.1%) |
| $35,000 to $49,999 | 13 (3.3%) | 12 (2.9%) |
| $50,000 to $74,999 | 0 (0.0%) | 40 (9.8%) |
| $75,000 to $99,999 | 45 (11.3%) | 50 (12.2%) |
| $100,000 to $149,999 | 9 (2.3%) | 94 (23.0%) |
| $150,000 or more | 108 (27.1%) | 87 (21.3%) |
| Total | 399 (100.0%) | 408 (100.0%) |
Property Value to Household Income Ratio in Sandy Valley
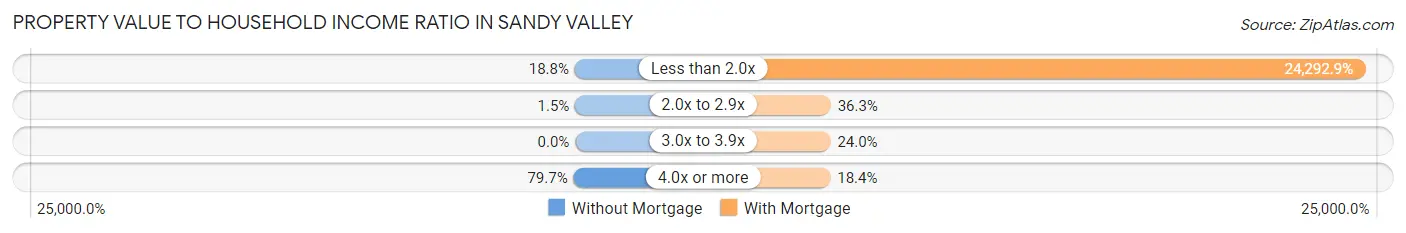
| Value-to-Income Ratio | Without Mortgage | With Mortgage |
| Less than 2.0x | 75 (18.8%) | 99,115 (24,292.9%) |
| 2.0x to 2.9x | 6 (1.5%) | 148 (36.3%) |
| 3.0x to 3.9x | 0 (0.0%) | 98 (24.0%) |
| 4.0x or more | 318 (79.7%) | 75 (18.4%) |
| Total | 399 (100.0%) | 408 (100.0%) |
Real Estate Taxes by Mortgage Status in Sandy Valley
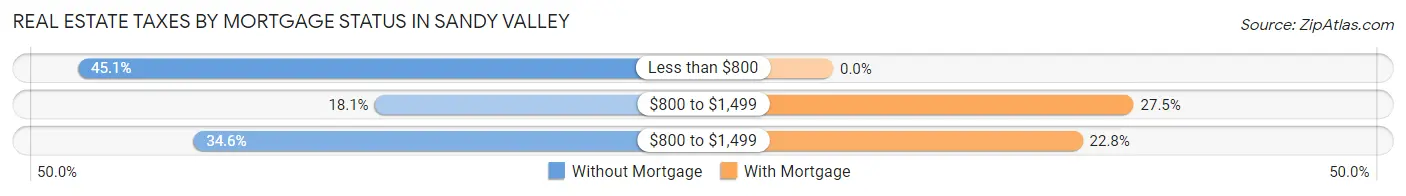
| Property Taxes | Without Mortgage | With Mortgage |
| Less than $800 | 180 (45.1%) | 0 (0.0%) |
| $800 to $1,499 | 72 (18.0%) | 112 (27.5%) |
| $800 to $1,499 | 138 (34.6%) | 93 (22.8%) |
| Total | 399 (100.0%) | 408 (100.0%) |
Health & Disability in Sandy Valley
Health Insurance Coverage by Age in Sandy Valley
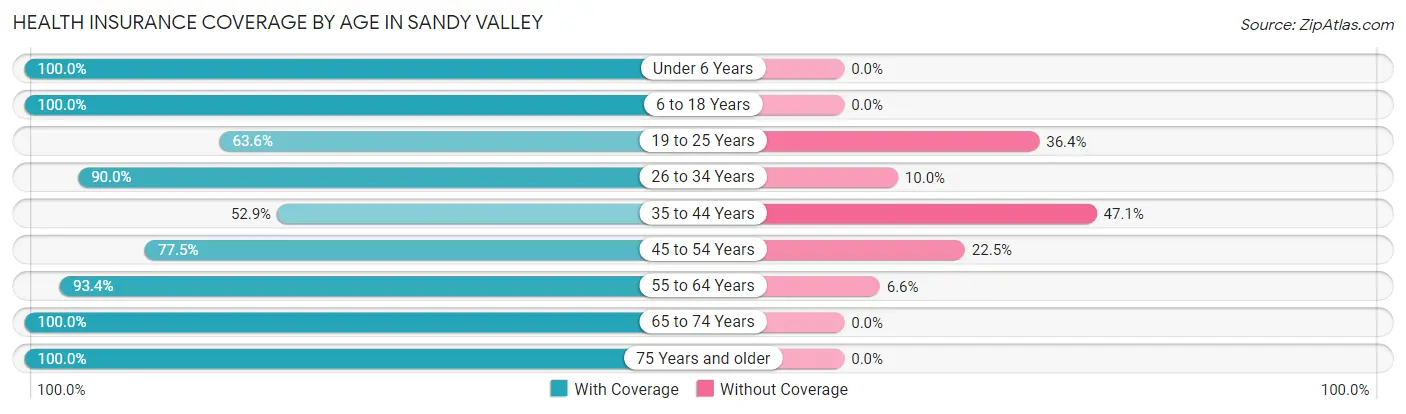
| Age Bracket | With Coverage | Without Coverage |
| Under 6 Years | 56 (100.0%) | 0 (0.0%) |
| 6 to 18 Years | 103 (100.0%) | 0 (0.0%) |
| 19 to 25 Years | 98 (63.6%) | 56 (36.4%) |
| 26 to 34 Years | 72 (90.0%) | 8 (10.0%) |
| 35 to 44 Years | 63 (52.9%) | 56 (47.1%) |
| 45 to 54 Years | 162 (77.5%) | 47 (22.5%) |
| 55 to 64 Years | 663 (93.4%) | 47 (6.6%) |
| 65 to 74 Years | 419 (100.0%) | 0 (0.0%) |
| 75 Years and older | 59 (100.0%) | 0 (0.0%) |
| Total | 1,695 (88.8%) | 214 (11.2%) |
Health Insurance Coverage by Citizenship Status in Sandy Valley
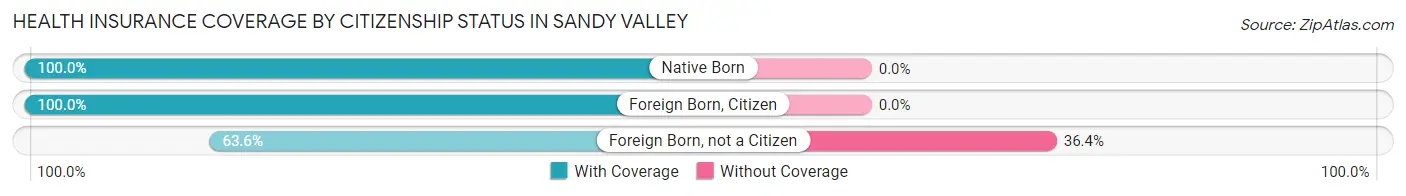
| Citizenship Status | With Coverage | Without Coverage |
| Native Born | 56 (100.0%) | 0 (0.0%) |
| Foreign Born, Citizen | 103 (100.0%) | 0 (0.0%) |
| Foreign Born, not a Citizen | 98 (63.6%) | 56 (36.4%) |
Health Insurance Coverage by Household Income in Sandy Valley
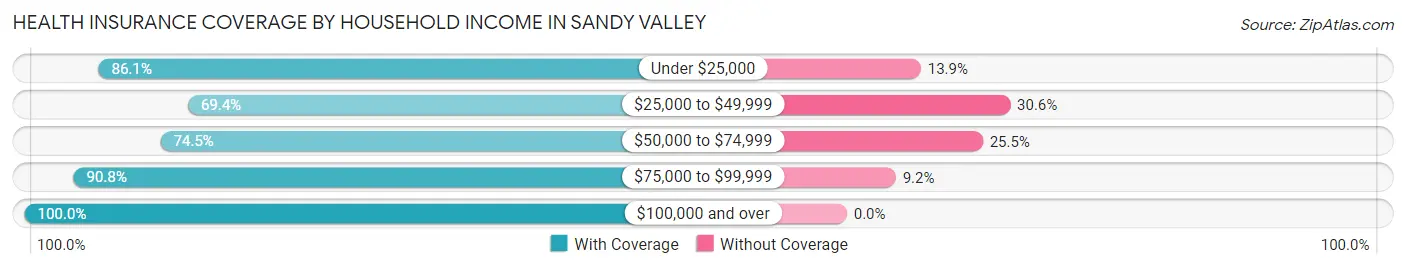
| Household Income | With Coverage | Without Coverage |
| Under $25,000 | 261 (86.1%) | 42 (13.9%) |
| $25,000 to $49,999 | 220 (69.4%) | 97 (30.6%) |
| $50,000 to $74,999 | 161 (74.5%) | 55 (25.5%) |
| $75,000 to $99,999 | 198 (90.8%) | 20 (9.2%) |
| $100,000 and over | 855 (100.0%) | 0 (0.0%) |
Public vs Private Health Insurance Coverage by Age in Sandy Valley
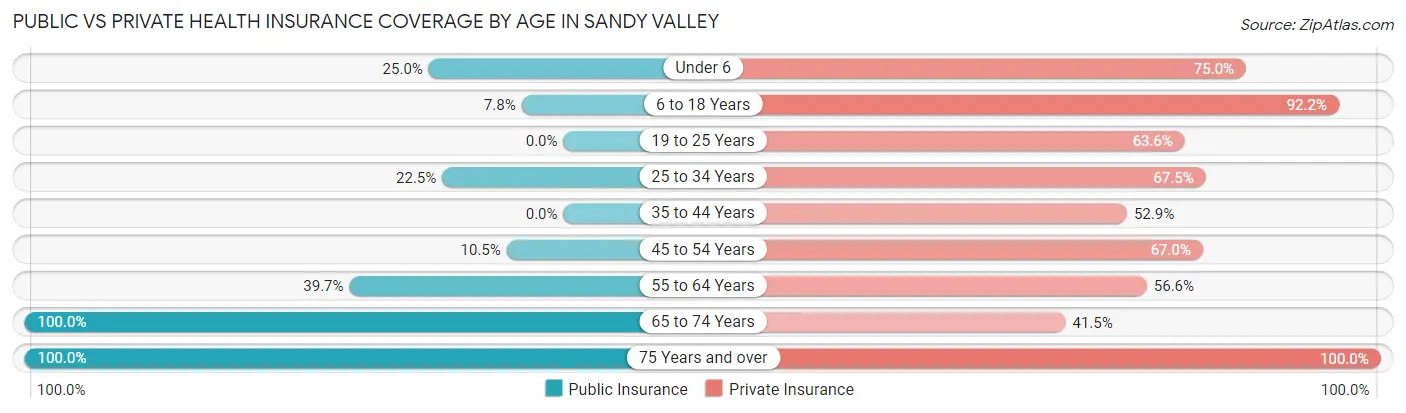
| Age Bracket | Public Insurance | Private Insurance |
| Under 6 | 14 (25.0%) | 42 (75.0%) |
| 6 to 18 Years | 8 (7.8%) | 95 (92.2%) |
| 19 to 25 Years | 0 (0.0%) | 98 (63.6%) |
| 25 to 34 Years | 18 (22.5%) | 54 (67.5%) |
| 35 to 44 Years | 0 (0.0%) | 63 (52.9%) |
| 45 to 54 Years | 22 (10.5%) | 140 (67.0%) |
| 55 to 64 Years | 282 (39.7%) | 402 (56.6%) |
| 65 to 74 Years | 419 (100.0%) | 174 (41.5%) |
| 75 Years and over | 59 (100.0%) | 59 (100.0%) |
| Total | 822 (43.1%) | 1,127 (59.0%) |
Disability Status by Sex by Age in Sandy Valley
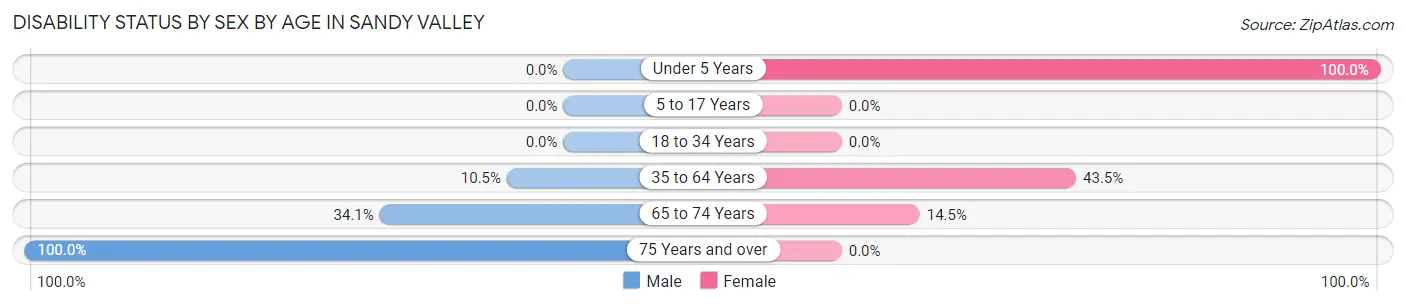
| Age Bracket | Male | Female |
| Under 5 Years | 0 (0.0%) | 44 (100.0%) |
| 5 to 17 Years | 0 (0.0%) | 0 (0.0%) |
| 18 to 34 Years | 0 (0.0%) | 0 (0.0%) |
| 35 to 64 Years | 71 (10.5%) | 157 (43.5%) |
| 65 to 74 Years | 44 (34.1%) | 42 (14.5%) |
| 75 Years and over | 25 (100.0%) | 0 (0.0%) |
Disability Class by Sex by Age in Sandy Valley
Disability Class: Hearing Difficulty
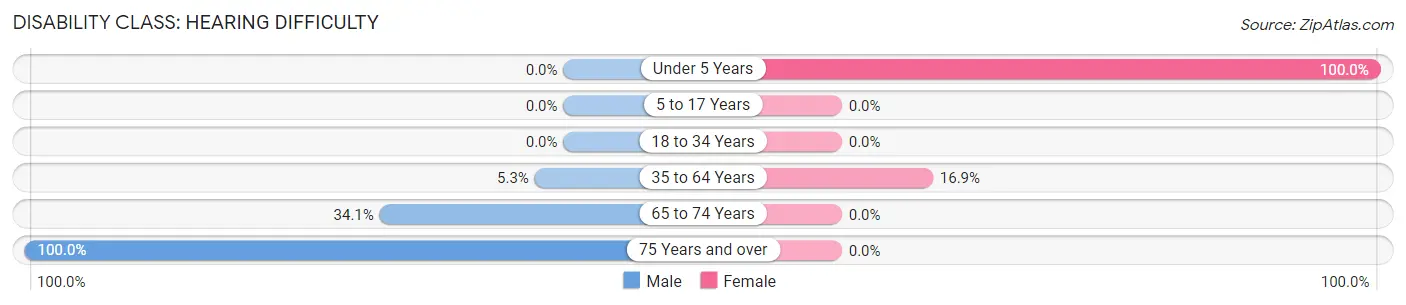
| Age Bracket | Male | Female |
| Under 5 Years | 0 (0.0%) | 44 (100.0%) |
| 5 to 17 Years | 0 (0.0%) | 0 (0.0%) |
| 18 to 34 Years | 0 (0.0%) | 0 (0.0%) |
| 35 to 64 Years | 36 (5.3%) | 61 (16.9%) |
| 65 to 74 Years | 44 (34.1%) | 0 (0.0%) |
| 75 Years and over | 25 (100.0%) | 0 (0.0%) |
Disability Class: Vision Difficulty
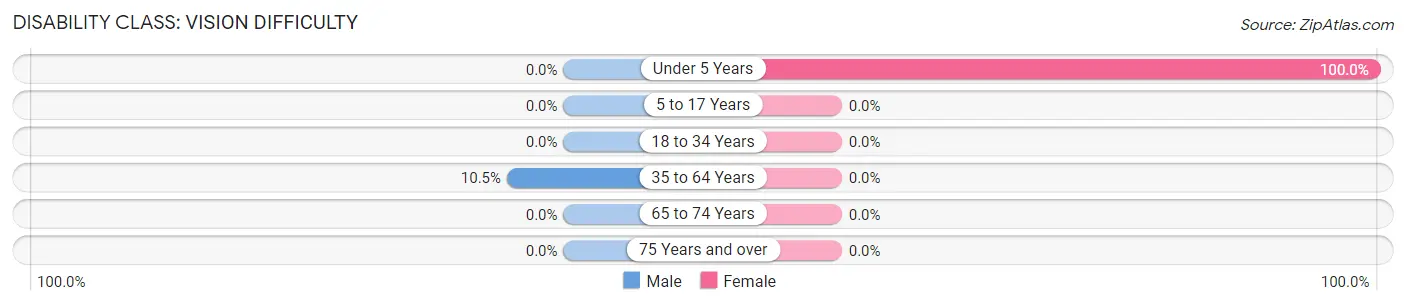
| Age Bracket | Male | Female |
| Under 5 Years | 0 (0.0%) | 44 (100.0%) |
| 5 to 17 Years | 0 (0.0%) | 0 (0.0%) |
| 18 to 34 Years | 0 (0.0%) | 0 (0.0%) |
| 35 to 64 Years | 71 (10.5%) | 0 (0.0%) |
| 65 to 74 Years | 0 (0.0%) | 0 (0.0%) |
| 75 Years and over | 0 (0.0%) | 0 (0.0%) |
Disability Class: Cognitive Difficulty
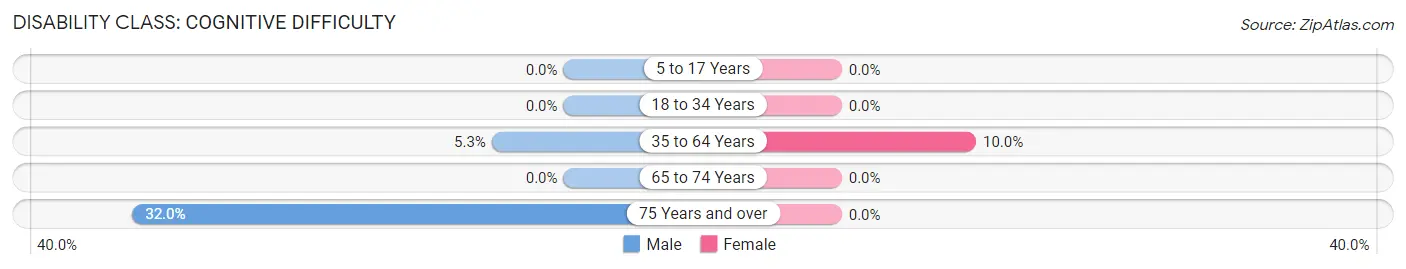
| Age Bracket | Male | Female |
| 5 to 17 Years | 0 (0.0%) | 0 (0.0%) |
| 18 to 34 Years | 0 (0.0%) | 0 (0.0%) |
| 35 to 64 Years | 36 (5.3%) | 36 (10.0%) |
| 65 to 74 Years | 0 (0.0%) | 0 (0.0%) |
| 75 Years and over | 8 (32.0%) | 0 (0.0%) |
Disability Class: Ambulatory Difficulty
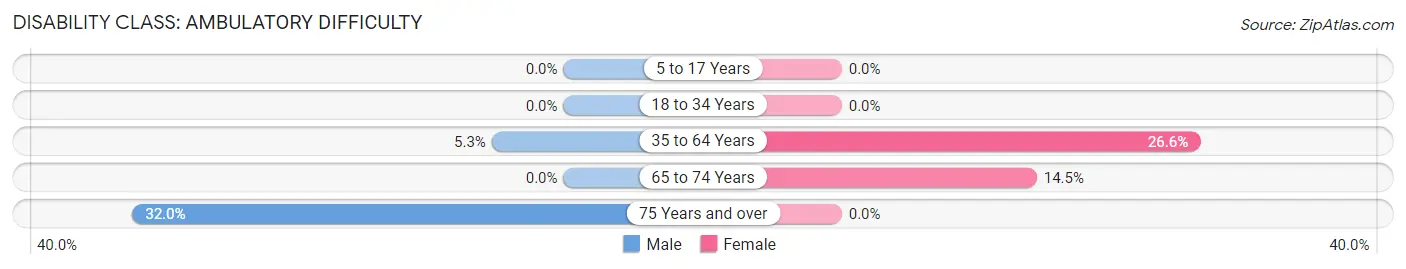
| Age Bracket | Male | Female |
| 5 to 17 Years | 0 (0.0%) | 0 (0.0%) |
| 18 to 34 Years | 0 (0.0%) | 0 (0.0%) |
| 35 to 64 Years | 36 (5.3%) | 96 (26.6%) |
| 65 to 74 Years | 0 (0.0%) | 42 (14.5%) |
| 75 Years and over | 8 (32.0%) | 0 (0.0%) |
Disability Class: Self-Care Difficulty
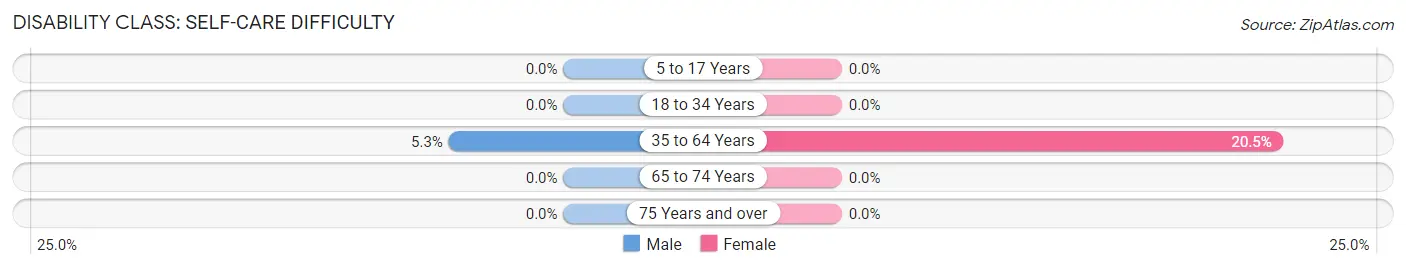
| Age Bracket | Male | Female |
| 5 to 17 Years | 0 (0.0%) | 0 (0.0%) |
| 18 to 34 Years | 0 (0.0%) | 0 (0.0%) |
| 35 to 64 Years | 36 (5.3%) | 74 (20.5%) |
| 65 to 74 Years | 0 (0.0%) | 0 (0.0%) |
| 75 Years and over | 0 (0.0%) | 0 (0.0%) |
Technology Access in Sandy Valley
Computing Device Access in Sandy Valley
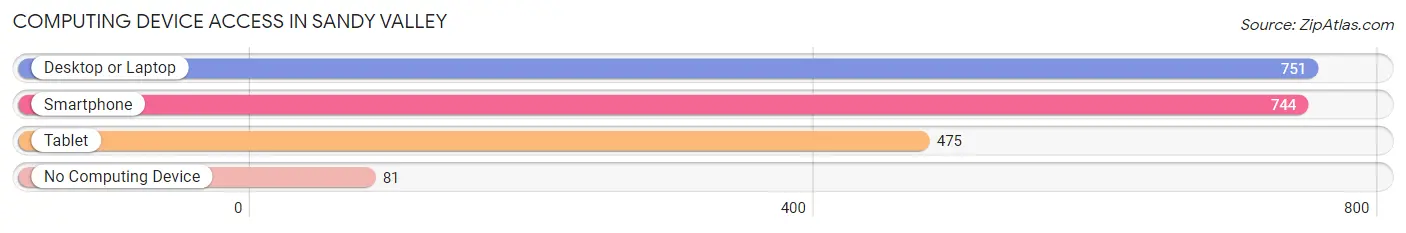
| Device Type | # Households | % Households |
| Desktop or Laptop | 751 | 85.2% |
| Smartphone | 744 | 84.5% |
| Tablet | 475 | 53.9% |
| No Computing Device | 81 | 9.2% |
| Total | 881 | 100.0% |
Internet Access in Sandy Valley
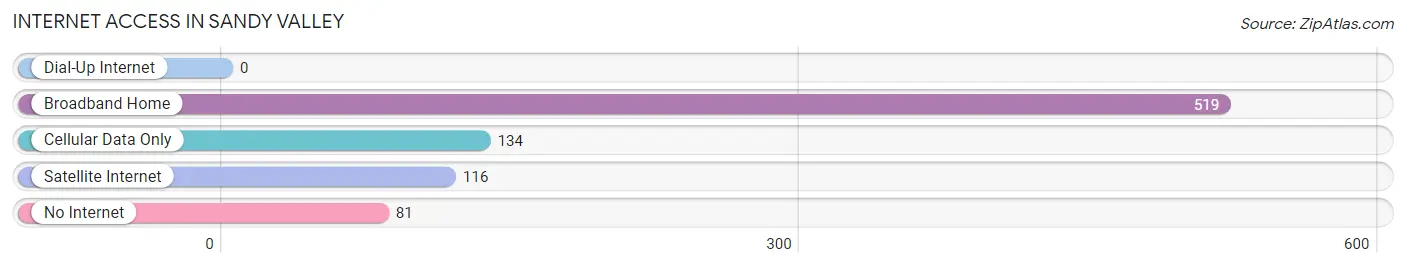
| Internet Type | # Households | % Households |
| Dial-Up Internet | 0 | 0.0% |
| Broadband Home | 519 | 58.9% |
| Cellular Data Only | 134 | 15.2% |
| Satellite Internet | 116 | 13.2% |
| No Internet | 81 | 9.2% |
| Total | 881 | 100.0% |
Sandy Valley Summary
Sandy Valley is a small unincorporated community located in Clark County, Nevada, United States. It is situated in the Mojave Desert, approximately 50 miles southwest of Las Vegas. The population of Sandy Valley was estimated to be 1,845 in 2019.
History
Sandy Valley was first settled in the late 19th century by ranchers and miners. The area was originally known as "Sandy Valley Ranch" and was used for cattle grazing. In the early 20th century, the town was renamed "Sandy Valley" and began to attract more settlers. The town was officially incorporated in 1948.
Geography
Sandy Valley is located in the Mojave Desert, approximately 50 miles southwest of Las Vegas. The town is situated at an elevation of 2,845 feet and covers an area of approximately 10 square miles. The climate is arid and hot, with temperatures ranging from the mid-90s in the summer to the mid-50s in the winter.
Economy
Sandy Valley's economy is largely based on agriculture and tourism. The town is home to several farms and ranches, which produce a variety of crops, including alfalfa, hay, and cotton. The town is also home to several tourist attractions, including the Sandy Valley Speedway and the Sandy Valley Museum.
Demographics
As of 2019, the population of Sandy Valley was estimated to be 1,845. The racial makeup of the town was 79.3% White, 8.2% Hispanic or Latino, 6.2% African American, and 4.3% Native American. The median household income was $45,000, and the median age was 37.
Conclusion
Sandy Valley is a small unincorporated community located in Clark County, Nevada, United States. It is situated in the Mojave Desert, approximately 50 miles southwest of Las Vegas. The population of Sandy Valley was estimated to be 1,845 in 2019. The town's economy is largely based on agriculture and tourism, and the racial makeup of the town is 79.3% White, 8.2% Hispanic or Latino, 6.2% African American, and 4.3% Native American. Sandy Valley is a unique and vibrant community that offers a variety of attractions and activities for visitors and residents alike.
Common Questions
What is Per Capita Income in Sandy Valley?
Per Capita income in Sandy Valley is $67,037.
What is the Median Family Income in Sandy Valley?
Median Family Income in Sandy Valley is $99,036.
What is the Median Household income in Sandy Valley?
Median Household Income in Sandy Valley is $86,042.
What is Inequality or Gini Index in Sandy Valley?
Inequality or Gini Index in Sandy Valley is 0.58.
What is the Total Population of Sandy Valley?
Total Population of Sandy Valley is 1,914.
What is the Total Male Population of Sandy Valley?
Total Male Population of Sandy Valley is 1,060.
What is the Total Female Population of Sandy Valley?
Total Female Population of Sandy Valley is 854.
What is the Ratio of Males per 100 Females in Sandy Valley?
There are 124.12 Males per 100 Females in Sandy Valley.
What is the Ratio of Females per 100 Males in Sandy Valley?
There are 80.57 Females per 100 Males in Sandy Valley.
What is the Median Population Age in Sandy Valley?
Median Population Age in Sandy Valley is 57.4 Years.
What is the Average Family Size in Sandy Valley
Average Family Size in Sandy Valley is 2.7 People.
What is the Average Household Size in Sandy Valley
Average Household Size in Sandy Valley is 2.2 People.
How Large is the Labor Force in Sandy Valley?
There are 705 People in the Labor Forcein in Sandy Valley.
What is the Percentage of People in the Labor Force in Sandy Valley?
38.8% of People are in the Labor Force in Sandy Valley.
What is the Unemployment Rate in Sandy Valley?
Unemployment Rate in Sandy Valley is 10.7%.