Zip Codes with the Highest Percentage of Population Employed in Security & Protection in North Las Vegas, NV
RELATED REPORTS & OPTIONS
Security & Protection
North Las Vegas
Compare Zip Codes
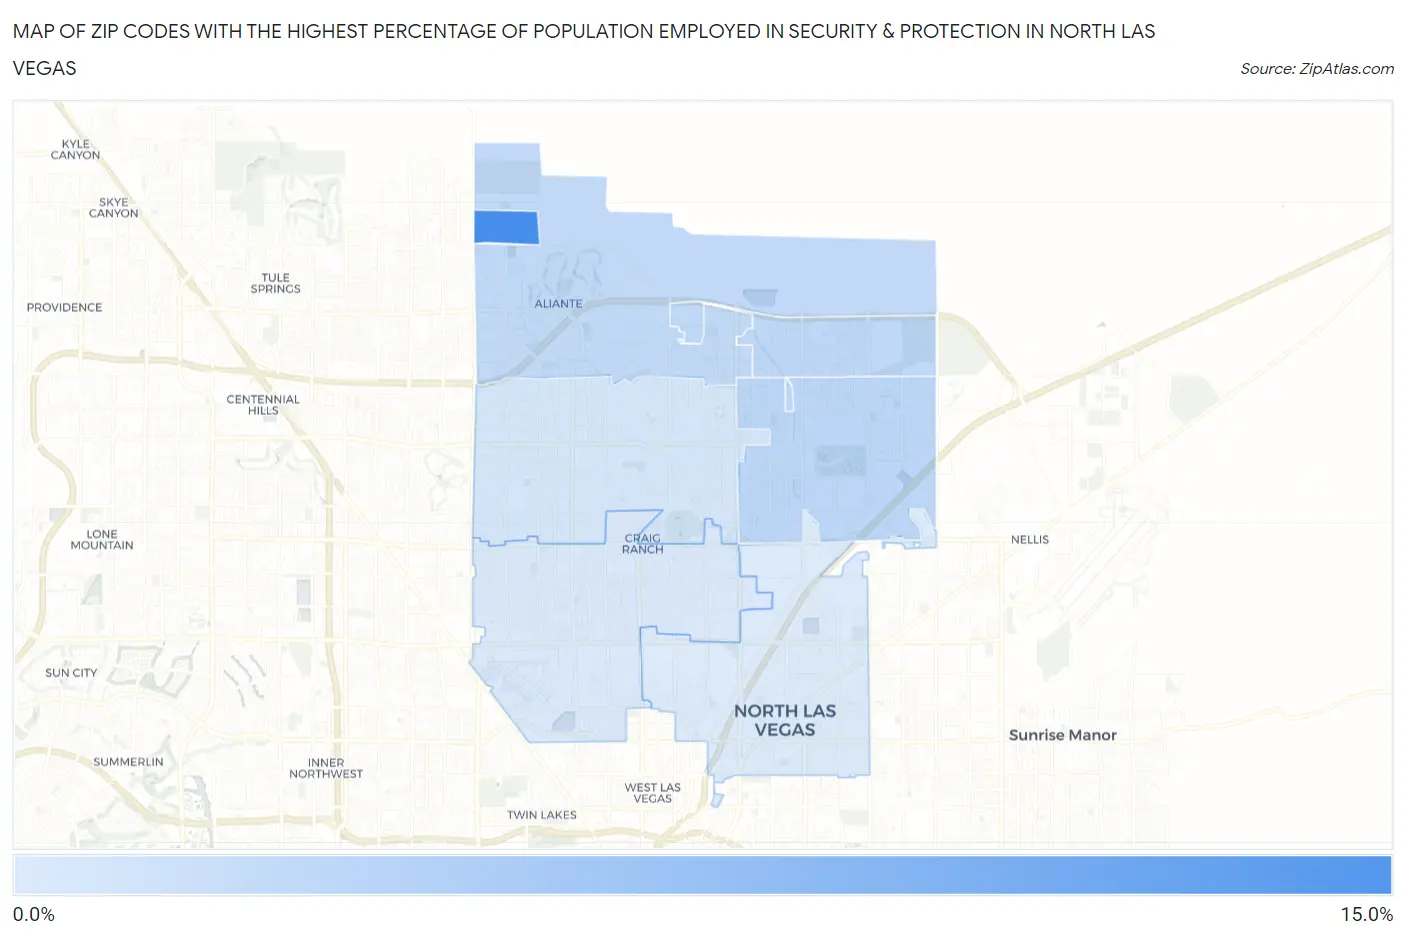
Map of Zip Codes with the Highest Percentage of Population Employed in Security & Protection in North Las Vegas
3.1%
14.7%
Zip Codes with the Highest Percentage of Population Employed in Security & Protection in North Las Vegas, NV
| Zip Code | % Employed | vs State | vs National | |
| 1. | 89085 | 14.7% | 3.0%(+11.7)#4 | 2.1%(+12.6)#374 |
| 2. | 89081 | 5.5% | 3.0%(+2.42)#15 | 2.1%(+3.31)#2,488 |
| 3. | 89086 | 5.3% | 3.0%(+2.26)#19 | 2.1%(+3.14)#2,644 |
| 4. | 89084 | 5.2% | 3.0%(+2.16)#21 | 2.1%(+3.04)#2,716 |
| 5. | 89031 | 3.6% | 3.0%(+0.560)#51 | 2.1%(+1.44)#5,418 |
| 6. | 89032 | 3.3% | 3.0%(+0.272)#59 | 2.1%(+1.15)#6,231 |
| 7. | 89030 | 3.1% | 3.0%(+0.060)#66 | 2.1%(+0.942)#6,916 |
1
Common Questions
What are the Top 5 Zip Codes with the Highest Percentage of Population Employed in Security & Protection in North Las Vegas, NV?
Top 5 Zip Codes with the Highest Percentage of Population Employed in Security & Protection in North Las Vegas, NV are:
What zip code has the Highest Percentage of Population Employed in Security & Protection in North Las Vegas, NV?
89085 has the Highest Percentage of Population Employed in Security & Protection in North Las Vegas, NV with 14.7%.
What is the Percentage of Population Employed in Security & Protection in North Las Vegas, NV?
Percentage of Population Employed in Security & Protection in North Las Vegas is 4.1%.
What is the Percentage of Population Employed in Security & Protection in Nevada?
Percentage of Population Employed in Security & Protection in Nevada is 3.0%.
What is the Percentage of Population Employed in Security & Protection in the United States?
Percentage of Population Employed in Security & Protection in the United States is 2.1%.