Kingsbury, NV Map & Demographics
Kingsbury Map
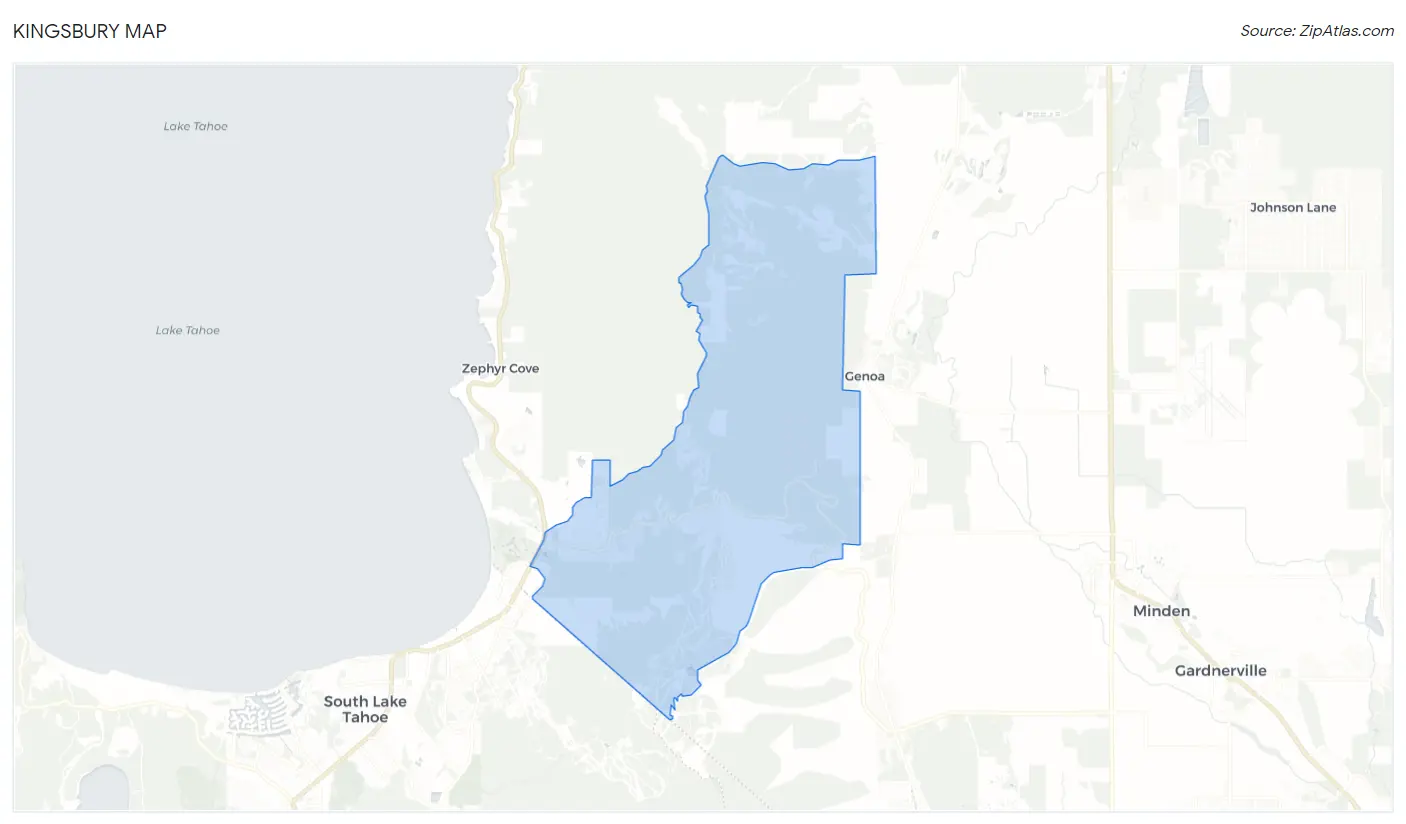
Kingsbury Overview
$104,479
PER CAPITA INCOME
$102,679
AVG FAMILY INCOME
$74,424
AVG HOUSEHOLD INCOME
7.5%
WAGE / INCOME GAP [ % ]
92.5¢/ $1
WAGE / INCOME GAP [ $ ]
0.58
INEQUALITY / GINI INDEX
1,920
TOTAL POPULATION
1,087
MALE POPULATION
833
FEMALE POPULATION
130.49
MALES / 100 FEMALES
76.63
FEMALES / 100 MALES
57.9
MEDIAN AGE
2.2
AVG FAMILY SIZE
1.8
AVG HOUSEHOLD SIZE
1,000
LABOR FORCE [ PEOPLE ]
55.0%
PERCENT IN LABOR FORCE
1.3%
UNEMPLOYMENT RATE
Income in Kingsbury
Income Overview in Kingsbury
Per Capita Income in Kingsbury is $104,479, while median incomes of families and households are $102,679 and $74,424 respectively.
| Characteristic | Number | Measure |
| Per Capita Income | 1,920 | $104,479 |
| Median Family Income | 673 | $102,679 |
| Mean Family Income | 673 | $244,273 |
| Median Household Income | 1,059 | $74,424 |
| Mean Household Income | 1,059 | $188,434 |
| Income Deficit | 673 | $0 |
| Wage / Income Gap (%) | 1,920 | 7.50% |
| Wage / Income Gap ($) | 1,920 | 92.50¢ per $1 |
| Gini / Inequality Index | 1,920 | 0.58 |
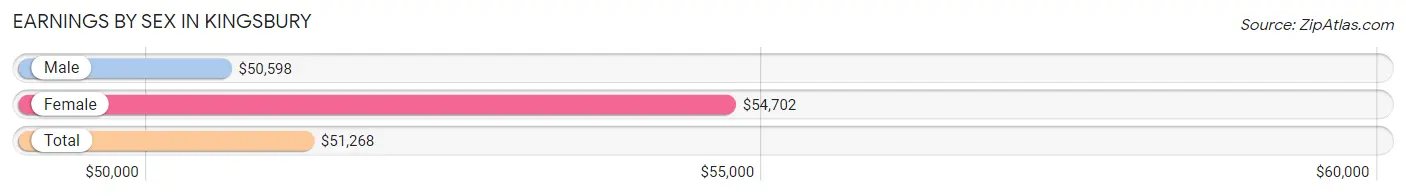
Earnings by Sex in Kingsbury
Average Earnings in Kingsbury are $51,268, $50,598 for men and $54,702 for women, a difference of 7.5%.
| Sex | Number | Average Earnings |
| Male | 739 (62.8%) | $50,598 |
| Female | 437 (37.2%) | $54,702 |
| Total | 1,176 (100.0%) | $51,268 |
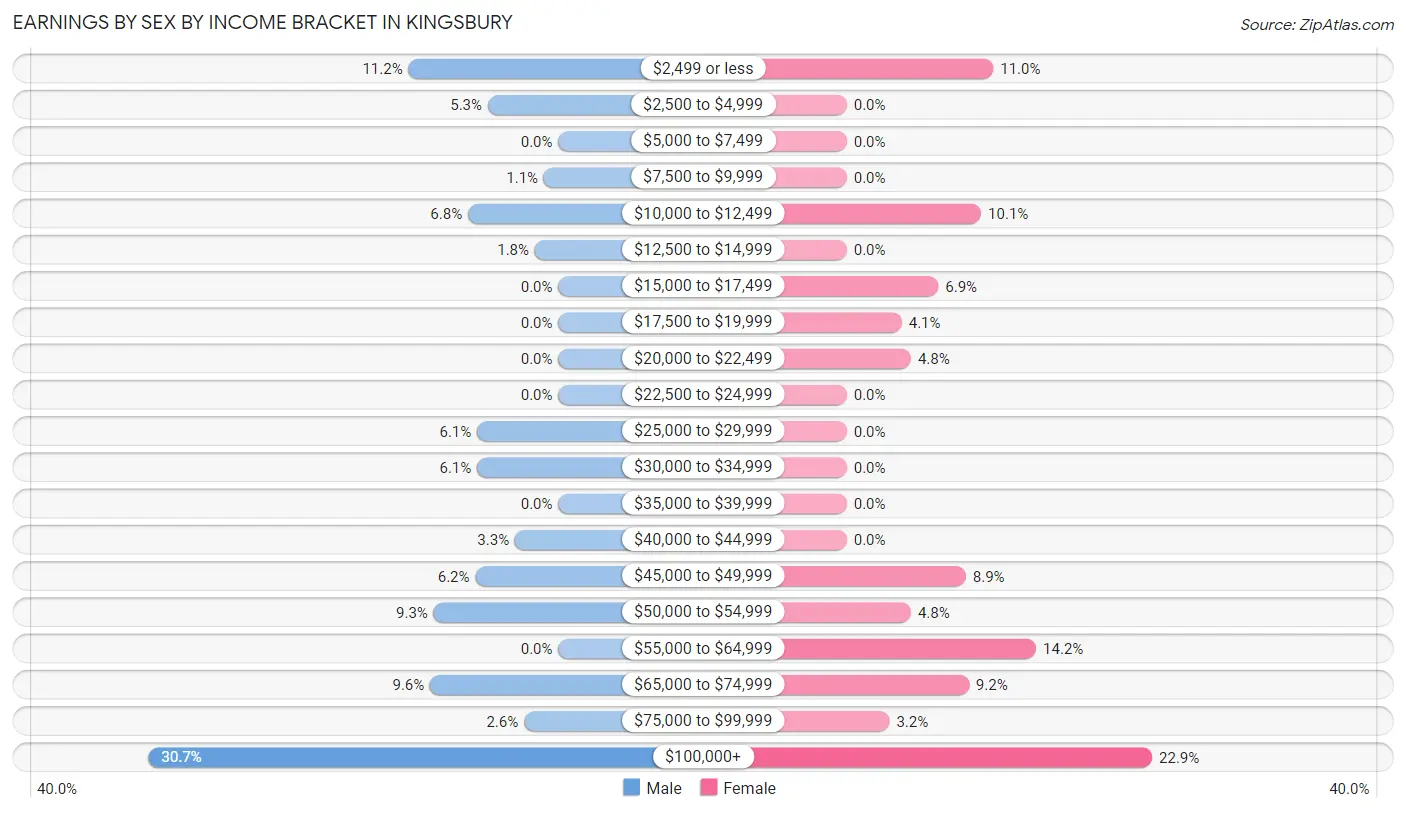
Earnings by Sex by Income Bracket in Kingsbury
The most common earnings brackets in Kingsbury are $100,000+ for men (227 | 30.7%) and $100,000+ for women (100 | 22.9%).
| Income | Male | Female |
| $2,499 or less | 83 (11.2%) | 48 (11.0%) |
| $2,500 to $4,999 | 39 (5.3%) | 0 (0.0%) |
| $5,000 to $7,499 | 0 (0.0%) | 0 (0.0%) |
| $7,500 to $9,999 | 8 (1.1%) | 0 (0.0%) |
| $10,000 to $12,499 | 50 (6.8%) | 44 (10.1%) |
| $12,500 to $14,999 | 13 (1.8%) | 0 (0.0%) |
| $15,000 to $17,499 | 0 (0.0%) | 30 (6.9%) |
| $17,500 to $19,999 | 0 (0.0%) | 18 (4.1%) |
| $20,000 to $22,499 | 0 (0.0%) | 21 (4.8%) |
| $22,500 to $24,999 | 0 (0.0%) | 0 (0.0%) |
| $25,000 to $29,999 | 45 (6.1%) | 0 (0.0%) |
| $30,000 to $34,999 | 45 (6.1%) | 0 (0.0%) |
| $35,000 to $39,999 | 0 (0.0%) | 0 (0.0%) |
| $40,000 to $44,999 | 24 (3.3%) | 0 (0.0%) |
| $45,000 to $49,999 | 46 (6.2%) | 39 (8.9%) |
| $50,000 to $54,999 | 69 (9.3%) | 21 (4.8%) |
| $55,000 to $64,999 | 0 (0.0%) | 62 (14.2%) |
| $65,000 to $74,999 | 71 (9.6%) | 40 (9.1%) |
| $75,000 to $99,999 | 19 (2.6%) | 14 (3.2%) |
| $100,000+ | 227 (30.7%) | 100 (22.9%) |
| Total | 739 (100.0%) | 437 (100.0%) |
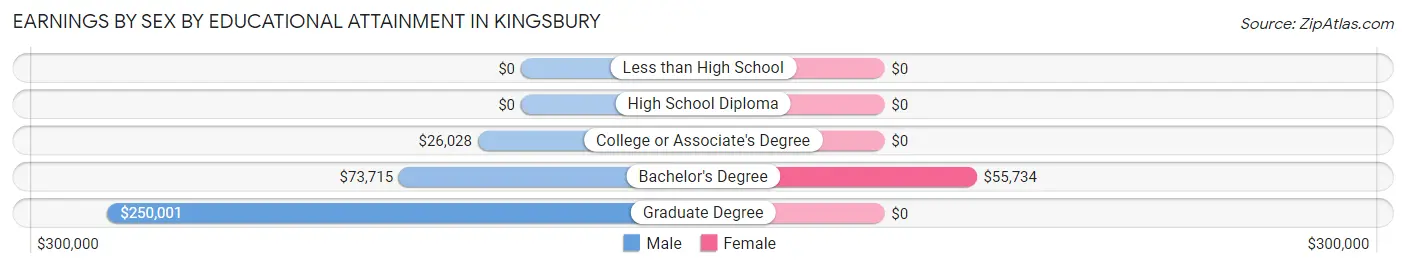
Earnings by Sex by Educational Attainment in Kingsbury
Average earnings in Kingsbury are $50,326 for men and $54,702 for women, a difference of 8.0%. Men with an educational attainment of graduate degree enjoy the highest average annual earnings of $250,001, while those with college or associate's degree education earn the least with $26,028. Women with an educational attainment of bachelor's degree earn the most with the average annual earnings of $55,734, while those with bachelor's degree education have the smallest earnings of $55,734.
| Educational Attainment | Male Income | Female Income |
| Less than High School | - | - |
| High School Diploma | - | - |
| College or Associate's Degree | $26,028 | $0 |
| Bachelor's Degree | $73,715 | $55,734 |
| Graduate Degree | $250,001 | $0 |
| Total | $50,326 | $54,702 |
Family Income in Kingsbury
Family Income Brackets in Kingsbury
According to the Kingsbury family income data, there are 232 families falling into the $200,000+ income range, which is the most common income bracket and makes up 34.5% of all families.
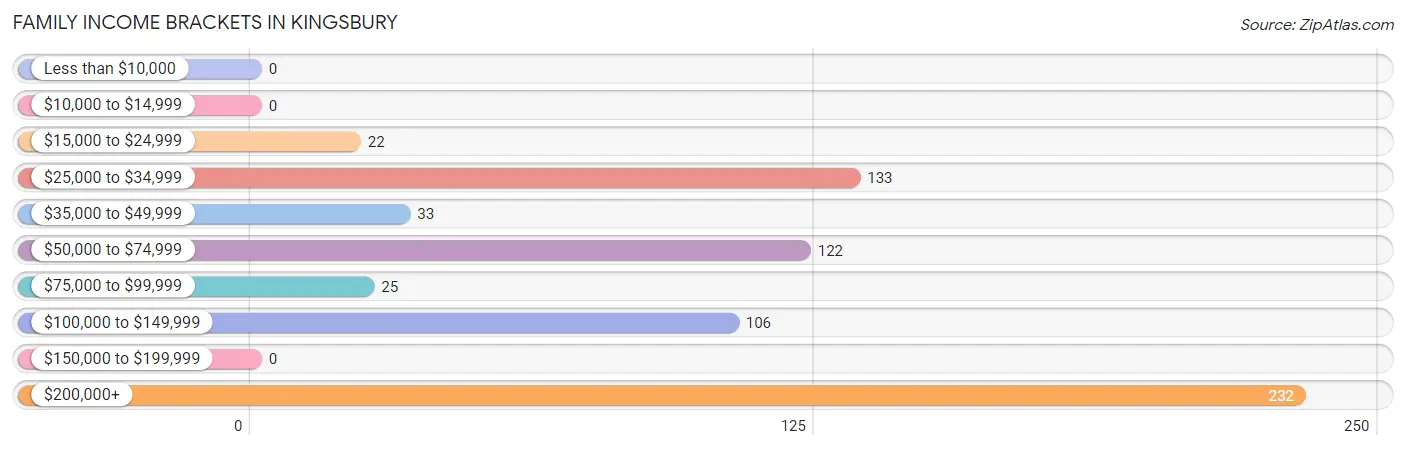
| Income Bracket | # Families | % Families |
| Less than $10,000 | 0 | 0.0% |
| $10,000 to $14,999 | 0 | 0.0% |
| $15,000 to $24,999 | 22 | 3.3% |
| $25,000 to $34,999 | 133 | 19.8% |
| $35,000 to $49,999 | 33 | 4.9% |
| $50,000 to $74,999 | 122 | 18.1% |
| $75,000 to $99,999 | 25 | 3.7% |
| $100,000 to $149,999 | 106 | 15.8% |
| $150,000 to $199,999 | 0 | 0.0% |
| $200,000+ | 232 | 34.5% |
Family Income by Famaliy Size in Kingsbury
2-person families (548 | 81.4%) account for the highest median family income in Kingsbury with $103,452 per family, while 2-person families (548 | 81.4%) have the highest median income of $51,726 per family member.
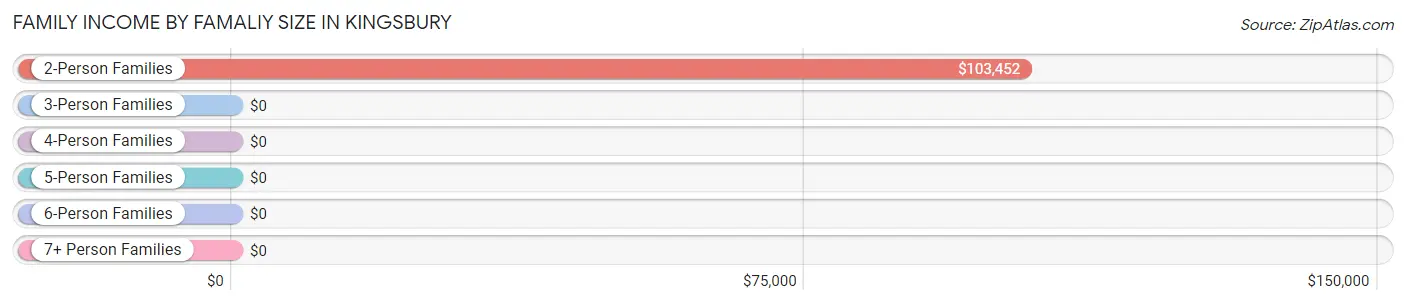
| Income Bracket | # Families | Median Income |
| 2-Person Families | 548 (81.4%) | $103,452 |
| 3-Person Families | 103 (15.3%) | $0 |
| 4-Person Families | 0 (0.0%) | $0 |
| 5-Person Families | 22 (3.3%) | $0 |
| 6-Person Families | 0 (0.0%) | $0 |
| 7+ Person Families | 0 (0.0%) | $0 |
| Total | 673 (100.0%) | $102,679 |
Family Income by Number of Earners in Kingsbury
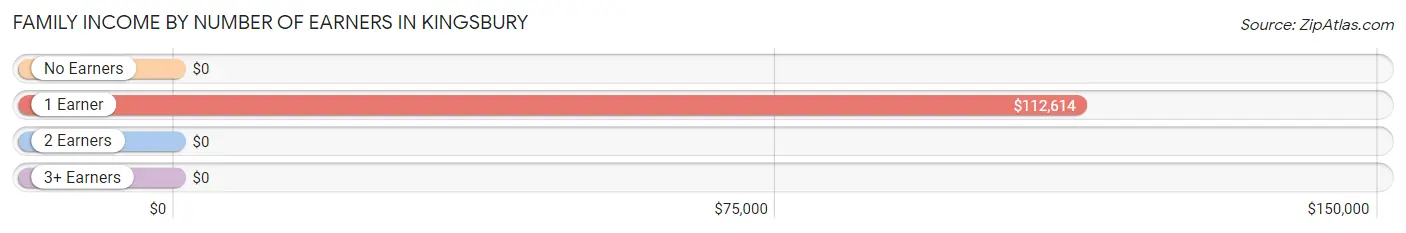
| Number of Earners | # Families | Median Income |
| No Earners | 210 (31.2%) | $0 |
| 1 Earner | 153 (22.7%) | $112,614 |
| 2 Earners | 292 (43.4%) | $0 |
| 3+ Earners | 18 (2.7%) | $0 |
| Total | 673 (100.0%) | $102,679 |
Household Income in Kingsbury
Household Income Brackets in Kingsbury
With 301 households falling in the category, the $50,000 to $74,999 income range is the most frequent in Kingsbury, accounting for 28.4% of all households.
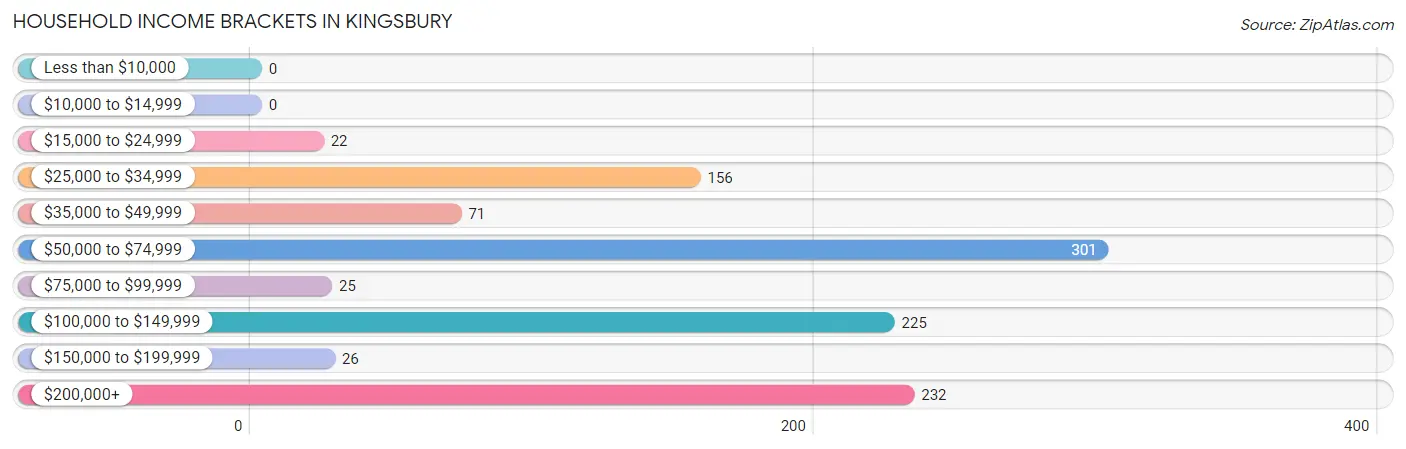
| Income Bracket | # Households | % Households |
| Less than $10,000 | 0 | 0.0% |
| $10,000 to $14,999 | 0 | 0.0% |
| $15,000 to $24,999 | 22 | 2.1% |
| $25,000 to $34,999 | 156 | 14.7% |
| $35,000 to $49,999 | 71 | 6.7% |
| $50,000 to $74,999 | 301 | 28.4% |
| $75,000 to $99,999 | 25 | 2.4% |
| $100,000 to $149,999 | 225 | 21.2% |
| $150,000 to $199,999 | 26 | 2.5% |
| $200,000+ | 232 | 21.9% |
Household Income by Householder Age in Kingsbury
The median household income in Kingsbury is $74,424, with the highest median household income of $114,318 found in the 65+ years age bracket for the primary householder. A total of 358 households (33.8%) fall into this category. Meanwhile, the 15 to 24 years age bracket for the primary householder has the lowest median household income of $0, with 28 households (2.6%) in this group.
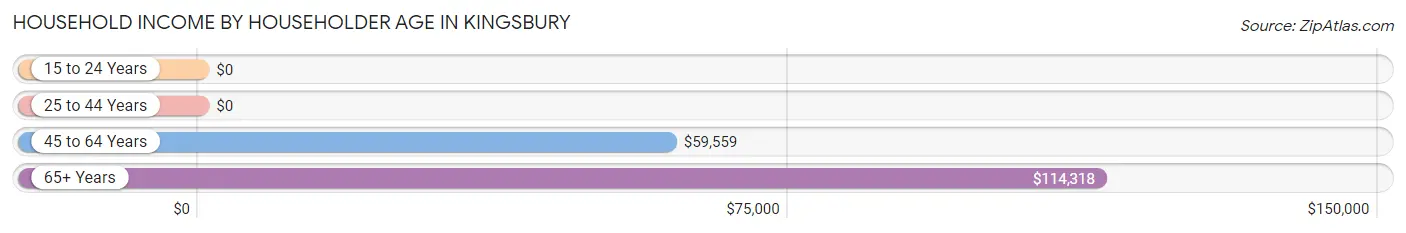
| Income Bracket | # Households | Median Income |
| 15 to 24 Years | 28 (2.6%) | $0 |
| 25 to 44 Years | 265 (25.0%) | $0 |
| 45 to 64 Years | 408 (38.5%) | $59,559 |
| 65+ Years | 358 (33.8%) | $114,318 |
| Total | 1,059 (100.0%) | $74,424 |
Poverty in Kingsbury
Income Below Poverty by Sex and Age in Kingsbury
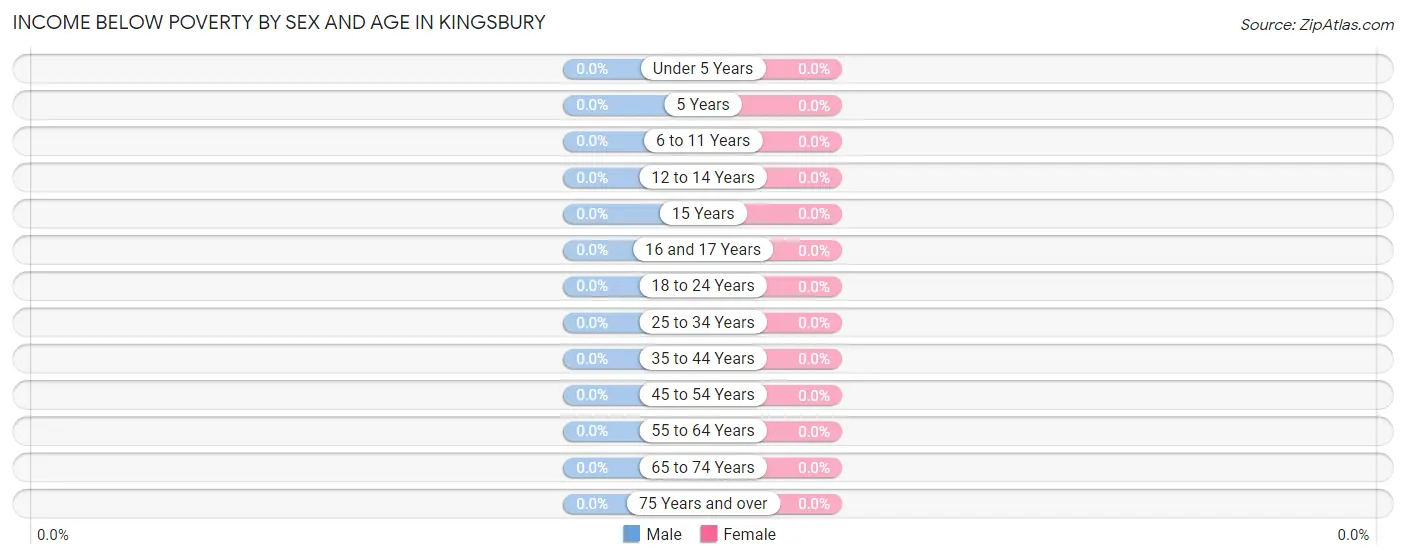
| Age Bracket | Male | Female |
| Under 5 Years | 0 (0.0%) | 0 (0.0%) |
| 5 Years | 0 (0.0%) | 0 (0.0%) |
| 6 to 11 Years | 0 (0.0%) | 0 (0.0%) |
| 12 to 14 Years | 0 (0.0%) | 0 (0.0%) |
| 15 Years | 0 (0.0%) | 0 (0.0%) |
| 16 and 17 Years | 0 (0.0%) | 0 (0.0%) |
| 18 to 24 Years | 0 (0.0%) | 0 (0.0%) |
| 25 to 34 Years | 0 (0.0%) | 0 (0.0%) |
| 35 to 44 Years | 0 (0.0%) | 0 (0.0%) |
| 45 to 54 Years | 0 (0.0%) | 0 (0.0%) |
| 55 to 64 Years | 0 (0.0%) | 0 (0.0%) |
| 65 to 74 Years | 0 (0.0%) | 0 (0.0%) |
| 75 Years and over | 0 (0.0%) | 0 (0.0%) |
| Total | 0 (0.0%) | 0 (0.0%) |
Income Above Poverty by Sex and Age in Kingsbury
According to the poverty statistics in Kingsbury, males aged under 5 years and females aged 6 to 11 years are the age groups that are most secure financially, with 100.0% of males and 100.0% of females in these age groups living above the poverty line.
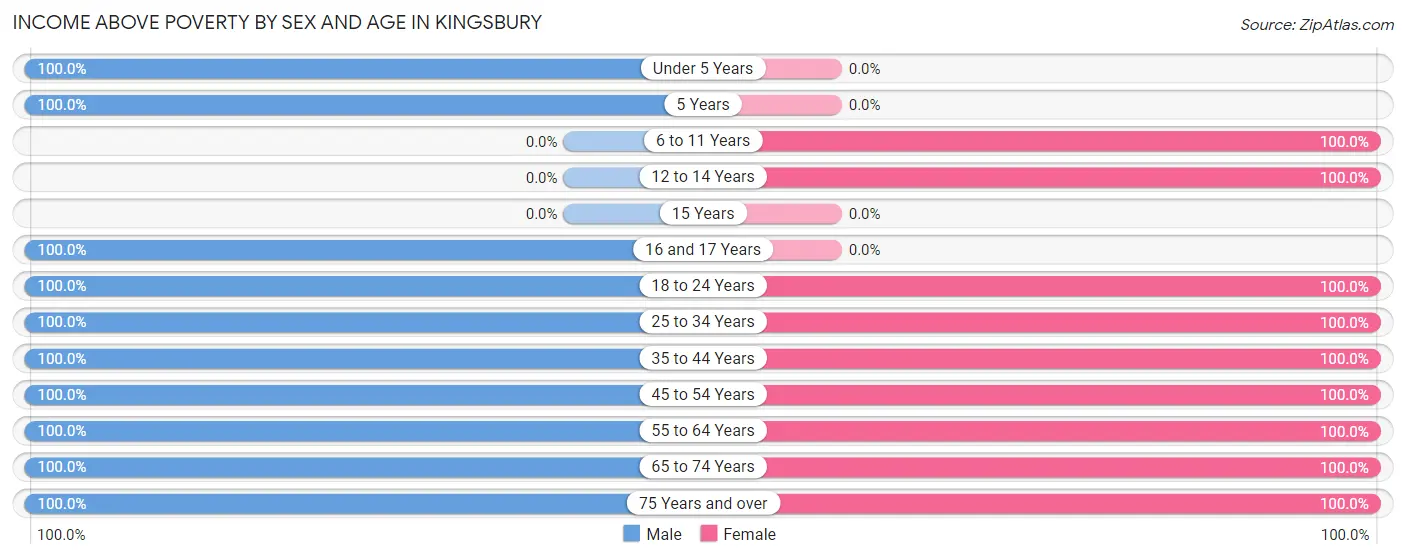
| Age Bracket | Male | Female |
| Under 5 Years | 16 (100.0%) | 0 (0.0%) |
| 5 Years | 21 (100.0%) | 0 (0.0%) |
| 6 to 11 Years | 0 (0.0%) | 46 (100.0%) |
| 12 to 14 Years | 0 (0.0%) | 18 (100.0%) |
| 15 Years | 0 (0.0%) | 0 (0.0%) |
| 16 and 17 Years | 22 (100.0%) | 0 (0.0%) |
| 18 to 24 Years | 28 (100.0%) | 39 (100.0%) |
| 25 to 34 Years | 81 (100.0%) | 76 (100.0%) |
| 35 to 44 Years | 204 (100.0%) | 72 (100.0%) |
| 45 to 54 Years | 88 (100.0%) | 73 (100.0%) |
| 55 to 64 Years | 285 (100.0%) | 183 (100.0%) |
| 65 to 74 Years | 279 (100.0%) | 254 (100.0%) |
| 75 Years and over | 63 (100.0%) | 72 (100.0%) |
| Total | 1,087 (100.0%) | 833 (100.0%) |
Income Below Poverty Among Married-Couple Families in Kingsbury
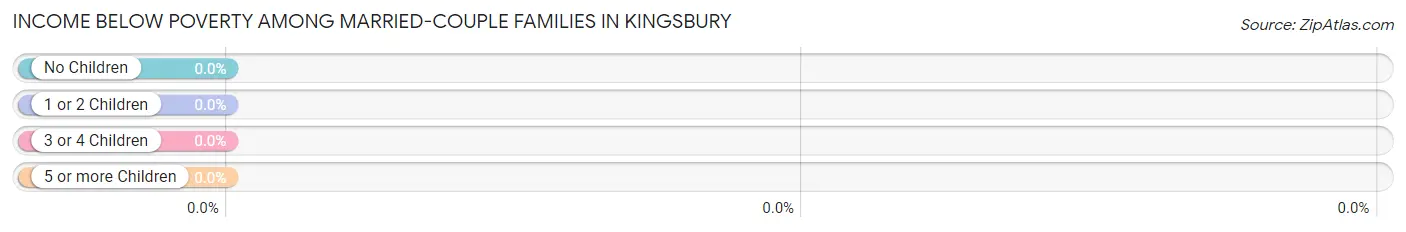
| Children | Above Poverty | Below Poverty |
| No Children | 541 (100.0%) | 0 (0.0%) |
| 1 or 2 Children | 16 (100.0%) | 0 (0.0%) |
| 3 or 4 Children | 22 (100.0%) | 0 (0.0%) |
| 5 or more Children | 0 (0.0%) | 0 (0.0%) |
| Total | 579 (100.0%) | 0 (0.0%) |
Income Below Poverty Among Single-Parent Households in Kingsbury
| Children | Single Father | Single Mother |
| No Children | 0 (0.0%) | 0 (0.0%) |
| 1 or 2 Children | 0 (0.0%) | 0 (0.0%) |
| 3 or 4 Children | 0 (0.0%) | 0 (0.0%) |
| 5 or more Children | 0 (0.0%) | 0 (0.0%) |
| Total | 0 (0.0%) | 0 (0.0%) |
Income Below Poverty Among Married-Couple vs Single-Parent Households in Kingsbury
| Children | Married-Couple Families | Single-Parent Households |
| No Children | 0 (0.0%) | 0 (0.0%) |
| 1 or 2 Children | 0 (0.0%) | 0 (0.0%) |
| 3 or 4 Children | 0 (0.0%) | 0 (0.0%) |
| 5 or more Children | 0 (0.0%) | 0 (0.0%) |
| Total | 0 (0.0%) | 0 (0.0%) |
Race in Kingsbury
The most populous races in Kingsbury are White / Caucasian (1,540 | 80.2%), Two or more Races (223 | 11.6%), and Hispanic or Latino (150 | 7.8%).
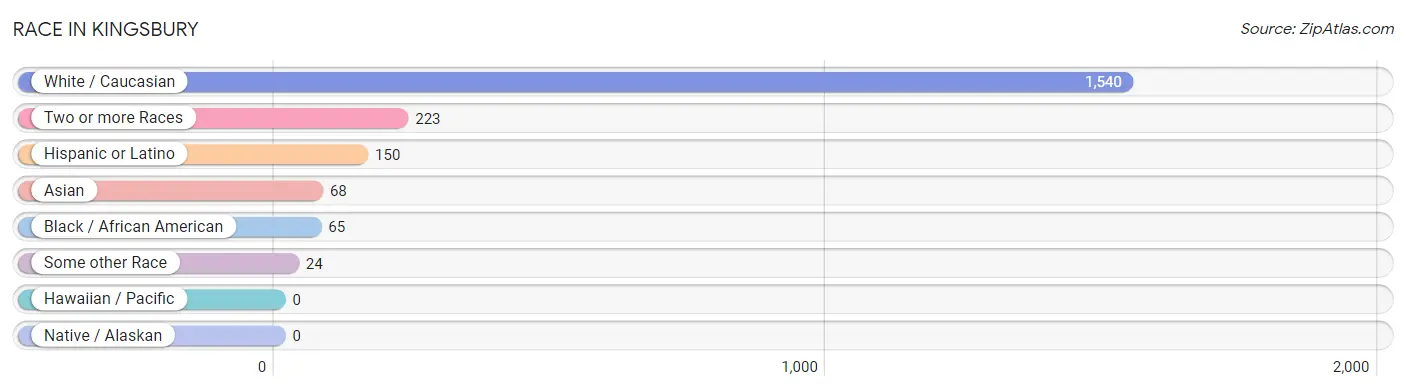
| Race | # Population | % Population |
| Asian | 68 | 3.5% |
| Black / African American | 65 | 3.4% |
| Hawaiian / Pacific | 0 | 0.0% |
| Hispanic or Latino | 150 | 7.8% |
| Native / Alaskan | 0 | 0.0% |
| White / Caucasian | 1,540 | 80.2% |
| Two or more Races | 223 | 11.6% |
| Some other Race | 24 | 1.3% |
| Total | 1,920 | 100.0% |
Ancestry in Kingsbury
The most populous ancestries reported in Kingsbury are Irish (425 | 22.1%), German (391 | 20.4%), English (350 | 18.2%), Italian (95 | 5.0%), and Spaniard (87 | 4.5%), together accounting for 70.2% of all Kingsbury residents.
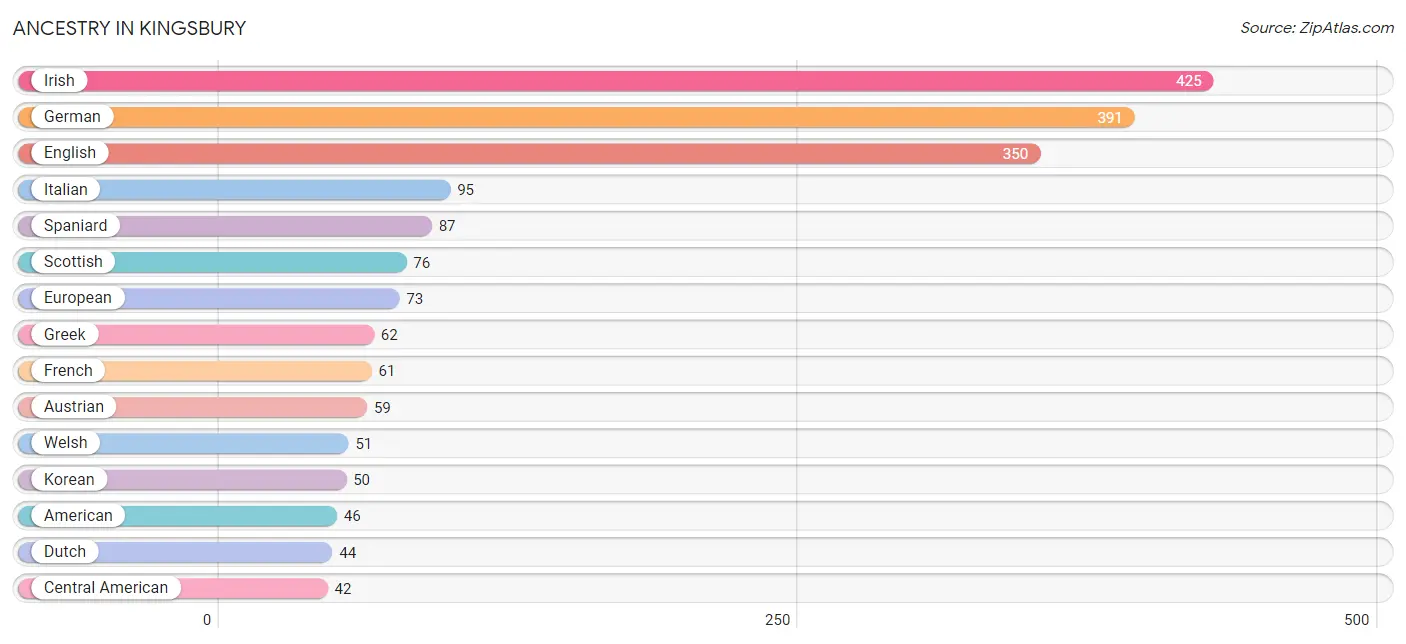
| Ancestry | # Population | % Population |
| American | 46 | 2.4% |
| Arab | 32 | 1.7% |
| Austrian | 59 | 3.1% |
| Central American | 42 | 2.2% |
| Cherokee | 16 | 0.8% |
| Costa Rican | 18 | 0.9% |
| Danish | 39 | 2.0% |
| Dutch | 44 | 2.3% |
| English | 350 | 18.2% |
| European | 73 | 3.8% |
| French | 61 | 3.2% |
| German | 391 | 20.4% |
| Greek | 62 | 3.2% |
| Guatemalan | 24 | 1.3% |
| Hungarian | 37 | 1.9% |
| Indian (Asian) | 18 | 0.9% |
| Iranian | 22 | 1.1% |
| Irish | 425 | 22.1% |
| Italian | 95 | 5.0% |
| Korean | 50 | 2.6% |
| Lebanese | 32 | 1.7% |
| Mexican | 21 | 1.1% |
| Norwegian | 37 | 1.9% |
| Polish | 21 | 1.1% |
| Portuguese | 21 | 1.1% |
| Russian | 21 | 1.1% |
| Scottish | 76 | 4.0% |
| Spaniard | 87 | 4.5% |
| Swedish | 17 | 0.9% |
| Welsh | 51 | 2.7% | View All 30 Rows |
Immigrants in Kingsbury
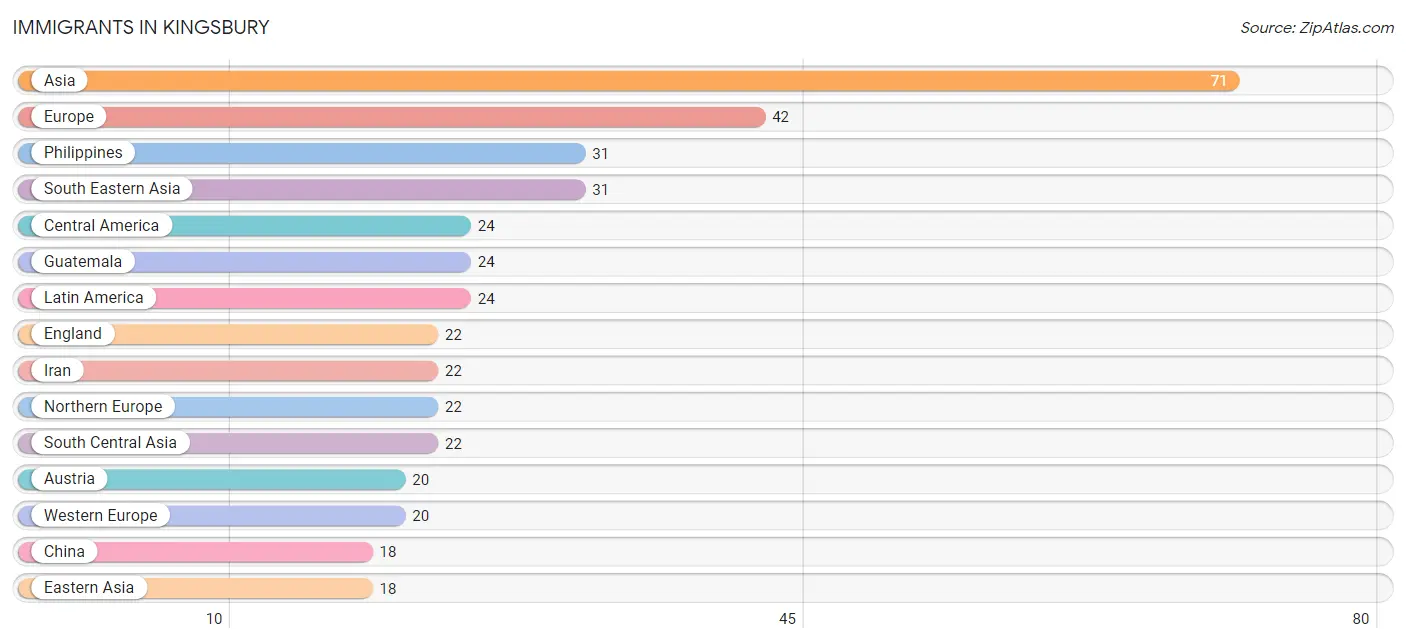
The most numerous immigrant groups reported in Kingsbury came from Asia (71 | 3.7%), Europe (42 | 2.2%), Philippines (31 | 1.6%), South Eastern Asia (31 | 1.6%), and Central America (24 | 1.3%), together accounting for 10.4% of all Kingsbury residents.
| Immigration Origin | # Population | % Population |
| Asia | 71 | 3.7% |
| Austria | 20 | 1.0% |
| Central America | 24 | 1.3% |
| China | 18 | 0.9% |
| Eastern Asia | 18 | 0.9% |
| England | 22 | 1.1% |
| Europe | 42 | 2.2% |
| Guatemala | 24 | 1.3% |
| Hong Kong | 18 | 0.9% |
| Iran | 22 | 1.1% |
| Latin America | 24 | 1.3% |
| Northern Europe | 22 | 1.1% |
| Philippines | 31 | 1.6% |
| South Central Asia | 22 | 1.1% |
| South Eastern Asia | 31 | 1.6% |
| Western Europe | 20 | 1.0% | View All 16 Rows |
Sex and Age in Kingsbury
Sex and Age in Kingsbury
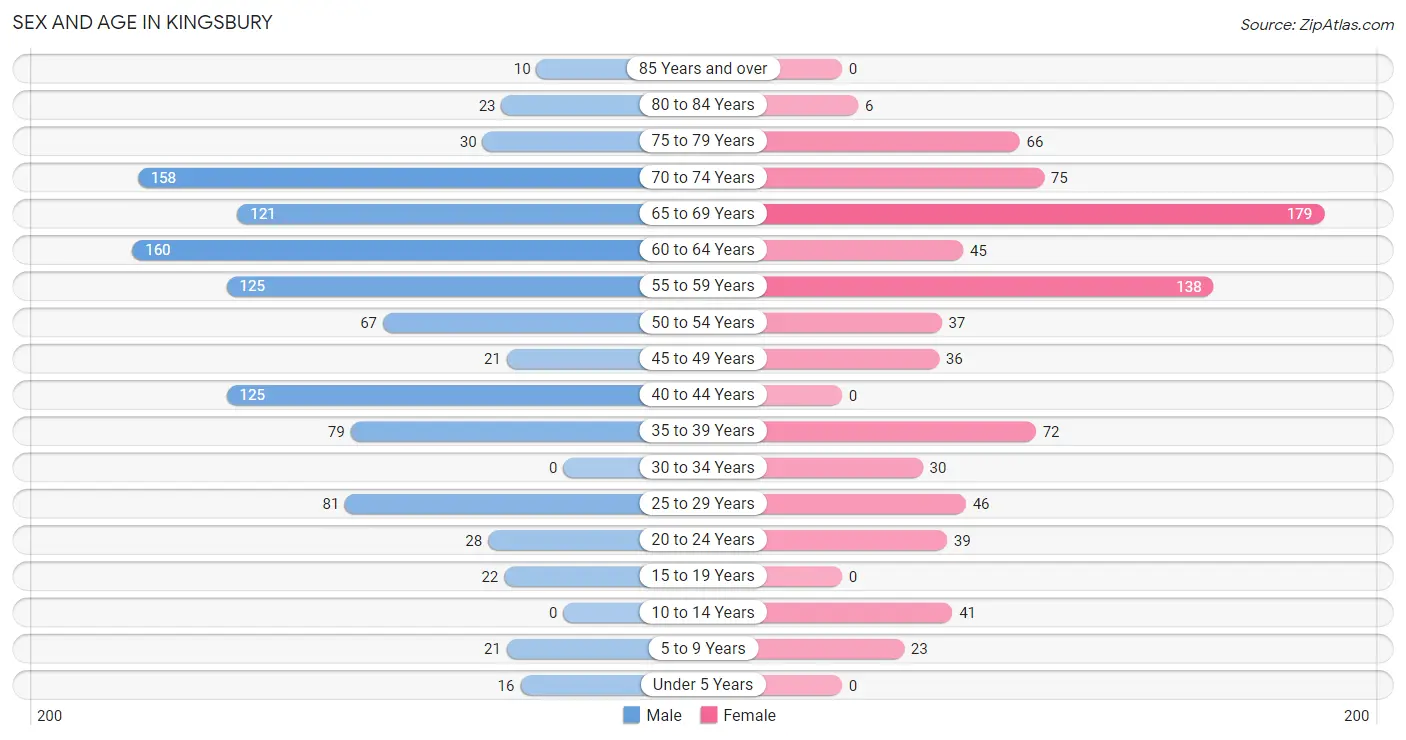
The most populous age groups in Kingsbury are 60 to 64 Years (160 | 14.7%) for men and 65 to 69 Years (179 | 21.5%) for women.
| Age Bracket | Male | Female |
| Under 5 Years | 16 (1.5%) | 0 (0.0%) |
| 5 to 9 Years | 21 (1.9%) | 23 (2.8%) |
| 10 to 14 Years | 0 (0.0%) | 41 (4.9%) |
| 15 to 19 Years | 22 (2.0%) | 0 (0.0%) |
| 20 to 24 Years | 28 (2.6%) | 39 (4.7%) |
| 25 to 29 Years | 81 (7.4%) | 46 (5.5%) |
| 30 to 34 Years | 0 (0.0%) | 30 (3.6%) |
| 35 to 39 Years | 79 (7.3%) | 72 (8.6%) |
| 40 to 44 Years | 125 (11.5%) | 0 (0.0%) |
| 45 to 49 Years | 21 (1.9%) | 36 (4.3%) |
| 50 to 54 Years | 67 (6.2%) | 37 (4.4%) |
| 55 to 59 Years | 125 (11.5%) | 138 (16.6%) |
| 60 to 64 Years | 160 (14.7%) | 45 (5.4%) |
| 65 to 69 Years | 121 (11.1%) | 179 (21.5%) |
| 70 to 74 Years | 158 (14.5%) | 75 (9.0%) |
| 75 to 79 Years | 30 (2.8%) | 66 (7.9%) |
| 80 to 84 Years | 23 (2.1%) | 6 (0.7%) |
| 85 Years and over | 10 (0.9%) | 0 (0.0%) |
| Total | 1,087 (100.0%) | 833 (100.0%) |
Families and Households in Kingsbury
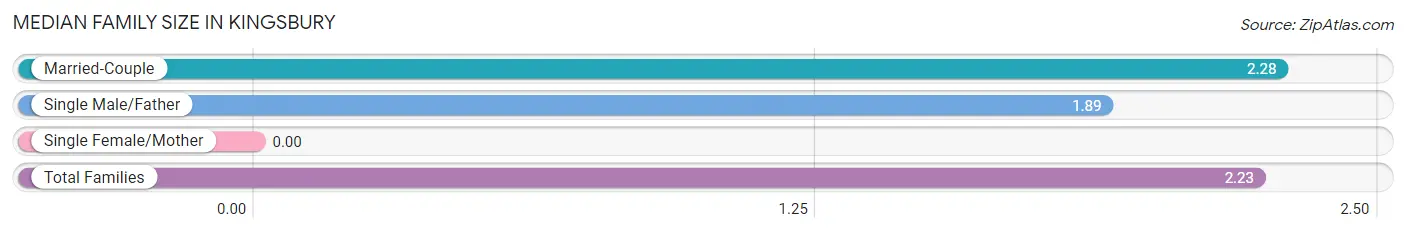
Median Family Size in Kingsbury
| Family Type | # Families | Family Size |
| Married-Couple | 579 (86.0%) | 2.28 |
| Single Male/Father | 94 (14.0%) | 1.89 |
| Single Female/Mother | 0 (0.0%) | - |
| Total Families | 673 (100.0%) | 2.23 |
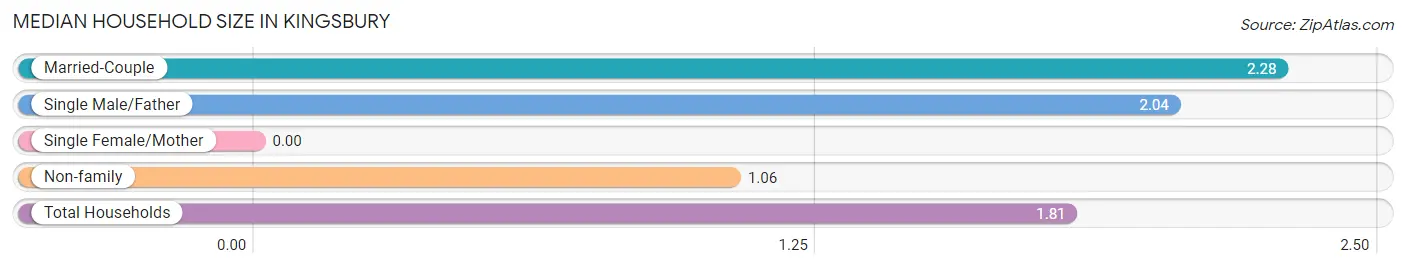
Median Household Size in Kingsbury
| Household Type | # Households | Household Size |
| Married-Couple | 579 (54.7%) | 2.28 |
| Single Male/Father | 94 (8.9%) | 2.04 |
| Single Female/Mother | 0 (0.0%) | - |
| Non-family | 386 (36.4%) | 1.06 |
| Total Households | 1,059 (100.0%) | 1.81 |
Household Size by Marriage Status in Kingsbury
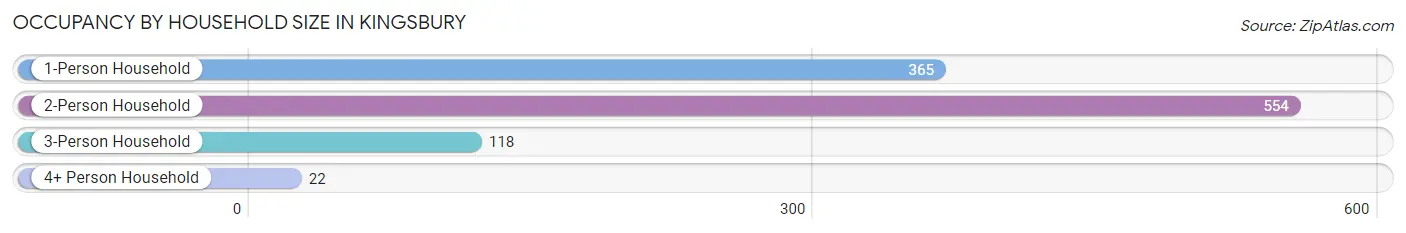
Out of a total of 1,059 households in Kingsbury, 673 (63.5%) are family households, while 386 (36.4%) are nonfamily households. The most numerous type of family households are 2-person households, comprising 533, and the most common type of nonfamily households are 1-person households, comprising 365.
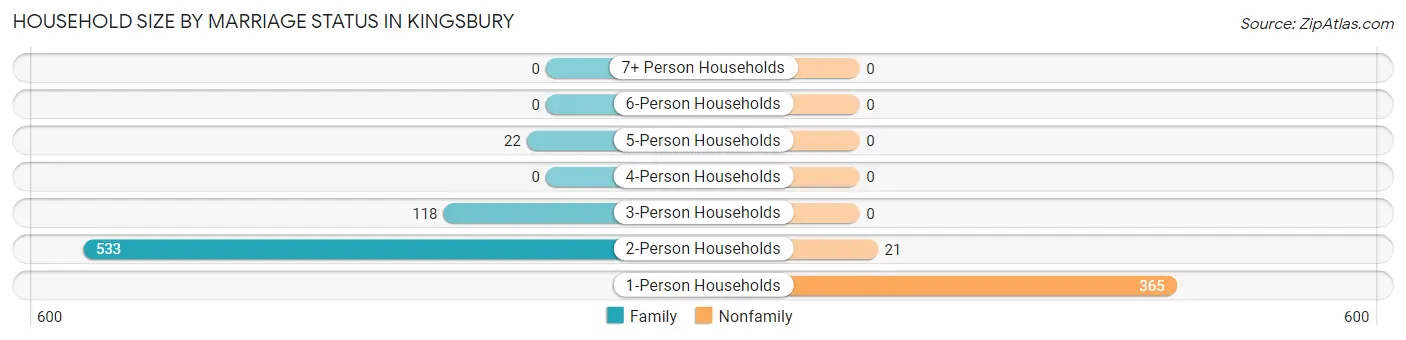
| Household Size | Family Households | Nonfamily Households |
| 1-Person Households | - | 365 (34.5%) |
| 2-Person Households | 533 (50.3%) | 21 (2.0%) |
| 3-Person Households | 118 (11.1%) | 0 (0.0%) |
| 4-Person Households | 0 (0.0%) | 0 (0.0%) |
| 5-Person Households | 22 (2.1%) | 0 (0.0%) |
| 6-Person Households | 0 (0.0%) | 0 (0.0%) |
| 7+ Person Households | 0 (0.0%) | 0 (0.0%) |
| Total | 673 (63.5%) | 386 (36.4%) |
Female Fertility in Kingsbury
Fertility by Age in Kingsbury
| Age Bracket | Women with Births | Births / 1,000 Women |
| 15 to 19 years | 0 (0.0%) | 0.0 |
| 20 to 34 years | 0 (0.0%) | 0.0 |
| 35 to 50 years | 0 (0.0%) | 0.0 |
| Total | 0 (0.0%) | 0.0 |
Fertility by Age by Marriage Status in Kingsbury
| Age Bracket | Married | Unmarried |
| 15 to 19 years | 0 (0.0%) | 0 (0.0%) |
| 20 to 34 years | 0 (0.0%) | 0 (0.0%) |
| 35 to 50 years | 0 (0.0%) | 0 (0.0%) |
| Total | 0 (0.0%) | 0 (0.0%) |
Fertility by Education in Kingsbury
| Educational Attainment | Women with Births | Births / 1,000 Women |
| Less than High School | 0 (0.0%) | 0.0 |
| High School Diploma | 0 (0.0%) | 0.0 |
| College or Associate's Degree | 0 (0.0%) | 0.0 |
| Bachelor's Degree | 0 (0.0%) | 0.0 |
| Graduate Degree | 0 (0.0%) | 0.0 |
| Total | 0 (0.0%) | 0.0 |
Fertility by Education by Marriage Status in Kingsbury
| Educational Attainment | Married | Unmarried |
| Less than High School | 0 (0.0%) | 0 (0.0%) |
| High School Diploma | 0 (0.0%) | 0 (0.0%) |
| College or Associate's Degree | 0 (0.0%) | 0 (0.0%) |
| Bachelor's Degree | 0 (0.0%) | 0 (0.0%) |
| Graduate Degree | 0 (0.0%) | 0 (0.0%) |
| Total | 0 (0.0%) | 0 (0.0%) |
Employment Characteristics in Kingsbury
Employment by Class of Employer in Kingsbury
Among the 962 employed individuals in Kingsbury, private company employees (530 | 55.1%), self-employed (incorporated) (116 | 12.1%), and local government employees (109 | 11.3%) make up the most common classes of employment.
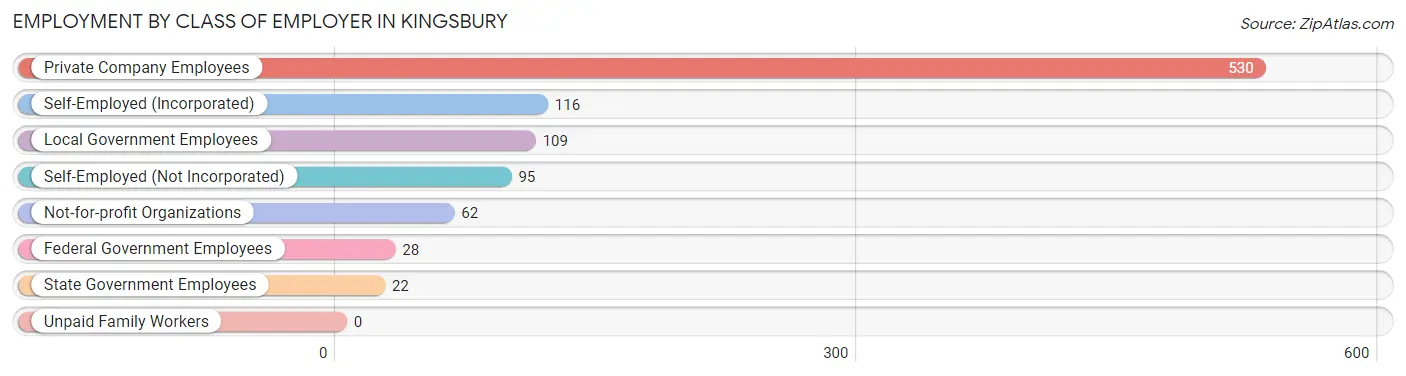
| Employer Class | # Employees | % Employees |
| Private Company Employees | 530 | 55.1% |
| Self-Employed (Incorporated) | 116 | 12.1% |
| Self-Employed (Not Incorporated) | 95 | 9.9% |
| Not-for-profit Organizations | 62 | 6.4% |
| Local Government Employees | 109 | 11.3% |
| State Government Employees | 22 | 2.3% |
| Federal Government Employees | 28 | 2.9% |
| Unpaid Family Workers | 0 | 0.0% |
| Total | 962 | 100.0% |
Employment Status by Age in Kingsbury
According to the labor force statistics for Kingsbury, out of the total population over 16 years of age (1,819), 55.0% or 1,000 individuals are in the labor force, with 1.3% or 13 of them unemployed. The age group with the highest labor force participation rate is 30 to 34 years, with 100.0% or 30 individuals in the labor force. Within the labor force, the 35 to 44 years age range has the highest percentage of unemployed individuals, with 5.8% or 13 of them being unemployed.
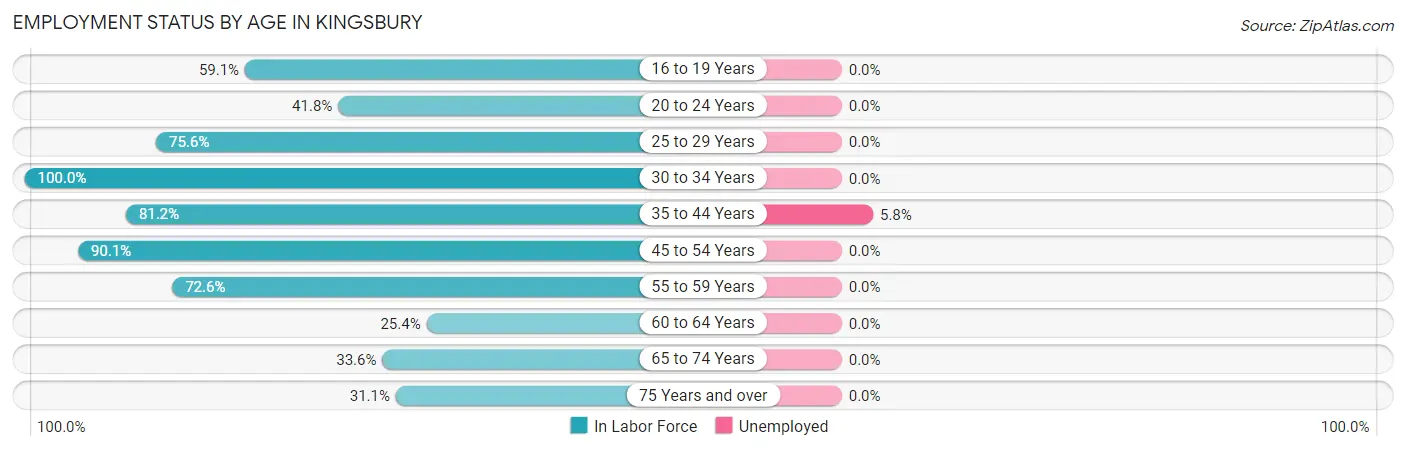
| Age Bracket | In Labor Force | Unemployed |
| 16 to 19 Years | 13 (59.1%) | 0 (0.0%) |
| 20 to 24 Years | 28 (41.8%) | 0 (0.0%) |
| 25 to 29 Years | 96 (75.6%) | 0 (0.0%) |
| 30 to 34 Years | 30 (100.0%) | 0 (0.0%) |
| 35 to 44 Years | 224 (81.2%) | 13 (5.8%) |
| 45 to 54 Years | 145 (90.1%) | 0 (0.0%) |
| 55 to 59 Years | 191 (72.6%) | 0 (0.0%) |
| 60 to 64 Years | 52 (25.4%) | 0 (0.0%) |
| 65 to 74 Years | 179 (33.6%) | 0 (0.0%) |
| 75 Years and over | 42 (31.1%) | 0 (0.0%) |
| Total | 1,000 (55.0%) | 13 (1.3%) |
Employment Status by Educational Attainment in Kingsbury
According to labor force statistics for Kingsbury, 69.5% of individuals (738) out of the total population between 25 and 64 years of age (1,062) are in the labor force, with 1.8% or 13 of them being unemployed. The group with the highest labor force participation rate are those with the educational attainment of less than high school, with 100.0% or 18 individuals in the labor force. Within the labor force, individuals with high school diploma education have the highest percentage of unemployment, with 16.0% or 13 of them being unemployed.
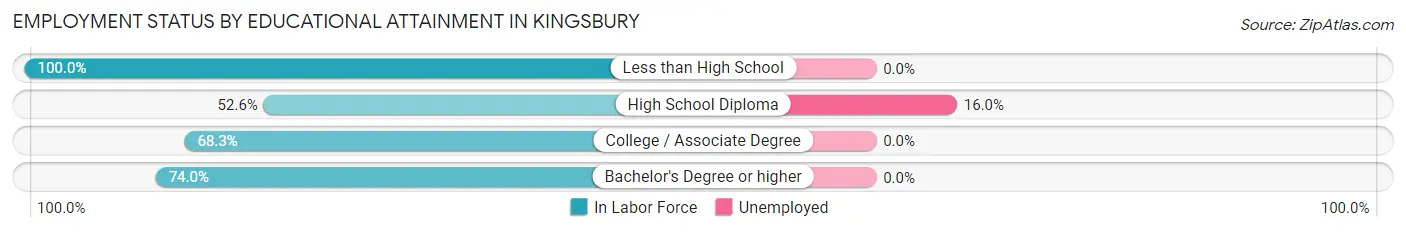
| Educational Attainment | In Labor Force | Unemployed |
| Less than High School | 18 (100.0%) | 0 (0.0%) |
| High School Diploma | 81 (52.6%) | 25 (16.0%) |
| College / Associate Degree | 235 (68.3%) | 0 (0.0%) |
| Bachelor's Degree or higher | 404 (74.0%) | 0 (0.0%) |
| Total | 738 (69.5%) | 19 (1.8%) |
Employment Occupations by Sex in Kingsbury
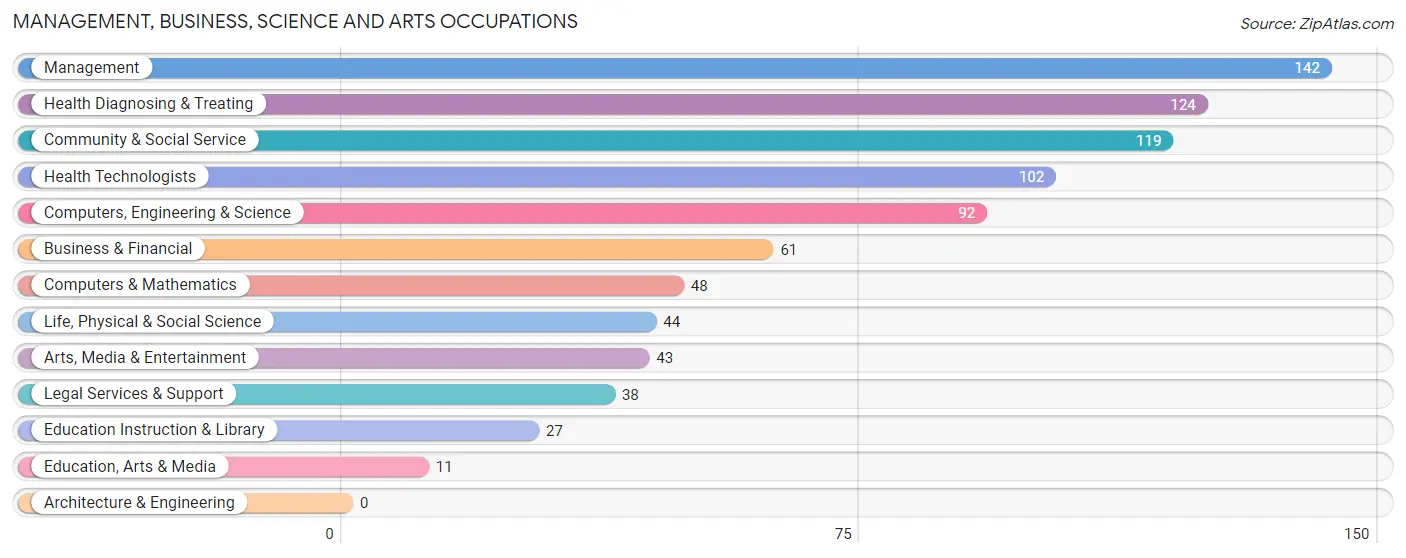
Management, Business, Science and Arts Occupations
The most common Management, Business, Science and Arts occupations in Kingsbury are Management (142 | 14.4%), Health Diagnosing & Treating (124 | 12.6%), Community & Social Service (119 | 12.1%), Health Technologists (102 | 10.3%), and Computers, Engineering & Science (92 | 9.3%).
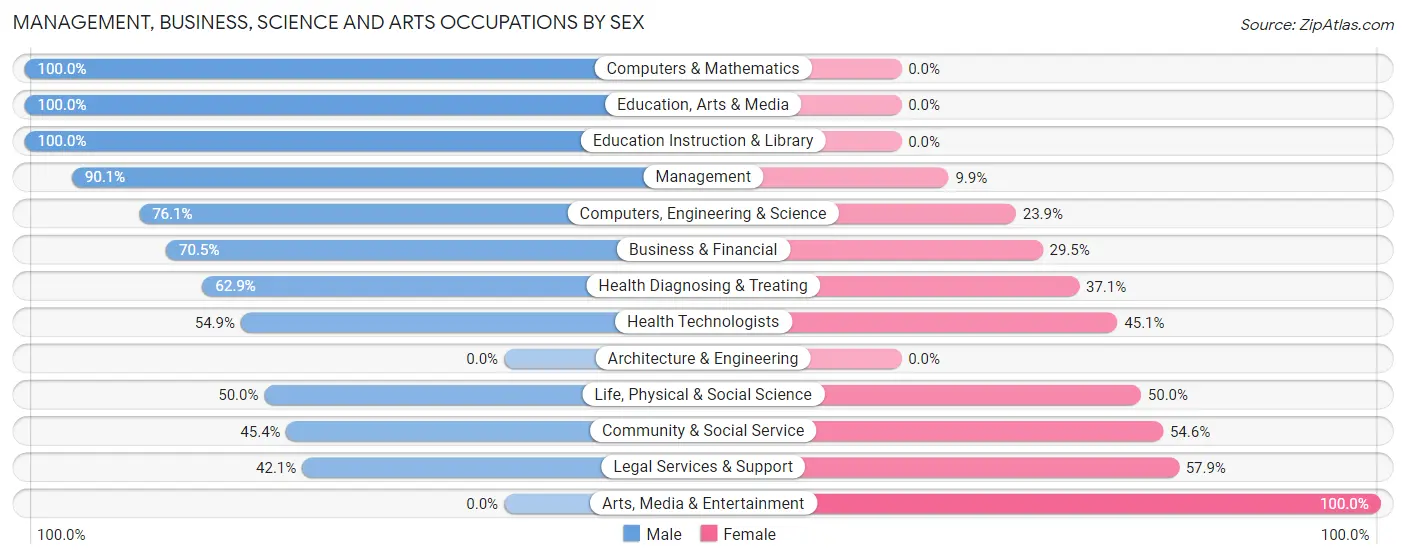
Management, Business, Science and Arts Occupations by Sex
Within the Management, Business, Science and Arts occupations in Kingsbury, the most male-oriented occupations are Computers & Mathematics (100.0%), Education, Arts & Media (100.0%), and Education Instruction & Library (100.0%), while the most female-oriented occupations are Arts, Media & Entertainment (100.0%), Legal Services & Support (57.9%), and Community & Social Service (54.6%).
| Occupation | Male | Female |
| Management | 128 (90.1%) | 14 (9.9%) |
| Business & Financial | 43 (70.5%) | 18 (29.5%) |
| Computers, Engineering & Science | 70 (76.1%) | 22 (23.9%) |
| Computers & Mathematics | 48 (100.0%) | 0 (0.0%) |
| Architecture & Engineering | 0 (0.0%) | 0 (0.0%) |
| Life, Physical & Social Science | 22 (50.0%) | 22 (50.0%) |
| Community & Social Service | 54 (45.4%) | 65 (54.6%) |
| Education, Arts & Media | 11 (100.0%) | 0 (0.0%) |
| Legal Services & Support | 16 (42.1%) | 22 (57.9%) |
| Education Instruction & Library | 27 (100.0%) | 0 (0.0%) |
| Arts, Media & Entertainment | 0 (0.0%) | 43 (100.0%) |
| Health Diagnosing & Treating | 78 (62.9%) | 46 (37.1%) |
| Health Technologists | 56 (54.9%) | 46 (45.1%) |
| Total (Category) | 373 (69.3%) | 165 (30.7%) |
| Total (Overall) | 599 (60.7%) | 388 (39.3%) |
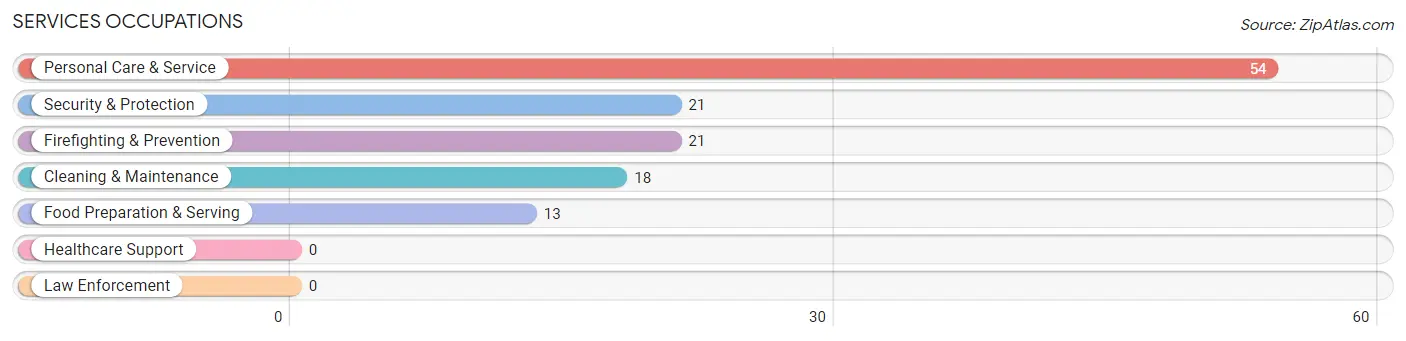
Services Occupations
The most common Services occupations in Kingsbury are Personal Care & Service (54 | 5.5%), Security & Protection (21 | 2.1%), Firefighting & Prevention (21 | 2.1%), Cleaning & Maintenance (18 | 1.8%), and Food Preparation & Serving (13 | 1.3%).
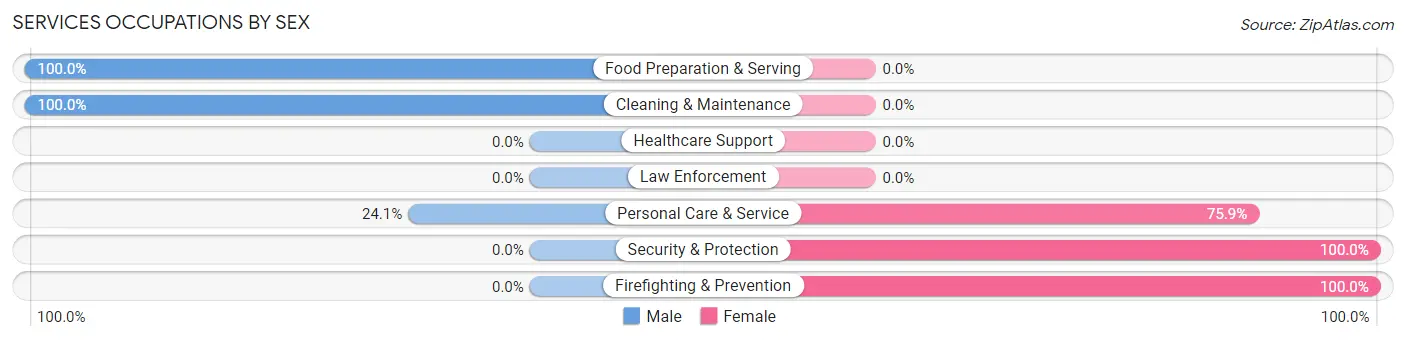
Services Occupations by Sex
Within the Services occupations in Kingsbury, the most male-oriented occupations are Food Preparation & Serving (100.0%), Cleaning & Maintenance (100.0%), and Personal Care & Service (24.1%), while the most female-oriented occupations are Security & Protection (100.0%), Firefighting & Prevention (100.0%), and Personal Care & Service (75.9%).
| Occupation | Male | Female |
| Healthcare Support | 0 (0.0%) | 0 (0.0%) |
| Security & Protection | 0 (0.0%) | 21 (100.0%) |
| Firefighting & Prevention | 0 (0.0%) | 21 (100.0%) |
| Law Enforcement | 0 (0.0%) | 0 (0.0%) |
| Food Preparation & Serving | 13 (100.0%) | 0 (0.0%) |
| Cleaning & Maintenance | 18 (100.0%) | 0 (0.0%) |
| Personal Care & Service | 13 (24.1%) | 41 (75.9%) |
| Total (Category) | 44 (41.5%) | 62 (58.5%) |
| Total (Overall) | 599 (60.7%) | 388 (39.3%) |
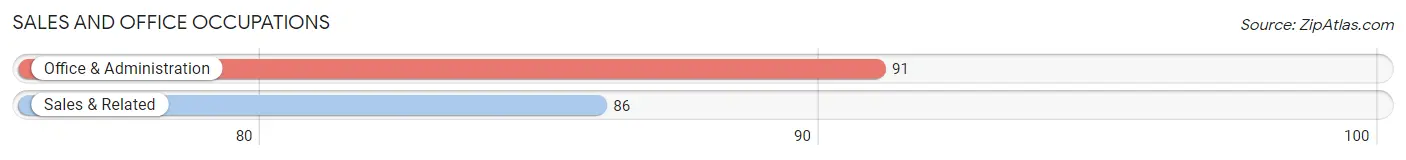
Sales and Office Occupations
The most common Sales and Office occupations in Kingsbury are Office & Administration (91 | 9.2%), and Sales & Related (86 | 8.7%).
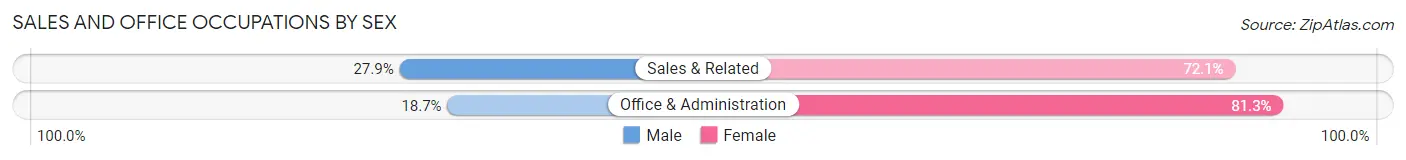
Sales and Office Occupations by Sex
| Occupation | Male | Female |
| Sales & Related | 24 (27.9%) | 62 (72.1%) |
| Office & Administration | 17 (18.7%) | 74 (81.3%) |
| Total (Category) | 41 (23.2%) | 136 (76.8%) |
| Total (Overall) | 599 (60.7%) | 388 (39.3%) |
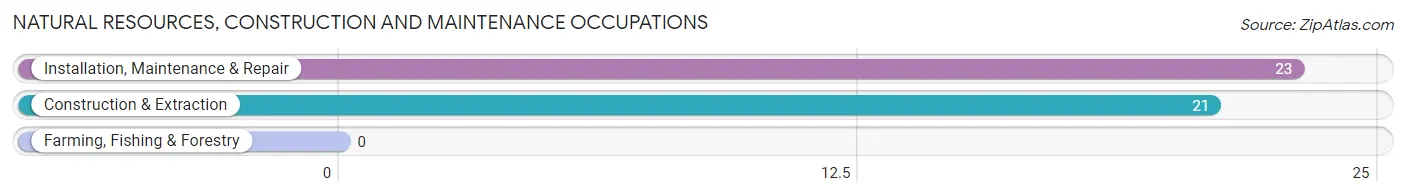
Natural Resources, Construction and Maintenance Occupations
The most common Natural Resources, Construction and Maintenance occupations in Kingsbury are Installation, Maintenance & Repair (23 | 2.3%), and Construction & Extraction (21 | 2.1%).
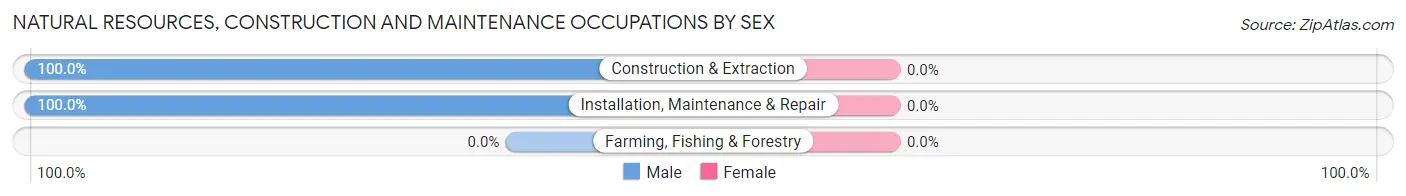
Natural Resources, Construction and Maintenance Occupations by Sex
| Occupation | Male | Female |
| Farming, Fishing & Forestry | 0 (0.0%) | 0 (0.0%) |
| Construction & Extraction | 21 (100.0%) | 0 (0.0%) |
| Installation, Maintenance & Repair | 23 (100.0%) | 0 (0.0%) |
| Total (Category) | 44 (100.0%) | 0 (0.0%) |
| Total (Overall) | 599 (60.7%) | 388 (39.3%) |
Production, Transportation and Moving Occupations
The most common Production, Transportation and Moving occupations in Kingsbury are Production (69 | 7.0%), and Transportation (53 | 5.4%).
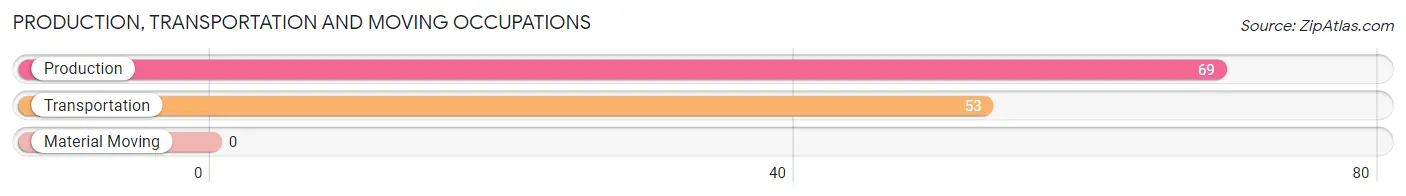
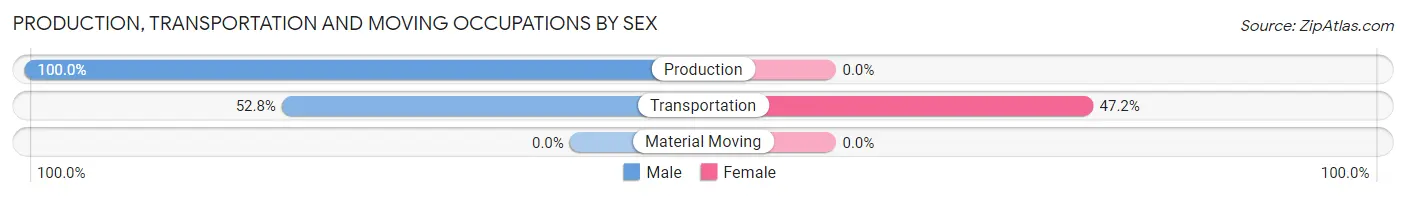
Production, Transportation and Moving Occupations by Sex
| Occupation | Male | Female |
| Production | 69 (100.0%) | 0 (0.0%) |
| Transportation | 28 (52.8%) | 25 (47.2%) |
| Material Moving | 0 (0.0%) | 0 (0.0%) |
| Total (Category) | 97 (79.5%) | 25 (20.5%) |
| Total (Overall) | 599 (60.7%) | 388 (39.3%) |
Employment Industries by Sex in Kingsbury
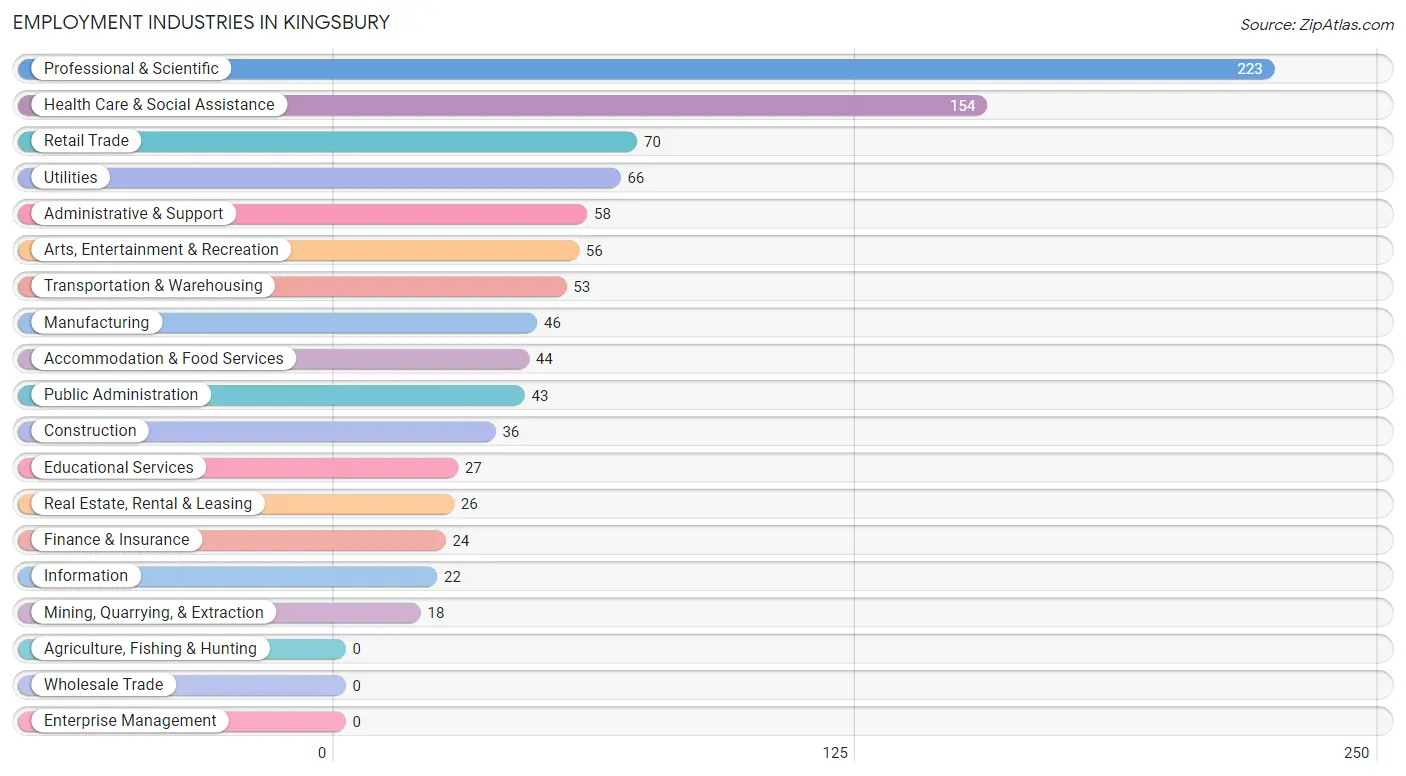
Employment Industries in Kingsbury
The major employment industries in Kingsbury include Professional & Scientific (223 | 22.6%), Health Care & Social Assistance (154 | 15.6%), Retail Trade (70 | 7.1%), Utilities (66 | 6.7%), and Administrative & Support (58 | 5.9%).
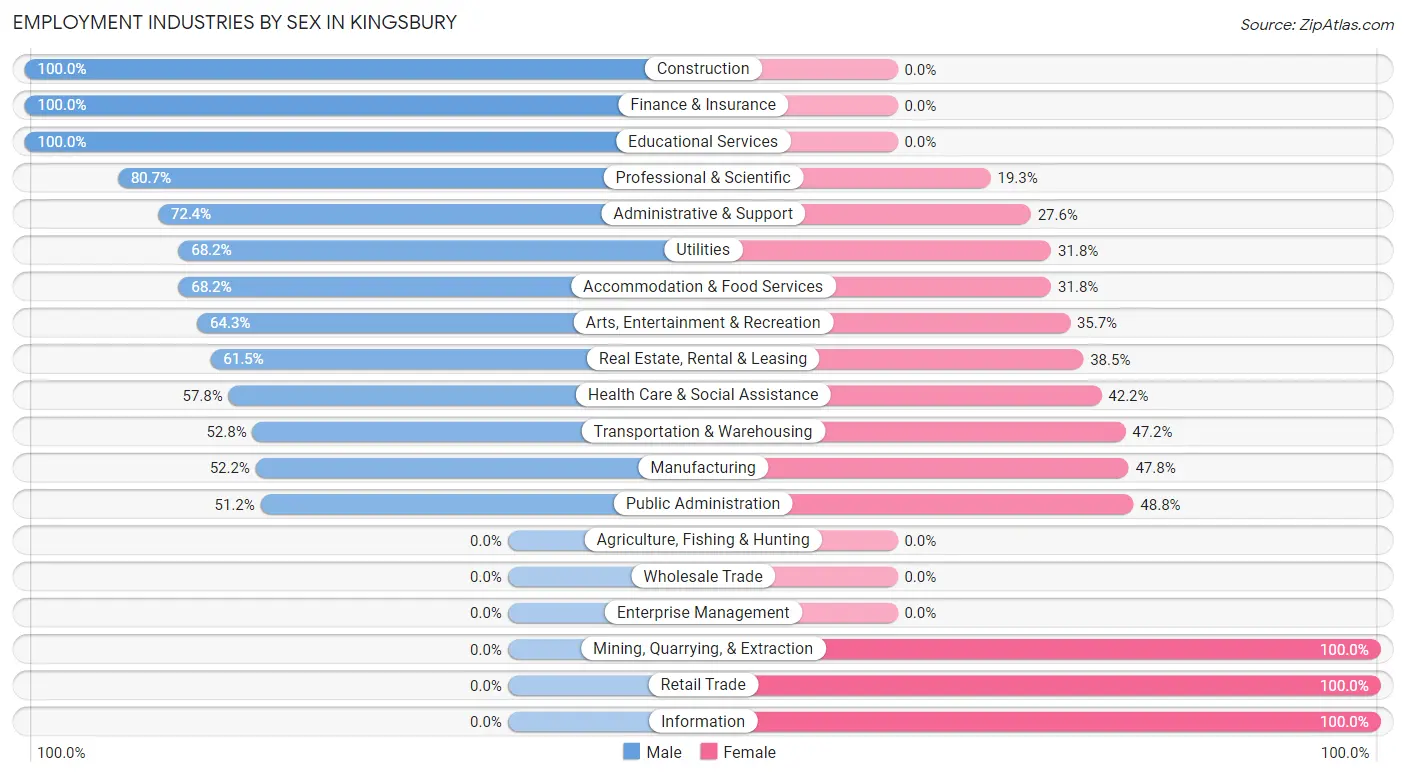
Employment Industries by Sex in Kingsbury
The Kingsbury industries that see more men than women are Construction (100.0%), Finance & Insurance (100.0%), and Educational Services (100.0%), whereas the industries that tend to have a higher number of women are Mining, Quarrying, & Extraction (100.0%), Retail Trade (100.0%), and Information (100.0%).
| Industry | Male | Female |
| Agriculture, Fishing & Hunting | 0 (0.0%) | 0 (0.0%) |
| Mining, Quarrying, & Extraction | 0 (0.0%) | 18 (100.0%) |
| Construction | 36 (100.0%) | 0 (0.0%) |
| Manufacturing | 24 (52.2%) | 22 (47.8%) |
| Wholesale Trade | 0 (0.0%) | 0 (0.0%) |
| Retail Trade | 0 (0.0%) | 70 (100.0%) |
| Transportation & Warehousing | 28 (52.8%) | 25 (47.2%) |
| Utilities | 45 (68.2%) | 21 (31.8%) |
| Information | 0 (0.0%) | 22 (100.0%) |
| Finance & Insurance | 24 (100.0%) | 0 (0.0%) |
| Real Estate, Rental & Leasing | 16 (61.5%) | 10 (38.5%) |
| Professional & Scientific | 180 (80.7%) | 43 (19.3%) |
| Enterprise Management | 0 (0.0%) | 0 (0.0%) |
| Administrative & Support | 42 (72.4%) | 16 (27.6%) |
| Educational Services | 27 (100.0%) | 0 (0.0%) |
| Health Care & Social Assistance | 89 (57.8%) | 65 (42.2%) |
| Arts, Entertainment & Recreation | 36 (64.3%) | 20 (35.7%) |
| Accommodation & Food Services | 30 (68.2%) | 14 (31.8%) |
| Public Administration | 22 (51.2%) | 21 (48.8%) |
| Total | 599 (60.7%) | 388 (39.3%) |
Education in Kingsbury
School Enrollment in Kingsbury
The most common levels of schooling among the 184 students in Kingsbury are college / undergraduate (77 | 41.8%), elementary school (46 | 25.0%), and high school (22 | 12.0%).
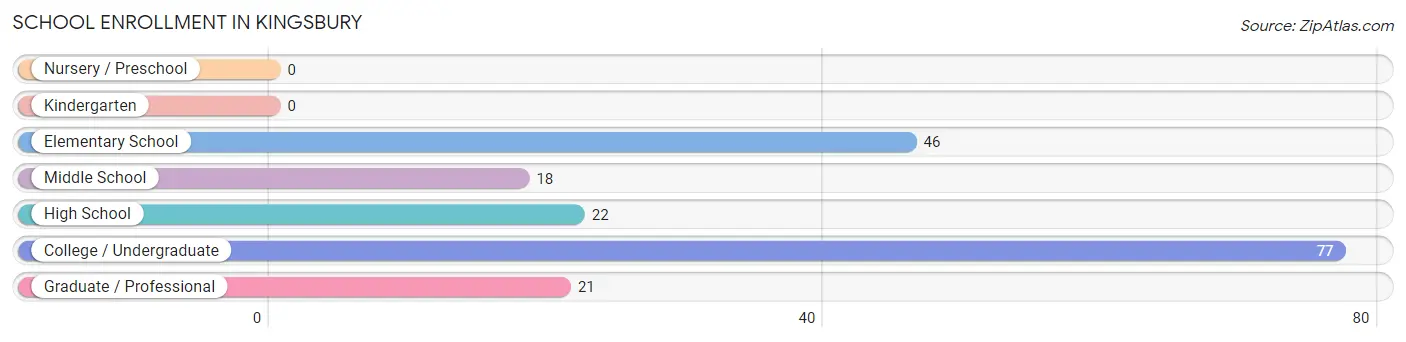
| School Level | # Students | % Students |
| Nursery / Preschool | 0 | 0.0% |
| Kindergarten | 0 | 0.0% |
| Elementary School | 46 | 25.0% |
| Middle School | 18 | 9.8% |
| High School | 22 | 12.0% |
| College / Undergraduate | 77 | 41.8% |
| Graduate / Professional | 21 | 11.4% |
| Total | 184 | 100.0% |
School Enrollment by Age by Funding Source in Kingsbury
Out of a total of 184 students who are enrolled in schools in Kingsbury, 101 (54.9%) attend a private institution, while the remaining 83 (45.1%) are enrolled in public schools. The age group of 5 to 9 year old has the highest likelihood of being enrolled in private schools, with 23 (100.0% in the age bracket) enrolled. Conversely, the age group of 15 to 17 year olds has the lowest likelihood of being enrolled in a private school, with 22 (100.0% in the age bracket) attending a public institution.
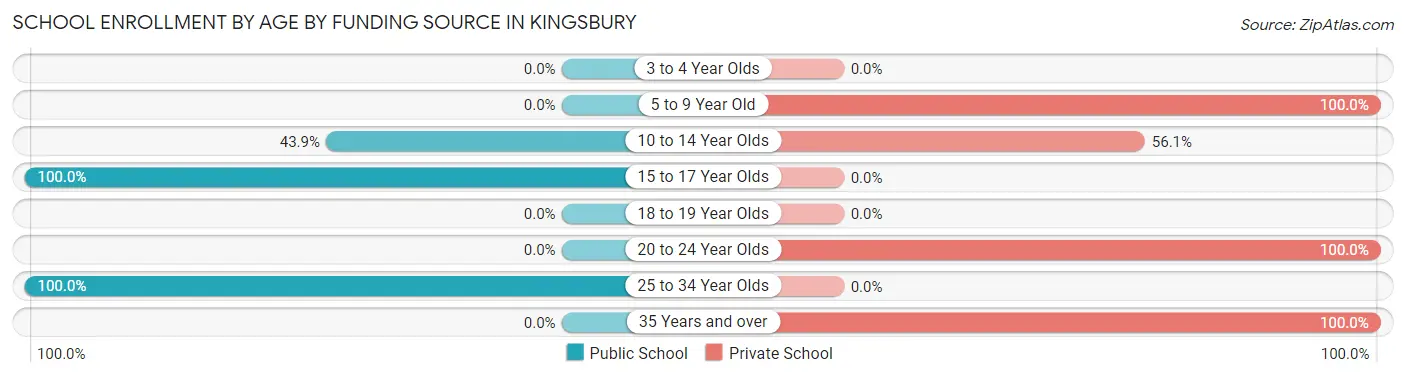
| Age Bracket | Public School | Private School |
| 3 to 4 Year Olds | 0 (0.0%) | 0 (0.0%) |
| 5 to 9 Year Old | 0 (0.0%) | 23 (100.0%) |
| 10 to 14 Year Olds | 18 (43.9%) | 23 (56.1%) |
| 15 to 17 Year Olds | 22 (100.0%) | 0 (0.0%) |
| 18 to 19 Year Olds | 0 (0.0%) | 0 (0.0%) |
| 20 to 24 Year Olds | 0 (0.0%) | 39 (100.0%) |
| 25 to 34 Year Olds | 43 (100.0%) | 0 (0.0%) |
| 35 Years and over | 0 (0.0%) | 16 (100.0%) |
| Total | 83 (45.1%) | 101 (54.9%) |
Educational Attainment by Field of Study in Kingsbury
Engineering (155 | 15.5%), physical & health sciences (126 | 12.6%), business (122 | 12.2%), bio, nature & agricultural (109 | 10.9%), and liberal arts & history (105 | 10.5%) are the most common fields of study among 997 individuals in Kingsbury who have obtained a bachelor's degree or higher.
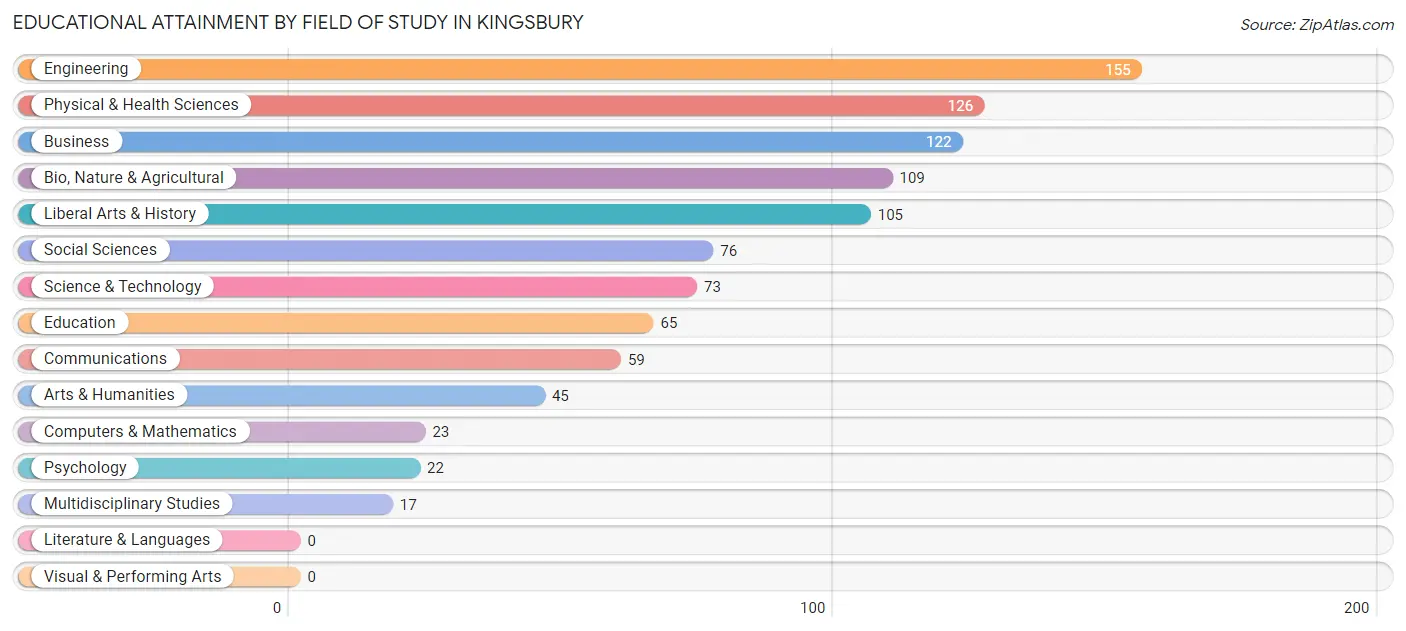
| Field of Study | # Graduates | % Graduates |
| Computers & Mathematics | 23 | 2.3% |
| Bio, Nature & Agricultural | 109 | 10.9% |
| Physical & Health Sciences | 126 | 12.6% |
| Psychology | 22 | 2.2% |
| Social Sciences | 76 | 7.6% |
| Engineering | 155 | 15.5% |
| Multidisciplinary Studies | 17 | 1.7% |
| Science & Technology | 73 | 7.3% |
| Business | 122 | 12.2% |
| Education | 65 | 6.5% |
| Literature & Languages | 0 | 0.0% |
| Liberal Arts & History | 105 | 10.5% |
| Visual & Performing Arts | 0 | 0.0% |
| Communications | 59 | 5.9% |
| Arts & Humanities | 45 | 4.5% |
| Total | 997 | 100.0% |
Transportation & Commute in Kingsbury
Vehicle Availability by Sex in Kingsbury
The most prevalent vehicle ownership categories in Kingsbury are males with 1 vehicle (203, accounting for 33.9%) and females with 1 vehicle (41, making up 55.9%).
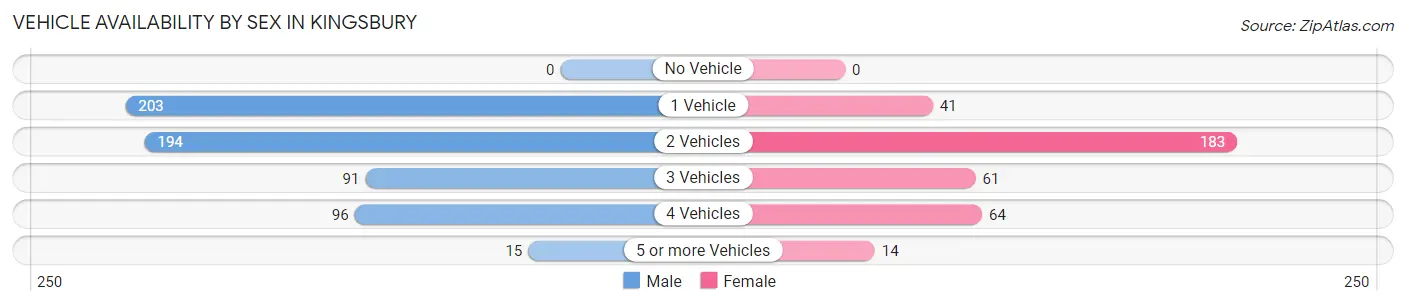
| Vehicles Available | Male | Female |
| No Vehicle | 0 (0.0%) | 0 (0.0%) |
| 1 Vehicle | 203 (33.9%) | 41 (11.3%) |
| 2 Vehicles | 194 (32.4%) | 183 (50.4%) |
| 3 Vehicles | 91 (15.2%) | 61 (16.8%) |
| 4 Vehicles | 96 (16.0%) | 64 (17.6%) |
| 5 or more Vehicles | 15 (2.5%) | 14 (3.9%) |
| Total | 599 (100.0%) | 363 (100.0%) |
Commute Time in Kingsbury
The most frequently occuring commute durations in Kingsbury are less than 5 minutes (149 commuters, 20.6%), 15 to 19 minutes (137 commuters, 19.0%), and 5 to 9 minutes (131 commuters, 18.1%).
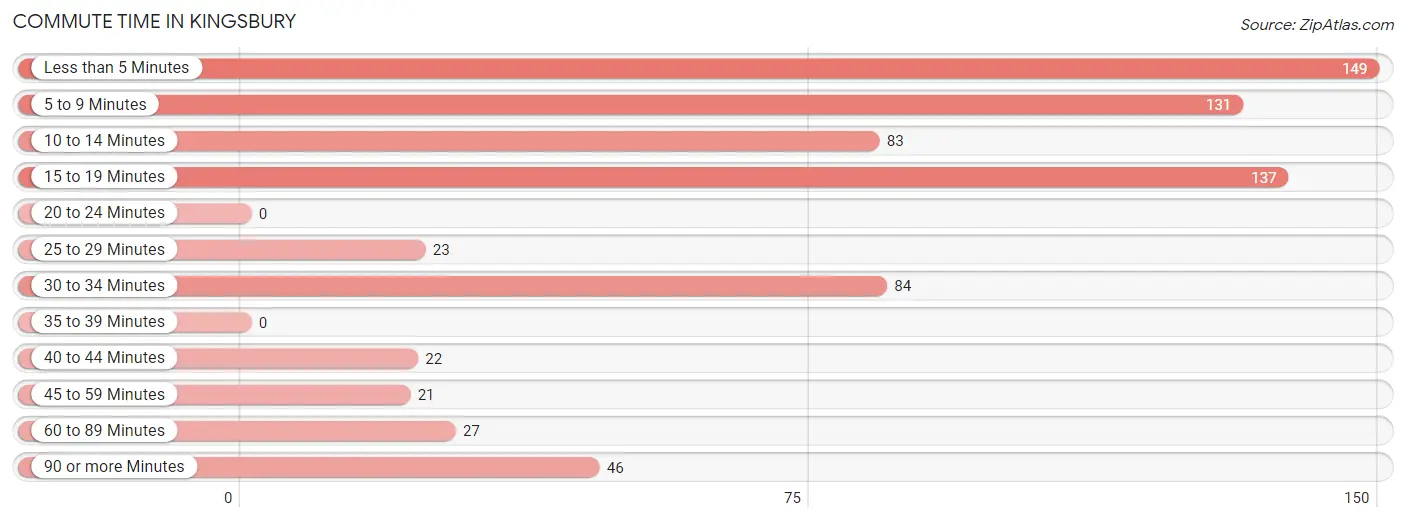
| Commute Time | # Commuters | % Commuters |
| Less than 5 Minutes | 149 | 20.6% |
| 5 to 9 Minutes | 131 | 18.1% |
| 10 to 14 Minutes | 83 | 11.5% |
| 15 to 19 Minutes | 137 | 19.0% |
| 20 to 24 Minutes | 0 | 0.0% |
| 25 to 29 Minutes | 23 | 3.2% |
| 30 to 34 Minutes | 84 | 11.6% |
| 35 to 39 Minutes | 0 | 0.0% |
| 40 to 44 Minutes | 22 | 3.0% |
| 45 to 59 Minutes | 21 | 2.9% |
| 60 to 89 Minutes | 27 | 3.7% |
| 90 or more Minutes | 46 | 6.4% |
Commute Time by Sex in Kingsbury
The most common commute times in Kingsbury are 15 to 19 minutes (115 commuters, 27.5%) for males and 5 to 9 minutes (92 commuters, 30.2%) for females.
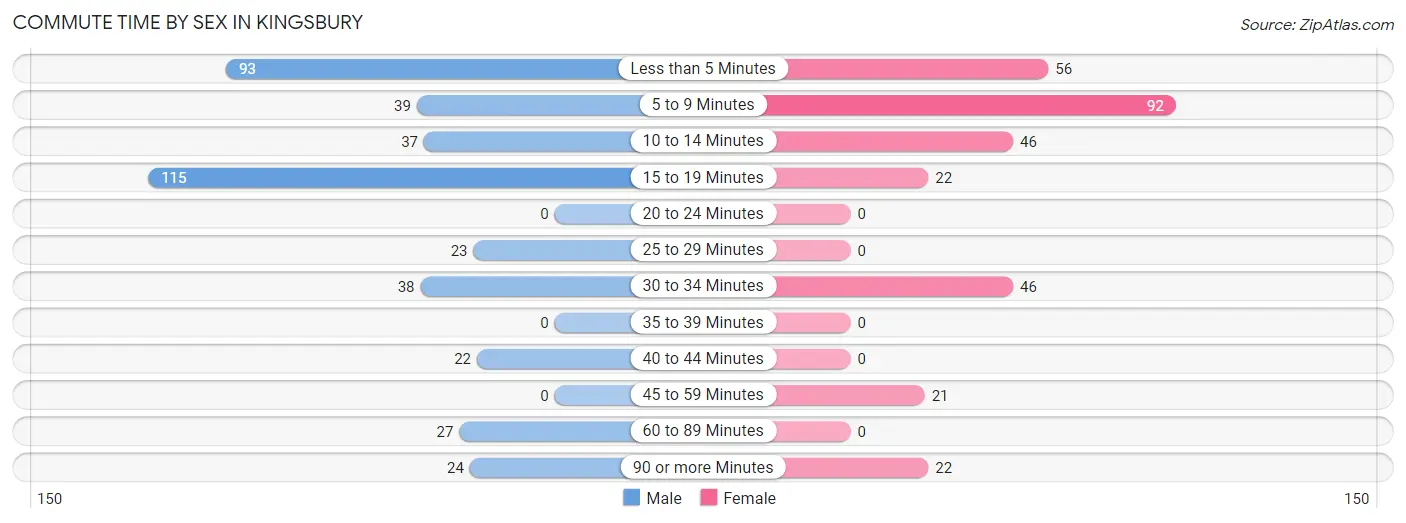
| Commute Time | Male | Female |
| Less than 5 Minutes | 93 (22.3%) | 56 (18.4%) |
| 5 to 9 Minutes | 39 (9.3%) | 92 (30.2%) |
| 10 to 14 Minutes | 37 (8.8%) | 46 (15.1%) |
| 15 to 19 Minutes | 115 (27.5%) | 22 (7.2%) |
| 20 to 24 Minutes | 0 (0.0%) | 0 (0.0%) |
| 25 to 29 Minutes | 23 (5.5%) | 0 (0.0%) |
| 30 to 34 Minutes | 38 (9.1%) | 46 (15.1%) |
| 35 to 39 Minutes | 0 (0.0%) | 0 (0.0%) |
| 40 to 44 Minutes | 22 (5.3%) | 0 (0.0%) |
| 45 to 59 Minutes | 0 (0.0%) | 21 (6.9%) |
| 60 to 89 Minutes | 27 (6.5%) | 0 (0.0%) |
| 90 or more Minutes | 24 (5.7%) | 22 (7.2%) |
Time of Departure to Work by Sex in Kingsbury
The most frequent times of departure to work in Kingsbury are 6:30 AM to 6:59 AM (93, 22.3%) for males and 7:30 AM to 7:59 AM (111, 36.4%) for females.
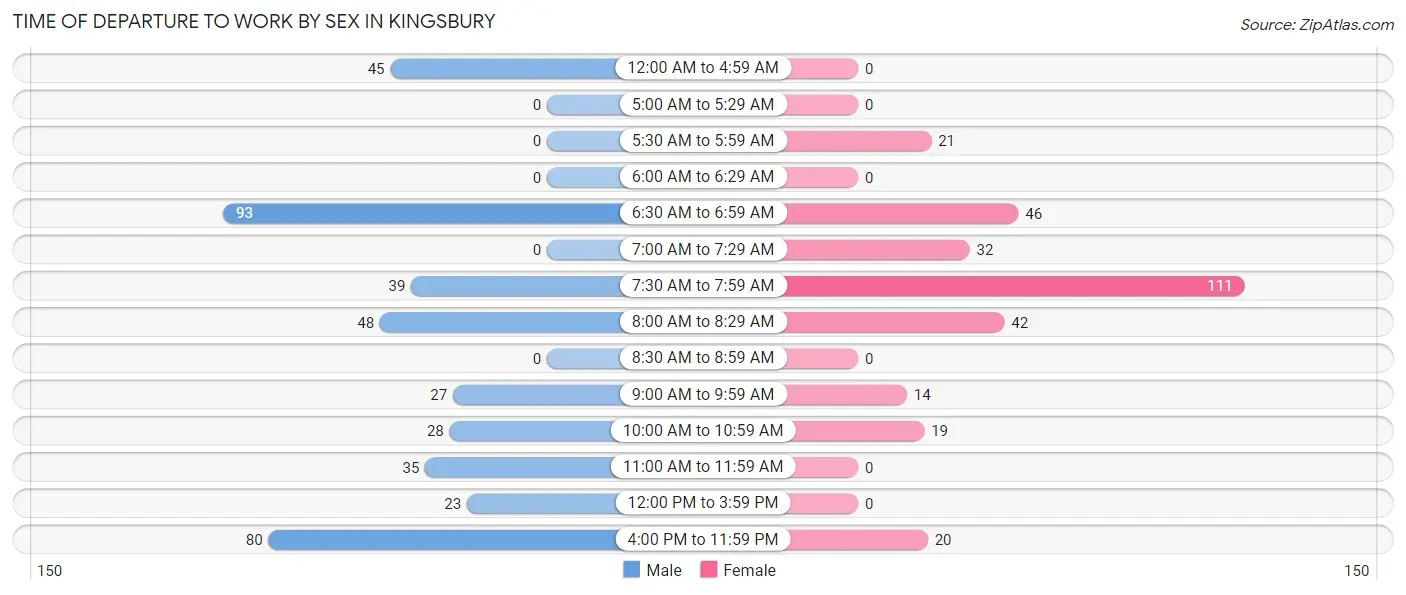
| Time of Departure | Male | Female |
| 12:00 AM to 4:59 AM | 45 (10.8%) | 0 (0.0%) |
| 5:00 AM to 5:29 AM | 0 (0.0%) | 0 (0.0%) |
| 5:30 AM to 5:59 AM | 0 (0.0%) | 21 (6.9%) |
| 6:00 AM to 6:29 AM | 0 (0.0%) | 0 (0.0%) |
| 6:30 AM to 6:59 AM | 93 (22.3%) | 46 (15.1%) |
| 7:00 AM to 7:29 AM | 0 (0.0%) | 32 (10.5%) |
| 7:30 AM to 7:59 AM | 39 (9.3%) | 111 (36.4%) |
| 8:00 AM to 8:29 AM | 48 (11.5%) | 42 (13.8%) |
| 8:30 AM to 8:59 AM | 0 (0.0%) | 0 (0.0%) |
| 9:00 AM to 9:59 AM | 27 (6.5%) | 14 (4.6%) |
| 10:00 AM to 10:59 AM | 28 (6.7%) | 19 (6.2%) |
| 11:00 AM to 11:59 AM | 35 (8.4%) | 0 (0.0%) |
| 12:00 PM to 3:59 PM | 23 (5.5%) | 0 (0.0%) |
| 4:00 PM to 11:59 PM | 80 (19.1%) | 20 (6.6%) |
| Total | 418 (100.0%) | 305 (100.0%) |
Housing Occupancy in Kingsbury
Occupancy by Ownership in Kingsbury
Of the total 1,059 dwellings in Kingsbury, owner-occupied units account for 802 (75.7%), while renter-occupied units make up 257 (24.3%).
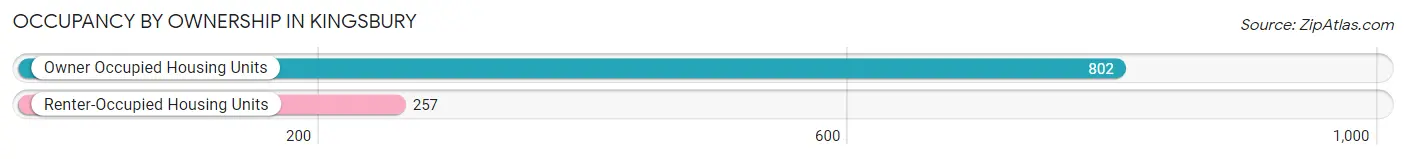
| Occupancy | # Housing Units | % Housing Units |
| Owner Occupied Housing Units | 802 | 75.7% |
| Renter-Occupied Housing Units | 257 | 24.3% |
| Total Occupied Housing Units | 1,059 | 100.0% |
Occupancy by Household Size in Kingsbury
| Household Size | # Housing Units | % Housing Units |
| 1-Person Household | 365 | 34.5% |
| 2-Person Household | 554 | 52.3% |
| 3-Person Household | 118 | 11.1% |
| 4+ Person Household | 22 | 2.1% |
| Total Housing Units | 1,059 | 100.0% |
Occupancy by Ownership by Household Size in Kingsbury
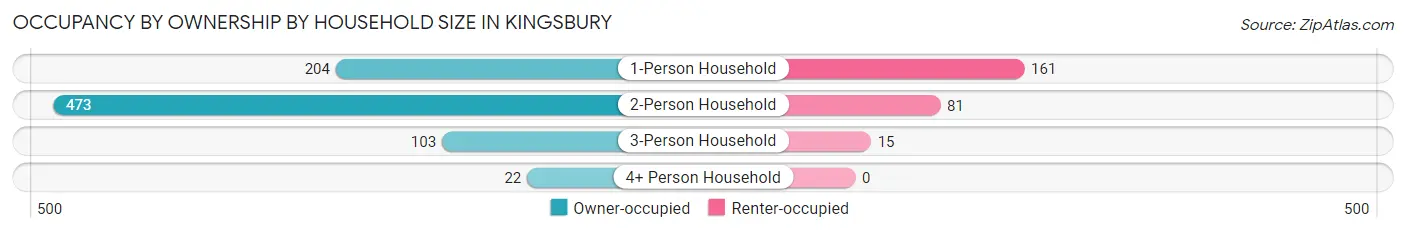
| Household Size | Owner-occupied | Renter-occupied |
| 1-Person Household | 204 (55.9%) | 161 (44.1%) |
| 2-Person Household | 473 (85.4%) | 81 (14.6%) |
| 3-Person Household | 103 (87.3%) | 15 (12.7%) |
| 4+ Person Household | 22 (100.0%) | 0 (0.0%) |
| Total Housing Units | 802 (75.7%) | 257 (24.3%) |
Occupancy by Educational Attainment in Kingsbury
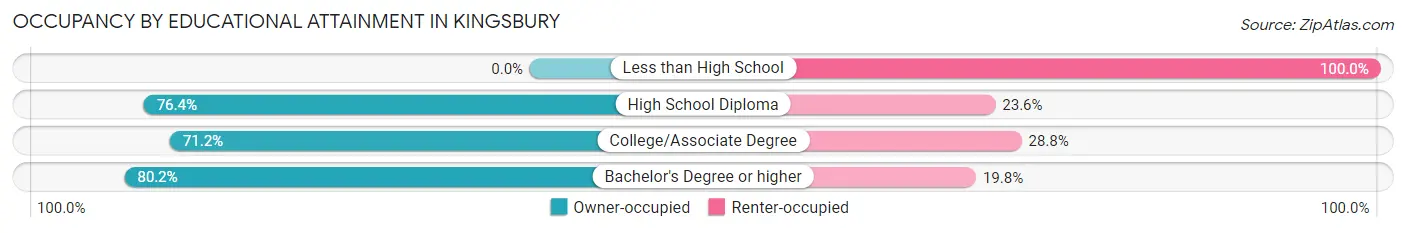
| Household Size | Owner-occupied | Renter-occupied |
| Less than High School | 0 (0.0%) | 18 (100.0%) |
| High School Diploma | 139 (76.4%) | 43 (23.6%) |
| College/Associate Degree | 205 (71.2%) | 83 (28.8%) |
| Bachelor's Degree or higher | 458 (80.2%) | 113 (19.8%) |
Occupancy by Age of Householder in Kingsbury
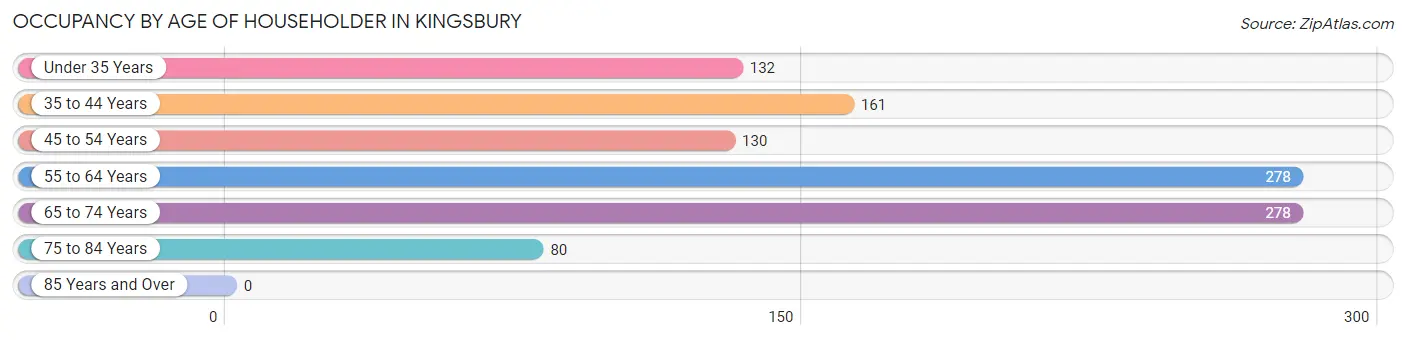
| Age Bracket | # Households | % Households |
| Under 35 Years | 132 | 12.5% |
| 35 to 44 Years | 161 | 15.2% |
| 45 to 54 Years | 130 | 12.3% |
| 55 to 64 Years | 278 | 26.3% |
| 65 to 74 Years | 278 | 26.3% |
| 75 to 84 Years | 80 | 7.5% |
| 85 Years and Over | 0 | 0.0% |
| Total | 1,059 | 100.0% |
Housing Finances in Kingsbury
Median Income by Occupancy in Kingsbury
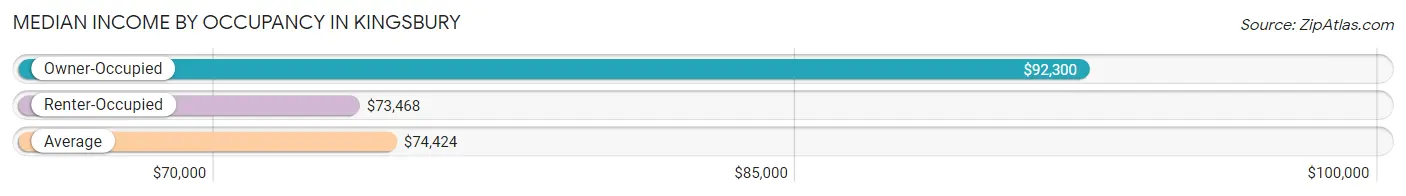
| Occupancy Type | # Households | Median Income |
| Owner-Occupied | 802 (75.7%) | $92,300 |
| Renter-Occupied | 257 (24.3%) | $73,468 |
| Average | 1,059 (100.0%) | $74,424 |
Occupancy by Householder Income Bracket in Kingsbury
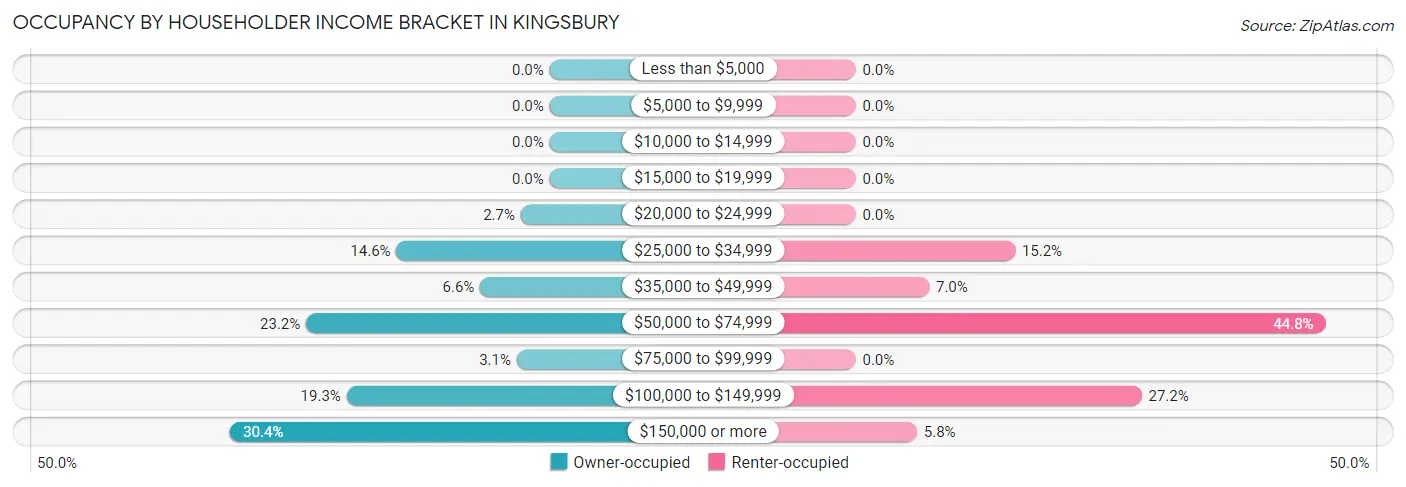
| Income Bracket | Owner-occupied | Renter-occupied |
| Less than $5,000 | 0 (0.0%) | 0 (0.0%) |
| $5,000 to $9,999 | 0 (0.0%) | 0 (0.0%) |
| $10,000 to $14,999 | 0 (0.0%) | 0 (0.0%) |
| $15,000 to $19,999 | 0 (0.0%) | 0 (0.0%) |
| $20,000 to $24,999 | 22 (2.7%) | 0 (0.0%) |
| $25,000 to $34,999 | 117 (14.6%) | 39 (15.2%) |
| $35,000 to $49,999 | 53 (6.6%) | 18 (7.0%) |
| $50,000 to $74,999 | 186 (23.2%) | 115 (44.8%) |
| $75,000 to $99,999 | 25 (3.1%) | 0 (0.0%) |
| $100,000 to $149,999 | 155 (19.3%) | 70 (27.2%) |
| $150,000 or more | 244 (30.4%) | 15 (5.8%) |
| Total | 802 (100.0%) | 257 (100.0%) |
Monthly Housing Cost Tiers in Kingsbury
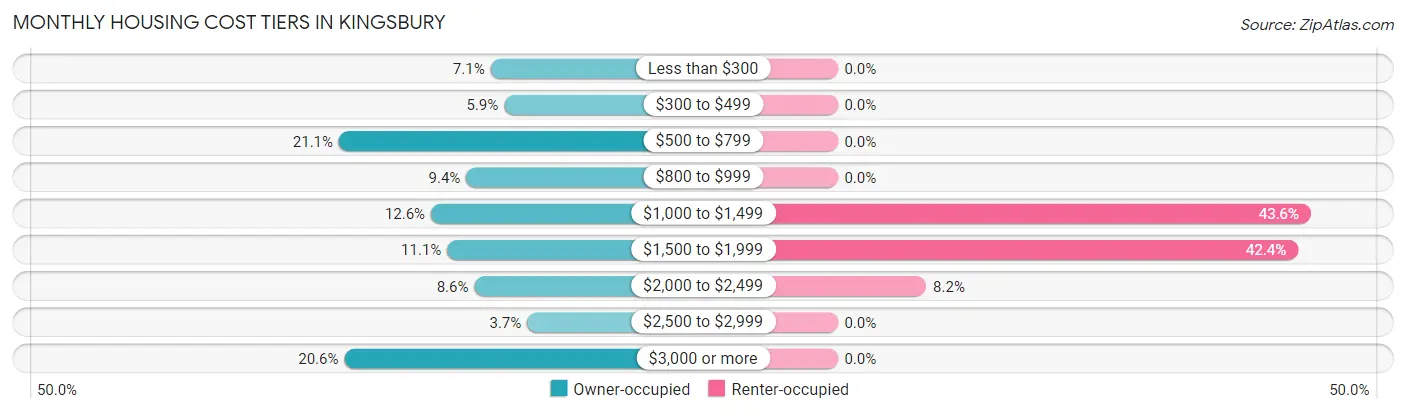
| Monthly Cost | Owner-occupied | Renter-occupied |
| Less than $300 | 57 (7.1%) | 0 (0.0%) |
| $300 to $499 | 47 (5.9%) | 0 (0.0%) |
| $500 to $799 | 169 (21.1%) | 0 (0.0%) |
| $800 to $999 | 75 (9.3%) | 0 (0.0%) |
| $1,000 to $1,499 | 101 (12.6%) | 112 (43.6%) |
| $1,500 to $1,999 | 89 (11.1%) | 109 (42.4%) |
| $2,000 to $2,499 | 69 (8.6%) | 21 (8.2%) |
| $2,500 to $2,999 | 30 (3.7%) | 0 (0.0%) |
| $3,000 or more | 165 (20.6%) | 0 (0.0%) |
| Total | 802 (100.0%) | 257 (100.0%) |
Physical Housing Characteristics in Kingsbury
Housing Structures in Kingsbury
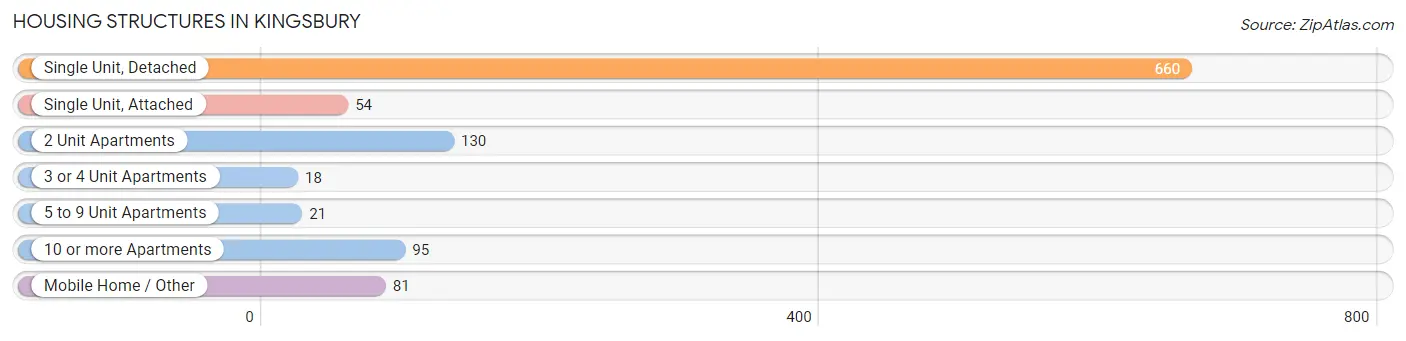
| Structure Type | # Housing Units | % Housing Units |
| Single Unit, Detached | 660 | 62.3% |
| Single Unit, Attached | 54 | 5.1% |
| 2 Unit Apartments | 130 | 12.3% |
| 3 or 4 Unit Apartments | 18 | 1.7% |
| 5 to 9 Unit Apartments | 21 | 2.0% |
| 10 or more Apartments | 95 | 9.0% |
| Mobile Home / Other | 81 | 7.6% |
| Total | 1,059 | 100.0% |
Housing Structures by Occupancy in Kingsbury
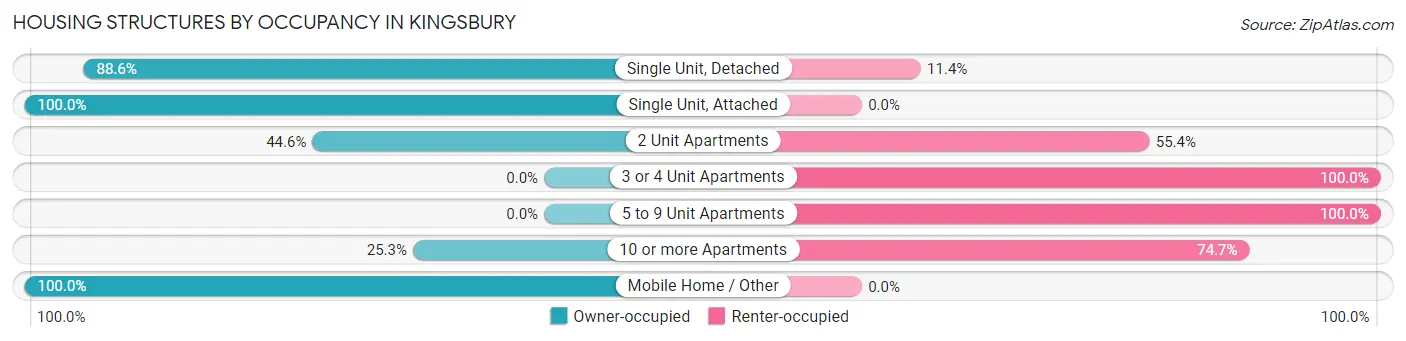
| Structure Type | Owner-occupied | Renter-occupied |
| Single Unit, Detached | 585 (88.6%) | 75 (11.4%) |
| Single Unit, Attached | 54 (100.0%) | 0 (0.0%) |
| 2 Unit Apartments | 58 (44.6%) | 72 (55.4%) |
| 3 or 4 Unit Apartments | 0 (0.0%) | 18 (100.0%) |
| 5 to 9 Unit Apartments | 0 (0.0%) | 21 (100.0%) |
| 10 or more Apartments | 24 (25.3%) | 71 (74.7%) |
| Mobile Home / Other | 81 (100.0%) | 0 (0.0%) |
| Total | 802 (75.7%) | 257 (24.3%) |
Housing Structures by Number of Rooms in Kingsbury
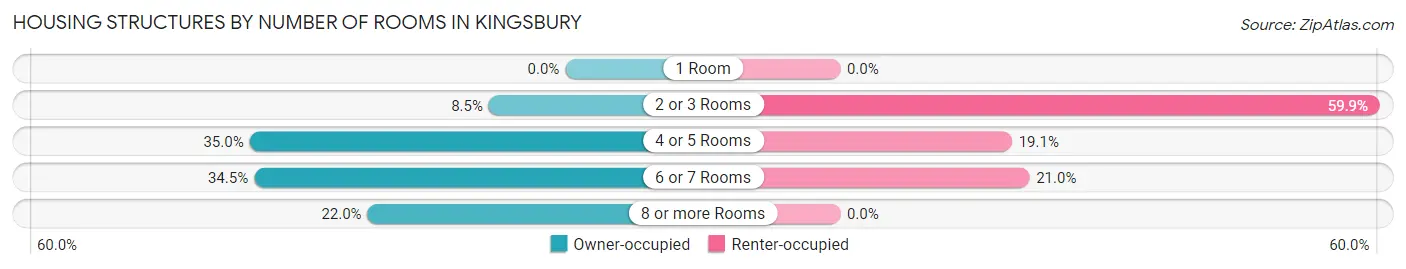
| Number of Rooms | Owner-occupied | Renter-occupied |
| 1 Room | 0 (0.0%) | 0 (0.0%) |
| 2 or 3 Rooms | 68 (8.5%) | 154 (59.9%) |
| 4 or 5 Rooms | 281 (35.0%) | 49 (19.1%) |
| 6 or 7 Rooms | 277 (34.5%) | 54 (21.0%) |
| 8 or more Rooms | 176 (22.0%) | 0 (0.0%) |
| Total | 802 (100.0%) | 257 (100.0%) |
Housing Structure by Heating Type in Kingsbury
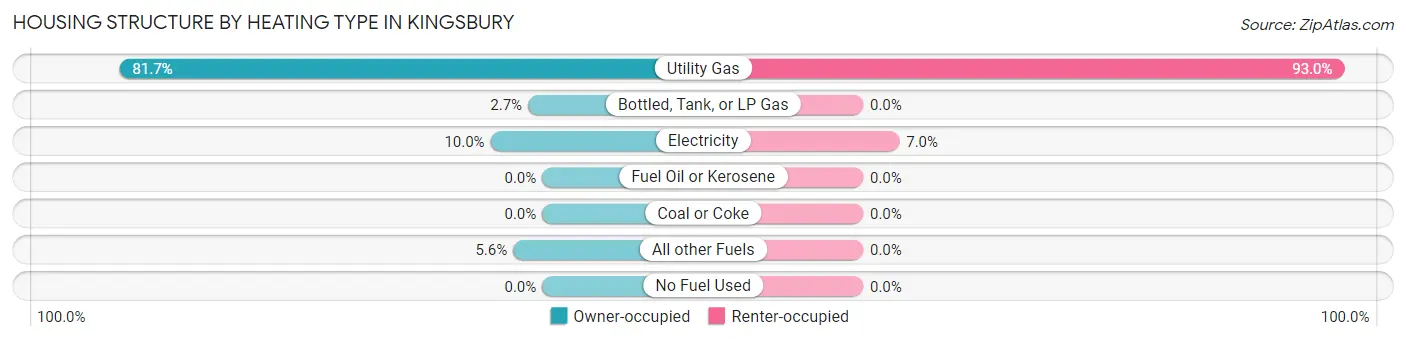
| Heating Type | Owner-occupied | Renter-occupied |
| Utility Gas | 655 (81.7%) | 239 (93.0%) |
| Bottled, Tank, or LP Gas | 22 (2.7%) | 0 (0.0%) |
| Electricity | 80 (10.0%) | 18 (7.0%) |
| Fuel Oil or Kerosene | 0 (0.0%) | 0 (0.0%) |
| Coal or Coke | 0 (0.0%) | 0 (0.0%) |
| All other Fuels | 45 (5.6%) | 0 (0.0%) |
| No Fuel Used | 0 (0.0%) | 0 (0.0%) |
| Total | 802 (100.0%) | 257 (100.0%) |
Household Vehicle Usage in Kingsbury
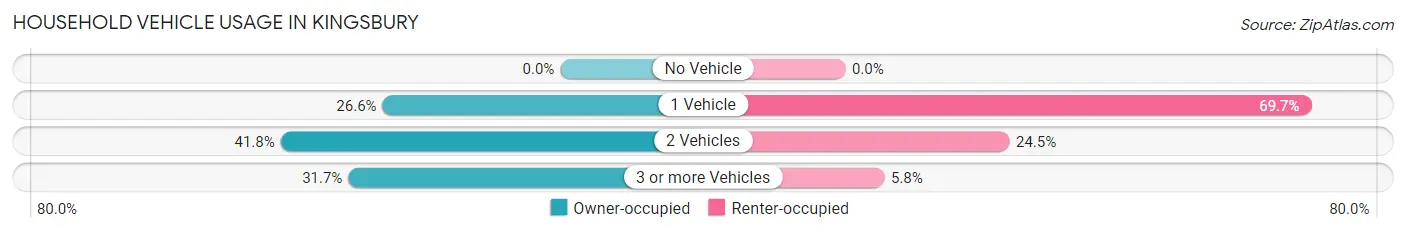
| Vehicles per Household | Owner-occupied | Renter-occupied |
| No Vehicle | 0 (0.0%) | 0 (0.0%) |
| 1 Vehicle | 213 (26.6%) | 179 (69.7%) |
| 2 Vehicles | 335 (41.8%) | 63 (24.5%) |
| 3 or more Vehicles | 254 (31.7%) | 15 (5.8%) |
| Total | 802 (100.0%) | 257 (100.0%) |
Real Estate & Mortgages in Kingsbury
Real Estate and Mortgage Overview in Kingsbury
| Characteristic | Without Mortgage | With Mortgage |
| Housing Units | 449 | 353 |
| Median Property Value | $783,400 | $698,000 |
| Median Household Income | $70,078 | $135 |
| Monthly Housing Costs | $733 | $165 |
| Real Estate Taxes | $3,011 | $0 |
Property Value by Mortgage Status in Kingsbury
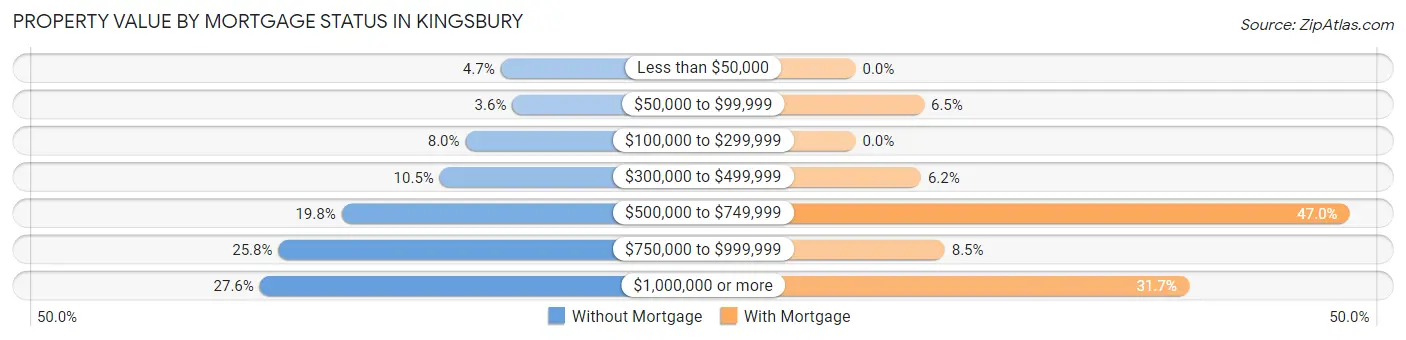
| Property Value | Without Mortgage | With Mortgage |
| Less than $50,000 | 21 (4.7%) | 0 (0.0%) |
| $50,000 to $99,999 | 16 (3.6%) | 23 (6.5%) |
| $100,000 to $299,999 | 36 (8.0%) | 0 (0.0%) |
| $300,000 to $499,999 | 47 (10.5%) | 22 (6.2%) |
| $500,000 to $749,999 | 89 (19.8%) | 166 (47.0%) |
| $750,000 to $999,999 | 116 (25.8%) | 30 (8.5%) |
| $1,000,000 or more | 124 (27.6%) | 112 (31.7%) |
| Total | 449 (100.0%) | 353 (100.0%) |
Household Income by Mortgage Status in Kingsbury
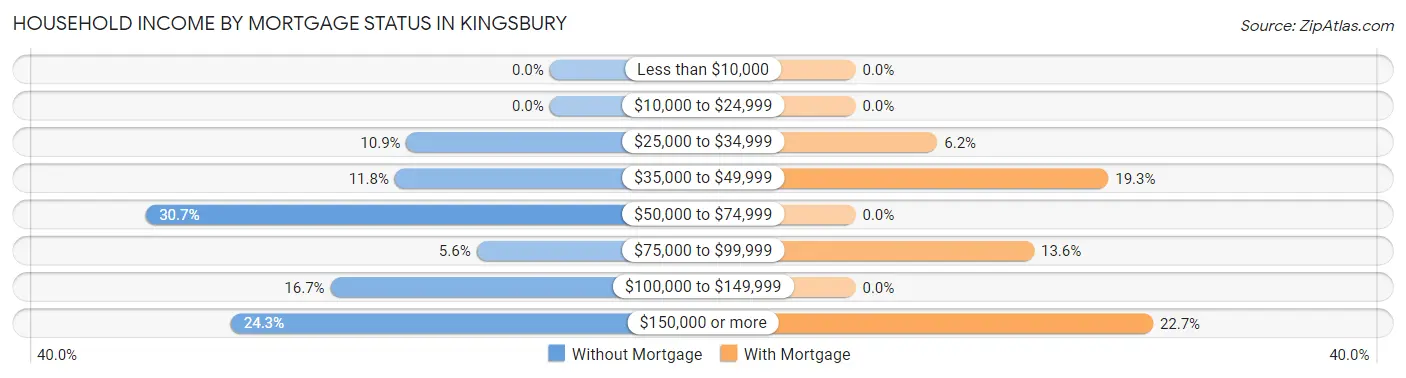
| Household Income | Without Mortgage | With Mortgage |
| Less than $10,000 | 0 (0.0%) | 0 (0.0%) |
| $10,000 to $24,999 | 0 (0.0%) | 0 (0.0%) |
| $25,000 to $34,999 | 49 (10.9%) | 22 (6.2%) |
| $35,000 to $49,999 | 53 (11.8%) | 68 (19.3%) |
| $50,000 to $74,999 | 138 (30.7%) | 0 (0.0%) |
| $75,000 to $99,999 | 25 (5.6%) | 48 (13.6%) |
| $100,000 to $149,999 | 75 (16.7%) | 0 (0.0%) |
| $150,000 or more | 109 (24.3%) | 80 (22.7%) |
| Total | 449 (100.0%) | 353 (100.0%) |
Property Value to Household Income Ratio in Kingsbury
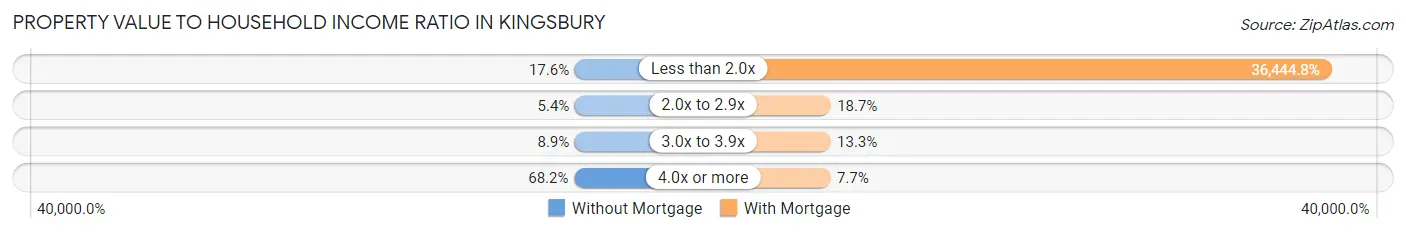
| Value-to-Income Ratio | Without Mortgage | With Mortgage |
| Less than 2.0x | 79 (17.6%) | 128,650 (36,444.8%) |
| 2.0x to 2.9x | 24 (5.3%) | 66 (18.7%) |
| 3.0x to 3.9x | 40 (8.9%) | 47 (13.3%) |
| 4.0x or more | 306 (68.1%) | 27 (7.6%) |
| Total | 449 (100.0%) | 353 (100.0%) |
Real Estate Taxes by Mortgage Status in Kingsbury
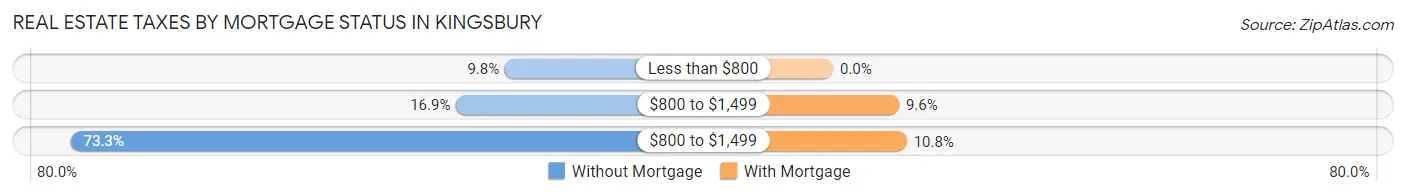
| Property Taxes | Without Mortgage | With Mortgage |
| Less than $800 | 44 (9.8%) | 0 (0.0%) |
| $800 to $1,499 | 76 (16.9%) | 34 (9.6%) |
| $800 to $1,499 | 329 (73.3%) | 38 (10.8%) |
| Total | 449 (100.0%) | 353 (100.0%) |
Health & Disability in Kingsbury
Health Insurance Coverage by Age in Kingsbury
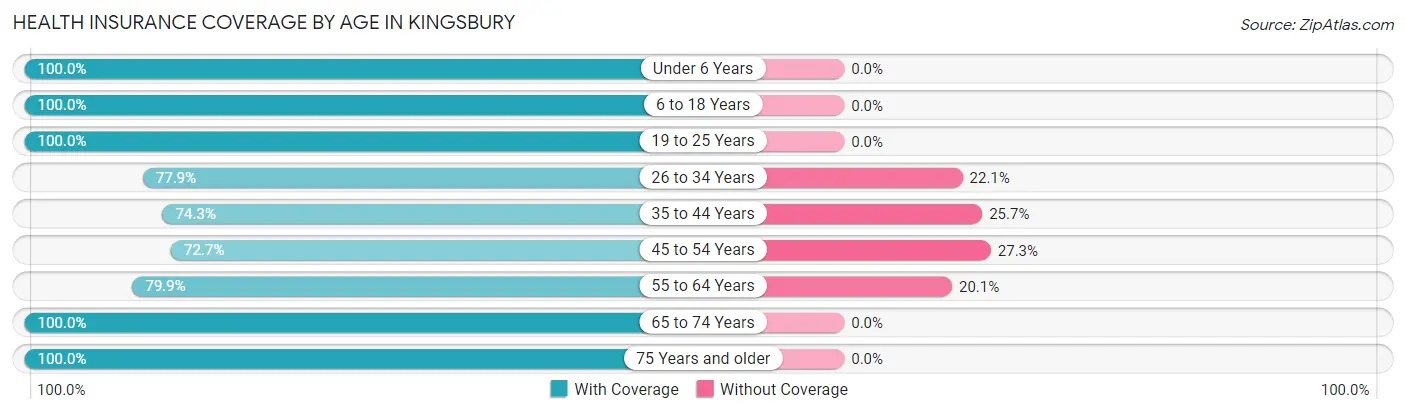
| Age Bracket | With Coverage | Without Coverage |
| Under 6 Years | 37 (100.0%) | 0 (0.0%) |
| 6 to 18 Years | 86 (100.0%) | 0 (0.0%) |
| 19 to 25 Years | 88 (100.0%) | 0 (0.0%) |
| 26 to 34 Years | 106 (77.9%) | 30 (22.1%) |
| 35 to 44 Years | 205 (74.3%) | 71 (25.7%) |
| 45 to 54 Years | 117 (72.7%) | 44 (27.3%) |
| 55 to 64 Years | 374 (79.9%) | 94 (20.1%) |
| 65 to 74 Years | 533 (100.0%) | 0 (0.0%) |
| 75 Years and older | 135 (100.0%) | 0 (0.0%) |
| Total | 1,681 (87.5%) | 239 (12.4%) |
Health Insurance Coverage by Citizenship Status in Kingsbury
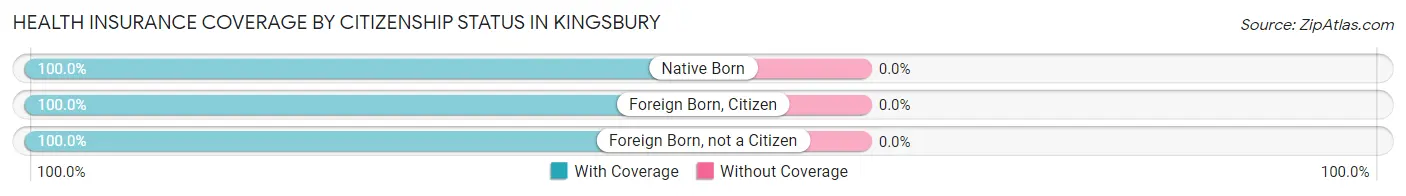
| Citizenship Status | With Coverage | Without Coverage |
| Native Born | 37 (100.0%) | 0 (0.0%) |
| Foreign Born, Citizen | 86 (100.0%) | 0 (0.0%) |
| Foreign Born, not a Citizen | 88 (100.0%) | 0 (0.0%) |
Health Insurance Coverage by Household Income in Kingsbury
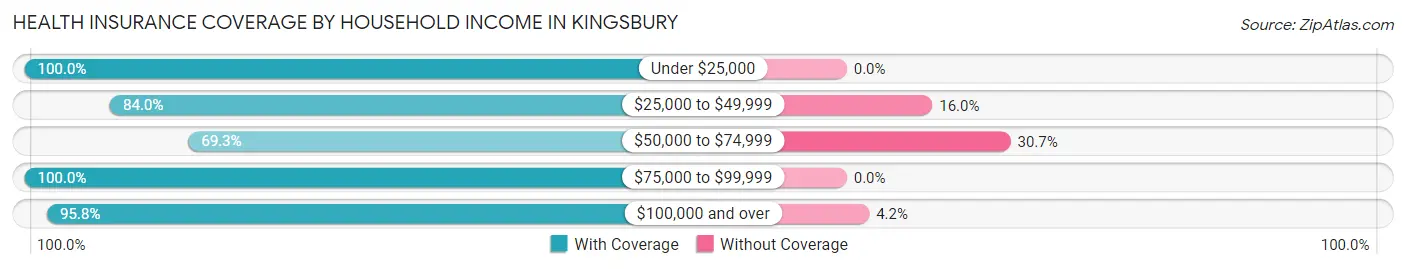
| Household Income | With Coverage | Without Coverage |
| Under $25,000 | 42 (100.0%) | 0 (0.0%) |
| $25,000 to $49,999 | 325 (84.0%) | 62 (16.0%) |
| $50,000 to $74,999 | 305 (69.3%) | 135 (30.7%) |
| $75,000 to $99,999 | 51 (100.0%) | 0 (0.0%) |
| $100,000 and over | 958 (95.8%) | 42 (4.2%) |
Public vs Private Health Insurance Coverage by Age in Kingsbury
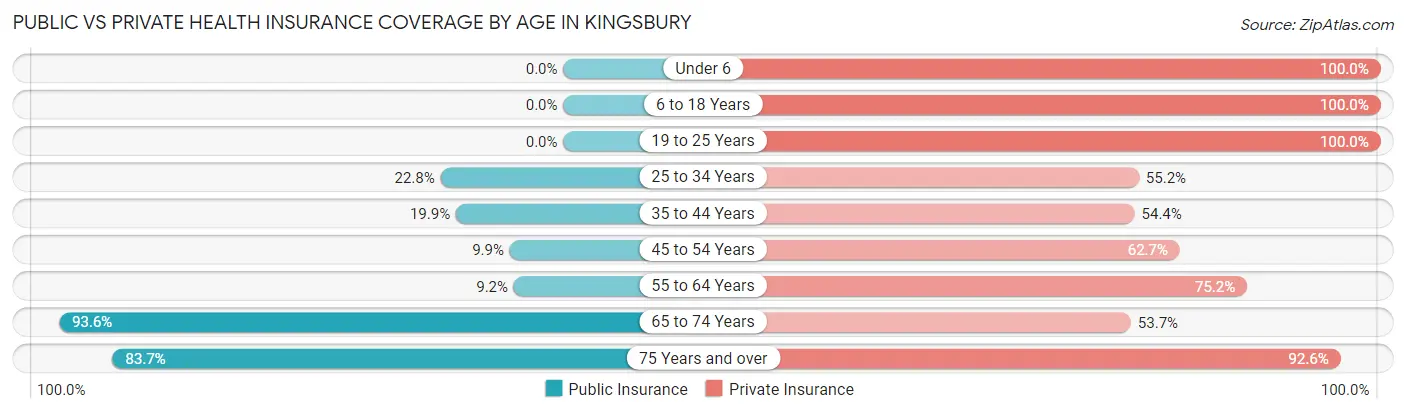
| Age Bracket | Public Insurance | Private Insurance |
| Under 6 | 0 (0.0%) | 37 (100.0%) |
| 6 to 18 Years | 0 (0.0%) | 86 (100.0%) |
| 19 to 25 Years | 0 (0.0%) | 88 (100.0%) |
| 25 to 34 Years | 31 (22.8%) | 75 (55.1%) |
| 35 to 44 Years | 55 (19.9%) | 150 (54.3%) |
| 45 to 54 Years | 16 (9.9%) | 101 (62.7%) |
| 55 to 64 Years | 43 (9.2%) | 352 (75.2%) |
| 65 to 74 Years | 499 (93.6%) | 286 (53.7%) |
| 75 Years and over | 113 (83.7%) | 125 (92.6%) |
| Total | 757 (39.4%) | 1,300 (67.7%) |
Disability Status by Sex by Age in Kingsbury
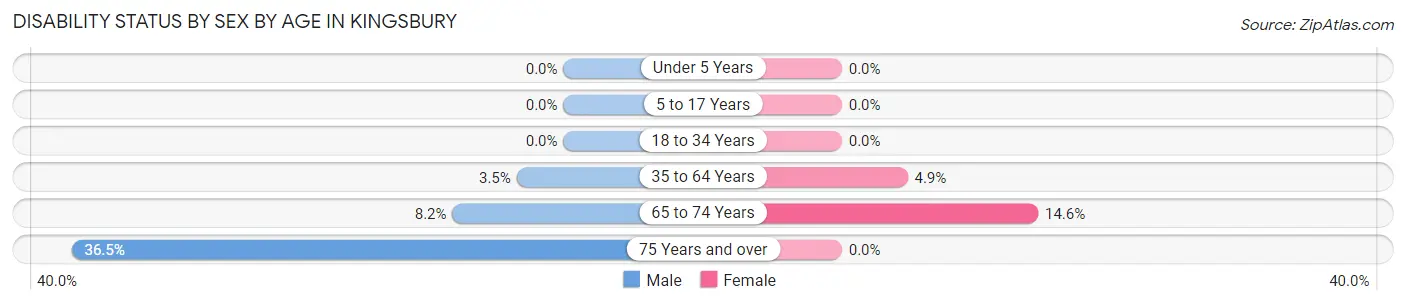
| Age Bracket | Male | Female |
| Under 5 Years | 0 (0.0%) | 0 (0.0%) |
| 5 to 17 Years | 0 (0.0%) | 0 (0.0%) |
| 18 to 34 Years | 0 (0.0%) | 0 (0.0%) |
| 35 to 64 Years | 20 (3.5%) | 16 (4.9%) |
| 65 to 74 Years | 23 (8.2%) | 37 (14.6%) |
| 75 Years and over | 23 (36.5%) | 0 (0.0%) |
Disability Class by Sex by Age in Kingsbury
Disability Class: Hearing Difficulty
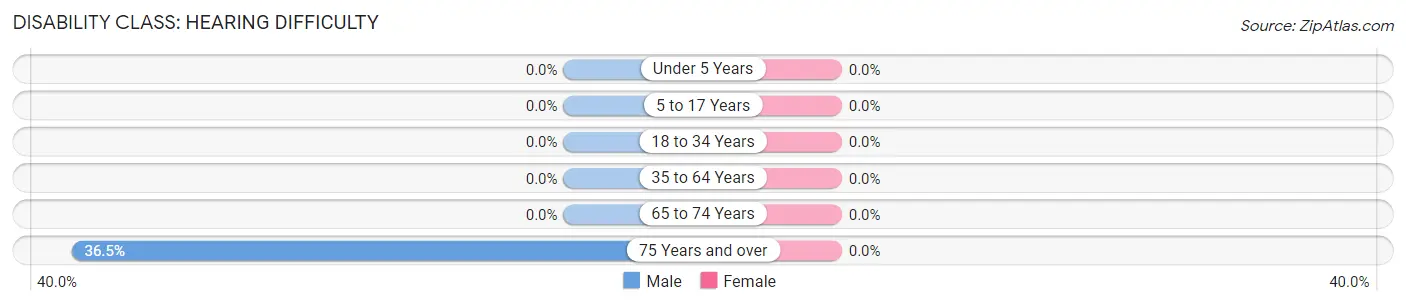
| Age Bracket | Male | Female |
| Under 5 Years | 0 (0.0%) | 0 (0.0%) |
| 5 to 17 Years | 0 (0.0%) | 0 (0.0%) |
| 18 to 34 Years | 0 (0.0%) | 0 (0.0%) |
| 35 to 64 Years | 0 (0.0%) | 0 (0.0%) |
| 65 to 74 Years | 0 (0.0%) | 0 (0.0%) |
| 75 Years and over | 23 (36.5%) | 0 (0.0%) |
Disability Class: Vision Difficulty
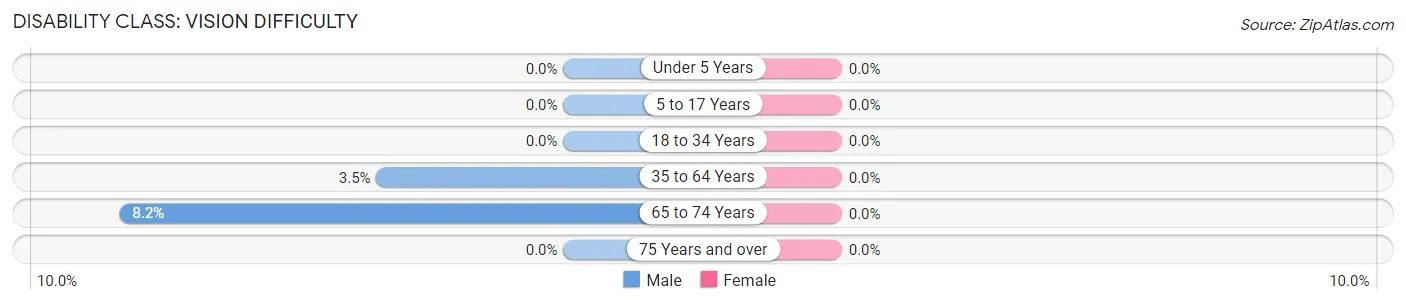
| Age Bracket | Male | Female |
| Under 5 Years | 0 (0.0%) | 0 (0.0%) |
| 5 to 17 Years | 0 (0.0%) | 0 (0.0%) |
| 18 to 34 Years | 0 (0.0%) | 0 (0.0%) |
| 35 to 64 Years | 20 (3.5%) | 0 (0.0%) |
| 65 to 74 Years | 23 (8.2%) | 0 (0.0%) |
| 75 Years and over | 0 (0.0%) | 0 (0.0%) |
Disability Class: Cognitive Difficulty
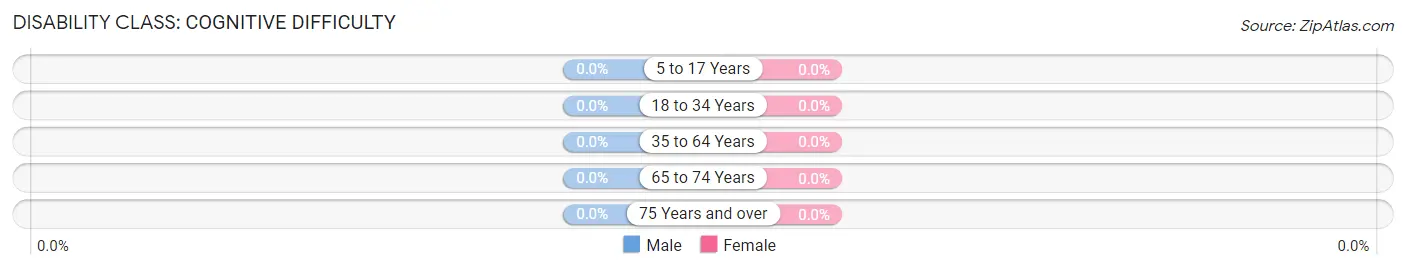
| Age Bracket | Male | Female |
| 5 to 17 Years | 0 (0.0%) | 0 (0.0%) |
| 18 to 34 Years | 0 (0.0%) | 0 (0.0%) |
| 35 to 64 Years | 0 (0.0%) | 0 (0.0%) |
| 65 to 74 Years | 0 (0.0%) | 0 (0.0%) |
| 75 Years and over | 0 (0.0%) | 0 (0.0%) |
Disability Class: Ambulatory Difficulty
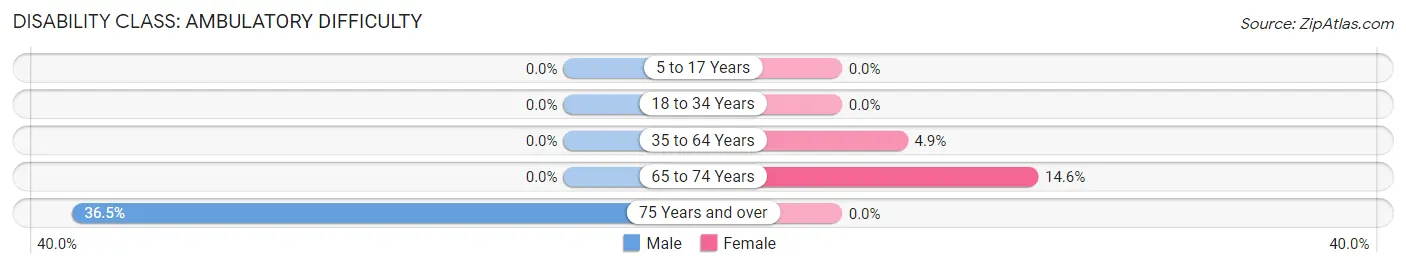
| Age Bracket | Male | Female |
| 5 to 17 Years | 0 (0.0%) | 0 (0.0%) |
| 18 to 34 Years | 0 (0.0%) | 0 (0.0%) |
| 35 to 64 Years | 0 (0.0%) | 16 (4.9%) |
| 65 to 74 Years | 0 (0.0%) | 37 (14.6%) |
| 75 Years and over | 23 (36.5%) | 0 (0.0%) |
Disability Class: Self-Care Difficulty
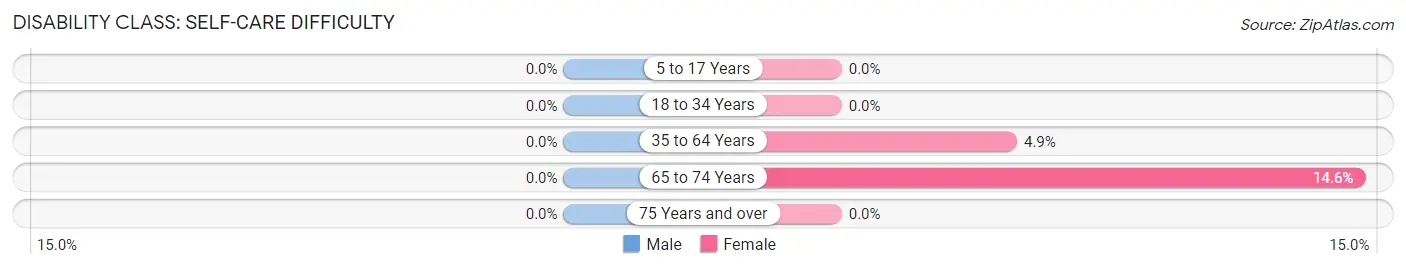
| Age Bracket | Male | Female |
| 5 to 17 Years | 0 (0.0%) | 0 (0.0%) |
| 18 to 34 Years | 0 (0.0%) | 0 (0.0%) |
| 35 to 64 Years | 0 (0.0%) | 16 (4.9%) |
| 65 to 74 Years | 0 (0.0%) | 37 (14.6%) |
| 75 Years and over | 0 (0.0%) | 0 (0.0%) |
Technology Access in Kingsbury
Computing Device Access in Kingsbury
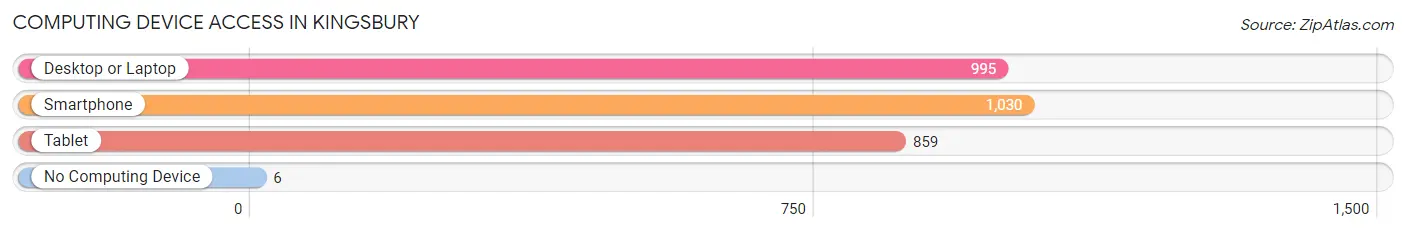
| Device Type | # Households | % Households |
| Desktop or Laptop | 995 | 94.0% |
| Smartphone | 1,030 | 97.3% |
| Tablet | 859 | 81.1% |
| No Computing Device | 6 | 0.6% |
| Total | 1,059 | 100.0% |
Internet Access in Kingsbury
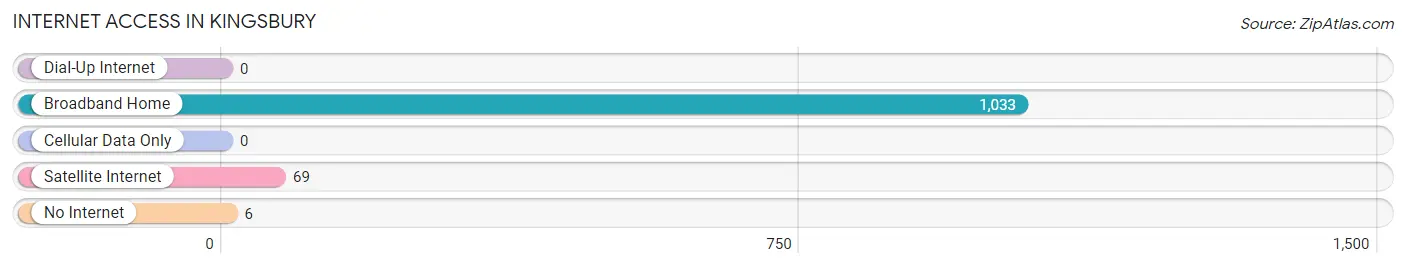
| Internet Type | # Households | % Households |
| Dial-Up Internet | 0 | 0.0% |
| Broadband Home | 1,033 | 97.5% |
| Cellular Data Only | 0 | 0.0% |
| Satellite Internet | 69 | 6.5% |
| No Internet | 6 | 0.6% |
| Total | 1,059 | 100.0% |
Kingsbury Summary
History
Kingsbury is an unincorporated town located in Douglas County, Nevada. It is situated in the Carson Valley, approximately 8 miles south of the state capital of Carson City. The town was founded in 1859 by a group of miners who were searching for gold in the area. The town was named after William Kingsbury, one of the miners who discovered gold in the area.
The town was initially a mining camp, but it soon grew into a small community. The first post office was established in 1864, and the first school was built in 1868. The town was incorporated in 1871, and the first newspaper, the Kingsbury Times, was established in 1872.
The town experienced a period of growth in the late 19th century, with the construction of a railroad line and the establishment of a number of businesses. The town was also home to a number of saloons and gambling halls.
In the early 20th century, the town experienced a period of decline as the mining industry in the area declined. The town was eventually abandoned in the 1940s, and the post office was closed in 1945.
Geography
Kingsbury is located in the Carson Valley, approximately 8 miles south of Carson City. The town is situated at an elevation of 4,890 feet above sea level. The town is surrounded by the Sierra Nevada mountain range to the west and the Carson Range to the east.
The town is located in a semi-arid climate, with hot summers and cold winters. The average annual temperature is approximately 50 degrees Fahrenheit. The average annual precipitation is approximately 8 inches.
Economy
The economy of Kingsbury is largely based on tourism and agriculture. The town is home to a number of tourist attractions, including the Kingsbury Grade, a scenic mountain road that runs through the town. The town is also home to a number of wineries and vineyards, as well as a number of farms and ranches.
The town is also home to a number of businesses, including restaurants, bars, and retail stores. The town is also home to a number of manufacturing companies, including a furniture factory and a woodworking shop.
Demographics
As of the 2010 census, the population of Kingsbury was 1,845. The town is predominantly white, with approximately 90% of the population identifying as white. The town is also home to a small Hispanic population, with approximately 5% of the population identifying as Hispanic or Latino.
The median household income in Kingsbury is approximately $50,000, and the median home value is approximately $200,000. The town has a low unemployment rate, with approximately 4% of the population unemployed. The town also has a low poverty rate, with approximately 5% of the population living below the poverty line.
Common Questions
What is Per Capita Income in Kingsbury?
Per Capita income in Kingsbury is $104,479.
What is the Median Family Income in Kingsbury?
Median Family Income in Kingsbury is $102,679.
What is the Median Household income in Kingsbury?
Median Household Income in Kingsbury is $74,424.
What is Income or Wage Gap in Kingsbury?
Income or Wage Gap in Kingsbury is 7.5%.
Women in Kingsbury earn 92.5 cents for every dollar earned by a man.
What is Inequality or Gini Index in Kingsbury?
Inequality or Gini Index in Kingsbury is 0.58.
What is the Total Population of Kingsbury?
Total Population of Kingsbury is 1,920.
What is the Total Male Population of Kingsbury?
Total Male Population of Kingsbury is 1,087.
What is the Total Female Population of Kingsbury?
Total Female Population of Kingsbury is 833.
What is the Ratio of Males per 100 Females in Kingsbury?
There are 130.49 Males per 100 Females in Kingsbury.
What is the Ratio of Females per 100 Males in Kingsbury?
There are 76.63 Females per 100 Males in Kingsbury.
What is the Median Population Age in Kingsbury?
Median Population Age in Kingsbury is 57.9 Years.
What is the Average Family Size in Kingsbury
Average Family Size in Kingsbury is 2.2 People.
What is the Average Household Size in Kingsbury
Average Household Size in Kingsbury is 1.8 People.
How Large is the Labor Force in Kingsbury?
There are 1,000 People in the Labor Forcein in Kingsbury.
What is the Percentage of People in the Labor Force in Kingsbury?
55.0% of People are in the Labor Force in Kingsbury.
What is the Unemployment Rate in Kingsbury?
Unemployment Rate in Kingsbury is 1.3%.