Zeeland, ND Map & Demographics
Zeeland Map
Zeeland Overview
$43,711
PER CAPITA INCOME
$27,292
AVG FAMILY INCOME
0.56
INEQUALITY / GINI INDEX
96
TOTAL POPULATION
62
MALE POPULATION
34
FEMALE POPULATION
182.35
MALES / 100 FEMALES
54.84
FEMALES / 100 MALES
66.5
MEDIAN AGE
1.9
AVG FAMILY SIZE
1.3
AVG HOUSEHOLD SIZE
49
LABOR FORCE [ PEOPLE ]
54.4%
PERCENT IN LABOR FORCE
Zeeland Zip Codes
Zeeland Area Codes
Income in Zeeland
Income Overview in Zeeland
| Characteristic | Number | Measure |
| Per Capita Income | 96 | $43,711 |
| Median Family Income | 19 | $27,292 |
| Mean Family Income | 19 | $35,211 |
| Median Household Income | 76 | $0 |
| Mean Household Income | 76 | $87,099 |
| Income Deficit | 19 | $0 |
| Wage / Income Gap (%) | 96 | 0.00% |
| Wage / Income Gap ($) | 96 | 100.00¢ per $1 |
| Gini / Inequality Index | 96 | 0.56 |
Earnings by Sex in Zeeland
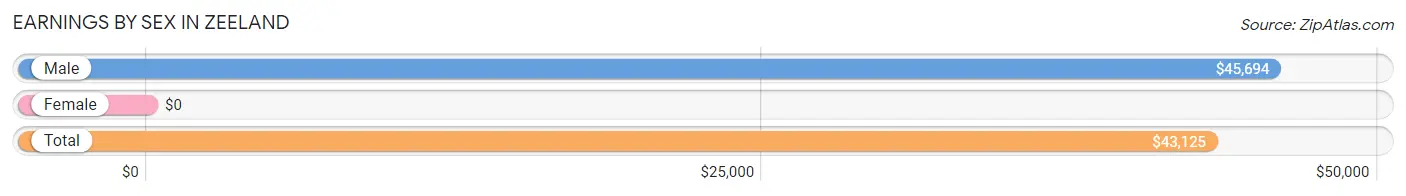
| Sex | Number | Average Earnings |
| Male | 36 (73.5%) | $45,694 |
| Female | 13 (26.5%) | $0 |
| Total | 49 (100.0%) | $43,125 |
Earnings by Sex by Income Bracket in Zeeland
The most common earnings brackets in Zeeland are $45,000 to $49,999 for men (18 | 50.0%) and $12,500 to $14,999 for women (5 | 38.5%).
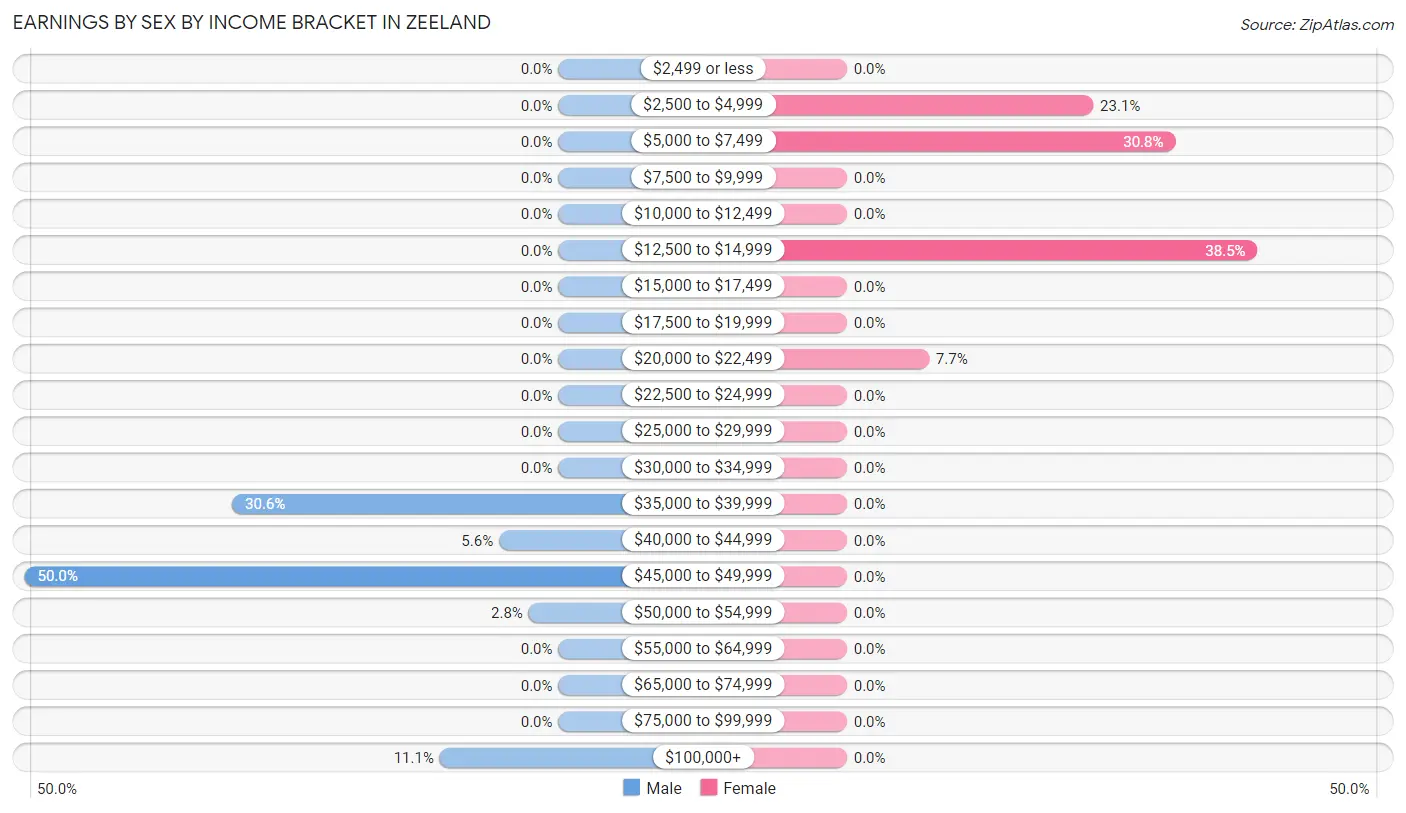
| Income | Male | Female |
| $2,499 or less | 0 (0.0%) | 0 (0.0%) |
| $2,500 to $4,999 | 0 (0.0%) | 3 (23.1%) |
| $5,000 to $7,499 | 0 (0.0%) | 4 (30.8%) |
| $7,500 to $9,999 | 0 (0.0%) | 0 (0.0%) |
| $10,000 to $12,499 | 0 (0.0%) | 0 (0.0%) |
| $12,500 to $14,999 | 0 (0.0%) | 5 (38.5%) |
| $15,000 to $17,499 | 0 (0.0%) | 0 (0.0%) |
| $17,500 to $19,999 | 0 (0.0%) | 0 (0.0%) |
| $20,000 to $22,499 | 0 (0.0%) | 1 (7.7%) |
| $22,500 to $24,999 | 0 (0.0%) | 0 (0.0%) |
| $25,000 to $29,999 | 0 (0.0%) | 0 (0.0%) |
| $30,000 to $34,999 | 0 (0.0%) | 0 (0.0%) |
| $35,000 to $39,999 | 11 (30.6%) | 0 (0.0%) |
| $40,000 to $44,999 | 2 (5.6%) | 0 (0.0%) |
| $45,000 to $49,999 | 18 (50.0%) | 0 (0.0%) |
| $50,000 to $54,999 | 1 (2.8%) | 0 (0.0%) |
| $55,000 to $64,999 | 0 (0.0%) | 0 (0.0%) |
| $65,000 to $74,999 | 0 (0.0%) | 0 (0.0%) |
| $75,000 to $99,999 | 0 (0.0%) | 0 (0.0%) |
| $100,000+ | 4 (11.1%) | 0 (0.0%) |
| Total | 36 (100.0%) | 13 (100.0%) |
Earnings by Sex by Educational Attainment in Zeeland
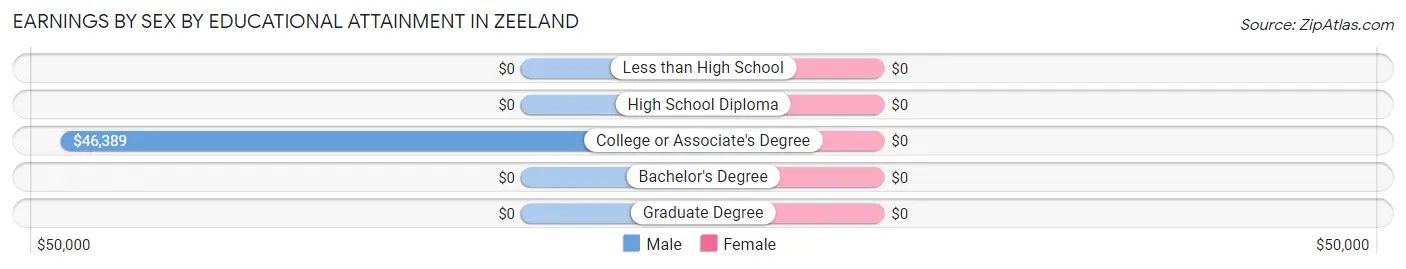
| Educational Attainment | Male Income | Female Income |
| Less than High School | - | - |
| High School Diploma | - | - |
| College or Associate's Degree | $46,389 | $0 |
| Bachelor's Degree | - | - |
| Graduate Degree | - | - |
| Total | $46,250 | $0 |
Family Income in Zeeland
Family Income Brackets in Zeeland
According to the Zeeland family income data, there are 9 families falling into the $25,000 to $34,999 income range, which is the most common income bracket and makes up 47.4% of all families.
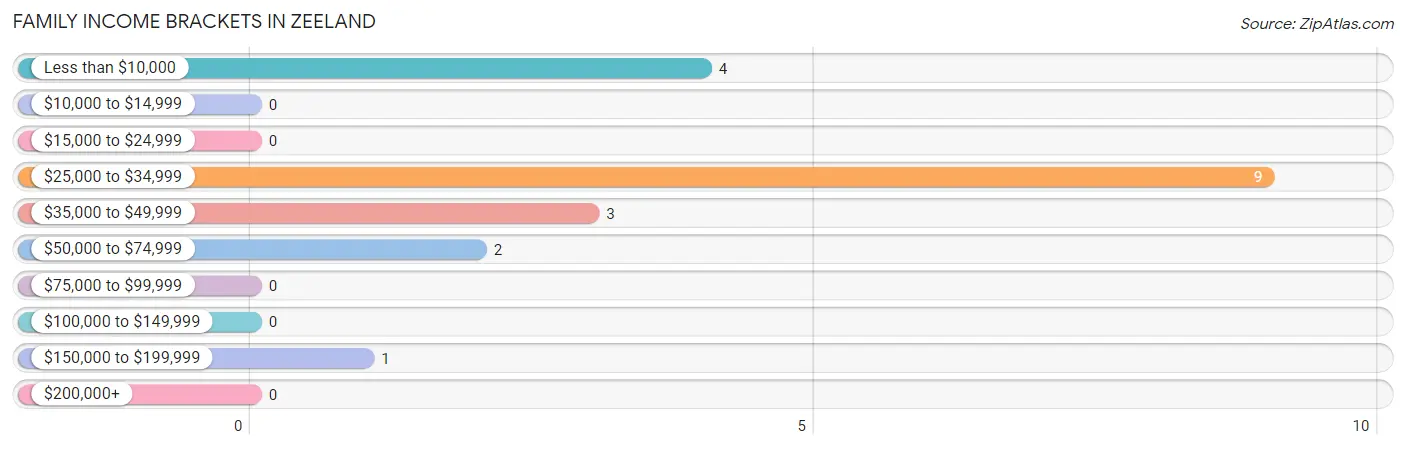
| Income Bracket | # Families | % Families |
| Less than $10,000 | 4 | 21.1% |
| $10,000 to $14,999 | 0 | 0.0% |
| $15,000 to $24,999 | 0 | 0.0% |
| $25,000 to $34,999 | 9 | 47.4% |
| $35,000 to $49,999 | 3 | 15.8% |
| $50,000 to $74,999 | 2 | 10.5% |
| $75,000 to $99,999 | 0 | 0.0% |
| $100,000 to $149,999 | 0 | 0.0% |
| $150,000 to $199,999 | 1 | 5.3% |
| $200,000+ | 0 | 0.0% |
Family Income by Famaliy Size in Zeeland
2-person families (15 | 78.9%) account for the highest median family income in Zeeland with $28,750 per family, while 2-person families (15 | 78.9%) have the highest median income of $14,375 per family member.
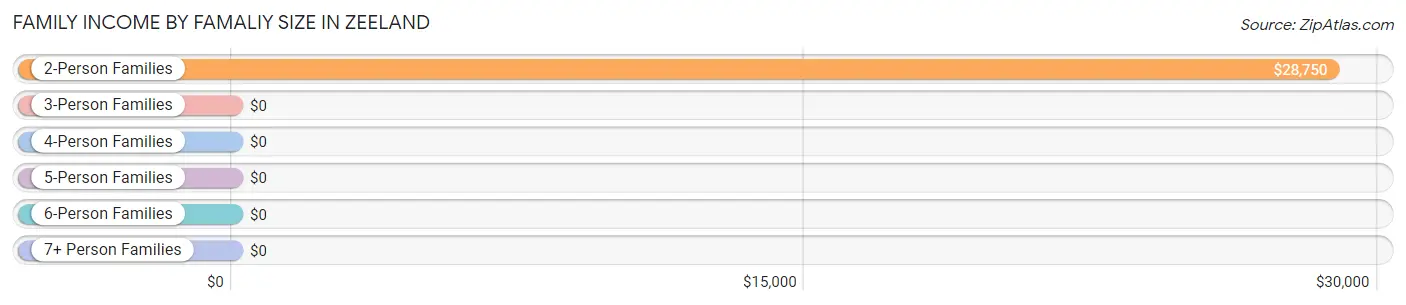
| Income Bracket | # Families | Median Income |
| 2-Person Families | 15 (78.9%) | $28,750 |
| 3-Person Families | 4 (21.0%) | $0 |
| 4-Person Families | 0 (0.0%) | $0 |
| 5-Person Families | 0 (0.0%) | $0 |
| 6-Person Families | 0 (0.0%) | $0 |
| 7+ Person Families | 0 (0.0%) | $0 |
| Total | 19 (100.0%) | $27,292 |
Family Income by Number of Earners in Zeeland
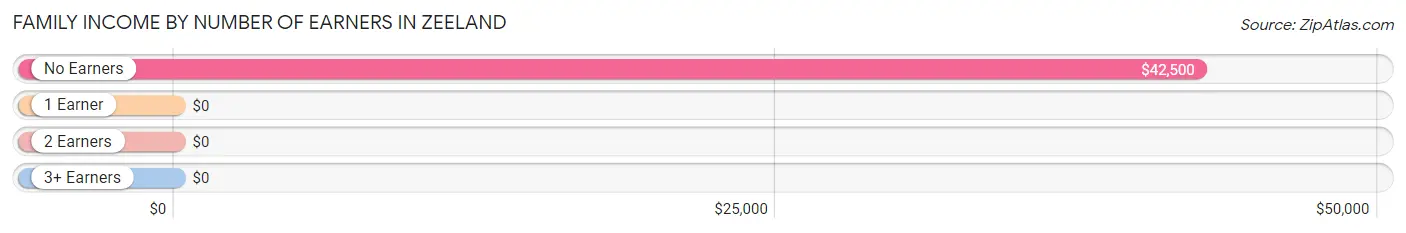
| Number of Earners | # Families | Median Income |
| No Earners | 8 (42.1%) | $42,500 |
| 1 Earner | 10 (52.6%) | $0 |
| 2 Earners | 1 (5.3%) | $0 |
| 3+ Earners | 0 (0.0%) | $0 |
| Total | 19 (100.0%) | $27,292 |
Household Income in Zeeland
Household Income Brackets in Zeeland
With 18 households falling in the category, the $75,000 to $99,999 income range is the most frequent in Zeeland, accounting for 23.7% of all households.
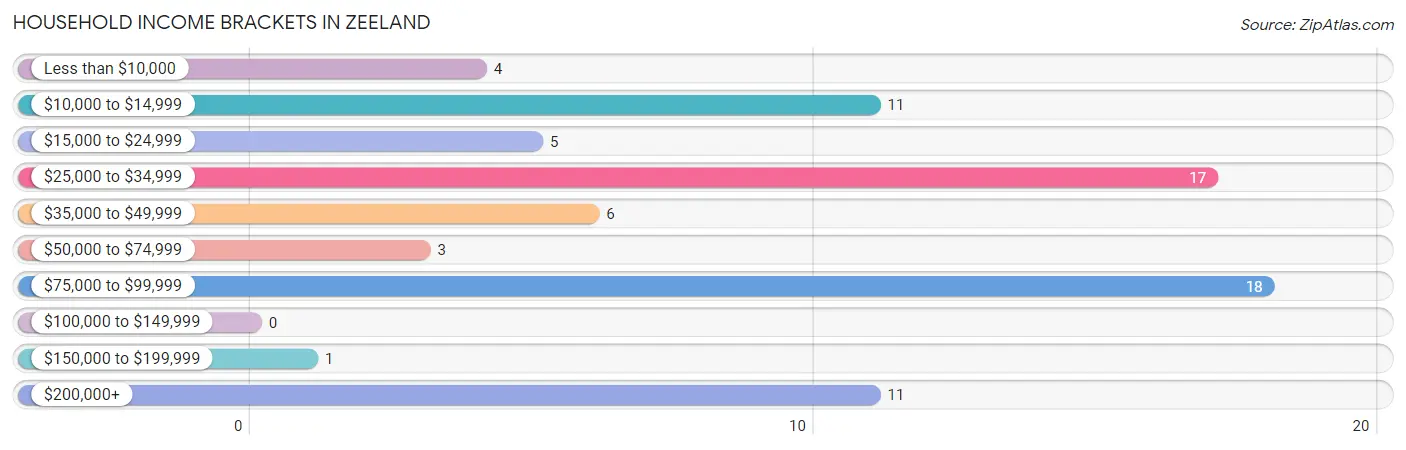
| Income Bracket | # Households | % Households |
| Less than $10,000 | 4 | 5.3% |
| $10,000 to $14,999 | 11 | 14.5% |
| $15,000 to $24,999 | 5 | 6.6% |
| $25,000 to $34,999 | 17 | 22.4% |
| $35,000 to $49,999 | 6 | 7.9% |
| $50,000 to $74,999 | 3 | 3.9% |
| $75,000 to $99,999 | 18 | 23.7% |
| $100,000 to $149,999 | 0 | 0.0% |
| $150,000 to $199,999 | 1 | 1.3% |
| $200,000+ | 11 | 14.5% |
Household Income by Householder Age in Zeeland
The median household income in Zeeland is $0, with the highest median household income of $20,625 found in the 45 to 64 years age bracket for the primary householder. A total of 5 households (6.6%) fall into this category. Meanwhile, the 15 to 24 years age bracket for the primary householder has the lowest median household income of $0, with 11 households (14.5%) in this group.
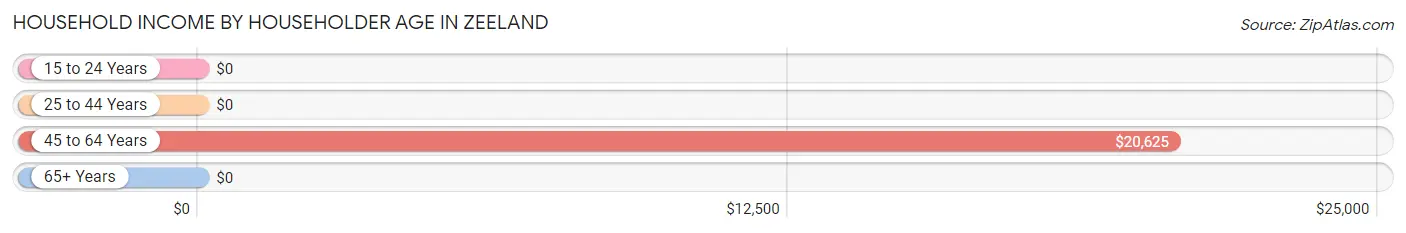
| Income Bracket | # Households | Median Income |
| 15 to 24 Years | 11 (14.5%) | $0 |
| 25 to 44 Years | 11 (14.5%) | $0 |
| 45 to 64 Years | 5 (6.6%) | $20,625 |
| 65+ Years | 49 (64.5%) | $0 |
| Total | 76 (100.0%) | $0 |
Poverty in Zeeland
Income Below Poverty by Sex and Age in Zeeland
With 16.1% poverty level for males and 32.4% for females among the residents of Zeeland, 5 year old males and 25 to 34 year old females are the most vulnerable to poverty, with 3 males (100.0%) and 4 females (100.0%) in their respective age groups living below the poverty level.
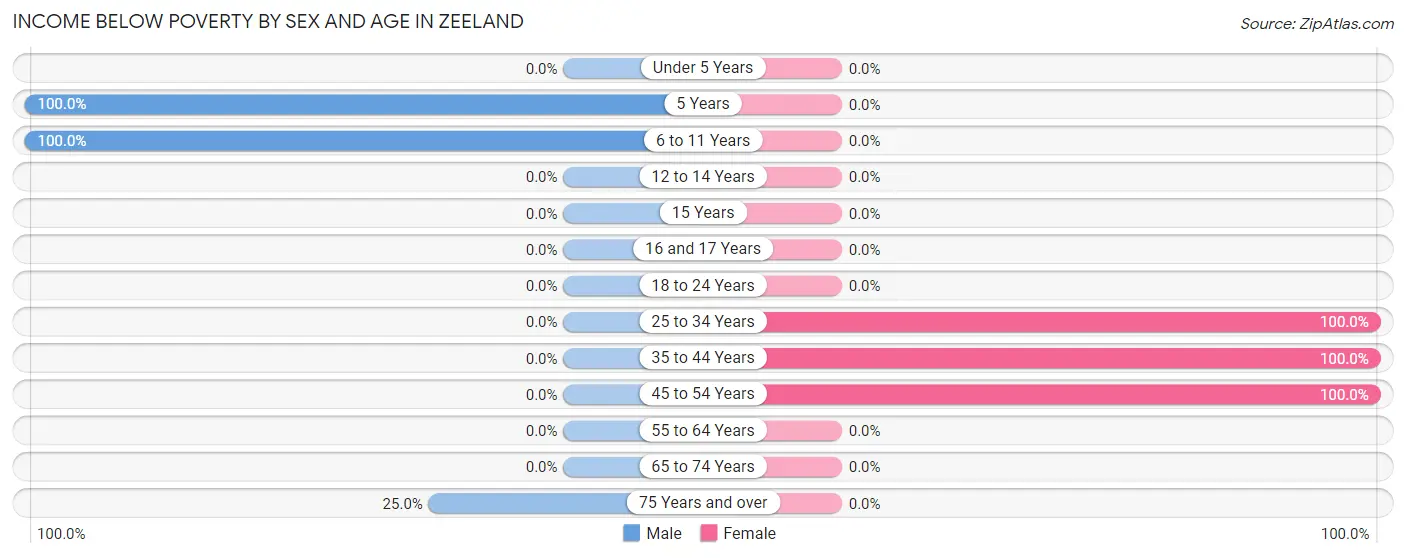
| Age Bracket | Male | Female |
| Under 5 Years | 0 (0.0%) | 0 (0.0%) |
| 5 Years | 3 (100.0%) | 0 (0.0%) |
| 6 to 11 Years | 3 (100.0%) | 0 (0.0%) |
| 12 to 14 Years | 0 (0.0%) | 0 (0.0%) |
| 15 Years | 0 (0.0%) | 0 (0.0%) |
| 16 and 17 Years | 0 (0.0%) | 0 (0.0%) |
| 18 to 24 Years | 0 (0.0%) | 0 (0.0%) |
| 25 to 34 Years | 0 (0.0%) | 4 (100.0%) |
| 35 to 44 Years | 0 (0.0%) | 5 (100.0%) |
| 45 to 54 Years | 0 (0.0%) | 2 (100.0%) |
| 55 to 64 Years | 0 (0.0%) | 0 (0.0%) |
| 65 to 74 Years | 0 (0.0%) | 0 (0.0%) |
| 75 Years and over | 4 (25.0%) | 0 (0.0%) |
| Total | 10 (16.1%) | 11 (32.4%) |
Income Above Poverty by Sex and Age in Zeeland
According to the poverty statistics in Zeeland, males aged 18 to 24 years and females aged 55 to 64 years are the age groups that are most secure financially, with 100.0% of males and 100.0% of females in these age groups living above the poverty line.
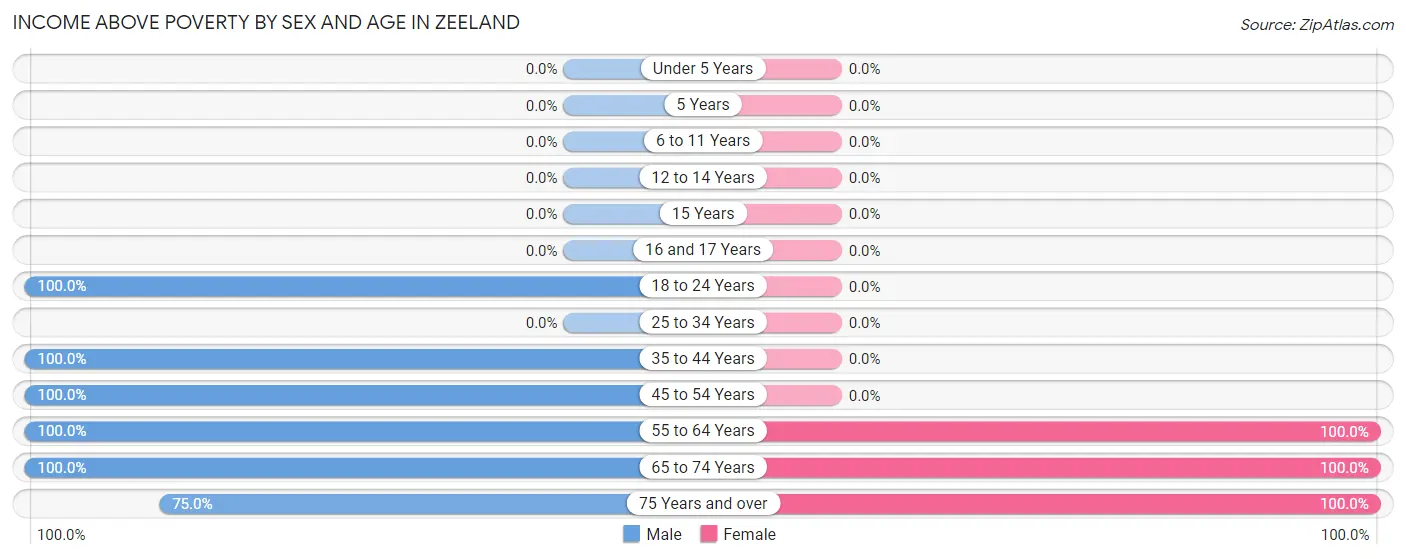
| Age Bracket | Male | Female |
| Under 5 Years | 0 (0.0%) | 0 (0.0%) |
| 5 Years | 0 (0.0%) | 0 (0.0%) |
| 6 to 11 Years | 0 (0.0%) | 0 (0.0%) |
| 12 to 14 Years | 0 (0.0%) | 0 (0.0%) |
| 15 Years | 0 (0.0%) | 0 (0.0%) |
| 16 and 17 Years | 0 (0.0%) | 0 (0.0%) |
| 18 to 24 Years | 14 (100.0%) | 0 (0.0%) |
| 25 to 34 Years | 0 (0.0%) | 0 (0.0%) |
| 35 to 44 Years | 2 (100.0%) | 0 (0.0%) |
| 45 to 54 Years | 2 (100.0%) | 0 (0.0%) |
| 55 to 64 Years | 1 (100.0%) | 3 (100.0%) |
| 65 to 74 Years | 21 (100.0%) | 6 (100.0%) |
| 75 Years and over | 12 (75.0%) | 14 (100.0%) |
| Total | 52 (83.9%) | 23 (67.6%) |
Income Below Poverty Among Married-Couple Families in Zeeland
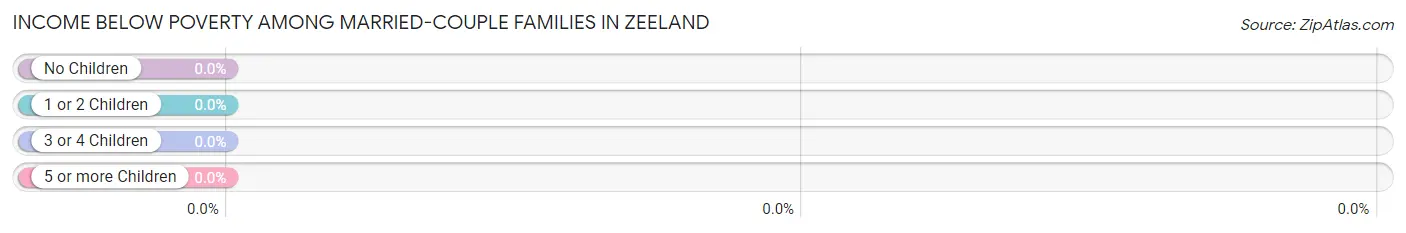
| Children | Above Poverty | Below Poverty |
| No Children | 9 (100.0%) | 0 (0.0%) |
| 1 or 2 Children | 0 (0.0%) | 0 (0.0%) |
| 3 or 4 Children | 0 (0.0%) | 0 (0.0%) |
| 5 or more Children | 0 (0.0%) | 0 (0.0%) |
| Total | 9 (100.0%) | 0 (0.0%) |
Income Below Poverty Among Single-Parent Households in Zeeland
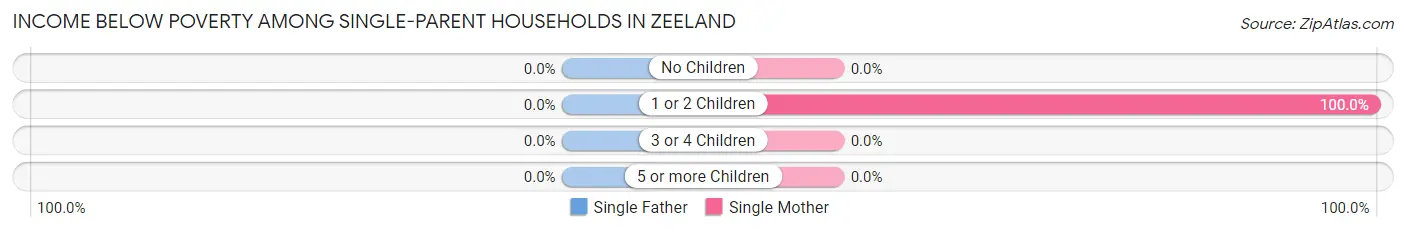
| Children | Single Father | Single Mother |
| No Children | 0 (0.0%) | 0 (0.0%) |
| 1 or 2 Children | 0 (0.0%) | 4 (100.0%) |
| 3 or 4 Children | 0 (0.0%) | 0 (0.0%) |
| 5 or more Children | 0 (0.0%) | 0 (0.0%) |
| Total | 0 (0.0%) | 4 (40.0%) |
Income Below Poverty Among Married-Couple vs Single-Parent Households in Zeeland
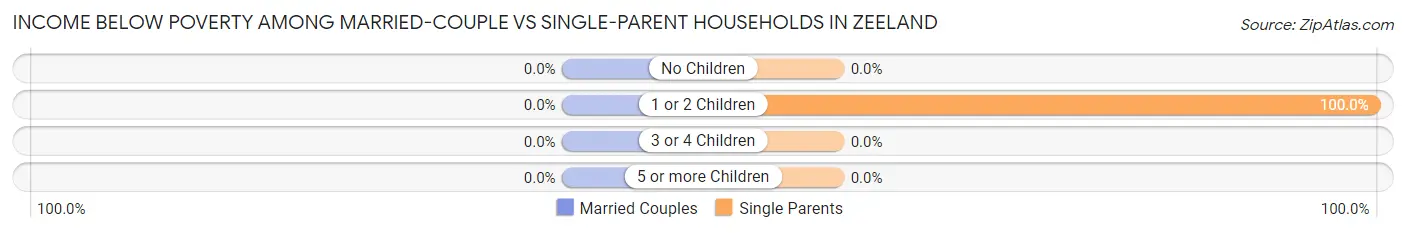
| Children | Married-Couple Families | Single-Parent Households |
| No Children | 0 (0.0%) | 0 (0.0%) |
| 1 or 2 Children | 0 (0.0%) | 4 (100.0%) |
| 3 or 4 Children | 0 (0.0%) | 0 (0.0%) |
| 5 or more Children | 0 (0.0%) | 0 (0.0%) |
| Total | 0 (0.0%) | 4 (40.0%) |
Race in Zeeland
The most populous races in Zeeland are White / Caucasian (94 | 97.9%), and Native / Alaskan (2 | 2.1%).
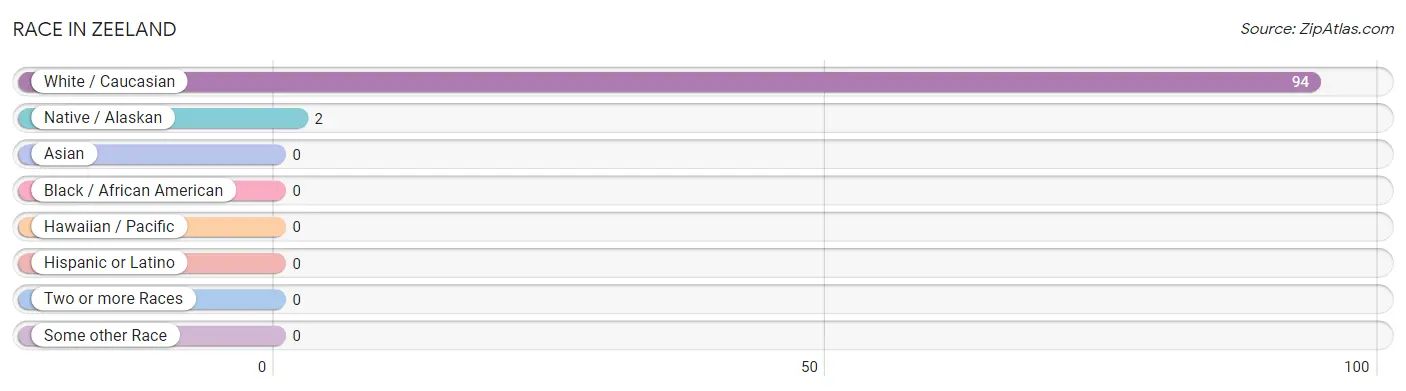
| Race | # Population | % Population |
| Asian | 0 | 0.0% |
| Black / African American | 0 | 0.0% |
| Hawaiian / Pacific | 0 | 0.0% |
| Hispanic or Latino | 0 | 0.0% |
| Native / Alaskan | 2 | 2.1% |
| White / Caucasian | 94 | 97.9% |
| Two or more Races | 0 | 0.0% |
| Some other Race | 0 | 0.0% |
| Total | 96 | 100.0% |
Ancestry in Zeeland
The most populous ancestries reported in Zeeland are German (67 | 69.8%), Russian (15 | 15.6%), English (11 | 11.5%), Irish (7 | 7.3%), and Dutch (4 | 4.2%), together accounting for 108.3% of all Zeeland residents.
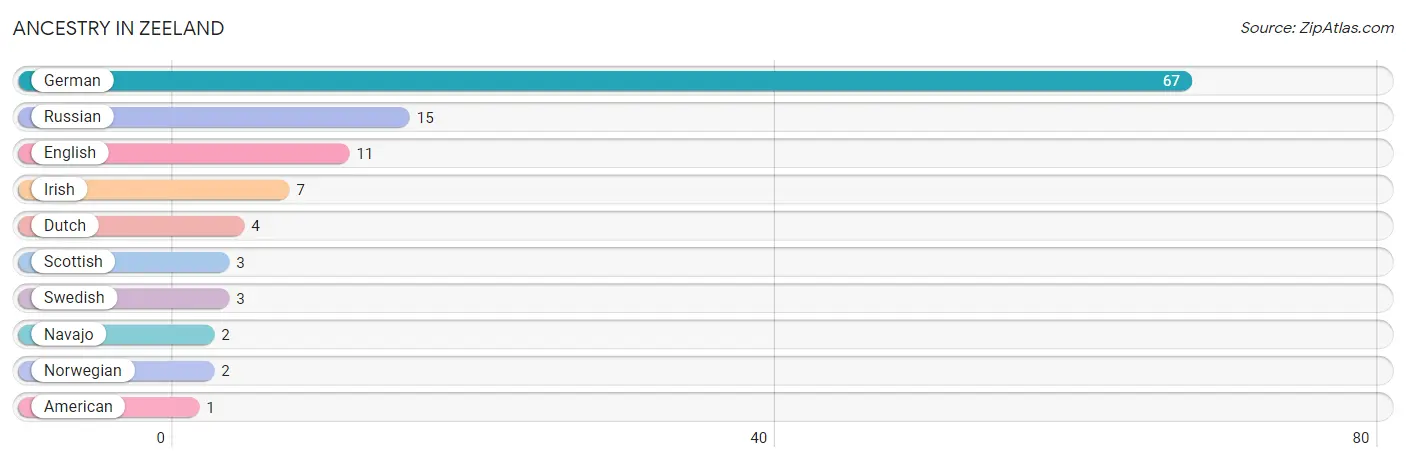
| Ancestry | # Population | % Population |
| American | 1 | 1.0% |
| Dutch | 4 | 4.2% |
| English | 11 | 11.5% |
| German | 67 | 69.8% |
| Irish | 7 | 7.3% |
| Navajo | 2 | 2.1% |
| Norwegian | 2 | 2.1% |
| Russian | 15 | 15.6% |
| Scottish | 3 | 3.1% |
| Swedish | 3 | 3.1% | View All 10 Rows |
Immigrants in Zeeland

| Immigration Origin | # Population | % Population | View All 0 Rows |
Sex and Age in Zeeland
Sex and Age in Zeeland
The most populous age groups in Zeeland are 65 to 69 Years (19 | 30.6%) for men and 80 to 84 Years (7 | 20.6%) for women.
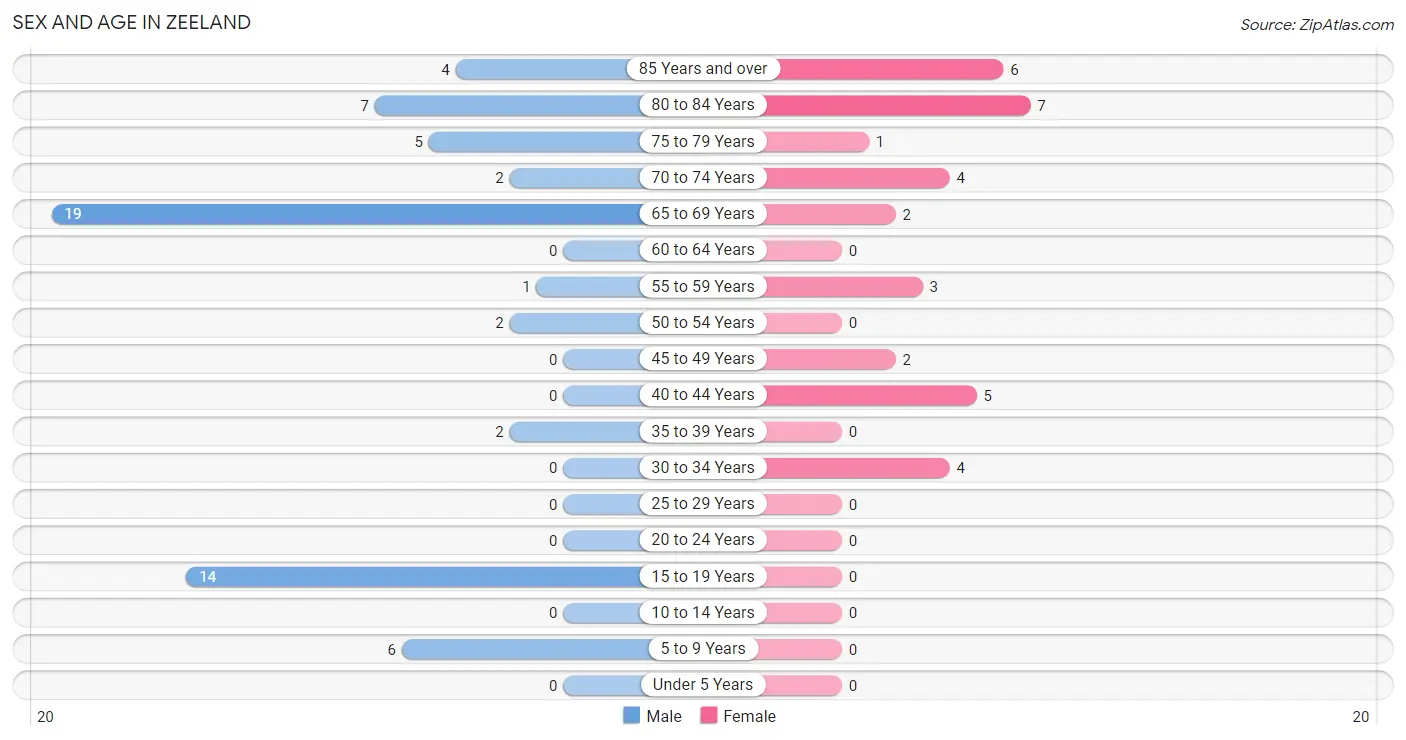
| Age Bracket | Male | Female |
| Under 5 Years | 0 (0.0%) | 0 (0.0%) |
| 5 to 9 Years | 6 (9.7%) | 0 (0.0%) |
| 10 to 14 Years | 0 (0.0%) | 0 (0.0%) |
| 15 to 19 Years | 14 (22.6%) | 0 (0.0%) |
| 20 to 24 Years | 0 (0.0%) | 0 (0.0%) |
| 25 to 29 Years | 0 (0.0%) | 0 (0.0%) |
| 30 to 34 Years | 0 (0.0%) | 4 (11.8%) |
| 35 to 39 Years | 2 (3.2%) | 0 (0.0%) |
| 40 to 44 Years | 0 (0.0%) | 5 (14.7%) |
| 45 to 49 Years | 0 (0.0%) | 2 (5.9%) |
| 50 to 54 Years | 2 (3.2%) | 0 (0.0%) |
| 55 to 59 Years | 1 (1.6%) | 3 (8.8%) |
| 60 to 64 Years | 0 (0.0%) | 0 (0.0%) |
| 65 to 69 Years | 19 (30.6%) | 2 (5.9%) |
| 70 to 74 Years | 2 (3.2%) | 4 (11.8%) |
| 75 to 79 Years | 5 (8.1%) | 1 (2.9%) |
| 80 to 84 Years | 7 (11.3%) | 7 (20.6%) |
| 85 Years and over | 4 (6.5%) | 6 (17.6%) |
| Total | 62 (100.0%) | 34 (100.0%) |
Families and Households in Zeeland
Median Family Size in Zeeland
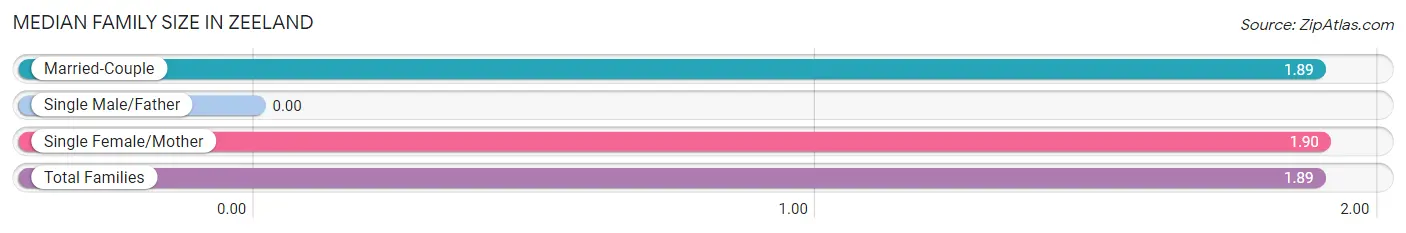
| Family Type | # Families | Family Size |
| Married-Couple | 9 (47.4%) | 1.89 |
| Single Male/Father | 0 (0.0%) | - |
| Single Female/Mother | 10 (52.6%) | 1.90 |
| Total Families | 19 (100.0%) | 1.89 |
Median Household Size in Zeeland
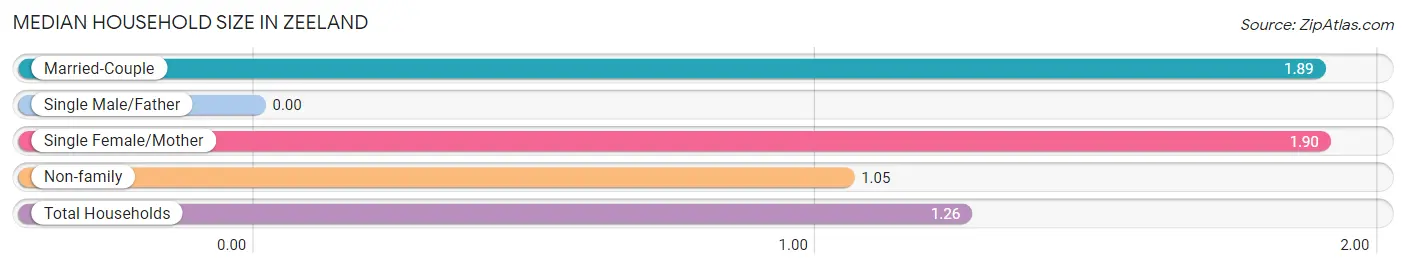
| Household Type | # Households | Household Size |
| Married-Couple | 9 (11.8%) | 1.89 |
| Single Male/Father | 0 (0.0%) | - |
| Single Female/Mother | 10 (13.2%) | 1.90 |
| Non-family | 57 (75.0%) | 1.05 |
| Total Households | 76 (100.0%) | 1.26 |
Household Size by Marriage Status in Zeeland
Out of a total of 76 households in Zeeland, 19 (25.0%) are family households, while 57 (75.0%) are nonfamily households. The most numerous type of family households are 2-person households, comprising 15, and the most common type of nonfamily households are 1-person households, comprising 46.
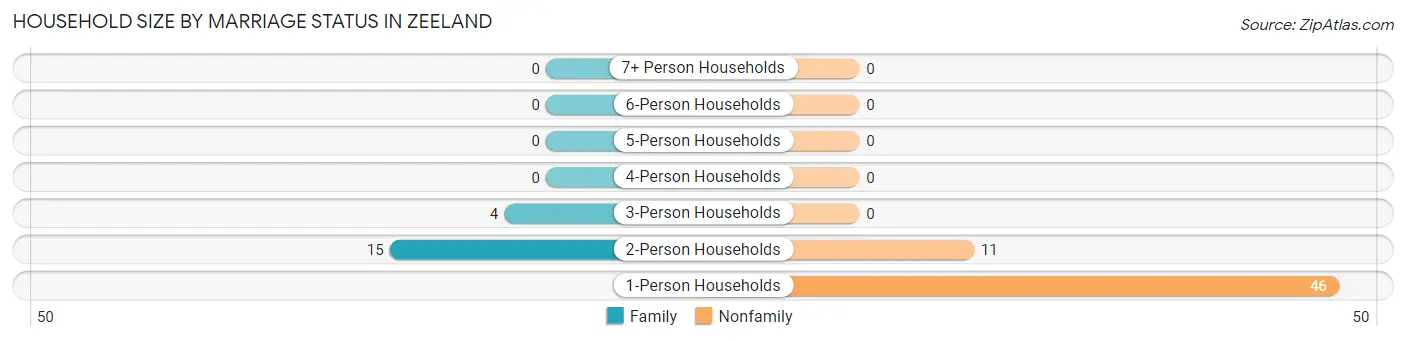
| Household Size | Family Households | Nonfamily Households |
| 1-Person Households | - | 46 (60.5%) |
| 2-Person Households | 15 (19.7%) | 11 (14.5%) |
| 3-Person Households | 4 (5.3%) | 0 (0.0%) |
| 4-Person Households | 0 (0.0%) | 0 (0.0%) |
| 5-Person Households | 0 (0.0%) | 0 (0.0%) |
| 6-Person Households | 0 (0.0%) | 0 (0.0%) |
| 7+ Person Households | 0 (0.0%) | 0 (0.0%) |
| Total | 19 (25.0%) | 57 (75.0%) |
Female Fertility in Zeeland
Fertility by Age in Zeeland
| Age Bracket | Women with Births | Births / 1,000 Women |
| 15 to 19 years | 0 (0.0%) | 0.0 |
| 20 to 34 years | 0 (0.0%) | 0.0 |
| 35 to 50 years | 0 (0.0%) | 0.0 |
| Total | 0 (0.0%) | 0.0 |
Fertility by Age by Marriage Status in Zeeland
| Age Bracket | Married | Unmarried |
| 15 to 19 years | 0 (0.0%) | 0 (0.0%) |
| 20 to 34 years | 0 (0.0%) | 0 (0.0%) |
| 35 to 50 years | 0 (0.0%) | 0 (0.0%) |
| Total | 0 (0.0%) | 0 (0.0%) |
Fertility by Education in Zeeland
| Educational Attainment | Women with Births | Births / 1,000 Women |
| Less than High School | 0 (0.0%) | 0.0 |
| High School Diploma | 0 (0.0%) | 0.0 |
| College or Associate's Degree | 0 (0.0%) | 0.0 |
| Bachelor's Degree | 0 (0.0%) | 0.0 |
| Graduate Degree | 0 (0.0%) | 0.0 |
| Total | 0 (0.0%) | 0.0 |
Fertility by Education by Marriage Status in Zeeland
| Educational Attainment | Married | Unmarried |
| Less than High School | 0 (0.0%) | 0 (0.0%) |
| High School Diploma | 0 (0.0%) | 0 (0.0%) |
| College or Associate's Degree | 0 (0.0%) | 0 (0.0%) |
| Bachelor's Degree | 0 (0.0%) | 0 (0.0%) |
| Graduate Degree | 0 (0.0%) | 0 (0.0%) |
| Total | 0 (0.0%) | 0 (0.0%) |
Employment Characteristics in Zeeland
Employment by Class of Employer in Zeeland
Among the 49 employed individuals in Zeeland, local government employees (19 | 38.8%), not-for-profit organizations (15 | 30.6%), and private company employees (11 | 22.5%) make up the most common classes of employment.
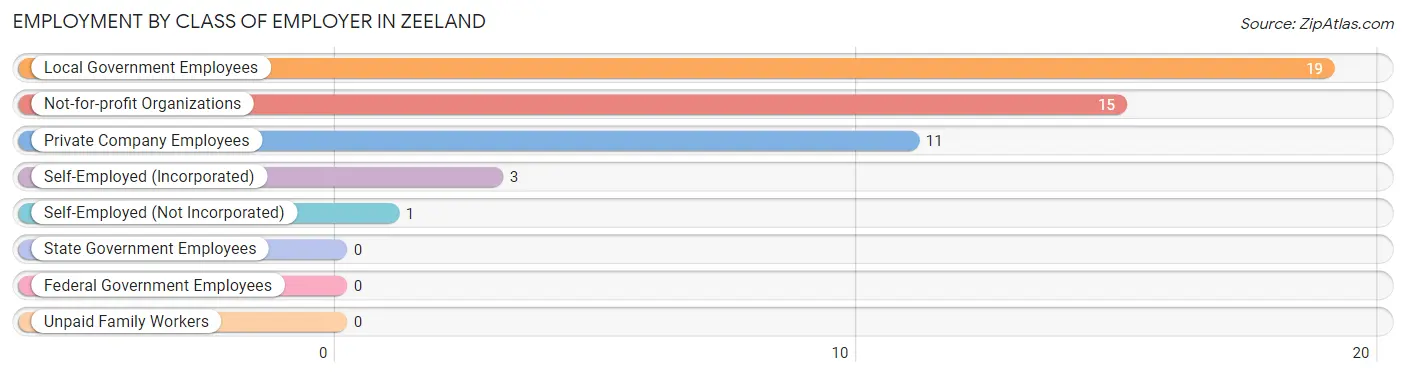
| Employer Class | # Employees | % Employees |
| Private Company Employees | 11 | 22.5% |
| Self-Employed (Incorporated) | 3 | 6.1% |
| Self-Employed (Not Incorporated) | 1 | 2.0% |
| Not-for-profit Organizations | 15 | 30.6% |
| Local Government Employees | 19 | 38.8% |
| State Government Employees | 0 | 0.0% |
| Federal Government Employees | 0 | 0.0% |
| Unpaid Family Workers | 0 | 0.0% |
| Total | 49 | 100.0% |
Employment Status by Age in Zeeland
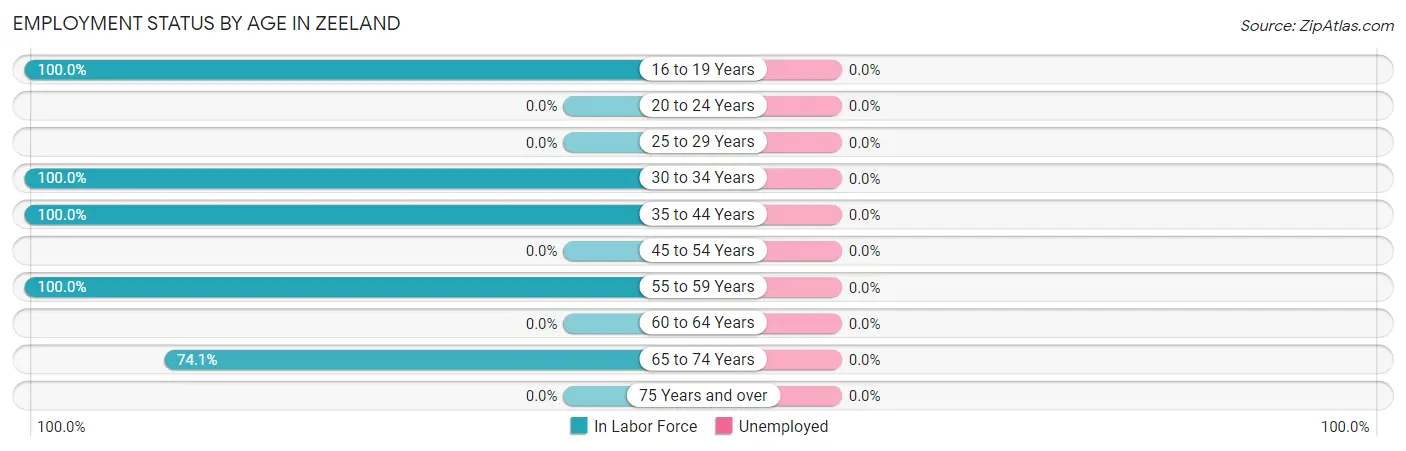
| Age Bracket | In Labor Force | Unemployed |
| 16 to 19 Years | 14 (100.0%) | 0 (0.0%) |
| 20 to 24 Years | 0 (0.0%) | 0 (0.0%) |
| 25 to 29 Years | 0 (0.0%) | 0 (0.0%) |
| 30 to 34 Years | 4 (100.0%) | 0 (0.0%) |
| 35 to 44 Years | 7 (100.0%) | 0 (0.0%) |
| 45 to 54 Years | 0 (0.0%) | 0 (0.0%) |
| 55 to 59 Years | 4 (100.0%) | 0 (0.0%) |
| 60 to 64 Years | 0 (0.0%) | 0 (0.0%) |
| 65 to 74 Years | 20 (74.1%) | 0 (0.0%) |
| 75 Years and over | 0 (0.0%) | 0 (0.0%) |
| Total | 49 (54.4%) | 0 (0.0%) |
Employment Status by Educational Attainment in Zeeland
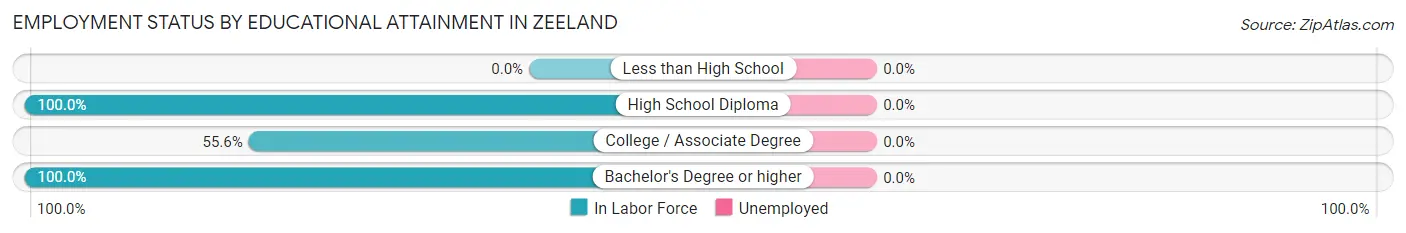
| Educational Attainment | In Labor Force | Unemployed |
| Less than High School | 0 (0.0%) | 0 (0.0%) |
| High School Diploma | 8 (100.0%) | 0 (0.0%) |
| College / Associate Degree | 5 (55.6%) | 0 (0.0%) |
| Bachelor's Degree or higher | 2 (100.0%) | 0 (0.0%) |
| Total | 15 (78.9%) | 0 (0.0%) |
Employment Occupations by Sex in Zeeland
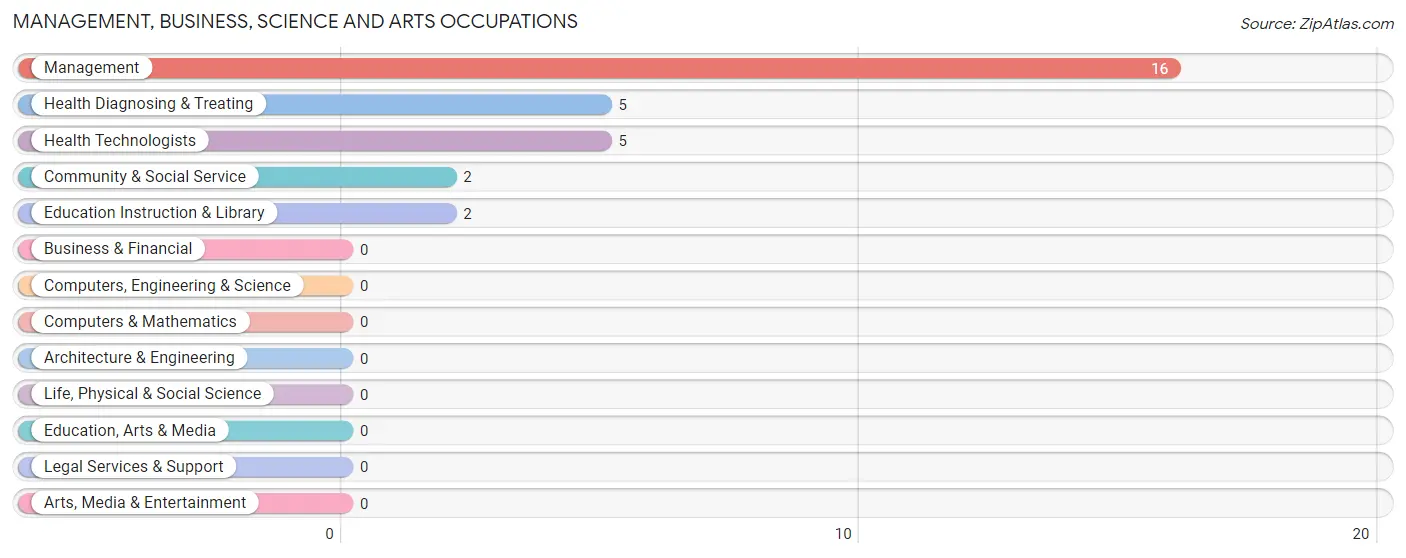
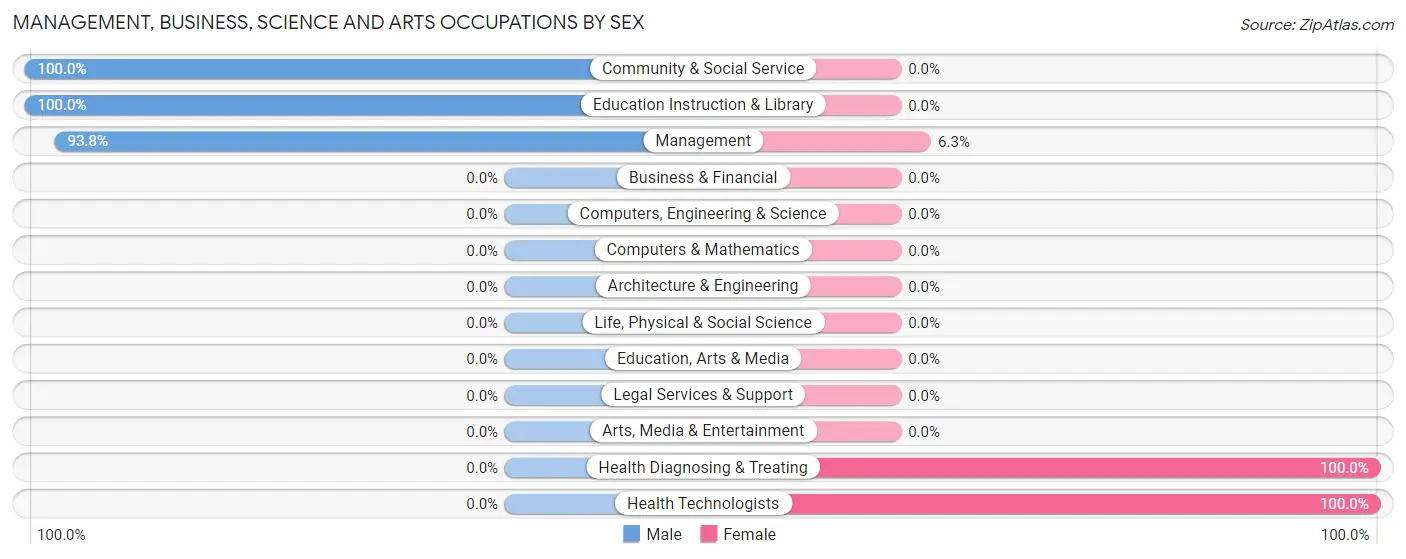
Management, Business, Science and Arts Occupations
The most common Management, Business, Science and Arts occupations in Zeeland are Management (16 | 32.7%), Health Diagnosing & Treating (5 | 10.2%), Health Technologists (5 | 10.2%), Community & Social Service (2 | 4.1%), and Education Instruction & Library (2 | 4.1%).
Management, Business, Science and Arts Occupations by Sex
Within the Management, Business, Science and Arts occupations in Zeeland, the most male-oriented occupations are Community & Social Service (100.0%), Education Instruction & Library (100.0%), and Management (93.8%), while the most female-oriented occupations are Health Diagnosing & Treating (100.0%), Health Technologists (100.0%), and Management (6.2%).
| Occupation | Male | Female |
| Management | 15 (93.8%) | 1 (6.2%) |
| Business & Financial | 0 (0.0%) | 0 (0.0%) |
| Computers, Engineering & Science | 0 (0.0%) | 0 (0.0%) |
| Computers & Mathematics | 0 (0.0%) | 0 (0.0%) |
| Architecture & Engineering | 0 (0.0%) | 0 (0.0%) |
| Life, Physical & Social Science | 0 (0.0%) | 0 (0.0%) |
| Community & Social Service | 2 (100.0%) | 0 (0.0%) |
| Education, Arts & Media | 0 (0.0%) | 0 (0.0%) |
| Legal Services & Support | 0 (0.0%) | 0 (0.0%) |
| Education Instruction & Library | 2 (100.0%) | 0 (0.0%) |
| Arts, Media & Entertainment | 0 (0.0%) | 0 (0.0%) |
| Health Diagnosing & Treating | 0 (0.0%) | 5 (100.0%) |
| Health Technologists | 0 (0.0%) | 5 (100.0%) |
| Total (Category) | 17 (73.9%) | 6 (26.1%) |
| Total (Overall) | 36 (73.5%) | 13 (26.5%) |
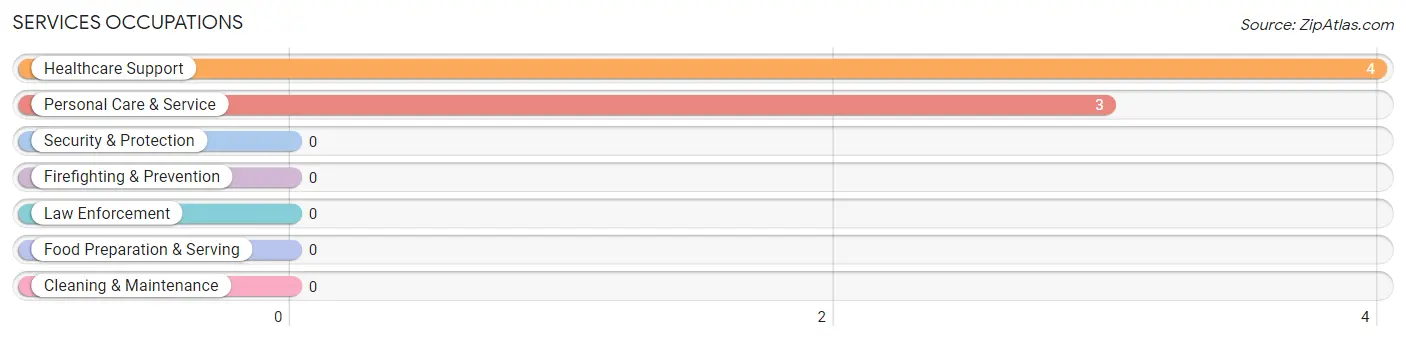
Services Occupations
The most common Services occupations in Zeeland are Healthcare Support (4 | 8.2%), and Personal Care & Service (3 | 6.1%).
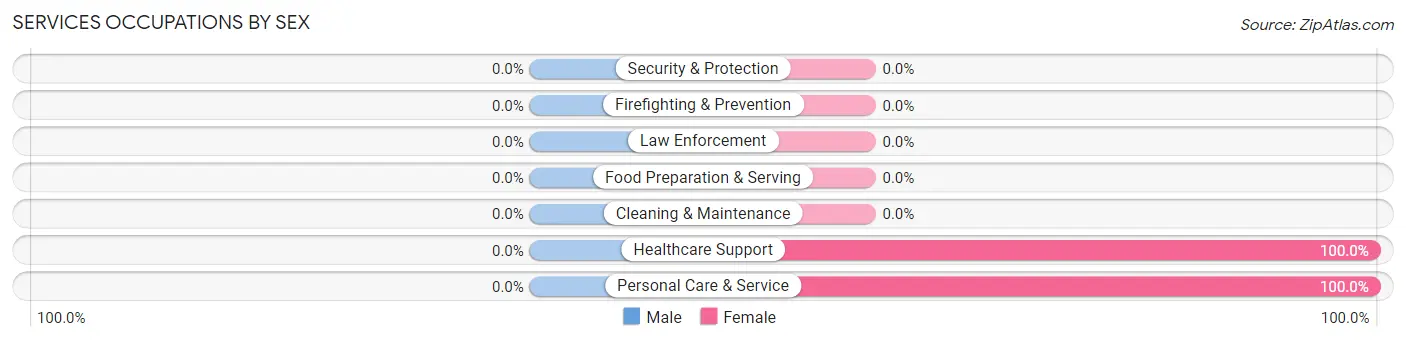
Services Occupations by Sex
| Occupation | Male | Female |
| Healthcare Support | 0 (0.0%) | 4 (100.0%) |
| Security & Protection | 0 (0.0%) | 0 (0.0%) |
| Firefighting & Prevention | 0 (0.0%) | 0 (0.0%) |
| Law Enforcement | 0 (0.0%) | 0 (0.0%) |
| Food Preparation & Serving | 0 (0.0%) | 0 (0.0%) |
| Cleaning & Maintenance | 0 (0.0%) | 0 (0.0%) |
| Personal Care & Service | 0 (0.0%) | 3 (100.0%) |
| Total (Category) | 0 (0.0%) | 7 (100.0%) |
| Total (Overall) | 36 (73.5%) | 13 (26.5%) |
Sales and Office Occupations
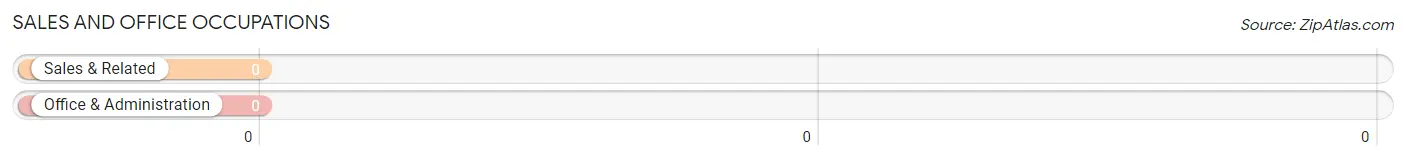
Sales and Office Occupations by Sex
| Occupation | Male | Female |
| Sales & Related | 0 (0.0%) | 0 (0.0%) |
| Office & Administration | 0 (0.0%) | 0 (0.0%) |
| Total (Category) | 0 (0.0%) | 0 (0.0%) |
| Total (Overall) | 36 (73.5%) | 13 (26.5%) |
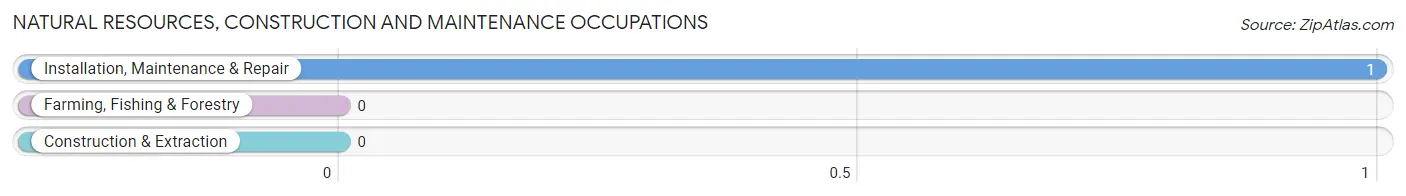
Natural Resources, Construction and Maintenance Occupations
The most common Natural Resources, Construction and Maintenance occupations in Zeeland are , and Installation, Maintenance & Repair (1 | 2.0%).
Natural Resources, Construction and Maintenance Occupations by Sex
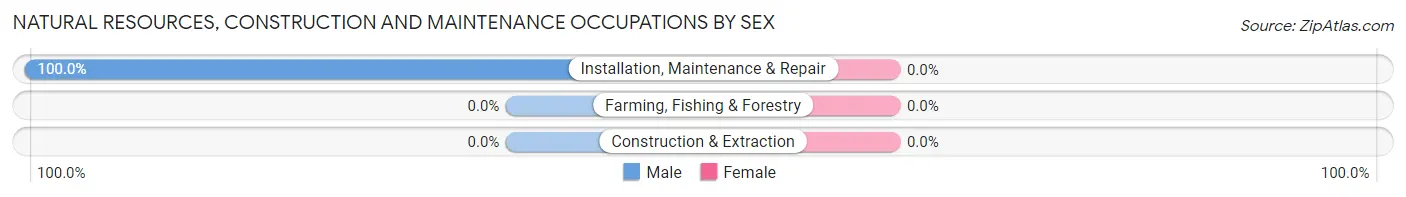
| Occupation | Male | Female |
| Farming, Fishing & Forestry | 0 (0.0%) | 0 (0.0%) |
| Construction & Extraction | 0 (0.0%) | 0 (0.0%) |
| Installation, Maintenance & Repair | 1 (100.0%) | 0 (0.0%) |
| Total (Category) | 1 (100.0%) | 0 (0.0%) |
| Total (Overall) | 36 (73.5%) | 13 (26.5%) |
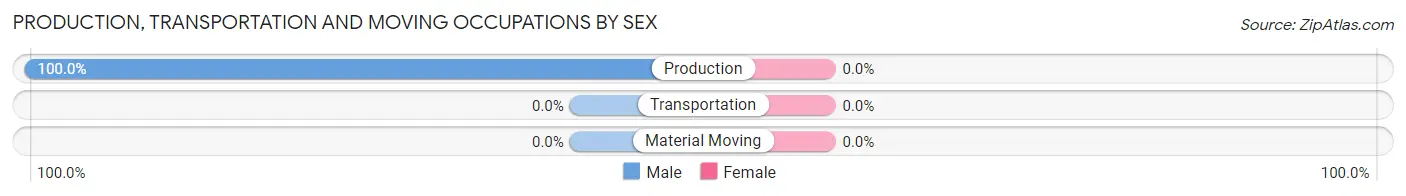
Production, Transportation and Moving Occupations
The most common Production, Transportation and Moving occupations in Zeeland are , and Production (18 | 36.7%).
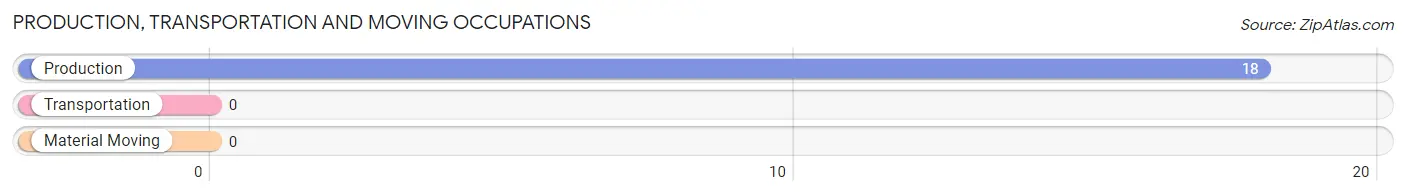
Production, Transportation and Moving Occupations by Sex
| Occupation | Male | Female |
| Production | 18 (100.0%) | 0 (0.0%) |
| Transportation | 0 (0.0%) | 0 (0.0%) |
| Material Moving | 0 (0.0%) | 0 (0.0%) |
| Total (Category) | 18 (100.0%) | 0 (0.0%) |
| Total (Overall) | 36 (73.5%) | 13 (26.5%) |
Employment Industries by Sex in Zeeland
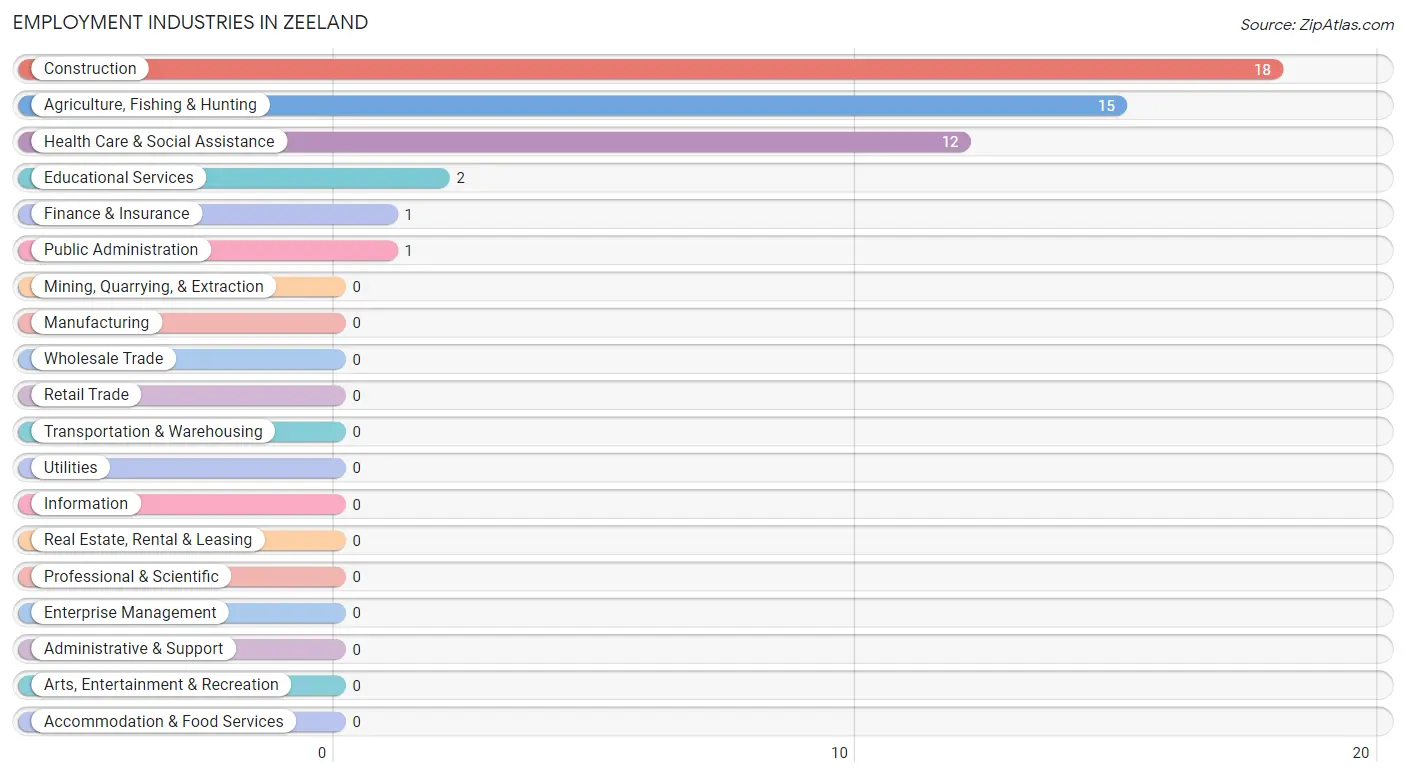
Employment Industries in Zeeland
The major employment industries in Zeeland include Construction (18 | 36.7%), Agriculture, Fishing & Hunting (15 | 30.6%), Health Care & Social Assistance (12 | 24.5%), Educational Services (2 | 4.1%), and Finance & Insurance (1 | 2.0%).
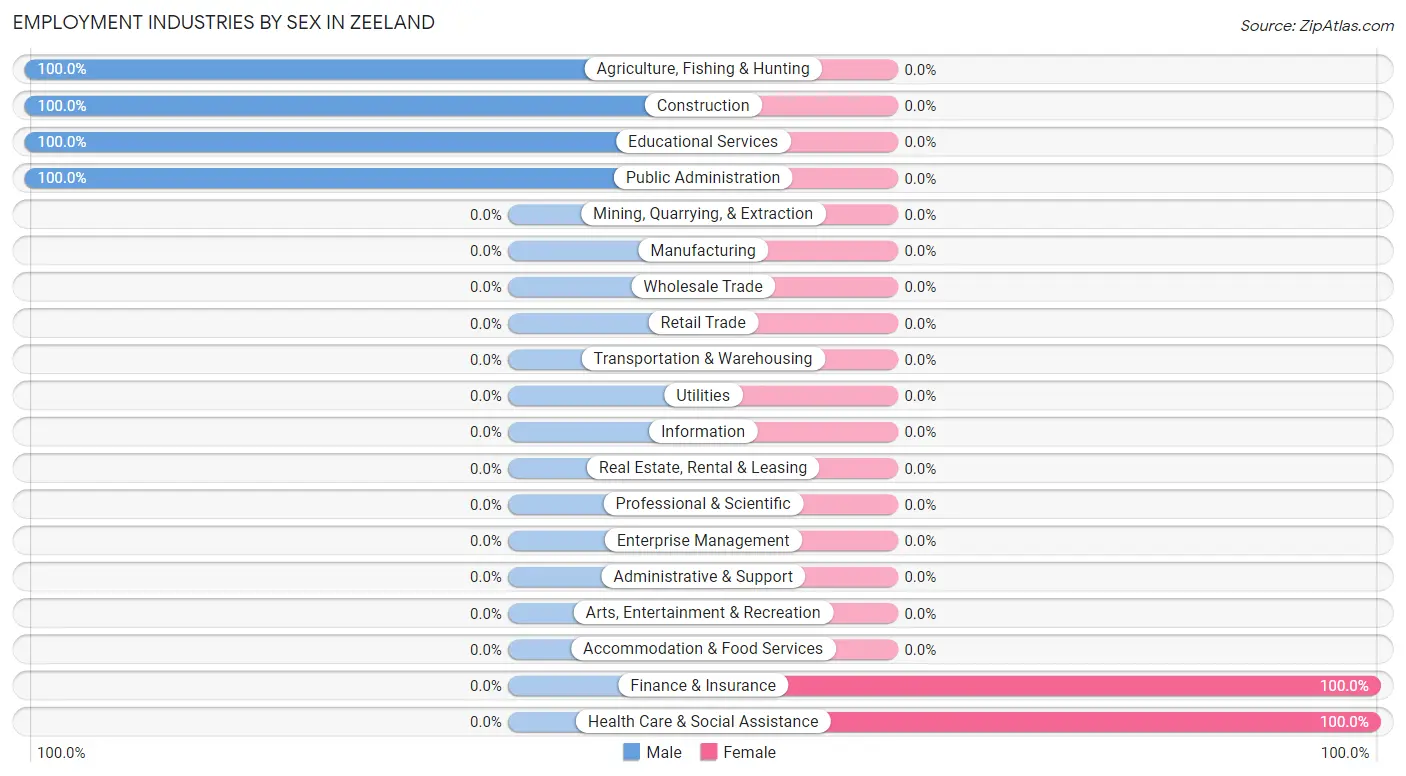
Employment Industries by Sex in Zeeland
The Zeeland industries that see more men than women are Agriculture, Fishing & Hunting (100.0%), Construction (100.0%), and Educational Services (100.0%), whereas the industries that tend to have a higher number of women are Finance & Insurance (100.0%), and Health Care & Social Assistance (100.0%).
| Industry | Male | Female |
| Agriculture, Fishing & Hunting | 15 (100.0%) | 0 (0.0%) |
| Mining, Quarrying, & Extraction | 0 (0.0%) | 0 (0.0%) |
| Construction | 18 (100.0%) | 0 (0.0%) |
| Manufacturing | 0 (0.0%) | 0 (0.0%) |
| Wholesale Trade | 0 (0.0%) | 0 (0.0%) |
| Retail Trade | 0 (0.0%) | 0 (0.0%) |
| Transportation & Warehousing | 0 (0.0%) | 0 (0.0%) |
| Utilities | 0 (0.0%) | 0 (0.0%) |
| Information | 0 (0.0%) | 0 (0.0%) |
| Finance & Insurance | 0 (0.0%) | 1 (100.0%) |
| Real Estate, Rental & Leasing | 0 (0.0%) | 0 (0.0%) |
| Professional & Scientific | 0 (0.0%) | 0 (0.0%) |
| Enterprise Management | 0 (0.0%) | 0 (0.0%) |
| Administrative & Support | 0 (0.0%) | 0 (0.0%) |
| Educational Services | 2 (100.0%) | 0 (0.0%) |
| Health Care & Social Assistance | 0 (0.0%) | 12 (100.0%) |
| Arts, Entertainment & Recreation | 0 (0.0%) | 0 (0.0%) |
| Accommodation & Food Services | 0 (0.0%) | 0 (0.0%) |
| Public Administration | 1 (100.0%) | 0 (0.0%) |
| Total | 36 (73.5%) | 13 (26.5%) |
Education in Zeeland
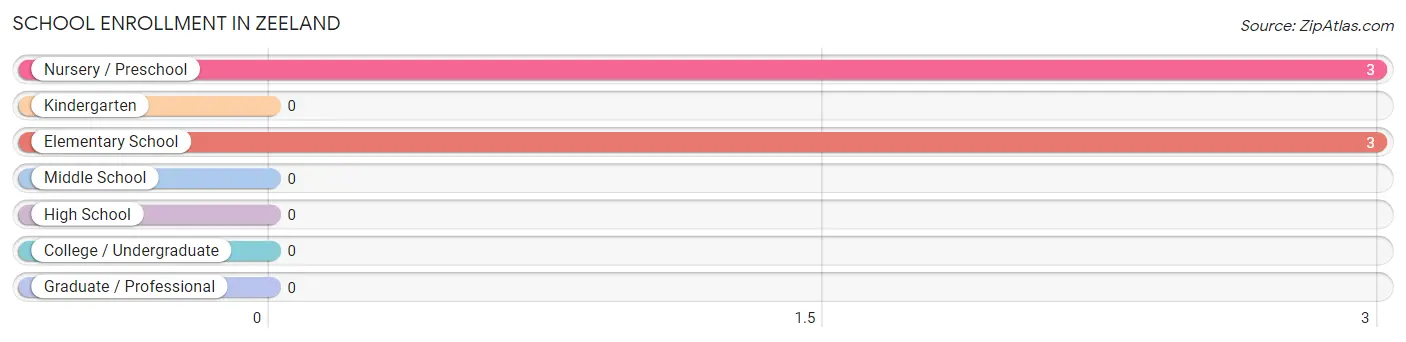
School Enrollment in Zeeland
The most common levels of schooling among the 6 students in Zeeland are nursery / preschool (3 | 50.0%), and elementary school (3 | 50.0%).
| School Level | # Students | % Students |
| Nursery / Preschool | 3 | 50.0% |
| Kindergarten | 0 | 0.0% |
| Elementary School | 3 | 50.0% |
| Middle School | 0 | 0.0% |
| High School | 0 | 0.0% |
| College / Undergraduate | 0 | 0.0% |
| Graduate / Professional | 0 | 0.0% |
| Total | 6 | 100.0% |
School Enrollment by Age by Funding Source in Zeeland
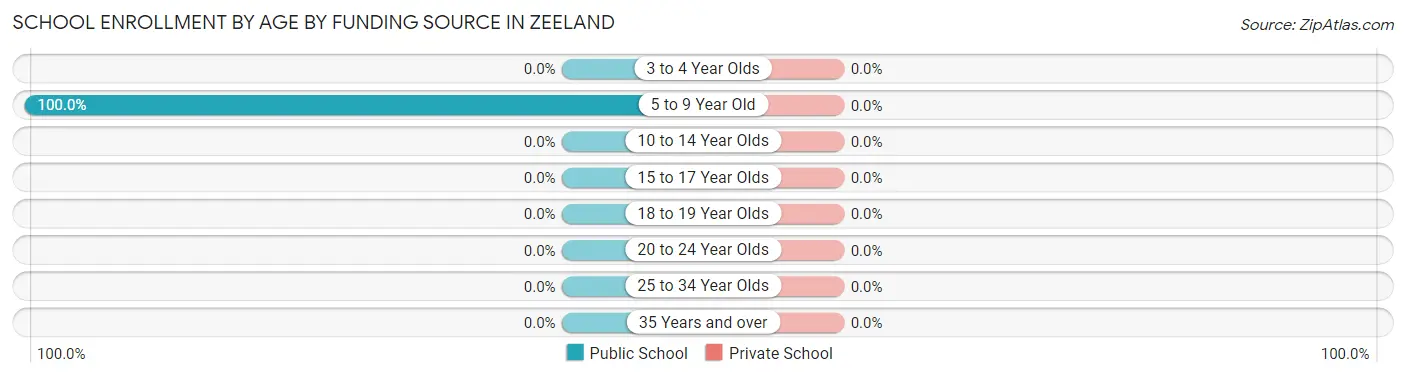
| Age Bracket | Public School | Private School |
| 3 to 4 Year Olds | 0 (0.0%) | 0 (0.0%) |
| 5 to 9 Year Old | 6 (100.0%) | 0 (0.0%) |
| 10 to 14 Year Olds | 0 (0.0%) | 0 (0.0%) |
| 15 to 17 Year Olds | 0 (0.0%) | 0 (0.0%) |
| 18 to 19 Year Olds | 0 (0.0%) | 0 (0.0%) |
| 20 to 24 Year Olds | 0 (0.0%) | 0 (0.0%) |
| 25 to 34 Year Olds | 0 (0.0%) | 0 (0.0%) |
| 35 Years and over | 0 (0.0%) | 0 (0.0%) |
| Total | 6 (100.0%) | 0 (0.0%) |
Educational Attainment by Field of Study in Zeeland
Education (2 | 66.7%), and science & technology (1 | 33.3%) are the most common fields of study among 3 individuals in Zeeland who have obtained a bachelor's degree or higher.
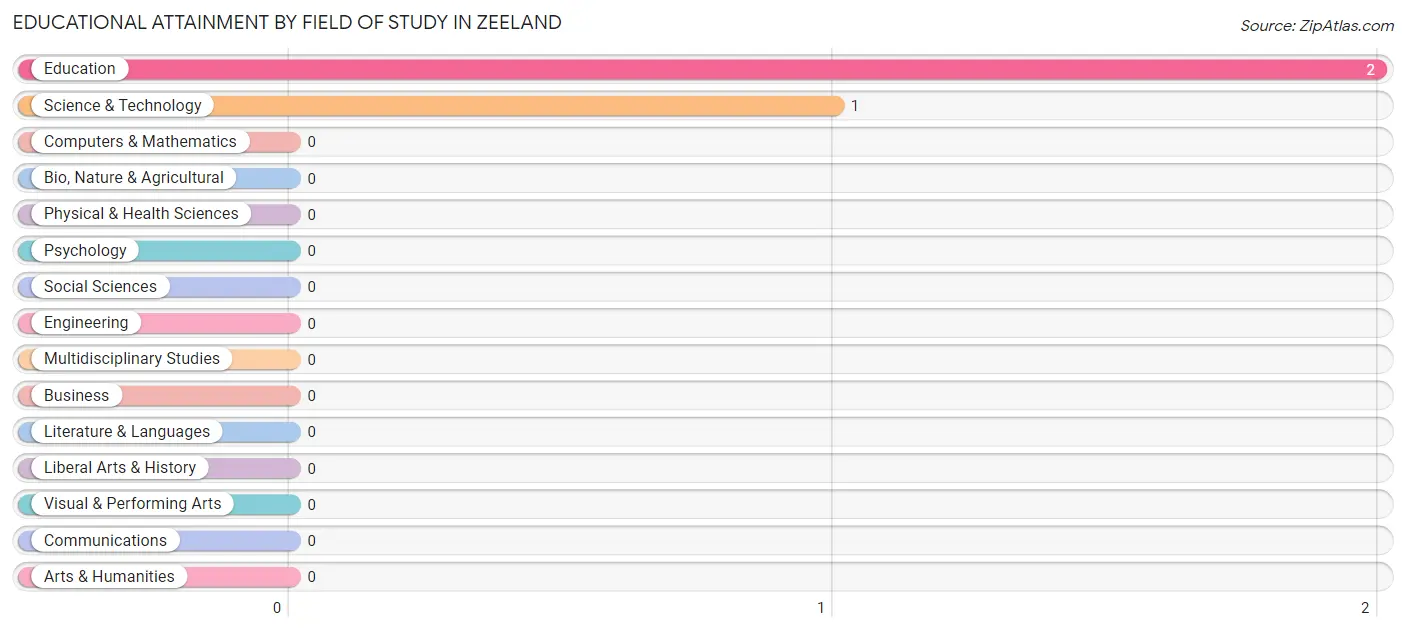
| Field of Study | # Graduates | % Graduates |
| Computers & Mathematics | 0 | 0.0% |
| Bio, Nature & Agricultural | 0 | 0.0% |
| Physical & Health Sciences | 0 | 0.0% |
| Psychology | 0 | 0.0% |
| Social Sciences | 0 | 0.0% |
| Engineering | 0 | 0.0% |
| Multidisciplinary Studies | 0 | 0.0% |
| Science & Technology | 1 | 33.3% |
| Business | 0 | 0.0% |
| Education | 2 | 66.7% |
| Literature & Languages | 0 | 0.0% |
| Liberal Arts & History | 0 | 0.0% |
| Visual & Performing Arts | 0 | 0.0% |
| Communications | 0 | 0.0% |
| Arts & Humanities | 0 | 0.0% |
| Total | 3 | 100.0% |
Transportation & Commute in Zeeland
Vehicle Availability by Sex in Zeeland
The most prevalent vehicle ownership categories in Zeeland are males with 2 vehicles (32, accounting for 88.9%) and females with 2 vehicles (4, making up 246.2%).
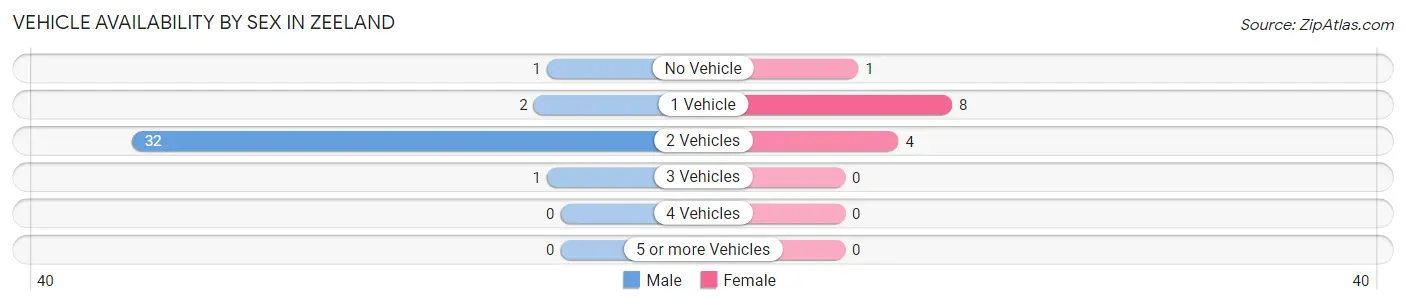
| Vehicles Available | Male | Female |
| No Vehicle | 1 (2.8%) | 1 (7.7%) |
| 1 Vehicle | 2 (5.6%) | 8 (61.5%) |
| 2 Vehicles | 32 (88.9%) | 4 (30.8%) |
| 3 Vehicles | 1 (2.8%) | 0 (0.0%) |
| 4 Vehicles | 0 (0.0%) | 0 (0.0%) |
| 5 or more Vehicles | 0 (0.0%) | 0 (0.0%) |
| Total | 36 (100.0%) | 13 (100.0%) |
Commute Time in Zeeland
The most frequently occuring commute durations in Zeeland are 5 to 9 minutes (32 commuters, 69.6%), 30 to 34 minutes (6 commuters, 13.0%), and 35 to 39 minutes (4 commuters, 8.7%).
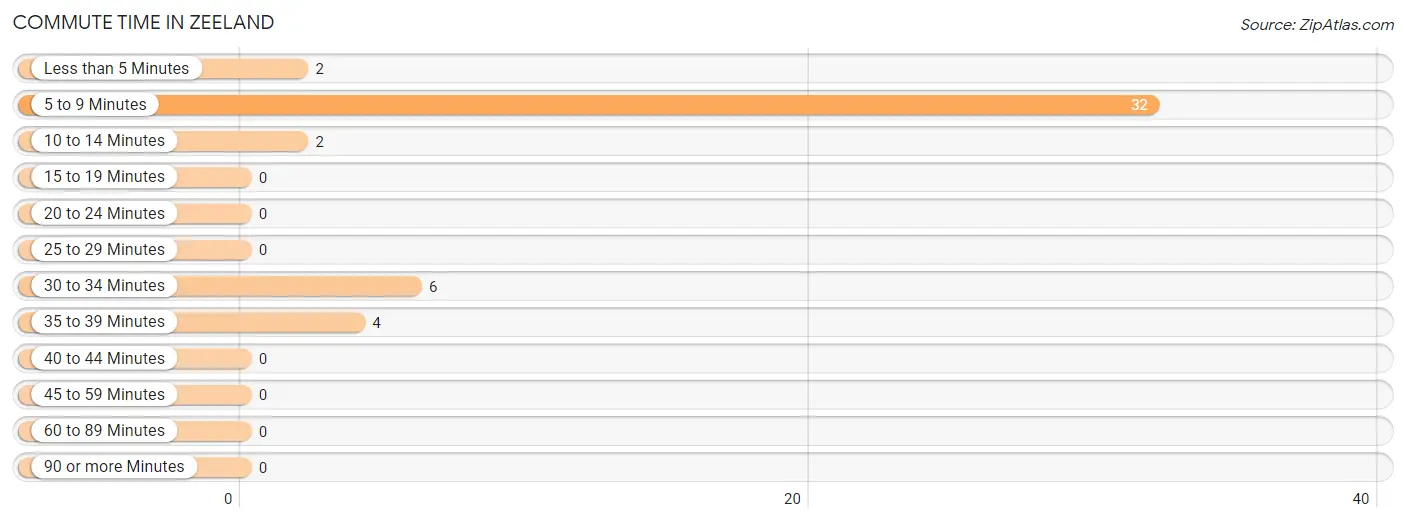
| Commute Time | # Commuters | % Commuters |
| Less than 5 Minutes | 2 | 4.3% |
| 5 to 9 Minutes | 32 | 69.6% |
| 10 to 14 Minutes | 2 | 4.3% |
| 15 to 19 Minutes | 0 | 0.0% |
| 20 to 24 Minutes | 0 | 0.0% |
| 25 to 29 Minutes | 0 | 0.0% |
| 30 to 34 Minutes | 6 | 13.0% |
| 35 to 39 Minutes | 4 | 8.7% |
| 40 to 44 Minutes | 0 | 0.0% |
| 45 to 59 Minutes | 0 | 0.0% |
| 60 to 89 Minutes | 0 | 0.0% |
| 90 or more Minutes | 0 | 0.0% |
Commute Time by Sex in Zeeland
The most common commute times in Zeeland are 5 to 9 minutes (32 commuters, 88.9%) for males and 30 to 34 minutes (6 commuters, 60.0%) for females.
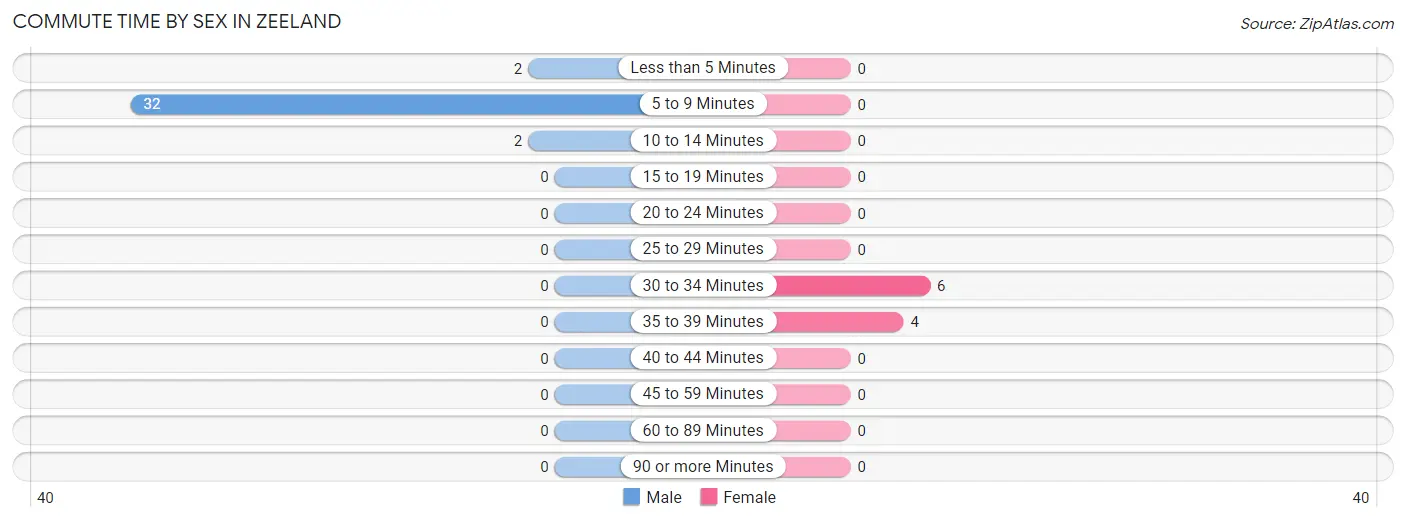
| Commute Time | Male | Female |
| Less than 5 Minutes | 2 (5.6%) | 0 (0.0%) |
| 5 to 9 Minutes | 32 (88.9%) | 0 (0.0%) |
| 10 to 14 Minutes | 2 (5.6%) | 0 (0.0%) |
| 15 to 19 Minutes | 0 (0.0%) | 0 (0.0%) |
| 20 to 24 Minutes | 0 (0.0%) | 0 (0.0%) |
| 25 to 29 Minutes | 0 (0.0%) | 0 (0.0%) |
| 30 to 34 Minutes | 0 (0.0%) | 6 (60.0%) |
| 35 to 39 Minutes | 0 (0.0%) | 4 (40.0%) |
| 40 to 44 Minutes | 0 (0.0%) | 0 (0.0%) |
| 45 to 59 Minutes | 0 (0.0%) | 0 (0.0%) |
| 60 to 89 Minutes | 0 (0.0%) | 0 (0.0%) |
| 90 or more Minutes | 0 (0.0%) | 0 (0.0%) |
Time of Departure to Work by Sex in Zeeland
The most frequent times of departure to work in Zeeland are 7:30 AM to 7:59 AM (30, 83.3%) for males and 12:00 PM to 3:59 PM (9, 90.0%) for females.
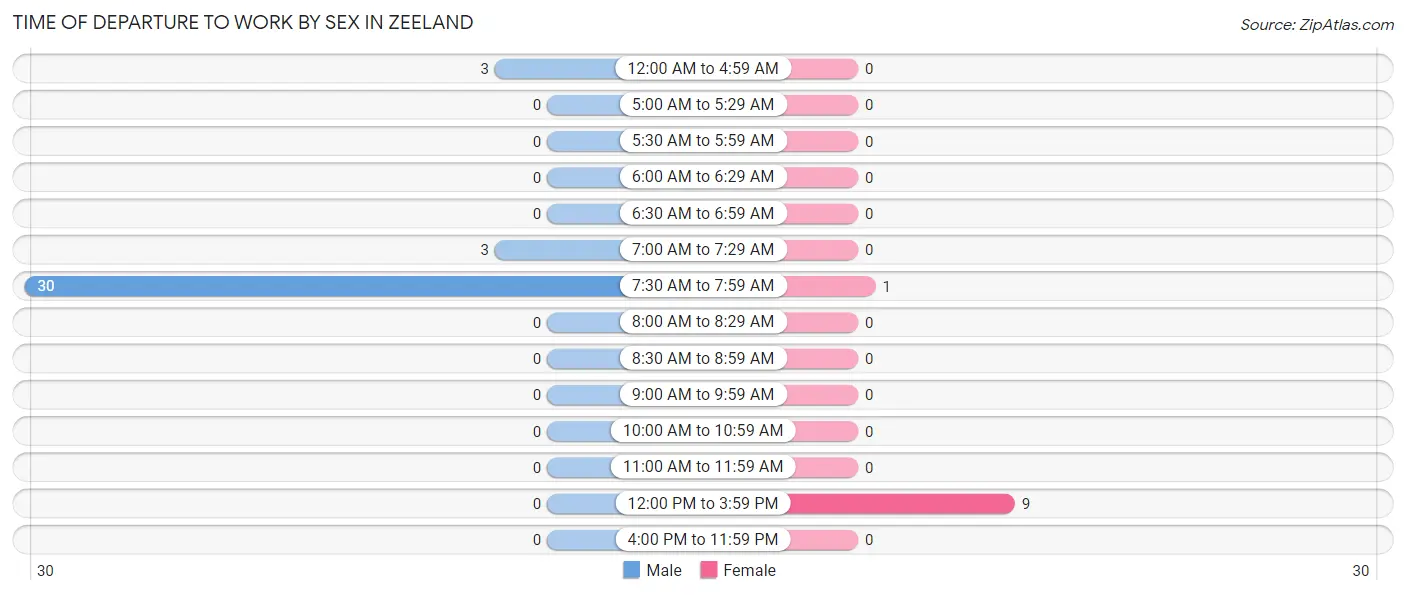
| Time of Departure | Male | Female |
| 12:00 AM to 4:59 AM | 3 (8.3%) | 0 (0.0%) |
| 5:00 AM to 5:29 AM | 0 (0.0%) | 0 (0.0%) |
| 5:30 AM to 5:59 AM | 0 (0.0%) | 0 (0.0%) |
| 6:00 AM to 6:29 AM | 0 (0.0%) | 0 (0.0%) |
| 6:30 AM to 6:59 AM | 0 (0.0%) | 0 (0.0%) |
| 7:00 AM to 7:29 AM | 3 (8.3%) | 0 (0.0%) |
| 7:30 AM to 7:59 AM | 30 (83.3%) | 1 (10.0%) |
| 8:00 AM to 8:29 AM | 0 (0.0%) | 0 (0.0%) |
| 8:30 AM to 8:59 AM | 0 (0.0%) | 0 (0.0%) |
| 9:00 AM to 9:59 AM | 0 (0.0%) | 0 (0.0%) |
| 10:00 AM to 10:59 AM | 0 (0.0%) | 0 (0.0%) |
| 11:00 AM to 11:59 AM | 0 (0.0%) | 0 (0.0%) |
| 12:00 PM to 3:59 PM | 0 (0.0%) | 9 (90.0%) |
| 4:00 PM to 11:59 PM | 0 (0.0%) | 0 (0.0%) |
| Total | 36 (100.0%) | 10 (100.0%) |
Housing Occupancy in Zeeland
Occupancy by Ownership in Zeeland
Of the total 76 dwellings in Zeeland, owner-occupied units account for 60 (78.9%), while renter-occupied units make up 16 (21.0%).
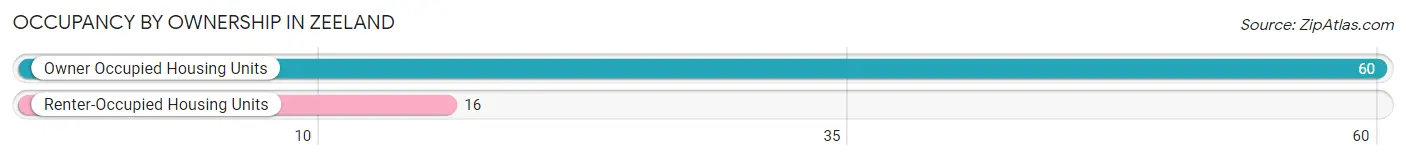
| Occupancy | # Housing Units | % Housing Units |
| Owner Occupied Housing Units | 60 | 78.9% |
| Renter-Occupied Housing Units | 16 | 21.0% |
| Total Occupied Housing Units | 76 | 100.0% |
Occupancy by Household Size in Zeeland
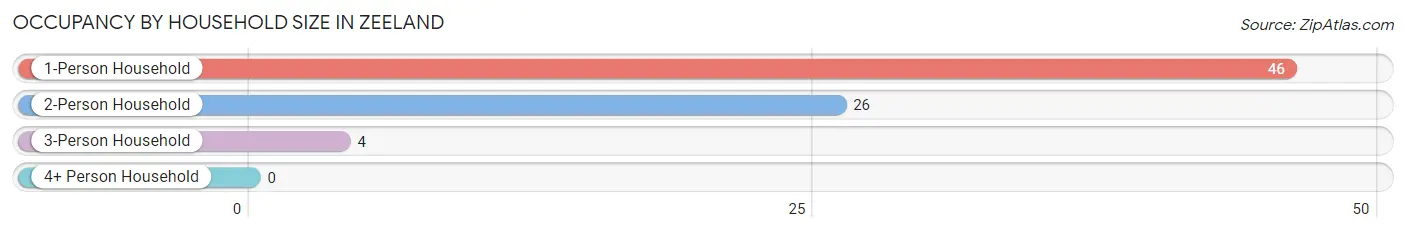
| Household Size | # Housing Units | % Housing Units |
| 1-Person Household | 46 | 60.5% |
| 2-Person Household | 26 | 34.2% |
| 3-Person Household | 4 | 5.3% |
| 4+ Person Household | 0 | 0.0% |
| Total Housing Units | 76 | 100.0% |
Occupancy by Ownership by Household Size in Zeeland
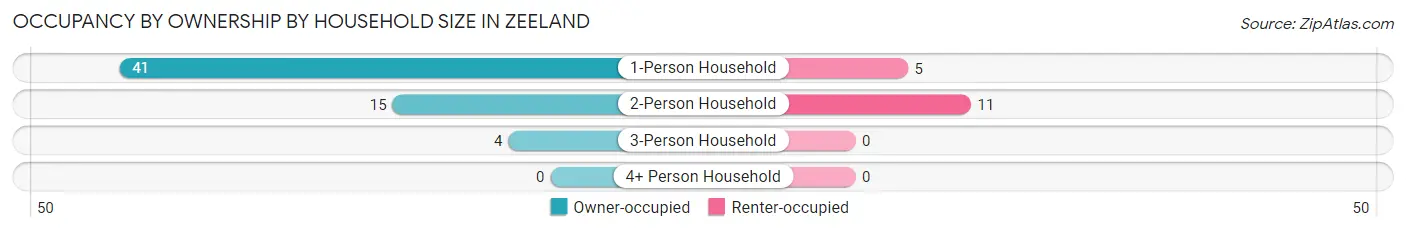
| Household Size | Owner-occupied | Renter-occupied |
| 1-Person Household | 41 (89.1%) | 5 (10.9%) |
| 2-Person Household | 15 (57.7%) | 11 (42.3%) |
| 3-Person Household | 4 (100.0%) | 0 (0.0%) |
| 4+ Person Household | 0 (0.0%) | 0 (0.0%) |
| Total Housing Units | 60 (78.9%) | 16 (21.0%) |
Occupancy by Educational Attainment in Zeeland
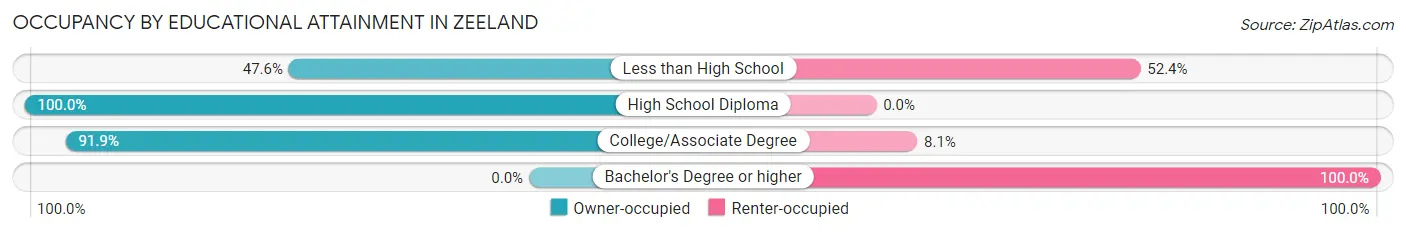
| Household Size | Owner-occupied | Renter-occupied |
| Less than High School | 10 (47.6%) | 11 (52.4%) |
| High School Diploma | 16 (100.0%) | 0 (0.0%) |
| College/Associate Degree | 34 (91.9%) | 3 (8.1%) |
| Bachelor's Degree or higher | 0 (0.0%) | 2 (100.0%) |
Occupancy by Age of Householder in Zeeland
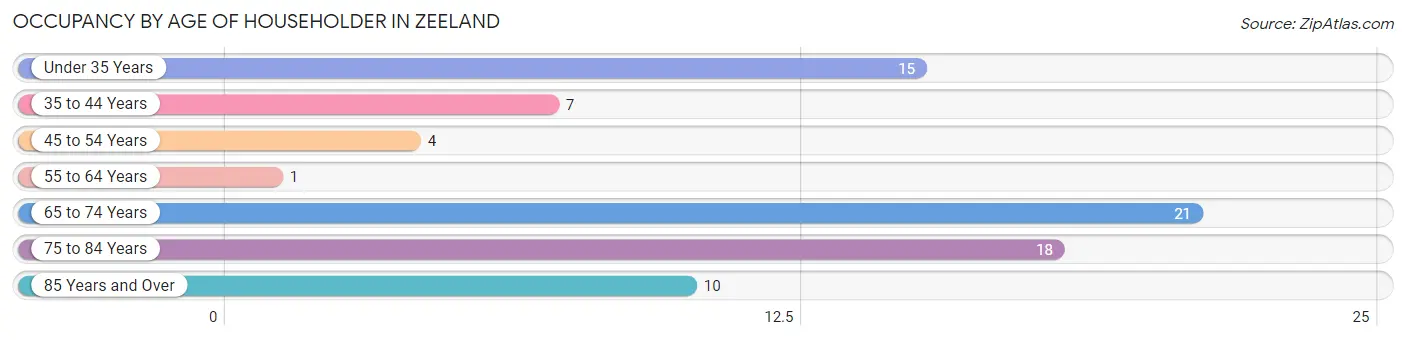
| Age Bracket | # Households | % Households |
| Under 35 Years | 15 | 19.7% |
| 35 to 44 Years | 7 | 9.2% |
| 45 to 54 Years | 4 | 5.3% |
| 55 to 64 Years | 1 | 1.3% |
| 65 to 74 Years | 21 | 27.6% |
| 75 to 84 Years | 18 | 23.7% |
| 85 Years and Over | 10 | 13.2% |
| Total | 76 | 100.0% |
Housing Finances in Zeeland
Median Income by Occupancy in Zeeland
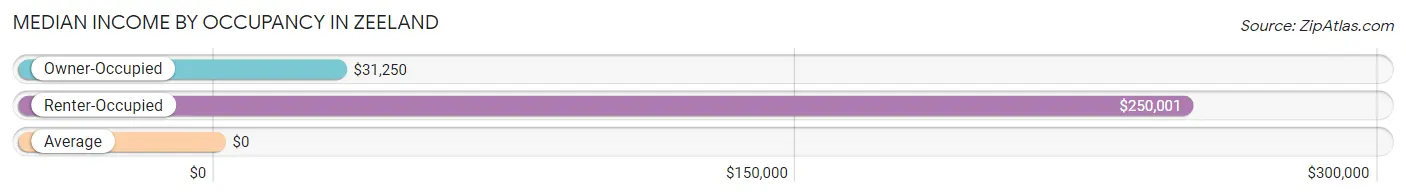
| Occupancy Type | # Households | Median Income |
| Owner-Occupied | 60 (78.9%) | $31,250 |
| Renter-Occupied | 16 (21.0%) | $250,001 |
| Average | 76 (100.0%) | $0 |
Occupancy by Householder Income Bracket in Zeeland
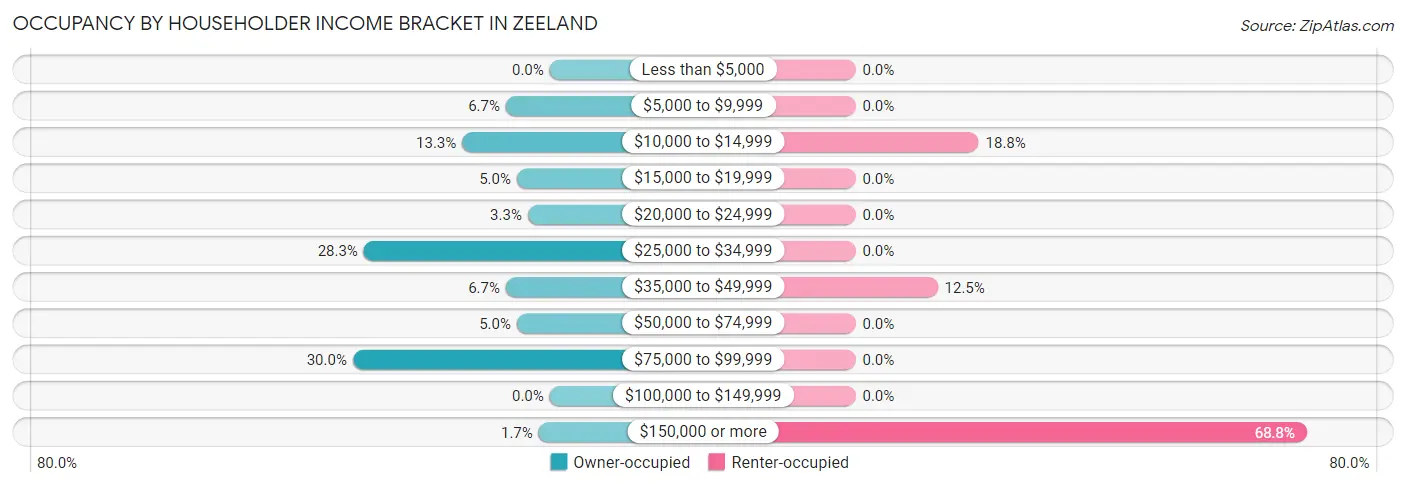
| Income Bracket | Owner-occupied | Renter-occupied |
| Less than $5,000 | 0 (0.0%) | 0 (0.0%) |
| $5,000 to $9,999 | 4 (6.7%) | 0 (0.0%) |
| $10,000 to $14,999 | 8 (13.3%) | 3 (18.8%) |
| $15,000 to $19,999 | 3 (5.0%) | 0 (0.0%) |
| $20,000 to $24,999 | 2 (3.3%) | 0 (0.0%) |
| $25,000 to $34,999 | 17 (28.3%) | 0 (0.0%) |
| $35,000 to $49,999 | 4 (6.7%) | 2 (12.5%) |
| $50,000 to $74,999 | 3 (5.0%) | 0 (0.0%) |
| $75,000 to $99,999 | 18 (30.0%) | 0 (0.0%) |
| $100,000 to $149,999 | 0 (0.0%) | 0 (0.0%) |
| $150,000 or more | 1 (1.7%) | 11 (68.8%) |
| Total | 60 (100.0%) | 16 (100.0%) |
Monthly Housing Cost Tiers in Zeeland
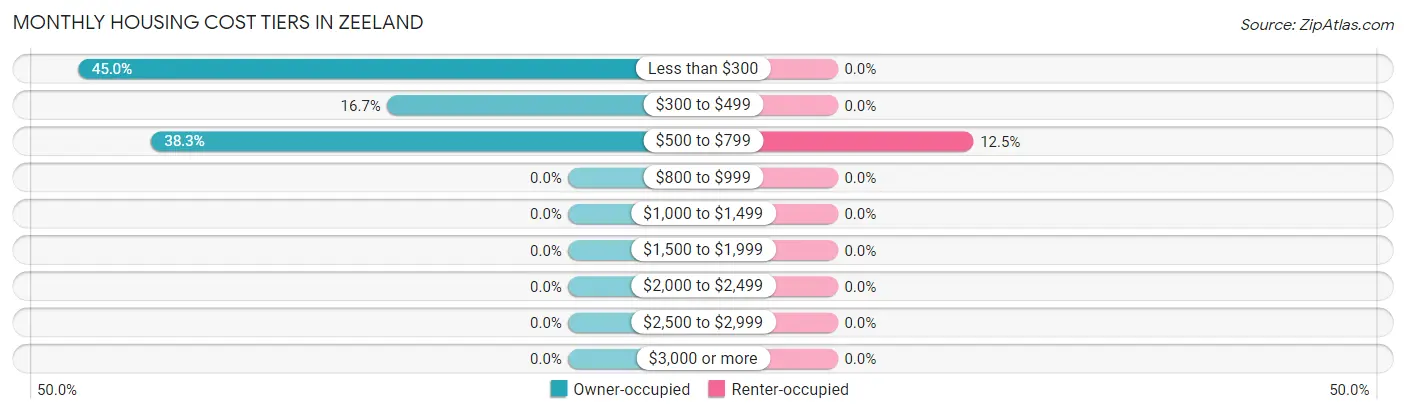
| Monthly Cost | Owner-occupied | Renter-occupied |
| Less than $300 | 27 (45.0%) | 0 (0.0%) |
| $300 to $499 | 10 (16.7%) | 0 (0.0%) |
| $500 to $799 | 23 (38.3%) | 2 (12.5%) |
| $800 to $999 | 0 (0.0%) | 0 (0.0%) |
| $1,000 to $1,499 | 0 (0.0%) | 0 (0.0%) |
| $1,500 to $1,999 | 0 (0.0%) | 0 (0.0%) |
| $2,000 to $2,499 | 0 (0.0%) | 0 (0.0%) |
| $2,500 to $2,999 | 0 (0.0%) | 0 (0.0%) |
| $3,000 or more | 0 (0.0%) | 0 (0.0%) |
| Total | 60 (100.0%) | 16 (100.0%) |
Physical Housing Characteristics in Zeeland
Housing Structures in Zeeland
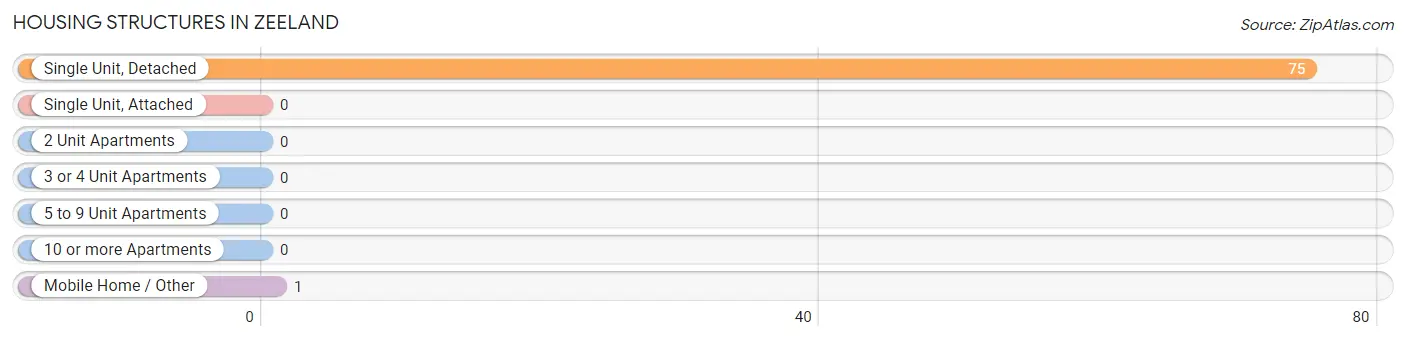
| Structure Type | # Housing Units | % Housing Units |
| Single Unit, Detached | 75 | 98.7% |
| Single Unit, Attached | 0 | 0.0% |
| 2 Unit Apartments | 0 | 0.0% |
| 3 or 4 Unit Apartments | 0 | 0.0% |
| 5 to 9 Unit Apartments | 0 | 0.0% |
| 10 or more Apartments | 0 | 0.0% |
| Mobile Home / Other | 1 | 1.3% |
| Total | 76 | 100.0% |
Housing Structures by Occupancy in Zeeland
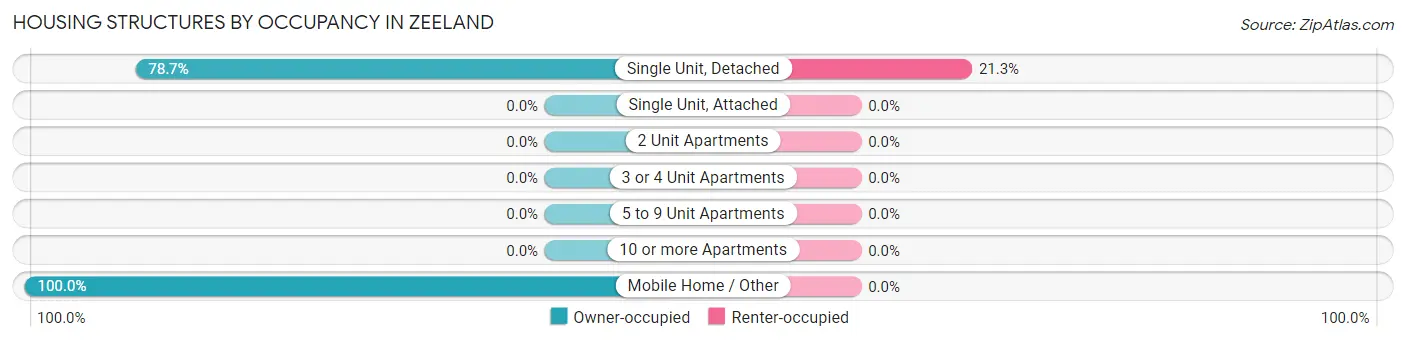
| Structure Type | Owner-occupied | Renter-occupied |
| Single Unit, Detached | 59 (78.7%) | 16 (21.3%) |
| Single Unit, Attached | 0 (0.0%) | 0 (0.0%) |
| 2 Unit Apartments | 0 (0.0%) | 0 (0.0%) |
| 3 or 4 Unit Apartments | 0 (0.0%) | 0 (0.0%) |
| 5 to 9 Unit Apartments | 0 (0.0%) | 0 (0.0%) |
| 10 or more Apartments | 0 (0.0%) | 0 (0.0%) |
| Mobile Home / Other | 1 (100.0%) | 0 (0.0%) |
| Total | 60 (78.9%) | 16 (21.0%) |
Housing Structures by Number of Rooms in Zeeland
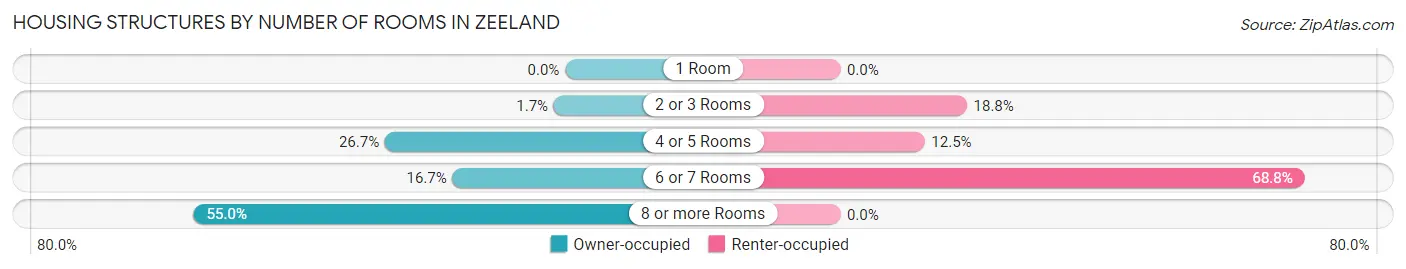
| Number of Rooms | Owner-occupied | Renter-occupied |
| 1 Room | 0 (0.0%) | 0 (0.0%) |
| 2 or 3 Rooms | 1 (1.7%) | 3 (18.8%) |
| 4 or 5 Rooms | 16 (26.7%) | 2 (12.5%) |
| 6 or 7 Rooms | 10 (16.7%) | 11 (68.8%) |
| 8 or more Rooms | 33 (55.0%) | 0 (0.0%) |
| Total | 60 (100.0%) | 16 (100.0%) |
Housing Structure by Heating Type in Zeeland
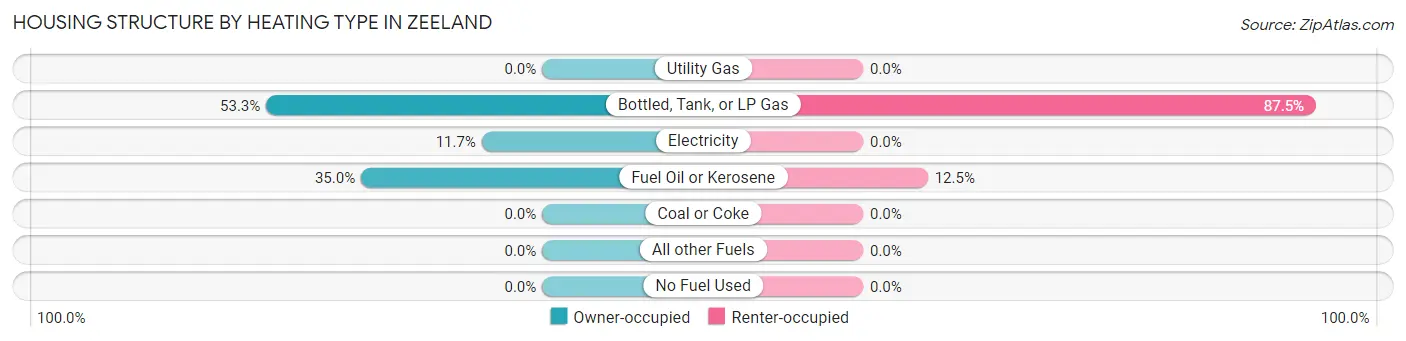
| Heating Type | Owner-occupied | Renter-occupied |
| Utility Gas | 0 (0.0%) | 0 (0.0%) |
| Bottled, Tank, or LP Gas | 32 (53.3%) | 14 (87.5%) |
| Electricity | 7 (11.7%) | 0 (0.0%) |
| Fuel Oil or Kerosene | 21 (35.0%) | 2 (12.5%) |
| Coal or Coke | 0 (0.0%) | 0 (0.0%) |
| All other Fuels | 0 (0.0%) | 0 (0.0%) |
| No Fuel Used | 0 (0.0%) | 0 (0.0%) |
| Total | 60 (100.0%) | 16 (100.0%) |
Household Vehicle Usage in Zeeland
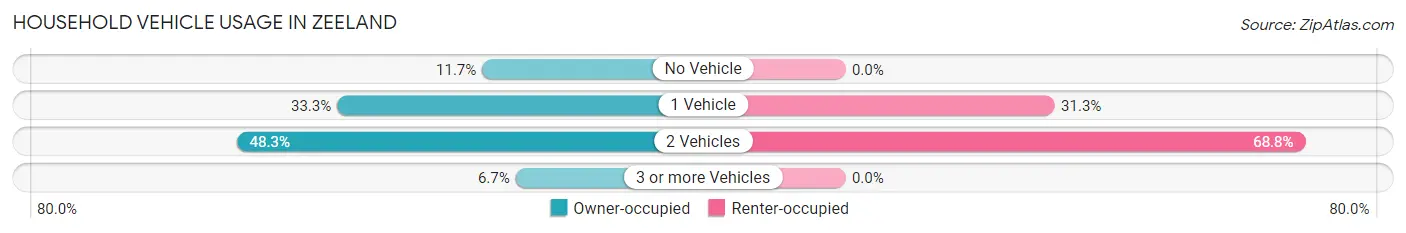
| Vehicles per Household | Owner-occupied | Renter-occupied |
| No Vehicle | 7 (11.7%) | 0 (0.0%) |
| 1 Vehicle | 20 (33.3%) | 5 (31.2%) |
| 2 Vehicles | 29 (48.3%) | 11 (68.8%) |
| 3 or more Vehicles | 4 (6.7%) | 0 (0.0%) |
| Total | 60 (100.0%) | 16 (100.0%) |
Real Estate & Mortgages in Zeeland
Real Estate and Mortgage Overview in Zeeland
| Characteristic | Without Mortgage | With Mortgage |
| Housing Units | 58 | 2 |
| Median Property Value | $21,800 | $0 |
| Median Household Income | $33,125 | $0 |
| Monthly Housing Costs | $314 | $0 |
| Real Estate Taxes | $355 | $0 |
Property Value by Mortgage Status in Zeeland
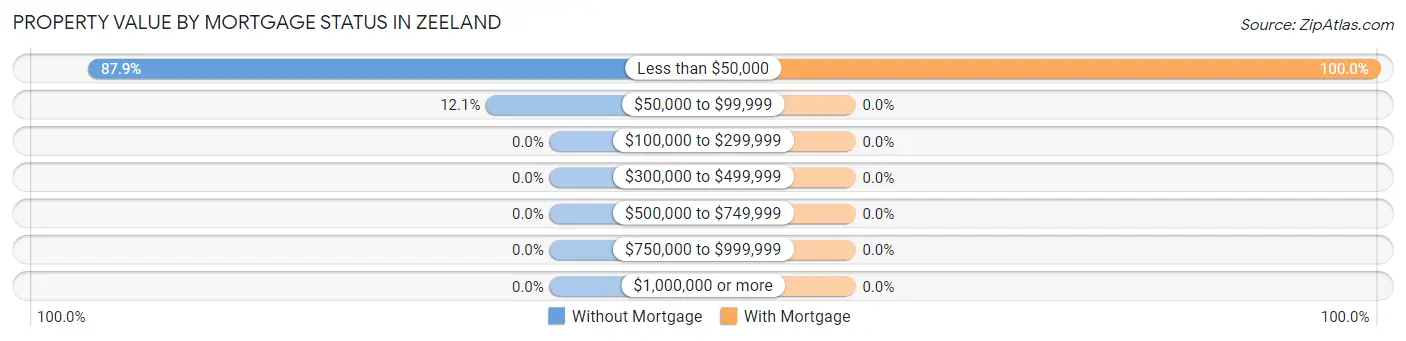
| Property Value | Without Mortgage | With Mortgage |
| Less than $50,000 | 51 (87.9%) | 2 (100.0%) |
| $50,000 to $99,999 | 7 (12.1%) | 0 (0.0%) |
| $100,000 to $299,999 | 0 (0.0%) | 0 (0.0%) |
| $300,000 to $499,999 | 0 (0.0%) | 0 (0.0%) |
| $500,000 to $749,999 | 0 (0.0%) | 0 (0.0%) |
| $750,000 to $999,999 | 0 (0.0%) | 0 (0.0%) |
| $1,000,000 or more | 0 (0.0%) | 0 (0.0%) |
| Total | 58 (100.0%) | 2 (100.0%) |
Household Income by Mortgage Status in Zeeland
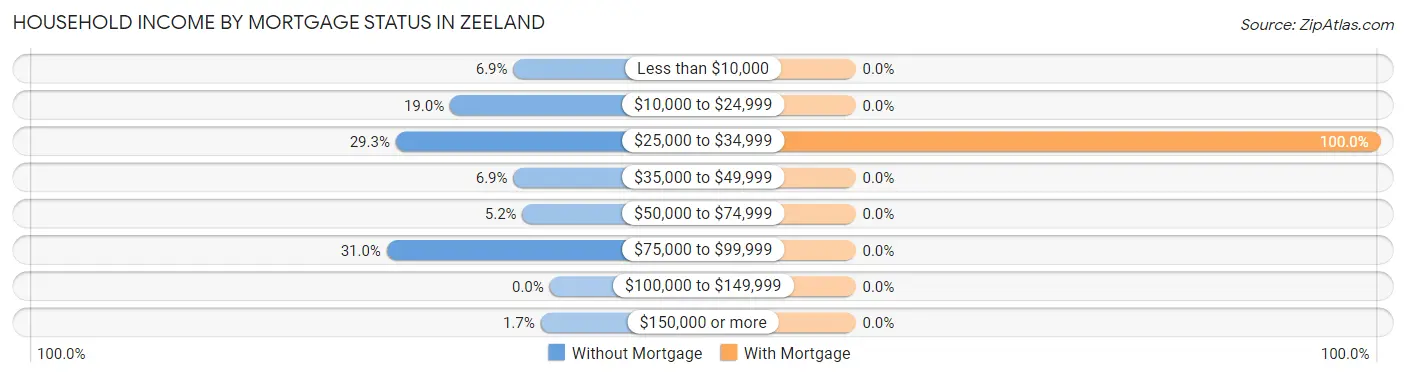
| Household Income | Without Mortgage | With Mortgage |
| Less than $10,000 | 4 (6.9%) | 0 (0.0%) |
| $10,000 to $24,999 | 11 (19.0%) | 0 (0.0%) |
| $25,000 to $34,999 | 17 (29.3%) | 2 (100.0%) |
| $35,000 to $49,999 | 4 (6.9%) | 0 (0.0%) |
| $50,000 to $74,999 | 3 (5.2%) | 0 (0.0%) |
| $75,000 to $99,999 | 18 (31.0%) | 0 (0.0%) |
| $100,000 to $149,999 | 0 (0.0%) | 0 (0.0%) |
| $150,000 or more | 1 (1.7%) | 0 (0.0%) |
| Total | 58 (100.0%) | 2 (100.0%) |
Property Value to Household Income Ratio in Zeeland
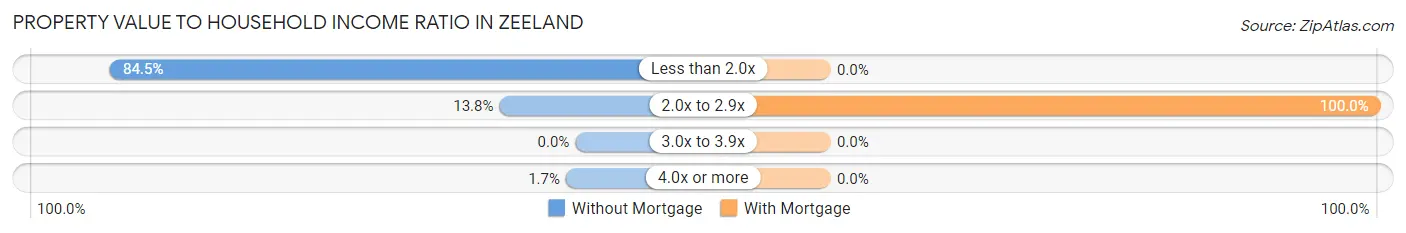
| Value-to-Income Ratio | Without Mortgage | With Mortgage |
| Less than 2.0x | 49 (84.5%) | 0 (0.0%) |
| 2.0x to 2.9x | 8 (13.8%) | 2 (100.0%) |
| 3.0x to 3.9x | 0 (0.0%) | 0 (0.0%) |
| 4.0x or more | 1 (1.7%) | 0 (0.0%) |
| Total | 58 (100.0%) | 2 (100.0%) |
Real Estate Taxes by Mortgage Status in Zeeland
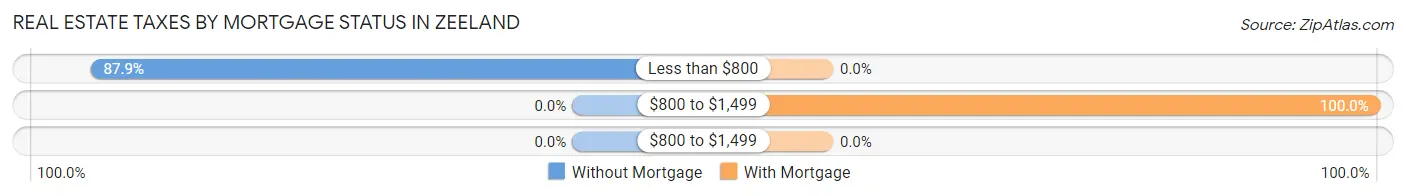
| Property Taxes | Without Mortgage | With Mortgage |
| Less than $800 | 51 (87.9%) | 0 (0.0%) |
| $800 to $1,499 | 0 (0.0%) | 2 (100.0%) |
| $800 to $1,499 | 0 (0.0%) | 0 (0.0%) |
| Total | 58 (100.0%) | 2 (100.0%) |
Health & Disability in Zeeland
Health Insurance Coverage by Age in Zeeland
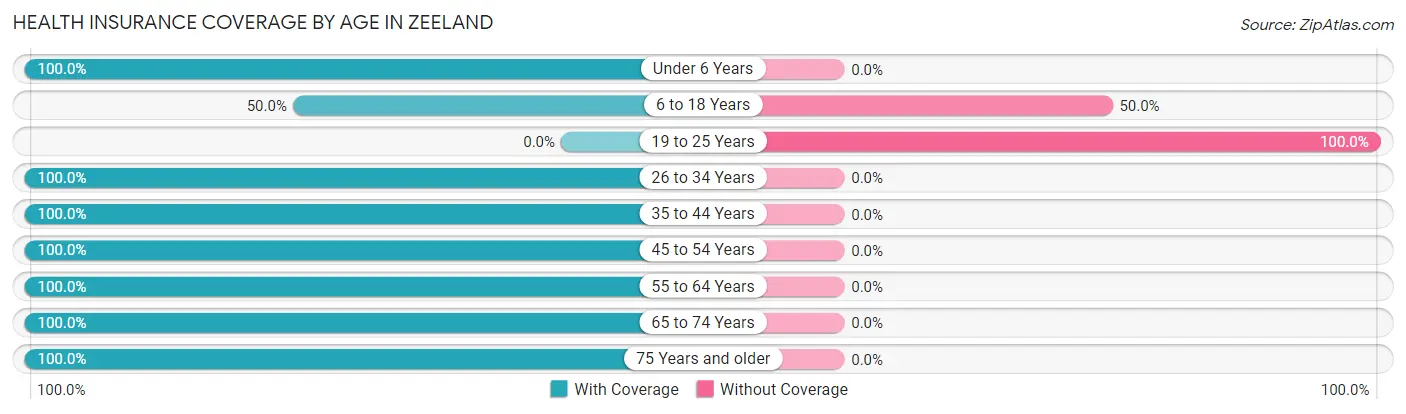
| Age Bracket | With Coverage | Without Coverage |
| Under 6 Years | 3 (100.0%) | 0 (0.0%) |
| 6 to 18 Years | 3 (50.0%) | 3 (50.0%) |
| 19 to 25 Years | 0 (0.0%) | 11 (100.0%) |
| 26 to 34 Years | 4 (100.0%) | 0 (0.0%) |
| 35 to 44 Years | 7 (100.0%) | 0 (0.0%) |
| 45 to 54 Years | 4 (100.0%) | 0 (0.0%) |
| 55 to 64 Years | 4 (100.0%) | 0 (0.0%) |
| 65 to 74 Years | 27 (100.0%) | 0 (0.0%) |
| 75 Years and older | 30 (100.0%) | 0 (0.0%) |
| Total | 82 (85.4%) | 14 (14.6%) |
Health Insurance Coverage by Citizenship Status in Zeeland
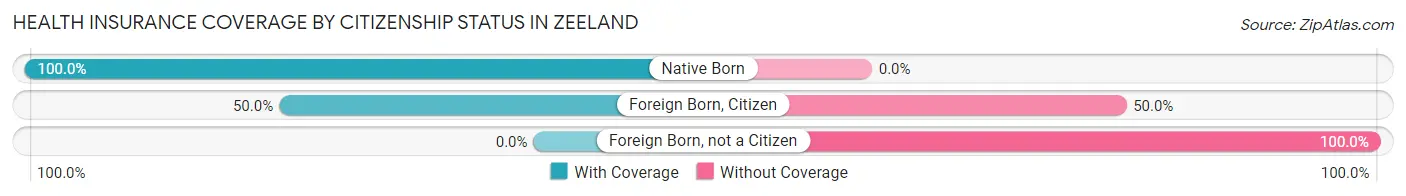
| Citizenship Status | With Coverage | Without Coverage |
| Native Born | 3 (100.0%) | 0 (0.0%) |
| Foreign Born, Citizen | 3 (50.0%) | 3 (50.0%) |
| Foreign Born, not a Citizen | 0 (0.0%) | 11 (100.0%) |
Health Insurance Coverage by Household Income in Zeeland
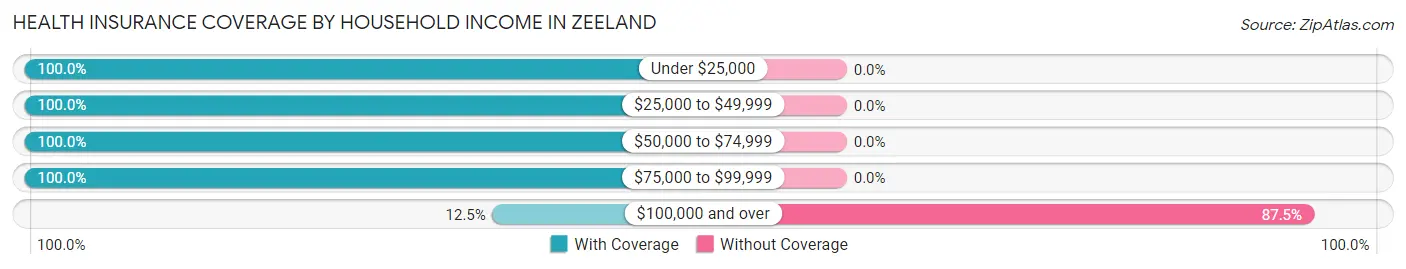
| Household Income | With Coverage | Without Coverage |
| Under $25,000 | 26 (100.0%) | 0 (0.0%) |
| $25,000 to $49,999 | 32 (100.0%) | 0 (0.0%) |
| $50,000 to $74,999 | 4 (100.0%) | 0 (0.0%) |
| $75,000 to $99,999 | 18 (100.0%) | 0 (0.0%) |
| $100,000 and over | 2 (12.5%) | 14 (87.5%) |
Public vs Private Health Insurance Coverage by Age in Zeeland
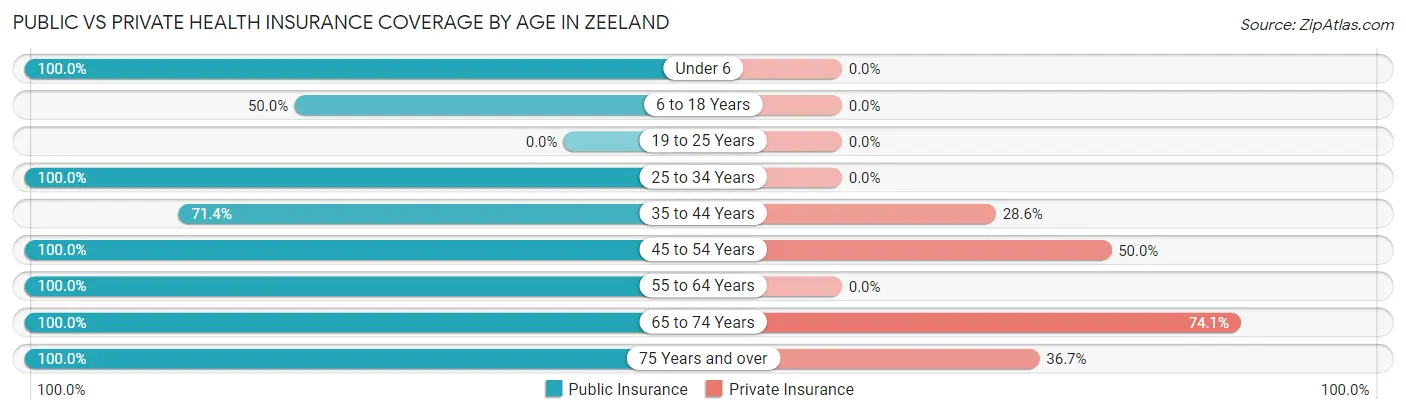
| Age Bracket | Public Insurance | Private Insurance |
| Under 6 | 3 (100.0%) | 0 (0.0%) |
| 6 to 18 Years | 3 (50.0%) | 0 (0.0%) |
| 19 to 25 Years | 0 (0.0%) | 0 (0.0%) |
| 25 to 34 Years | 4 (100.0%) | 0 (0.0%) |
| 35 to 44 Years | 5 (71.4%) | 2 (28.6%) |
| 45 to 54 Years | 4 (100.0%) | 2 (50.0%) |
| 55 to 64 Years | 4 (100.0%) | 0 (0.0%) |
| 65 to 74 Years | 27 (100.0%) | 20 (74.1%) |
| 75 Years and over | 30 (100.0%) | 11 (36.7%) |
| Total | 80 (83.3%) | 35 (36.5%) |
Disability Status by Sex by Age in Zeeland
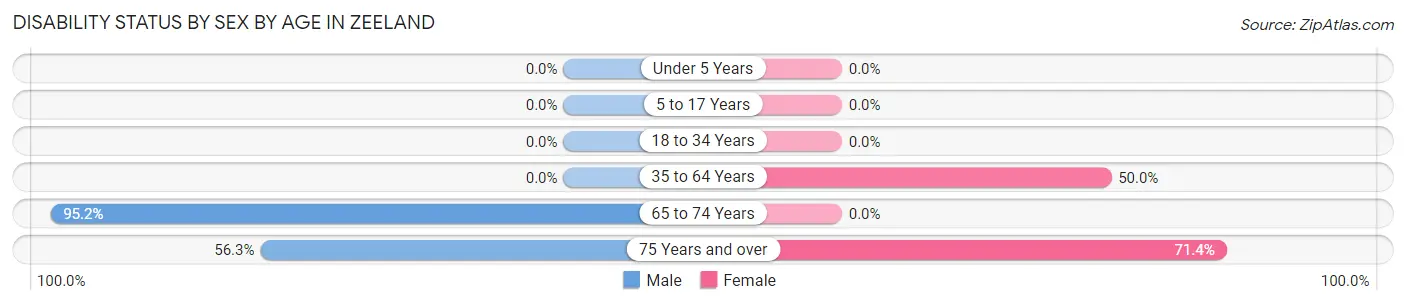
| Age Bracket | Male | Female |
| Under 5 Years | 0 (0.0%) | 0 (0.0%) |
| 5 to 17 Years | 0 (0.0%) | 0 (0.0%) |
| 18 to 34 Years | 0 (0.0%) | 0 (0.0%) |
| 35 to 64 Years | 0 (0.0%) | 5 (50.0%) |
| 65 to 74 Years | 20 (95.2%) | 0 (0.0%) |
| 75 Years and over | 9 (56.2%) | 10 (71.4%) |
Disability Class by Sex by Age in Zeeland
Disability Class: Hearing Difficulty
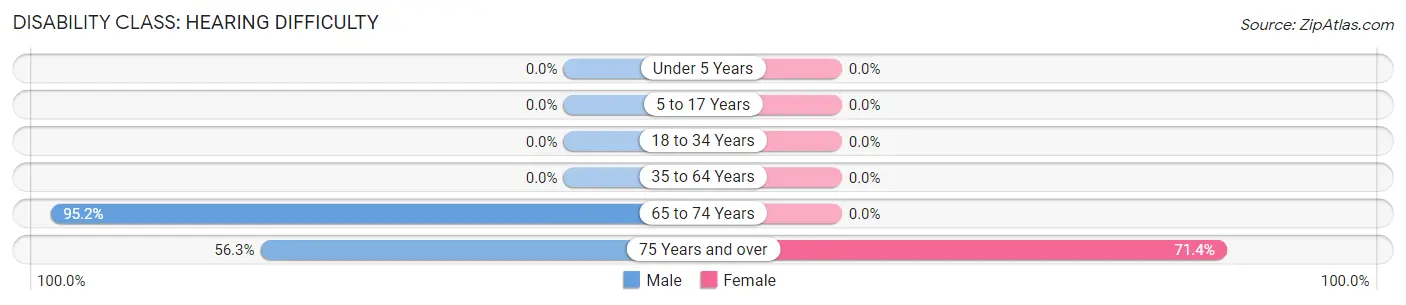
| Age Bracket | Male | Female |
| Under 5 Years | 0 (0.0%) | 0 (0.0%) |
| 5 to 17 Years | 0 (0.0%) | 0 (0.0%) |
| 18 to 34 Years | 0 (0.0%) | 0 (0.0%) |
| 35 to 64 Years | 0 (0.0%) | 0 (0.0%) |
| 65 to 74 Years | 20 (95.2%) | 0 (0.0%) |
| 75 Years and over | 9 (56.2%) | 10 (71.4%) |
Disability Class: Vision Difficulty
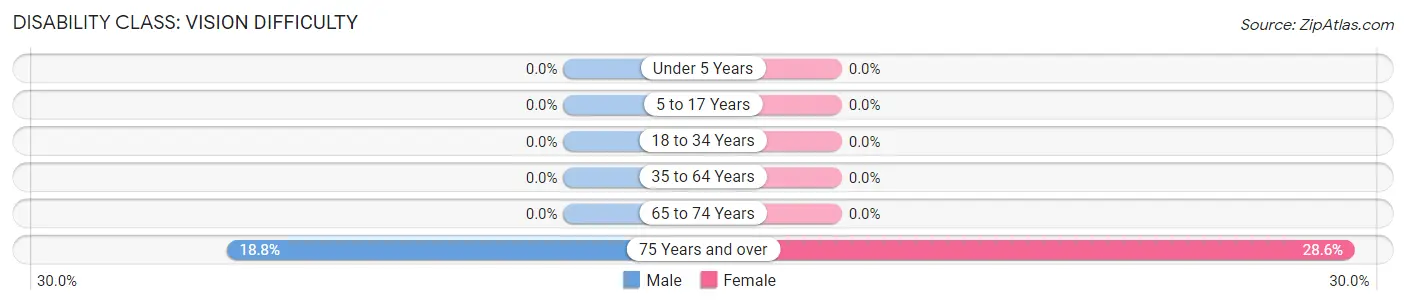
| Age Bracket | Male | Female |
| Under 5 Years | 0 (0.0%) | 0 (0.0%) |
| 5 to 17 Years | 0 (0.0%) | 0 (0.0%) |
| 18 to 34 Years | 0 (0.0%) | 0 (0.0%) |
| 35 to 64 Years | 0 (0.0%) | 0 (0.0%) |
| 65 to 74 Years | 0 (0.0%) | 0 (0.0%) |
| 75 Years and over | 3 (18.8%) | 4 (28.6%) |
Disability Class: Cognitive Difficulty
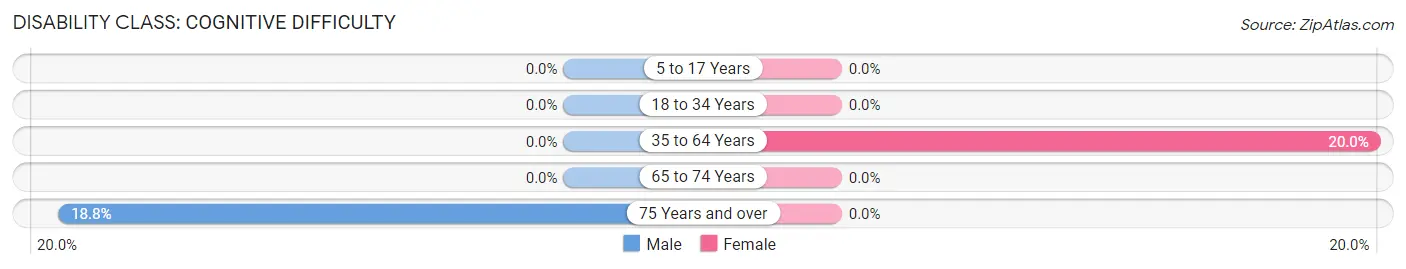
| Age Bracket | Male | Female |
| 5 to 17 Years | 0 (0.0%) | 0 (0.0%) |
| 18 to 34 Years | 0 (0.0%) | 0 (0.0%) |
| 35 to 64 Years | 0 (0.0%) | 2 (20.0%) |
| 65 to 74 Years | 0 (0.0%) | 0 (0.0%) |
| 75 Years and over | 3 (18.8%) | 0 (0.0%) |
Disability Class: Ambulatory Difficulty
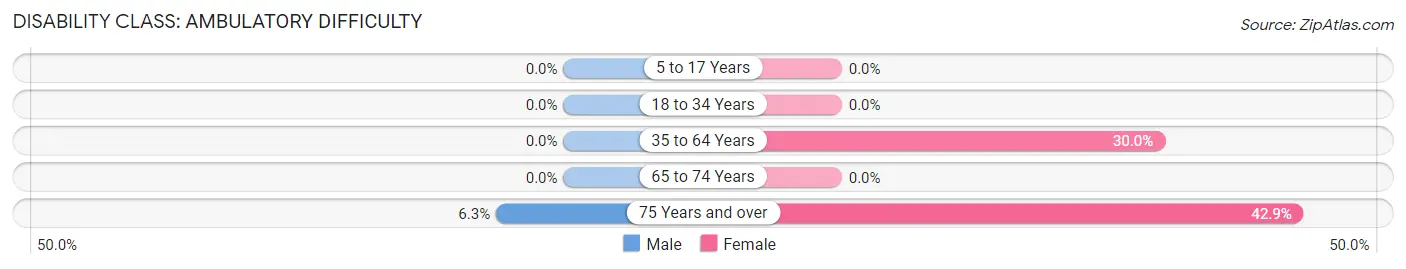
| Age Bracket | Male | Female |
| 5 to 17 Years | 0 (0.0%) | 0 (0.0%) |
| 18 to 34 Years | 0 (0.0%) | 0 (0.0%) |
| 35 to 64 Years | 0 (0.0%) | 3 (30.0%) |
| 65 to 74 Years | 0 (0.0%) | 0 (0.0%) |
| 75 Years and over | 1 (6.2%) | 6 (42.9%) |
Disability Class: Self-Care Difficulty
| Age Bracket | Male | Female |
| 5 to 17 Years | 0 (0.0%) | 0 (0.0%) |
| 18 to 34 Years | 0 (0.0%) | 0 (0.0%) |
| 35 to 64 Years | 0 (0.0%) | 0 (0.0%) |
| 65 to 74 Years | 0 (0.0%) | 0 (0.0%) |
| 75 Years and over | 0 (0.0%) | 0 (0.0%) |
Technology Access in Zeeland
Computing Device Access in Zeeland
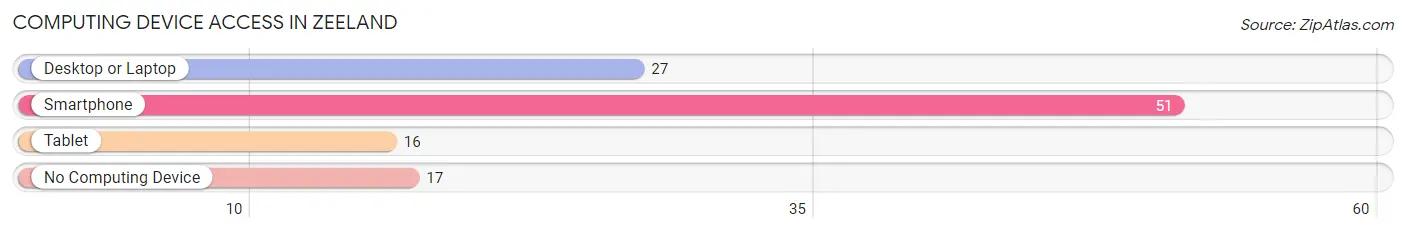
| Device Type | # Households | % Households |
| Desktop or Laptop | 27 | 35.5% |
| Smartphone | 51 | 67.1% |
| Tablet | 16 | 21.0% |
| No Computing Device | 17 | 22.4% |
| Total | 76 | 100.0% |
Internet Access in Zeeland
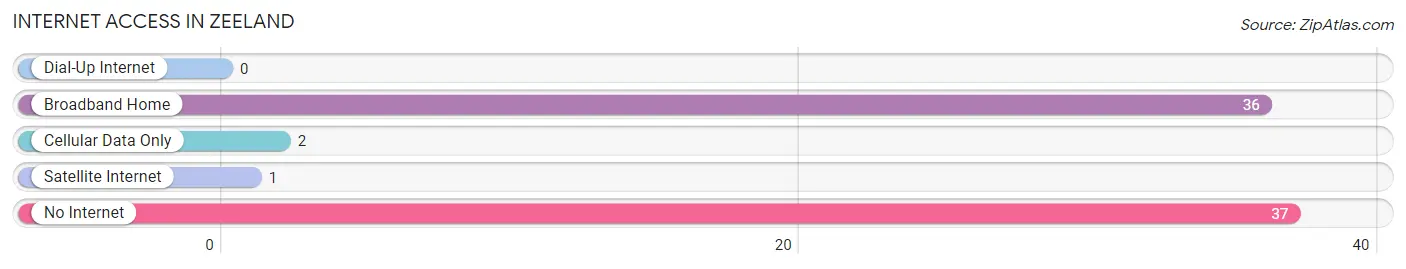
| Internet Type | # Households | % Households |
| Dial-Up Internet | 0 | 0.0% |
| Broadband Home | 36 | 47.4% |
| Cellular Data Only | 2 | 2.6% |
| Satellite Internet | 1 | 1.3% |
| No Internet | 37 | 48.7% |
| Total | 76 | 100.0% |
Zeeland Summary
Zeeland, North Dakota is a small town located in the southeastern corner of the state. It is situated in the heart of the Red River Valley, a region known for its rich agricultural heritage. The town was founded in 1883 by German immigrants who were seeking a better life in the United States. The town has a population of just over 500 people and is the county seat of LaMoure County.
Geography
Zeeland is located in the southeastern corner of North Dakota, in the Red River Valley. The town is situated on the banks of the Red River, which forms the border between North Dakota and Minnesota. The town is surrounded by rolling hills and prairies, and is located in the heart of the Red River Valley. The area is known for its fertile soil and abundant wildlife.
The climate in Zeeland is typical of the northern Great Plains, with cold winters and hot summers. The average annual temperature is around 45 degrees Fahrenheit, with an average high of around 70 degrees in the summer and an average low of around 20 degrees in the winter. The area receives an average of around 20 inches of precipitation each year, with most of it falling in the form of snow.
Economy
The economy of Zeeland is largely based on agriculture. The town is located in the heart of the Red River Valley, which is known for its rich agricultural heritage. The area is home to a variety of crops, including wheat, corn, soybeans, and sunflowers. The town is also home to several dairy farms, as well as a number of beef and pork producers.
In addition to agriculture, Zeeland is home to a variety of small businesses. These include a variety of retail stores, restaurants, and other services. The town is also home to a number of manufacturing companies, including a furniture factory and a grain elevator.
Demographics
As of the 2010 census, the population of Zeeland was 514. The racial makeup of the town was 97.3% White, 0.6% African American, 0.2% Native American, 0.2% Asian, 0.2% from other races, and 1.7% from two or more races. Hispanic or Latino of any race were 0.8% of the population.
The median income for a household in Zeeland was $41,250, and the median income for a family was $50,000. The per capita income for the town was $19,945. About 8.3% of families and 10.2% of the population were below the poverty line, including 11.3% of those under age 18 and 8.3% of those age 65 or over.
Conclusion
Zeeland, North Dakota is a small town located in the southeastern corner of the state. It is situated in the heart of the Red River Valley, a region known for its rich agricultural heritage. The town has a population of just over 500 people and is the county seat of LaMoure County. The economy of Zeeland is largely based on agriculture, with a variety of crops grown in the area. The town is also home to a variety of small businesses, including retail stores, restaurants, and other services. The population of Zeeland is predominantly white, with a median income of $41,250 for a household and $50,000 for a family.
Common Questions
What is Per Capita Income in Zeeland?
Per Capita income in Zeeland is $43,711.
What is the Median Family Income in Zeeland?
Median Family Income in Zeeland is $27,292.
What is Inequality or Gini Index in Zeeland?
Inequality or Gini Index in Zeeland is 0.56.
What is the Total Population of Zeeland?
Total Population of Zeeland is 96.
What is the Total Male Population of Zeeland?
Total Male Population of Zeeland is 62.
What is the Total Female Population of Zeeland?
Total Female Population of Zeeland is 34.
What is the Ratio of Males per 100 Females in Zeeland?
There are 182.35 Males per 100 Females in Zeeland.
What is the Ratio of Females per 100 Males in Zeeland?
There are 54.84 Females per 100 Males in Zeeland.
What is the Median Population Age in Zeeland?
Median Population Age in Zeeland is 66.5 Years.
What is the Average Family Size in Zeeland
Average Family Size in Zeeland is 1.9 People.
What is the Average Household Size in Zeeland
Average Household Size in Zeeland is 1.3 People.
How Large is the Labor Force in Zeeland?
There are 49 People in the Labor Forcein in Zeeland.
What is the Percentage of People in the Labor Force in Zeeland?
54.4% of People are in the Labor Force in Zeeland.