Zip Codes with the Highest Percentage of Households with Income Above $200,000 in North Dakota
RELATED REPORTS & OPTIONS
Household Income | $200k+
North Dakota
Compare Zip Codes
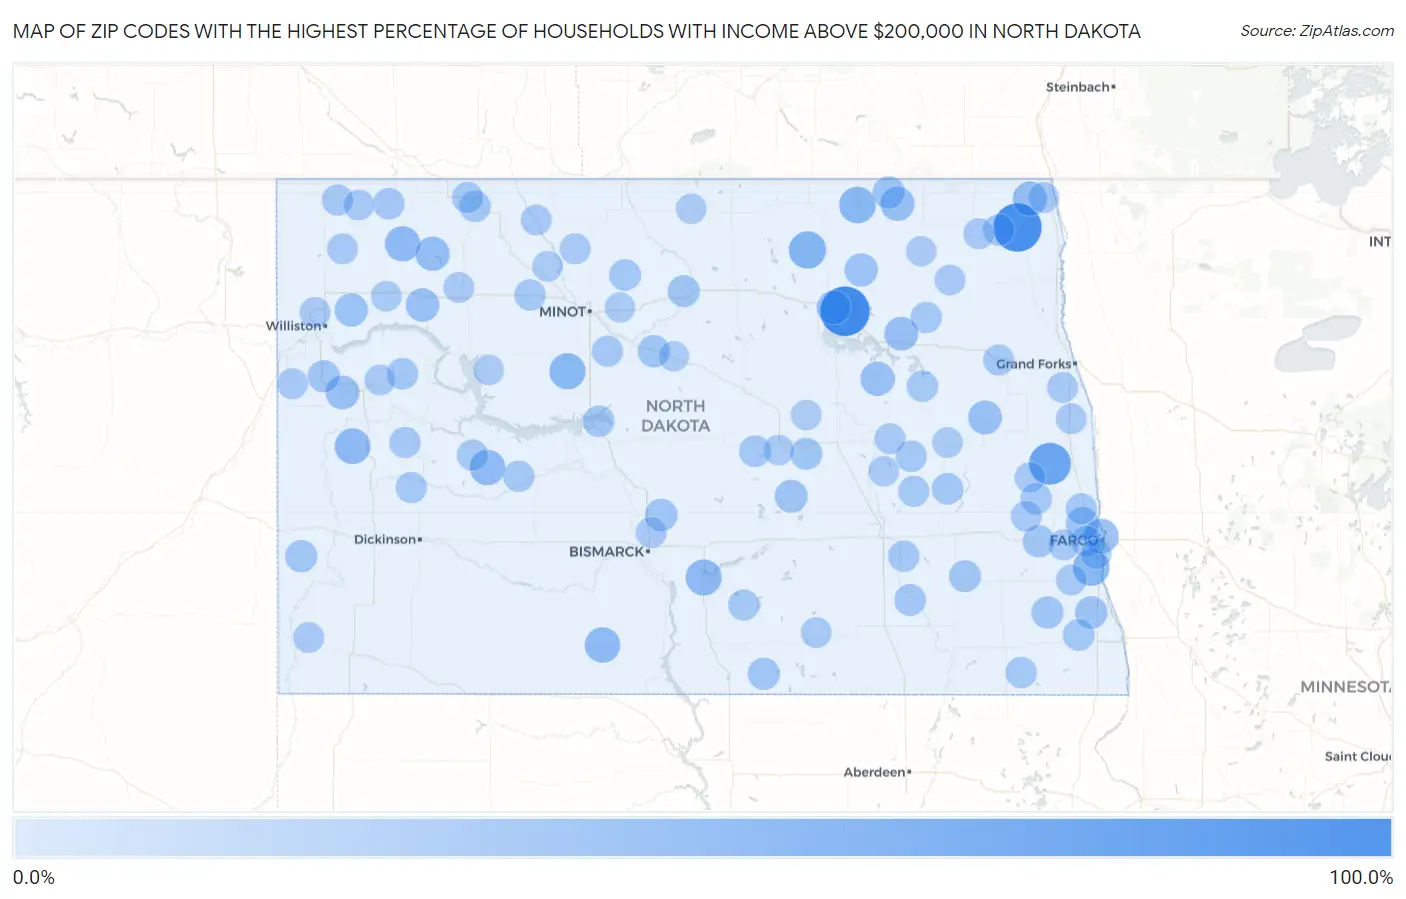
Map of Zip Codes with the Highest Percentage of Households with Income Above $200,000 in North Dakota
0.0%
100.0%
Zip Codes with the Highest Percentage of Households with Income Above $200,000 in North Dakota
| Zip Code | Households with Income > $200k | vs State | vs National | |
| 1. | 58362 | 100.0% | 8.4%(+91.6)#1 | 11.4%(+88.6)#22 |
| 2. | 58236 | 94.4% | 8.4%(+86.0)#2 | 11.4%(+83.0)#26 |
| 3. | 58009 | 64.3% | 8.4%(+55.9)#3 | 11.4%(+52.9)#87 |
| 4. | 58317 | 42.5% | 8.4%(+34.1)#4 | 11.4%(+31.1)#528 |
| 5. | 58047 | 39.2% | 8.4%(+30.8)#5 | 11.4%(+27.8)#693 |
| 6. | 58323 | 38.9% | 8.4%(+30.5)#6 | 11.4%(+27.5)#718 |
| 7. | 58735 | 37.1% | 8.4%(+28.7)#7 | 11.4%(+25.7)#834 |
| 8. | 58560 | 36.7% | 8.4%(+28.3)#8 | 11.4%(+25.3)#865 |
| 9. | 58634 | 35.2% | 8.4%(+26.8)#9 | 11.4%(+23.8)#968 |
| 10. | 58569 | 34.1% | 8.4%(+25.7)#10 | 11.4%(+22.7)#1,056 |
| 11. | 58625 | 34.0% | 8.4%(+25.6)#11 | 11.4%(+22.6)#1,069 |
| 12. | 58755 | 33.3% | 8.4%(+24.9)#12 | 11.4%(+21.9)#1,135 |
| 13. | 58105 | 31.3% | 8.4%(+22.9)#13 | 11.4%(+19.9)#1,322 |
| 14. | 58216 | 29.1% | 8.4%(+20.7)#14 | 11.4%(+17.7)#1,578 |
| 15. | 58773 | 28.8% | 8.4%(+20.4)#15 | 11.4%(+17.4)#1,617 |
| 16. | 58281 | 28.0% | 8.4%(+19.6)#16 | 11.4%(+16.6)#1,738 |
| 17. | 58381 | 27.8% | 8.4%(+19.4)#17 | 11.4%(+16.4)#1,765 |
| 18. | 58327 | 26.4% | 8.4%(+18.0)#18 | 11.4%(+15.0)#1,972 |
| 19. | 58835 | 26.3% | 8.4%(+17.9)#19 | 11.4%(+14.9)#1,990 |
| 20. | 58325 | 26.3% | 8.4%(+17.9)#20 | 11.4%(+14.9)#1,991 |
| 21. | 58277 | 26.2% | 8.4%(+17.8)#21 | 11.4%(+14.8)#2,011 |
| 22. | 58794 | 25.3% | 8.4%(+16.9)#22 | 11.4%(+13.9)#2,141 |
| 23. | 58042 | 24.3% | 8.4%(+15.9)#23 | 11.4%(+12.9)#2,323 |
| 24. | 58843 | 23.8% | 8.4%(+15.4)#24 | 11.4%(+12.4)#2,417 |
| 25. | 58377 | 23.8% | 8.4%(+15.4)#25 | 11.4%(+12.4)#2,418 |
| 26. | 58475 | 22.1% | 8.4%(+13.7)#26 | 11.4%(+10.7)#2,766 |
| 27. | 58018 | 20.8% | 8.4%(+12.4)#27 | 11.4%(+9.40)#3,094 |
| 28. | 58521 | 20.7% | 8.4%(+12.3)#28 | 11.4%(+9.30)#3,119 |
| 29. | 58239 | 20.0% | 8.4%(+11.6)#29 | 11.4%(+8.60)#3,299 |
| 30. | 58792 | 19.8% | 8.4%(+11.4)#30 | 11.4%(+8.40)#3,359 |
| 31. | 58057 | 19.5% | 8.4%(+11.1)#31 | 11.4%(+8.10)#3,454 |
| 32. | 58831 | 19.2% | 8.4%(+10.8)#32 | 11.4%(+7.80)#3,523 |
| 33. | 58079 | 19.0% | 8.4%(+10.6)#33 | 11.4%(+7.60)#3,578 |
| 34. | 58654 | 18.8% | 8.4%(+10.4)#34 | 11.4%(+7.40)#3,638 |
| 35. | 58581 | 18.7% | 8.4%(+10.3)#35 | 11.4%(+7.30)#3,662 |
| 36. | 58788 | 18.4% | 8.4%(+10.00)#36 | 11.4%(+7.00)#3,737 |
| 37. | 58049 | 17.6% | 8.4%(+9.20)#37 | 11.4%(+6.20)#3,996 |
| 38. | 58486 | 17.6% | 8.4%(+9.20)#38 | 11.4%(+6.20)#3,998 |
| 39. | 58008 | 17.2% | 8.4%(+8.80)#39 | 11.4%(+5.80)#4,134 |
| 40. | 58431 | 17.2% | 8.4%(+8.80)#40 | 11.4%(+5.80)#4,135 |
| 41. | 58423 | 16.7% | 8.4%(+8.30)#41 | 11.4%(+5.30)#4,316 |
| 42. | 58721 | 16.3% | 8.4%(+7.90)#42 | 11.4%(+4.90)#4,473 |
| 43. | 58429 | 16.2% | 8.4%(+7.80)#43 | 11.4%(+4.80)#4,505 |
| 44. | 58731 | 16.1% | 8.4%(+7.70)#44 | 11.4%(+4.70)#4,544 |
| 45. | 58765 | 16.1% | 8.4%(+7.70)#45 | 11.4%(+4.70)#4,545 |
| 46. | 58029 | 16.1% | 8.4%(+7.70)#46 | 11.4%(+4.70)#4,551 |
| 47. | 58531 | 15.7% | 8.4%(+7.30)#47 | 11.4%(+4.30)#4,707 |
| 48. | 58847 | 15.7% | 8.4%(+7.30)#48 | 11.4%(+4.30)#4,708 |
| 49. | 58497 | 15.7% | 8.4%(+7.30)#49 | 11.4%(+4.30)#4,710 |
| 50. | 58241 | 15.5% | 8.4%(+7.10)#50 | 11.4%(+4.10)#4,797 |
| 51. | 58484 | 15.4% | 8.4%(+7.00)#51 | 11.4%(+4.00)#4,833 |
| 52. | 58718 | 15.3% | 8.4%(+6.90)#52 | 11.4%(+3.90)#4,872 |
| 53. | 58640 | 15.2% | 8.4%(+6.80)#53 | 11.4%(+3.80)#4,914 |
| 54. | 58580 | 15.2% | 8.4%(+6.80)#54 | 11.4%(+3.80)#4,919 |
| 55. | 58321 | 15.2% | 8.4%(+6.80)#55 | 11.4%(+3.80)#4,926 |
| 56. | 58361 | 15.0% | 8.4%(+6.60)#56 | 11.4%(+3.60)#5,017 |
| 57. | 58642 | 14.9% | 8.4%(+6.50)#57 | 11.4%(+3.50)#5,063 |
| 58. | 58067 | 14.9% | 8.4%(+6.50)#58 | 11.4%(+3.50)#5,064 |
| 59. | 58833 | 14.8% | 8.4%(+6.40)#59 | 11.4%(+3.40)#5,106 |
| 60. | 58737 | 14.8% | 8.4%(+6.40)#60 | 11.4%(+3.40)#5,107 |
| 61. | 58781 | 14.7% | 8.4%(+6.30)#61 | 11.4%(+3.30)#5,161 |
| 62. | 58636 | 14.4% | 8.4%(+6.00)#62 | 11.4%(+3.00)#5,289 |
| 63. | 58549 | 14.3% | 8.4%(+5.90)#63 | 11.4%(+2.90)#5,335 |
| 64. | 58078 | 14.0% | 8.4%(+5.60)#64 | 11.4%(+2.60)#5,460 |
| 65. | 58492 | 14.0% | 8.4%(+5.60)#65 | 11.4%(+2.60)#5,499 |
| 66. | 58005 | 13.8% | 8.4%(+5.40)#66 | 11.4%(+2.40)#5,597 |
| 67. | 58251 | 13.7% | 8.4%(+5.30)#67 | 11.4%(+2.30)#5,654 |
| 68. | 58838 | 13.6% | 8.4%(+5.20)#68 | 11.4%(+2.20)#5,718 |
| 69. | 58750 | 13.3% | 8.4%(+4.90)#69 | 11.4%(+1.90)#5,877 |
| 70. | 58503 | 13.2% | 8.4%(+4.80)#70 | 11.4%(+1.80)#5,898 |
| 71. | 58443 | 13.2% | 8.4%(+4.80)#71 | 11.4%(+1.80)#5,940 |
| 72. | 58051 | 13.1% | 8.4%(+4.70)#72 | 11.4%(+1.70)#5,981 |
| 73. | 58830 | 13.1% | 8.4%(+4.70)#73 | 11.4%(+1.70)#5,992 |
| 74. | 58262 | 13.0% | 8.4%(+4.60)#74 | 11.4%(+1.60)#6,061 |
| 75. | 58218 | 12.9% | 8.4%(+4.50)#75 | 11.4%(+1.50)#6,107 |
| 76. | 58784 | 12.8% | 8.4%(+4.40)#76 | 11.4%(+1.40)#6,163 |
| 77. | 58278 | 12.8% | 8.4%(+4.40)#77 | 11.4%(+1.40)#6,166 |
| 78. | 58651 | 12.8% | 8.4%(+4.40)#78 | 11.4%(+1.40)#6,180 |
| 79. | 58007 | 12.8% | 8.4%(+4.40)#79 | 11.4%(+1.40)#6,190 |
| 80. | 58801 | 12.6% | 8.4%(+4.20)#80 | 11.4%(+1.20)#6,258 |
| 81. | 58854 | 12.6% | 8.4%(+4.20)#81 | 11.4%(+1.20)#6,284 |
| 82. | 58059 | 12.6% | 8.4%(+4.20)#82 | 11.4%(+1.20)#6,302 |
| 83. | 58787 | 12.5% | 8.4%(+4.10)#83 | 11.4%(+1.10)#6,395 |
| 84. | 58730 | 12.4% | 8.4%(+4.00)#84 | 11.4%(+1.000)#6,441 |
| 85. | 58210 | 12.3% | 8.4%(+3.90)#85 | 11.4%(+0.900)#6,521 |
| 86. | 58271 | 12.1% | 8.4%(+3.70)#86 | 11.4%(+0.700)#6,643 |
| 87. | 58460 | 12.1% | 8.4%(+3.70)#87 | 11.4%(+0.700)#6,651 |
| 88. | 58849 | 12.0% | 8.4%(+3.60)#88 | 11.4%(+0.600)#6,700 |
| 89. | 58035 | 12.0% | 8.4%(+3.60)#89 | 11.4%(+0.600)#6,712 |
| 90. | 58104 | 11.9% | 8.4%(+3.50)#90 | 11.4%(+0.500)#6,720 |
| 91. | 58725 | 11.9% | 8.4%(+3.50)#91 | 11.4%(+0.500)#6,779 |
| 92. | 58422 | 11.8% | 8.4%(+3.40)#92 | 11.4%(+0.400)#6,839 |
| 93. | 58425 | 11.7% | 8.4%(+3.30)#93 | 11.4%(+0.300)#6,903 |
| 94. | 58770 | 11.6% | 8.4%(+3.20)#94 | 11.4%(+0.200)#6,982 |
| 95. | 58418 | 11.6% | 8.4%(+3.20)#95 | 11.4%(+0.200)#6,993 |
| 96. | 58455 | 11.4% | 8.4%(+3.00)#96 | 11.4%(=0.000)#7,129 |
| 97. | 58318 | 11.3% | 8.4%(+2.90)#97 | 11.4%(-0.100)#7,181 |
| 98. | 58712 | 11.1% | 8.4%(+2.70)#98 | 11.4%(-0.300)#7,379 |
| 99. | 58355 | 11.1% | 8.4%(+2.70)#99 | 11.4%(-0.300)#7,381 |
| 100. | 58768 | 11.0% | 8.4%(+2.60)#100 | 11.4%(-0.400)#7,464 |
Common Questions
What are the Top 10 Zip Codes with the Highest Percentage of Households with Income Above $200,000 in North Dakota?
Top 10 Zip Codes with the Highest Percentage of Households with Income Above $200,000 in North Dakota are:
What zip code has the Highest Percentage of Households with Income Above $200,000 in North Dakota?
58362 has the Highest Percentage of Households with Income Above $200,000 in North Dakota with 100.0%.
What is the Percentage of Households with Income Above $200,000 in the State of North Dakota?
Percentage of Households with Income Above $200,000 in North Dakota is 8.4%.
What is the Percentage of Households with Income Above $200,000 in the United States?
Percentage of Households with Income Above $200,000 in the United States is 11.4%.