Zip Codes with the Highest Poverty Level Among Children Under the Age of 5 in North Dakota
RELATED REPORTS & OPTIONS
Highest Poverty | Child 0-5
North Dakota
Compare Zip Codes
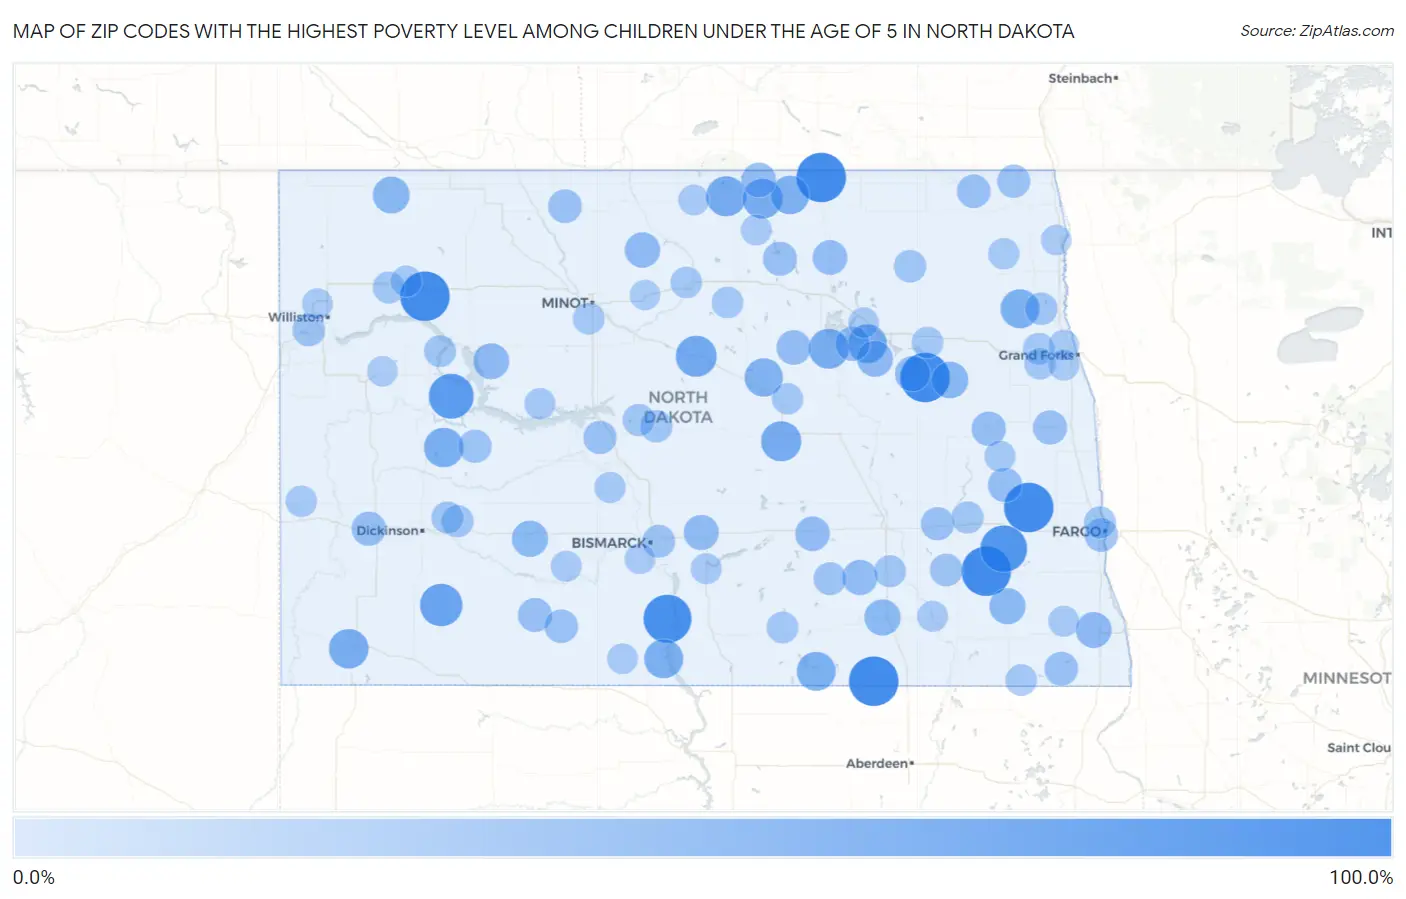
Map of Zip Codes with the Highest Poverty Level Among Children Under the Age of 5 in North Dakota
0.0%
100.0%
Zip Codes with the Highest Poverty Level Among Children Under the Age of 5 in North Dakota
| Zip Code | Child Poverty | vs State | vs National | |
| 1. | 58361 | 100.0% | 13.1%(+86.9)#1 | 18.1%(+81.9)#363 |
| 2. | 58439 | 100.0% | 13.1%(+86.9)#2 | 18.1%(+81.9)#368 |
| 3. | 58794 | 100.0% | 13.1%(+86.9)#3 | 18.1%(+81.9)#406 |
| 4. | 58062 | 100.0% | 13.1%(+86.9)#4 | 18.1%(+81.9)#460 |
| 5. | 58007 | 100.0% | 13.1%(+86.9)#5 | 18.1%(+81.9)#496 |
| 6. | 58339 | 100.0% | 13.1%(+86.9)#6 | 18.1%(+81.9)#558 |
| 7. | 58528 | 92.8% | 13.1%(+79.7)#7 | 18.1%(+74.7)#603 |
| 8. | 58031 | 86.7% | 13.1%(+73.6)#8 | 18.1%(+68.6)#679 |
| 9. | 58757 | 78.2% | 13.1%(+65.1)#9 | 18.1%(+60.2)#864 |
| 10. | 58650 | 66.7% | 13.1%(+53.6)#10 | 18.1%(+48.6)#1,297 |
| 11. | 58736 | 60.0% | 13.1%(+46.9)#11 | 18.1%(+41.9)#1,694 |
| 12. | 58329 | 56.4% | 13.1%(+43.3)#12 | 18.1%(+38.4)#1,954 |
| 13. | 58418 | 56.2% | 13.1%(+43.1)#13 | 18.1%(+38.2)#1,969 |
| 14. | 58357 | 54.8% | 13.1%(+41.7)#14 | 18.1%(+36.8)#2,079 |
| 15. | 58316 | 54.4% | 13.1%(+41.3)#15 | 18.1%(+36.3)#2,115 |
| 16. | 58623 | 53.5% | 13.1%(+40.4)#16 | 18.1%(+35.4)#2,193 |
| 17. | 58626 | 52.8% | 13.1%(+39.7)#17 | 18.1%(+34.8)#2,265 |
| 18. | 58538 | 51.3% | 13.1%(+38.2)#18 | 18.1%(+33.2)#2,403 |
| 19. | 58370 | 50.9% | 13.1%(+37.8)#19 | 18.1%(+32.8)#2,441 |
| 20. | 58413 | 50.0% | 13.1%(+36.9)#20 | 18.1%(+31.9)#2,549 |
| 21. | 58233 | 50.0% | 13.1%(+36.9)#21 | 18.1%(+31.9)#2,586 |
| 22. | 58367 | 48.6% | 13.1%(+35.5)#22 | 18.1%(+30.5)#2,745 |
| 23. | 58341 | 47.3% | 13.1%(+34.2)#23 | 18.1%(+29.3)#2,885 |
| 24. | 58765 | 40.6% | 13.1%(+27.5)#24 | 18.1%(+22.6)#3,913 |
| 25. | 58254 | 40.0% | 13.1%(+26.9)#25 | 18.1%(+21.9)#4,026 |
| 26. | 58631 | 38.0% | 13.1%(+24.9)#26 | 18.1%(+20.0)#4,401 |
| 27. | 58433 | 37.9% | 13.1%(+24.8)#27 | 18.1%(+19.8)#4,432 |
| 28. | 58054 | 37.8% | 13.1%(+24.7)#28 | 18.1%(+19.7)#4,451 |
| 29. | 58379 | 37.0% | 13.1%(+23.9)#29 | 18.1%(+19.0)#4,591 |
| 30. | 58770 | 36.4% | 13.1%(+23.3)#30 | 18.1%(+18.4)#4,716 |
| 31. | 58061 | 36.4% | 13.1%(+23.3)#31 | 18.1%(+18.3)#4,739 |
| 32. | 58789 | 34.3% | 13.1%(+21.2)#32 | 18.1%(+16.2)#5,233 |
| 33. | 58380 | 33.3% | 13.1%(+20.2)#33 | 18.1%(+15.3)#5,505 |
| 34. | 58572 | 33.3% | 13.1%(+20.2)#34 | 18.1%(+15.3)#5,517 |
| 35. | 58454 | 33.3% | 13.1%(+20.2)#35 | 18.1%(+15.3)#5,520 |
| 36. | 58324 | 31.1% | 13.1%(+18.0)#36 | 18.1%(+13.1)#6,047 |
| 37. | 58467 | 30.8% | 13.1%(+17.7)#37 | 18.1%(+12.7)#6,152 |
| 38. | 58369 | 30.6% | 13.1%(+17.5)#38 | 18.1%(+12.5)#6,189 |
| 39. | 58348 | 30.6% | 13.1%(+17.5)#39 | 18.1%(+12.5)#6,191 |
| 40. | 58335 | 29.8% | 13.1%(+16.7)#40 | 18.1%(+11.7)#6,421 |
| 41. | 58230 | 29.4% | 13.1%(+16.3)#41 | 18.1%(+11.3)#6,534 |
| 42. | 58622 | 29.2% | 13.1%(+16.1)#42 | 18.1%(+11.2)#6,591 |
| 43. | 58064 | 29.0% | 13.1%(+15.9)#43 | 18.1%(+11.0)#6,646 |
| 44. | 58257 | 28.3% | 13.1%(+15.2)#44 | 18.1%(+10.2)#6,883 |
| 45. | 58533 | 28.2% | 13.1%(+15.1)#45 | 18.1%(+10.1)#6,914 |
| 46. | 58385 | 27.8% | 13.1%(+14.7)#46 | 18.1%(+9.71)#7,041 |
| 47. | 58053 | 26.7% | 13.1%(+13.6)#47 | 18.1%(+8.60)#7,416 |
| 48. | 58282 | 26.7% | 13.1%(+13.6)#48 | 18.1%(+8.60)#7,417 |
| 49. | 58761 | 26.7% | 13.1%(+13.6)#49 | 18.1%(+8.60)#7,419 |
| 50. | 58529 | 26.0% | 13.1%(+12.9)#50 | 18.1%(+7.94)#7,642 |
| 51. | 58103 | 25.8% | 13.1%(+12.7)#51 | 18.1%(+7.75)#7,705 |
| 52. | 58576 | 25.0% | 13.1%(+11.9)#52 | 18.1%(+6.94)#7,996 |
| 53. | 58480 | 25.0% | 13.1%(+11.9)#53 | 18.1%(+6.94)#8,040 |
| 54. | 58636 | 24.8% | 13.1%(+11.7)#54 | 18.1%(+6.72)#8,093 |
| 55. | 58265 | 24.1% | 13.1%(+11.0)#55 | 18.1%(+6.08)#8,308 |
| 56. | 58442 | 22.9% | 13.1%(+9.76)#56 | 18.1%(+4.79)#8,817 |
| 57. | 58501 | 22.4% | 13.1%(+9.26)#57 | 18.1%(+4.30)#9,018 |
| 58. | 58853 | 22.0% | 13.1%(+8.85)#58 | 18.1%(+3.89)#9,213 |
| 59. | 58461 | 21.7% | 13.1%(+8.64)#59 | 18.1%(+3.68)#9,302 |
| 60. | 58330 | 21.4% | 13.1%(+8.33)#60 | 18.1%(+3.37)#9,421 |
| 61. | 58261 | 21.3% | 13.1%(+8.23)#61 | 18.1%(+3.27)#9,468 |
| 62. | 58559 | 20.9% | 13.1%(+7.83)#62 | 18.1%(+2.87)#9,627 |
| 63. | 58656 | 20.0% | 13.1%(+6.90)#63 | 18.1%(+1.94)#10,066 |
| 64. | 58072 | 19.5% | 13.1%(+6.38)#64 | 18.1%(+1.41)#10,277 |
| 65. | 58575 | 19.4% | 13.1%(+6.25)#65 | 18.1%(+1.29)#10,336 |
| 66. | 58630 | 19.4% | 13.1%(+6.25)#66 | 18.1%(+1.29)#10,338 |
| 67. | 58102 | 19.3% | 13.1%(+6.19)#67 | 18.1%(+1.23)#10,363 |
| 68. | 58849 | 18.6% | 13.1%(+5.46)#68 | 18.1%(+0.494)#10,703 |
| 69. | 58472 | 18.2% | 13.1%(+5.08)#69 | 18.1%(+0.119)#10,883 |
| 70. | 58763 | 18.1% | 13.1%(+5.03)#70 | 18.1%(+0.068)#10,900 |
| 71. | 58495 | 17.8% | 13.1%(+4.68)#71 | 18.1%(-0.285)#11,068 |
| 72. | 58701 | 17.4% | 13.1%(+4.33)#72 | 18.1%(-0.629)#11,221 |
| 73. | 58204 | 17.3% | 13.1%(+4.19)#73 | 18.1%(-0.775)#11,284 |
| 74. | 58344 | 17.0% | 13.1%(+3.92)#74 | 18.1%(-1.04)#11,415 |
| 75. | 58228 | 16.9% | 13.1%(+3.82)#75 | 18.1%(-1.14)#11,458 |
| 76. | 58788 | 16.7% | 13.1%(+3.57)#76 | 18.1%(-1.40)#11,558 |
| 77. | 58043 | 16.7% | 13.1%(+3.57)#77 | 18.1%(-1.40)#11,580 |
| 78. | 58368 | 16.4% | 13.1%(+3.32)#78 | 18.1%(-1.64)#11,684 |
| 79. | 58438 | 16.2% | 13.1%(+3.11)#79 | 18.1%(-1.85)#11,806 |
| 80. | 58621 | 16.0% | 13.1%(+2.94)#80 | 18.1%(-2.03)#11,900 |
| 81. | 58852 | 16.0% | 13.1%(+2.92)#81 | 18.1%(-2.04)#11,913 |
| 82. | 58243 | 15.7% | 13.1%(+2.58)#82 | 18.1%(-2.38)#12,081 |
| 83. | 58046 | 15.2% | 13.1%(+2.05)#83 | 18.1%(-2.91)#12,374 |
| 84. | 58540 | 15.0% | 13.1%(+1.90)#84 | 18.1%(-3.06)#12,454 |
| 85. | 58530 | 15.0% | 13.1%(+1.90)#85 | 18.1%(-3.06)#12,458 |
| 86. | 58081 | 14.3% | 13.1%(+1.18)#86 | 18.1%(-3.78)#12,869 |
| 87. | 58560 | 14.3% | 13.1%(+1.18)#87 | 18.1%(-3.78)#12,885 |
| 88. | 58201 | 14.1% | 13.1%(+0.994)#88 | 18.1%(-3.97)#12,984 |
| 89. | 58520 | 13.8% | 13.1%(+0.692)#89 | 18.1%(-4.27)#13,172 |
| 90. | 58458 | 13.7% | 13.1%(+0.597)#90 | 18.1%(-4.36)#13,214 |
| 91. | 58318 | 13.5% | 13.1%(+0.370)#91 | 18.1%(-4.59)#13,339 |
| 92. | 58366 | 13.2% | 13.1%(+0.106)#92 | 18.1%(-4.86)#13,516 |
| 93. | 58568 | 13.2% | 13.1%(+0.056)#93 | 18.1%(-4.90)#13,542 |
| 94. | 58801 | 13.0% | 13.1%(-0.129)#94 | 18.1%(-5.09)#13,647 |
| 95. | 58554 | 12.9% | 13.1%(-0.157)#95 | 18.1%(-5.12)#13,668 |
| 96. | 58203 | 12.7% | 13.1%(-0.376)#96 | 18.1%(-5.34)#13,791 |
| 97. | 58301 | 12.7% | 13.1%(-0.411)#97 | 18.1%(-5.37)#13,809 |
| 98. | 58225 | 12.5% | 13.1%(-0.601)#98 | 18.1%(-5.56)#13,905 |
| 99. | 58741 | 11.8% | 13.1%(-1.34)#99 | 18.1%(-6.30)#14,365 |
| 100. | 58854 | 11.7% | 13.1%(-1.37)#100 | 18.1%(-6.33)#14,383 |
Common Questions
What are the Top 10 Zip Codes with the Highest Poverty Level Among Children Under the Age of 5 in North Dakota?
Top 10 Zip Codes with the Highest Poverty Level Among Children Under the Age of 5 in North Dakota are:
What zip code has the Highest Poverty Level Among Children Under the Age of 5 in North Dakota?
58361 has the Highest Poverty Level Among Children Under the Age of 5 in North Dakota with 100.0%.
What is the Poverty Level Among Children Under the Age of 5 in the State of North Dakota?
Poverty Level Among Children Under the Age of 5 in North Dakota is 13.1%.
What is the Poverty Level Among Children Under the Age of 5 in the United States?
Poverty Level Among Children Under the Age of 5 in the United States is 18.1%.