Kevin, MT Map & Demographics
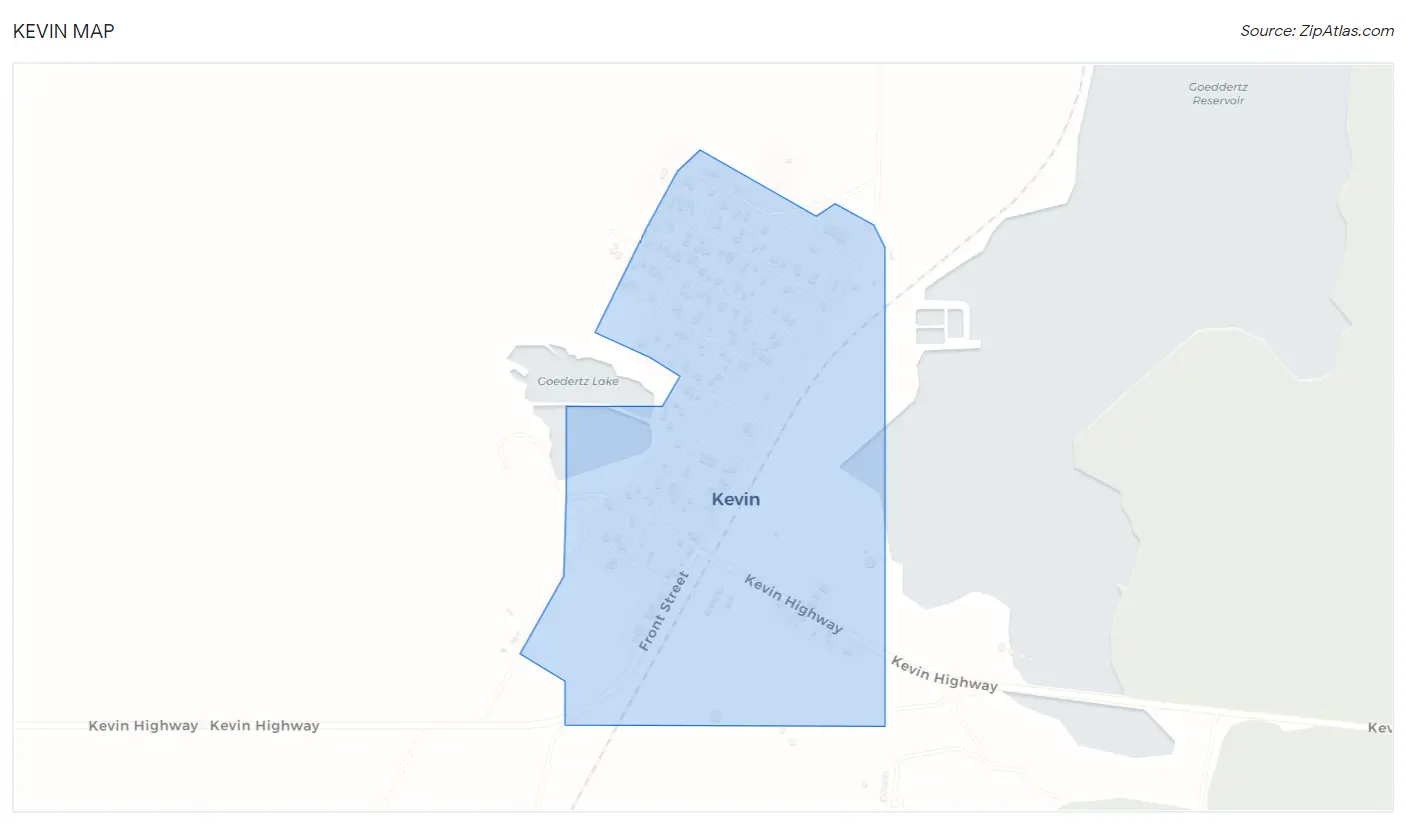
Kevin Map
Kevin Overview
$25,410
PER CAPITA INCOME
$54,000
AVG FAMILY INCOME
$50,625
AVG HOUSEHOLD INCOME
23.9%
WAGE / INCOME GAP [ % ]
76.1¢/ $1
WAGE / INCOME GAP [ $ ]
0.33
INEQUALITY / GINI INDEX
124
TOTAL POPULATION
70
MALE POPULATION
54
FEMALE POPULATION
129.63
MALES / 100 FEMALES
77.14
FEMALES / 100 MALES
50.5
MEDIAN AGE
2.6
AVG FAMILY SIZE
1.9
AVG HOUSEHOLD SIZE
64
LABOR FORCE [ PEOPLE ]
57.7%
PERCENT IN LABOR FORCE
Kevin Zip Codes
Kevin Area Codes
Income in Kevin
Income Overview in Kevin
Per Capita Income in Kevin is $25,410, while median incomes of families and households are $54,000 and $50,625 respectively.
| Characteristic | Number | Measure |
| Per Capita Income | 124 | $25,410 |
| Median Family Income | 36 | $54,000 |
| Mean Family Income | 36 | $57,556 |
| Median Household Income | 66 | $50,625 |
| Mean Household Income | 66 | $48,148 |
| Income Deficit | 36 | $0 |
| Wage / Income Gap (%) | 124 | 23.89% |
| Wage / Income Gap ($) | 124 | 76.11¢ per $1 |
| Gini / Inequality Index | 124 | 0.33 |
Earnings by Sex in Kevin
Average Earnings in Kevin are $24,444, $28,333 for men and $21,563 for women, a difference of 23.9%.
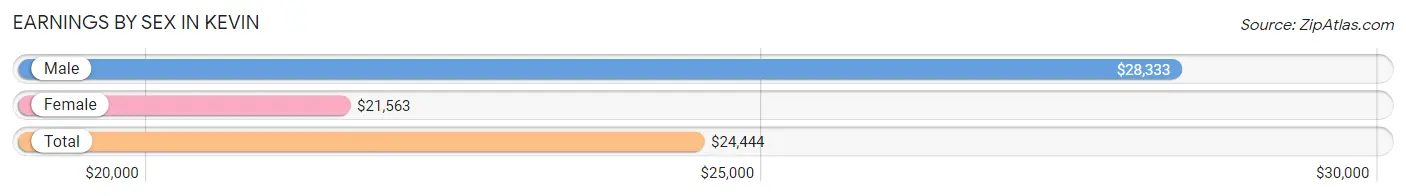
| Sex | Number | Average Earnings |
| Male | 42 (58.3%) | $28,333 |
| Female | 30 (41.7%) | $21,563 |
| Total | 72 (100.0%) | $24,444 |
Earnings by Sex by Income Bracket in Kevin
The most common earnings brackets in Kevin are $22,500 to $24,999 for men (9 | 21.4%) and $20,000 to $22,499 for women (8 | 26.7%).
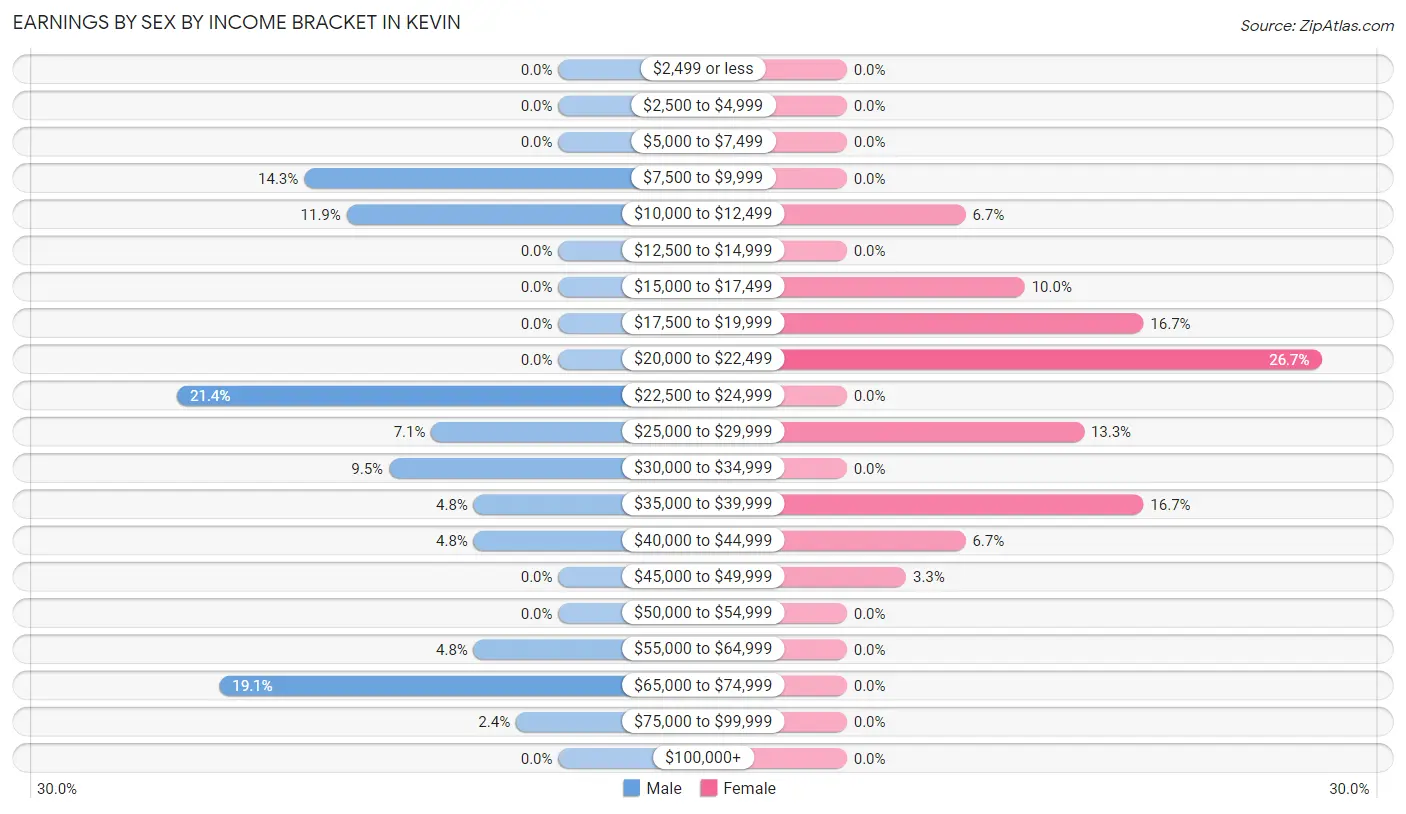
| Income | Male | Female |
| $2,499 or less | 0 (0.0%) | 0 (0.0%) |
| $2,500 to $4,999 | 0 (0.0%) | 0 (0.0%) |
| $5,000 to $7,499 | 0 (0.0%) | 0 (0.0%) |
| $7,500 to $9,999 | 6 (14.3%) | 0 (0.0%) |
| $10,000 to $12,499 | 5 (11.9%) | 2 (6.7%) |
| $12,500 to $14,999 | 0 (0.0%) | 0 (0.0%) |
| $15,000 to $17,499 | 0 (0.0%) | 3 (10.0%) |
| $17,500 to $19,999 | 0 (0.0%) | 5 (16.7%) |
| $20,000 to $22,499 | 0 (0.0%) | 8 (26.7%) |
| $22,500 to $24,999 | 9 (21.4%) | 0 (0.0%) |
| $25,000 to $29,999 | 3 (7.1%) | 4 (13.3%) |
| $30,000 to $34,999 | 4 (9.5%) | 0 (0.0%) |
| $35,000 to $39,999 | 2 (4.8%) | 5 (16.7%) |
| $40,000 to $44,999 | 2 (4.8%) | 2 (6.7%) |
| $45,000 to $49,999 | 0 (0.0%) | 1 (3.3%) |
| $50,000 to $54,999 | 0 (0.0%) | 0 (0.0%) |
| $55,000 to $64,999 | 2 (4.8%) | 0 (0.0%) |
| $65,000 to $74,999 | 8 (19.1%) | 0 (0.0%) |
| $75,000 to $99,999 | 1 (2.4%) | 0 (0.0%) |
| $100,000+ | 0 (0.0%) | 0 (0.0%) |
| Total | 42 (100.0%) | 30 (100.0%) |
Earnings by Sex by Educational Attainment in Kevin
Average earnings in Kevin are $30,625 for men and $21,719 for women, a difference of 29.1%. Men with an educational attainment of college or associate's degree enjoy the highest average annual earnings of $56,250, while those with college or associate's degree education earn the least with $56,250. Women with an educational attainment of high school diploma earn the most with the average annual earnings of $21,406, while those with high school diploma education have the smallest earnings of $21,406.
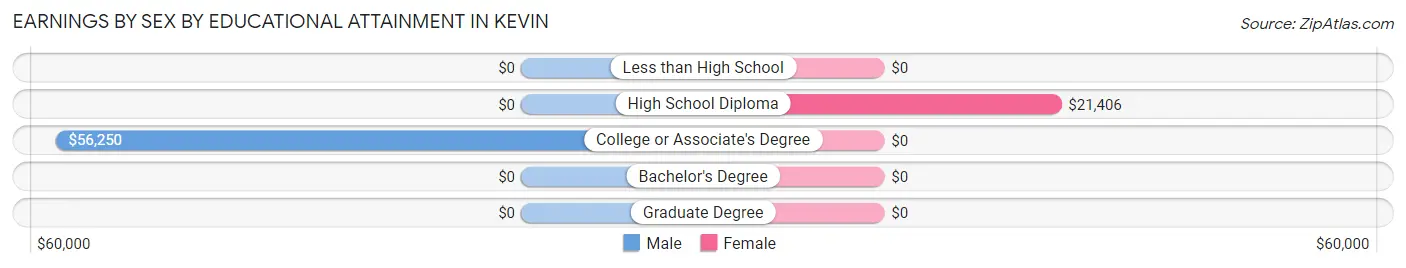
| Educational Attainment | Male Income | Female Income |
| Less than High School | - | - |
| High School Diploma | - | - |
| College or Associate's Degree | $56,250 | $0 |
| Bachelor's Degree | - | - |
| Graduate Degree | - | - |
| Total | $30,625 | $21,719 |
Family Income in Kevin
Family Income Brackets in Kevin
According to the Kevin family income data, there are 19 families falling into the $50,000 to $74,999 income range, which is the most common income bracket and makes up 52.8% of all families.
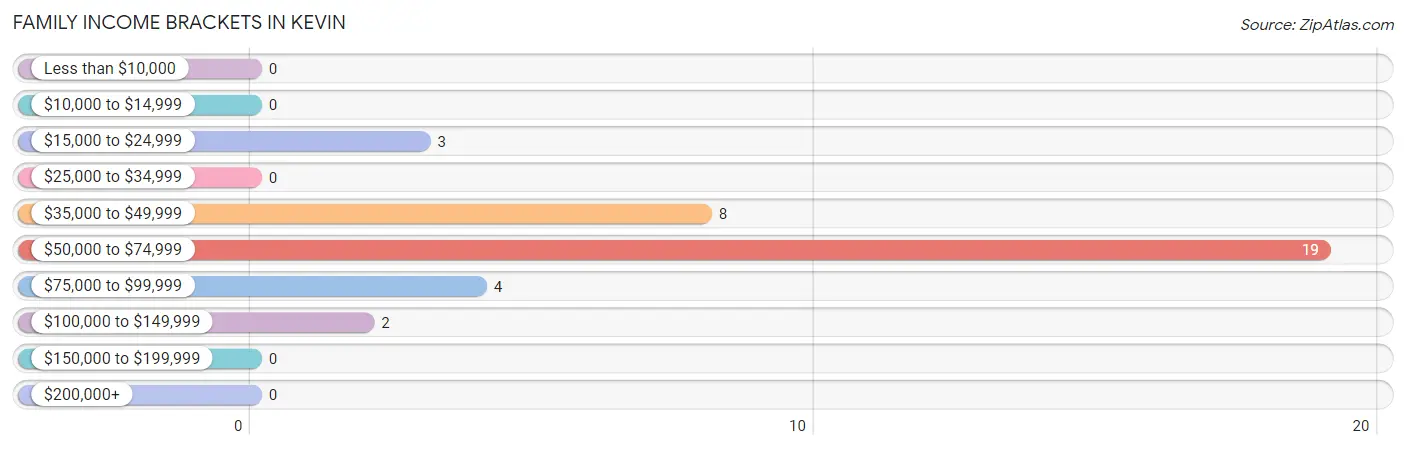
| Income Bracket | # Families | % Families |
| Less than $10,000 | 0 | 0.0% |
| $10,000 to $14,999 | 0 | 0.0% |
| $15,000 to $24,999 | 3 | 8.3% |
| $25,000 to $34,999 | 0 | 0.0% |
| $35,000 to $49,999 | 8 | 22.2% |
| $50,000 to $74,999 | 19 | 52.8% |
| $75,000 to $99,999 | 4 | 11.1% |
| $100,000 to $149,999 | 2 | 5.6% |
| $150,000 to $199,999 | 0 | 0.0% |
| $200,000+ | 0 | 0.0% |
Family Income by Famaliy Size in Kevin
2-person families (25 | 69.4%) account for the highest median family income in Kevin with $50,938 per family, while 2-person families (25 | 69.4%) have the highest median income of $25,469 per family member.
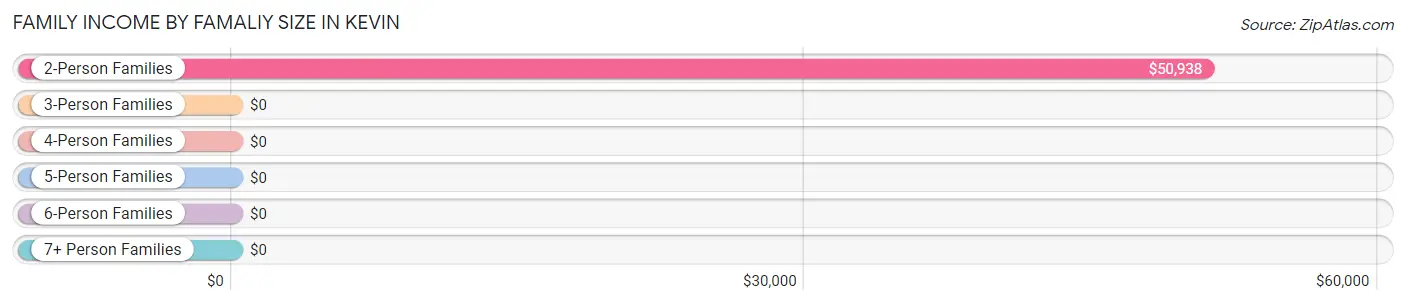
| Income Bracket | # Families | Median Income |
| 2-Person Families | 25 (69.4%) | $50,938 |
| 3-Person Families | 2 (5.6%) | $0 |
| 4-Person Families | 5 (13.9%) | $0 |
| 5-Person Families | 4 (11.1%) | $0 |
| 6-Person Families | 0 (0.0%) | $0 |
| 7+ Person Families | 0 (0.0%) | $0 |
| Total | 36 (100.0%) | $54,000 |
Family Income by Number of Earners in Kevin
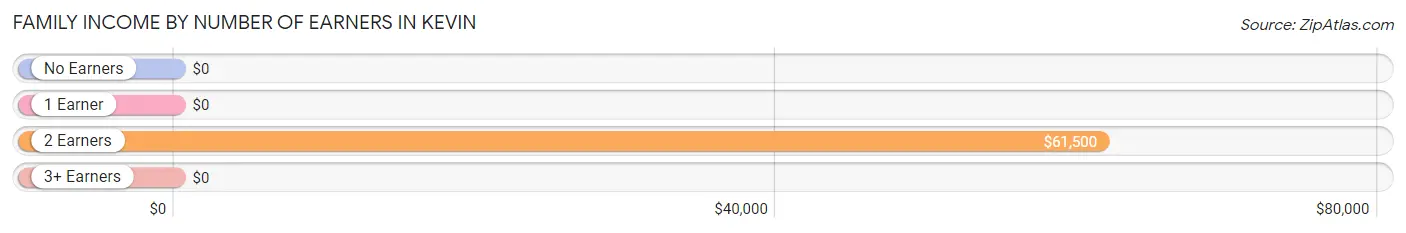
| Number of Earners | # Families | Median Income |
| No Earners | 9 (25.0%) | $0 |
| 1 Earner | 7 (19.4%) | $0 |
| 2 Earners | 20 (55.6%) | $61,500 |
| 3+ Earners | 0 (0.0%) | $0 |
| Total | 36 (100.0%) | $54,000 |
Household Income in Kevin
Household Income Brackets in Kevin
With 20 households falling in the category, the $50,000 to $74,999 income range is the most frequent in Kevin, accounting for 30.3% of all households.
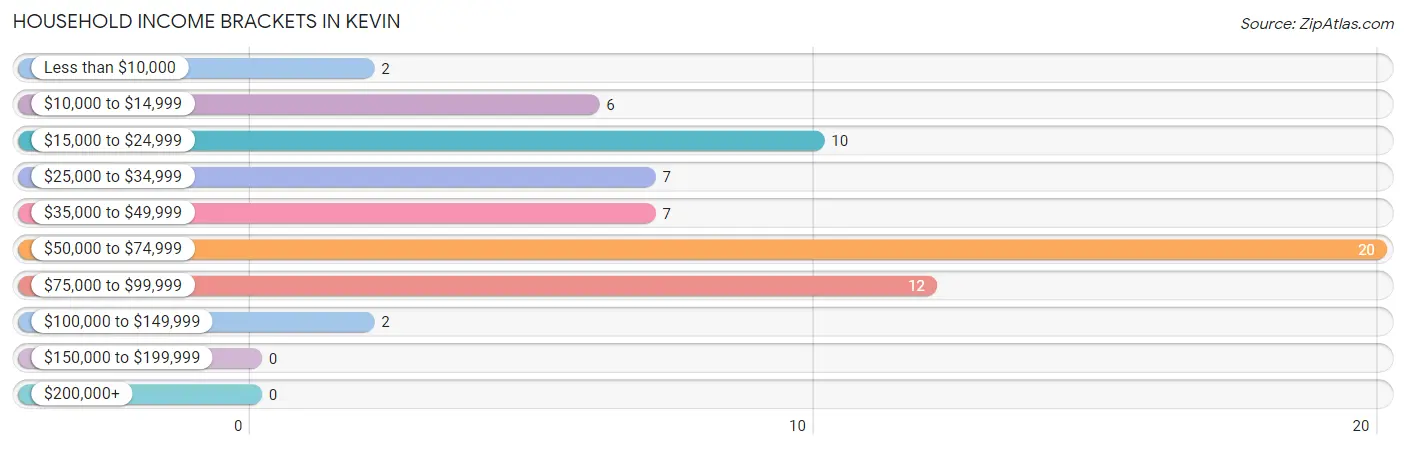
| Income Bracket | # Households | % Households |
| Less than $10,000 | 2 | 3.0% |
| $10,000 to $14,999 | 6 | 9.1% |
| $15,000 to $24,999 | 10 | 15.2% |
| $25,000 to $34,999 | 7 | 10.6% |
| $35,000 to $49,999 | 7 | 10.6% |
| $50,000 to $74,999 | 20 | 30.3% |
| $75,000 to $99,999 | 12 | 18.2% |
| $100,000 to $149,999 | 2 | 3.0% |
| $150,000 to $199,999 | 0 | 0.0% |
| $200,000+ | 0 | 0.0% |
Household Income by Householder Age in Kevin
The median household income in Kevin is $50,625, with the highest median household income of $60,750 found in the 25 to 44 years age bracket for the primary householder. A total of 15 households (22.7%) fall into this category.
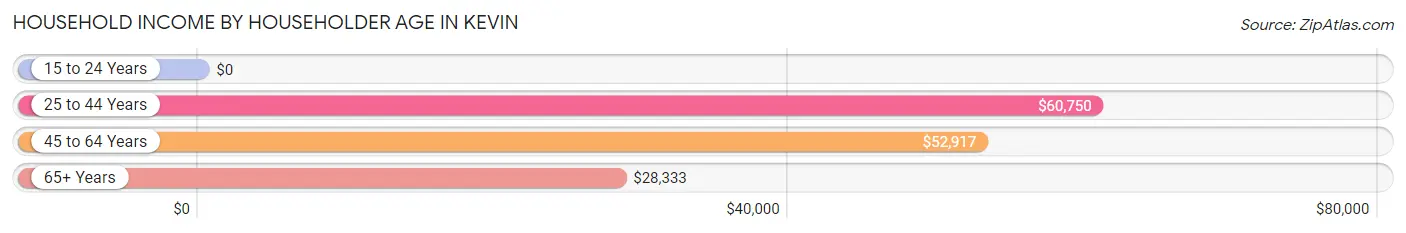
| Income Bracket | # Households | Median Income |
| 15 to 24 Years | 0 (0.0%) | $0 |
| 25 to 44 Years | 15 (22.7%) | $60,750 |
| 45 to 64 Years | 31 (47.0%) | $52,917 |
| 65+ Years | 20 (30.3%) | $28,333 |
| Total | 66 (100.0%) | $50,625 |
Poverty in Kevin
Income Below Poverty by Sex and Age in Kevin
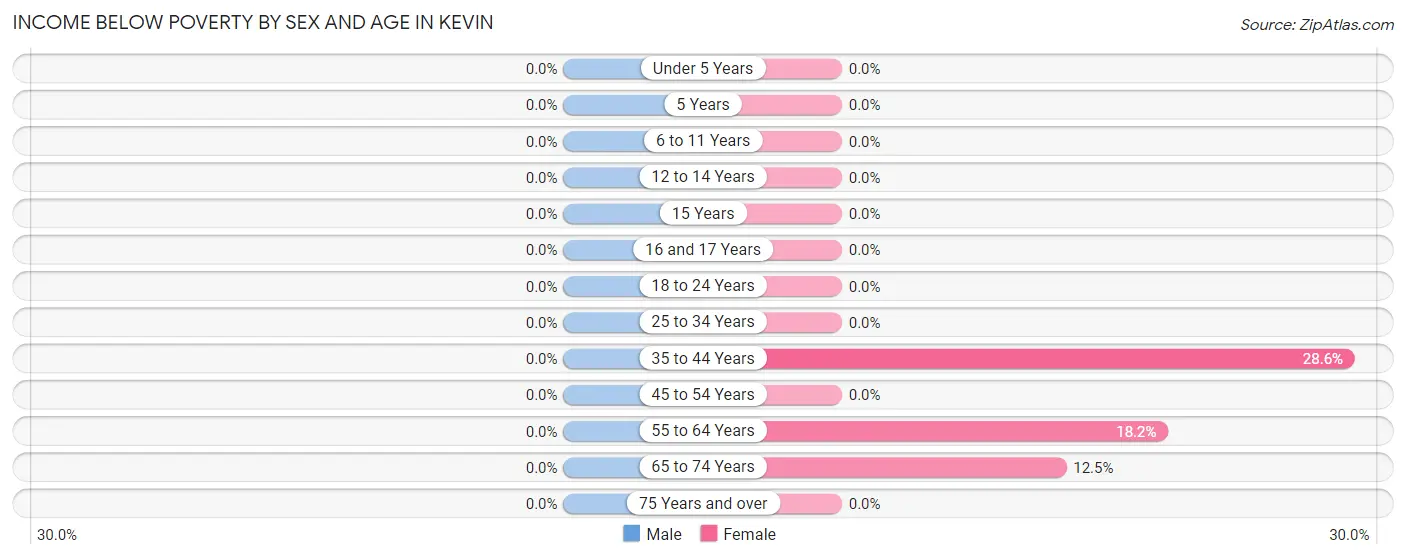
| Age Bracket | Male | Female |
| Under 5 Years | 0 (0.0%) | 0 (0.0%) |
| 5 Years | 0 (0.0%) | 0 (0.0%) |
| 6 to 11 Years | 0 (0.0%) | 0 (0.0%) |
| 12 to 14 Years | 0 (0.0%) | 0 (0.0%) |
| 15 Years | 0 (0.0%) | 0 (0.0%) |
| 16 and 17 Years | 0 (0.0%) | 0 (0.0%) |
| 18 to 24 Years | 0 (0.0%) | 0 (0.0%) |
| 25 to 34 Years | 0 (0.0%) | 0 (0.0%) |
| 35 to 44 Years | 0 (0.0%) | 4 (28.6%) |
| 45 to 54 Years | 0 (0.0%) | 0 (0.0%) |
| 55 to 64 Years | 0 (0.0%) | 2 (18.2%) |
| 65 to 74 Years | 0 (0.0%) | 1 (12.5%) |
| 75 Years and over | 0 (0.0%) | 0 (0.0%) |
| Total | 0 (0.0%) | 7 (13.0%) |
Income Above Poverty by Sex and Age in Kevin
According to the poverty statistics in Kevin, males aged under 5 years and females aged 15 years are the age groups that are most secure financially, with 100.0% of males and 100.0% of females in these age groups living above the poverty line.
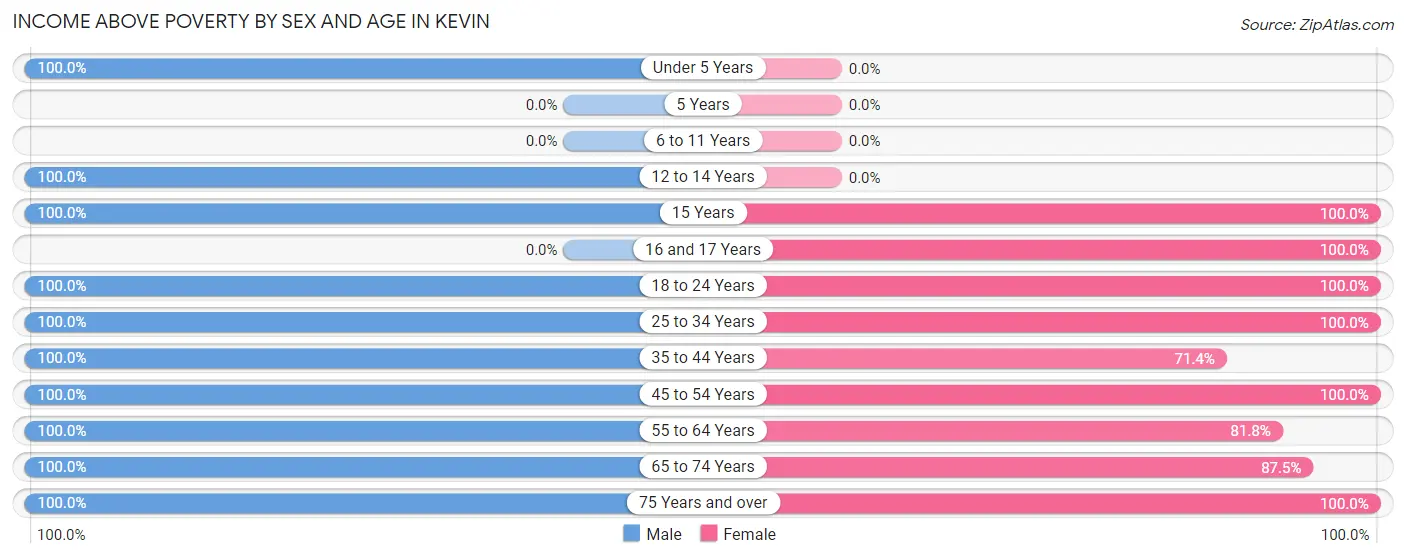
| Age Bracket | Male | Female |
| Under 5 Years | 2 (100.0%) | 0 (0.0%) |
| 5 Years | 0 (0.0%) | 0 (0.0%) |
| 6 to 11 Years | 0 (0.0%) | 0 (0.0%) |
| 12 to 14 Years | 6 (100.0%) | 0 (0.0%) |
| 15 Years | 1 (100.0%) | 4 (100.0%) |
| 16 and 17 Years | 0 (0.0%) | 1 (100.0%) |
| 18 to 24 Years | 6 (100.0%) | 1 (100.0%) |
| 25 to 34 Years | 6 (100.0%) | 7 (100.0%) |
| 35 to 44 Years | 5 (100.0%) | 10 (71.4%) |
| 45 to 54 Years | 12 (100.0%) | 7 (100.0%) |
| 55 to 64 Years | 14 (100.0%) | 9 (81.8%) |
| 65 to 74 Years | 12 (100.0%) | 7 (87.5%) |
| 75 Years and over | 6 (100.0%) | 1 (100.0%) |
| Total | 70 (100.0%) | 47 (87.0%) |
Income Below Poverty Among Married-Couple Families in Kevin
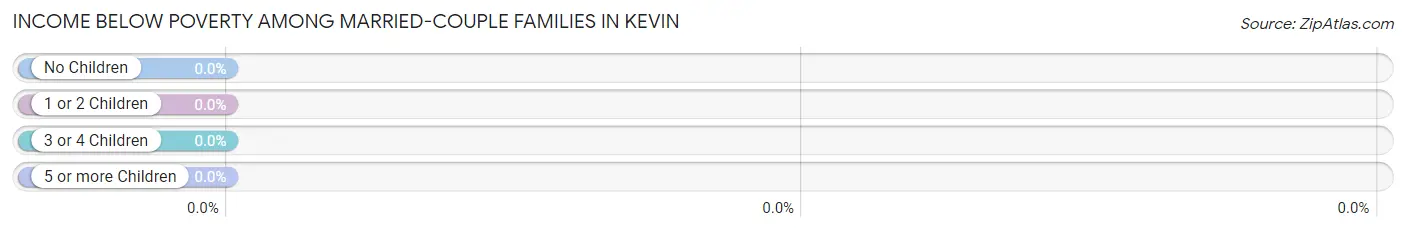
| Children | Above Poverty | Below Poverty |
| No Children | 20 (100.0%) | 0 (0.0%) |
| 1 or 2 Children | 7 (100.0%) | 0 (0.0%) |
| 3 or 4 Children | 4 (100.0%) | 0 (0.0%) |
| 5 or more Children | 0 (0.0%) | 0 (0.0%) |
| Total | 31 (100.0%) | 0 (0.0%) |
Income Below Poverty Among Single-Parent Households in Kevin
| Children | Single Father | Single Mother |
| No Children | 0 (0.0%) | 0 (0.0%) |
| 1 or 2 Children | 0 (0.0%) | 0 (0.0%) |
| 3 or 4 Children | 0 (0.0%) | 0 (0.0%) |
| 5 or more Children | 0 (0.0%) | 0 (0.0%) |
| Total | 0 (0.0%) | 0 (0.0%) |
Income Below Poverty Among Married-Couple vs Single-Parent Households in Kevin
| Children | Married-Couple Families | Single-Parent Households |
| No Children | 0 (0.0%) | 0 (0.0%) |
| 1 or 2 Children | 0 (0.0%) | 0 (0.0%) |
| 3 or 4 Children | 0 (0.0%) | 0 (0.0%) |
| 5 or more Children | 0 (0.0%) | 0 (0.0%) |
| Total | 0 (0.0%) | 0 (0.0%) |
Race in Kevin
The most populous races in Kevin are White / Caucasian (115 | 92.7%), and Two or more Races (9 | 7.3%).
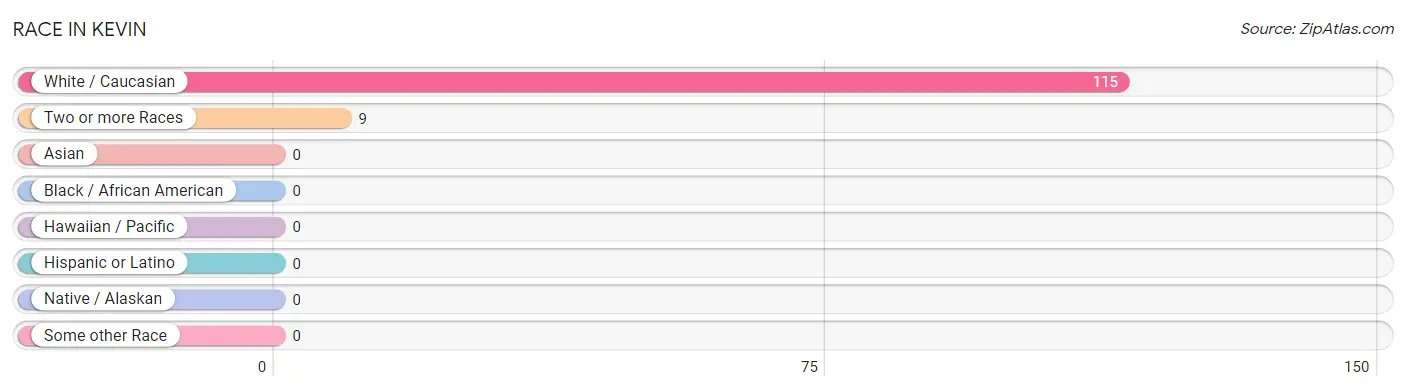
| Race | # Population | % Population |
| Asian | 0 | 0.0% |
| Black / African American | 0 | 0.0% |
| Hawaiian / Pacific | 0 | 0.0% |
| Hispanic or Latino | 0 | 0.0% |
| Native / Alaskan | 0 | 0.0% |
| White / Caucasian | 115 | 92.7% |
| Two or more Races | 9 | 7.3% |
| Some other Race | 0 | 0.0% |
| Total | 124 | 100.0% |
Ancestry in Kevin
The most populous ancestries reported in Kevin are German (31 | 25.0%), Irish (25 | 20.2%), French (21 | 16.9%), Norwegian (21 | 16.9%), and Dutch (16 | 12.9%), together accounting for 91.9% of all Kevin residents.
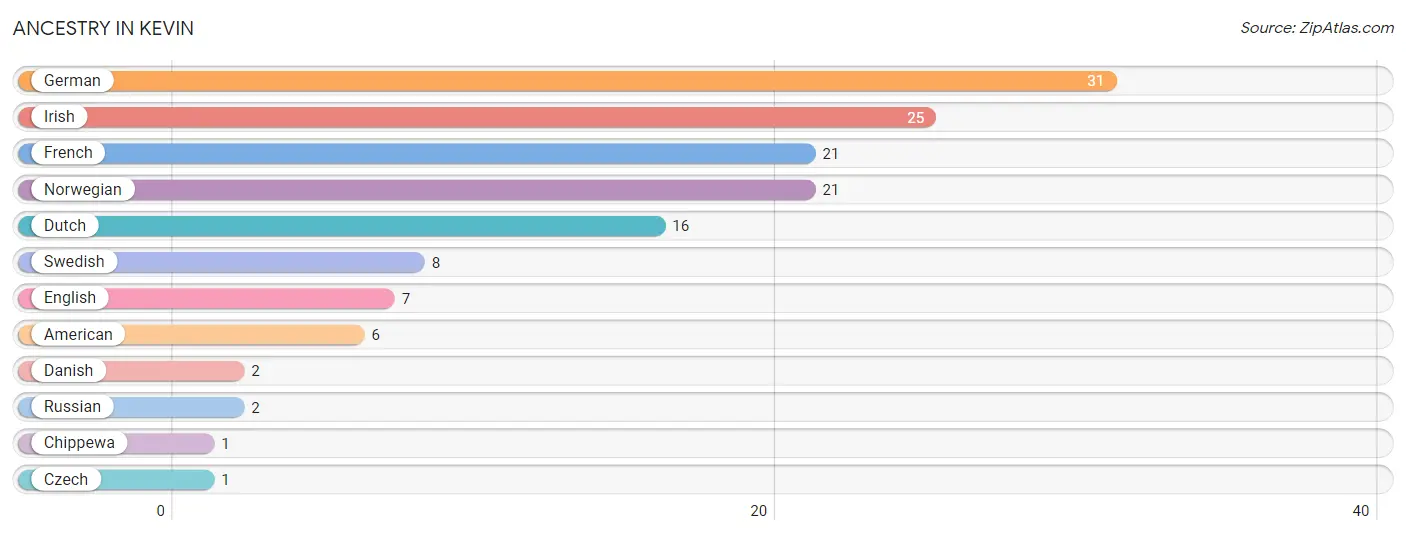
| Ancestry | # Population | % Population |
| American | 6 | 4.8% |
| Chippewa | 1 | 0.8% |
| Czech | 1 | 0.8% |
| Danish | 2 | 1.6% |
| Dutch | 16 | 12.9% |
| English | 7 | 5.7% |
| French | 21 | 16.9% |
| German | 31 | 25.0% |
| Irish | 25 | 20.2% |
| Norwegian | 21 | 16.9% |
| Russian | 2 | 1.6% |
| Swedish | 8 | 6.5% | View All 12 Rows |
Immigrants in Kevin
The most numerous immigrant groups reported in Kevin came from , and Canada (1 | 0.8%), together accounting for 0.8% of all Kevin residents.

| Immigration Origin | # Population | % Population |
| Canada | 1 | 0.8% | View All 1 Rows |
Sex and Age in Kevin
Sex and Age in Kevin
The most populous age groups in Kevin are 60 to 64 Years (11 | 15.7%) for men and 40 to 44 Years (14 | 25.9%) for women.
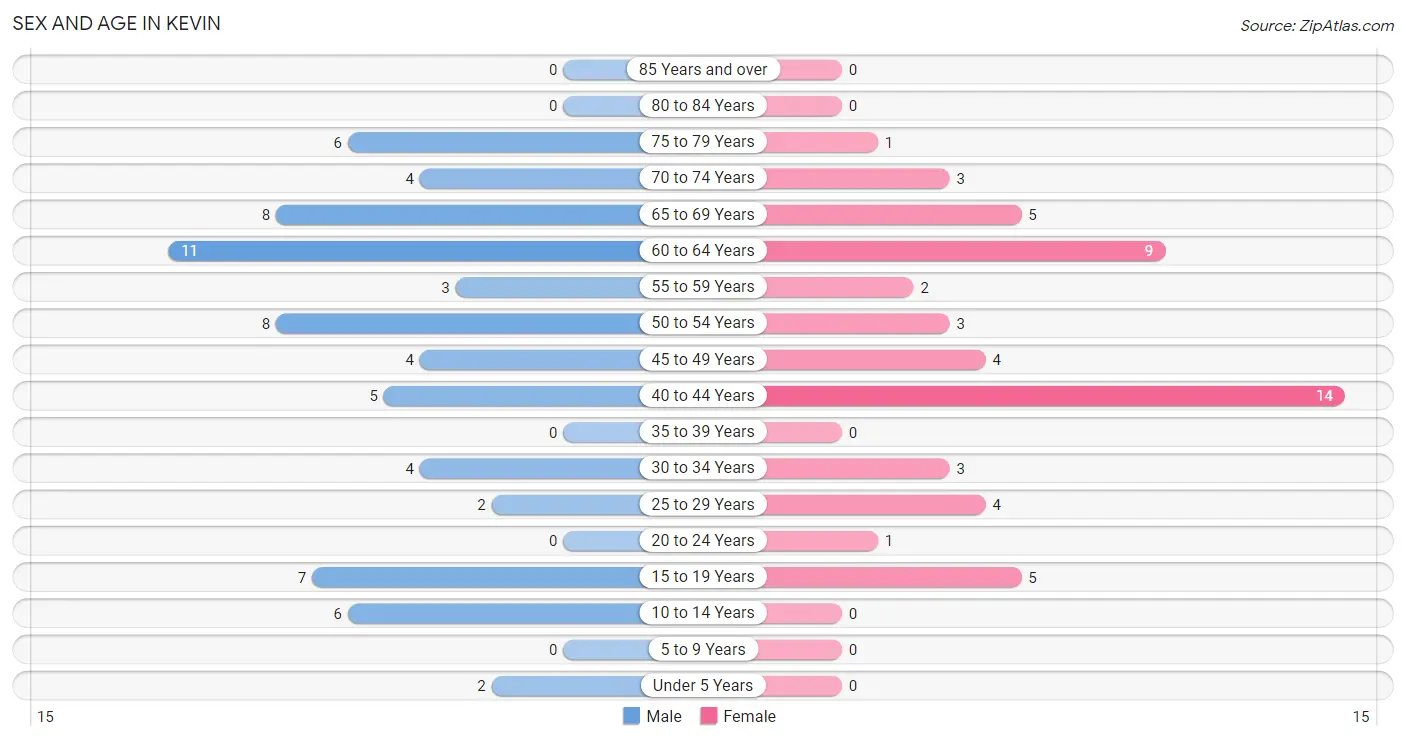
| Age Bracket | Male | Female |
| Under 5 Years | 2 (2.9%) | 0 (0.0%) |
| 5 to 9 Years | 0 (0.0%) | 0 (0.0%) |
| 10 to 14 Years | 6 (8.6%) | 0 (0.0%) |
| 15 to 19 Years | 7 (10.0%) | 5 (9.3%) |
| 20 to 24 Years | 0 (0.0%) | 1 (1.8%) |
| 25 to 29 Years | 2 (2.9%) | 4 (7.4%) |
| 30 to 34 Years | 4 (5.7%) | 3 (5.6%) |
| 35 to 39 Years | 0 (0.0%) | 0 (0.0%) |
| 40 to 44 Years | 5 (7.1%) | 14 (25.9%) |
| 45 to 49 Years | 4 (5.7%) | 4 (7.4%) |
| 50 to 54 Years | 8 (11.4%) | 3 (5.6%) |
| 55 to 59 Years | 3 (4.3%) | 2 (3.7%) |
| 60 to 64 Years | 11 (15.7%) | 9 (16.7%) |
| 65 to 69 Years | 8 (11.4%) | 5 (9.3%) |
| 70 to 74 Years | 4 (5.7%) | 3 (5.6%) |
| 75 to 79 Years | 6 (8.6%) | 1 (1.8%) |
| 80 to 84 Years | 0 (0.0%) | 0 (0.0%) |
| 85 Years and over | 0 (0.0%) | 0 (0.0%) |
| Total | 70 (100.0%) | 54 (100.0%) |
Families and Households in Kevin
Median Family Size in Kevin
The median family size in Kevin is 2.56 persons per family, with single female/mother families (2 | 5.6%) accounting for the largest median family size of 4 persons per family. On the other hand, married-couple families (31 | 86.1%) represent the smallest median family size with 2.35 persons per family.
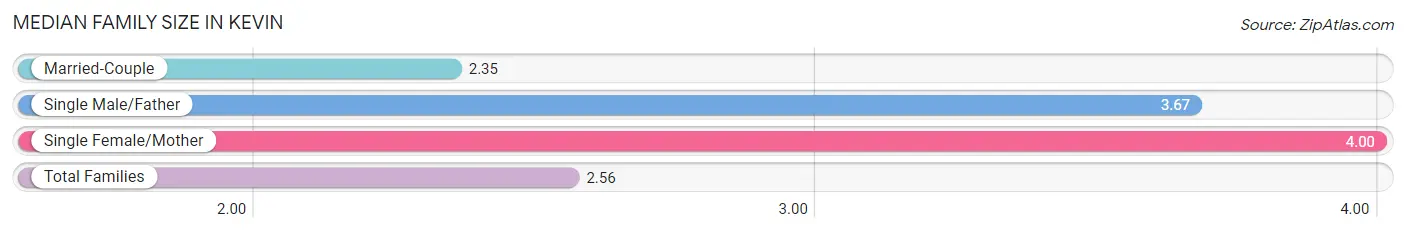
| Family Type | # Families | Family Size |
| Married-Couple | 31 (86.1%) | 2.35 |
| Single Male/Father | 3 (8.3%) | 3.67 |
| Single Female/Mother | 2 (5.6%) | 4.00 |
| Total Families | 36 (100.0%) | 2.56 |
Median Household Size in Kevin
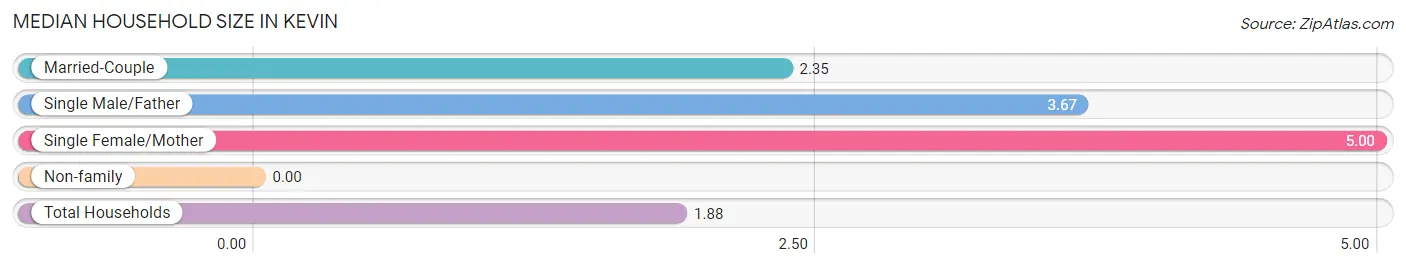
| Household Type | # Households | Household Size |
| Married-Couple | 31 (47.0%) | 2.35 |
| Single Male/Father | 3 (4.5%) | 3.67 |
| Single Female/Mother | 2 (3.0%) | 5.00 |
| Non-family | 30 (45.5%) | - |
| Total Households | 66 (100.0%) | 1.88 |
Household Size by Marriage Status in Kevin
Out of a total of 66 households in Kevin, 36 (54.5%) are family households, while 30 (45.5%) are nonfamily households. The most numerous type of family households are 2-person households, comprising 23, and the most common type of nonfamily households are 1-person households, comprising 30.
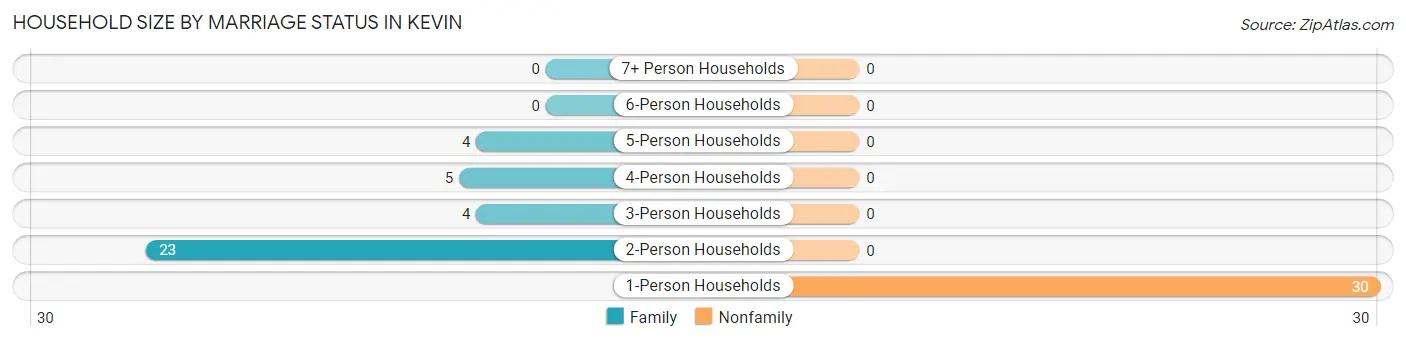
| Household Size | Family Households | Nonfamily Households |
| 1-Person Households | - | 30 (45.5%) |
| 2-Person Households | 23 (34.8%) | 0 (0.0%) |
| 3-Person Households | 4 (6.1%) | 0 (0.0%) |
| 4-Person Households | 5 (7.6%) | 0 (0.0%) |
| 5-Person Households | 4 (6.1%) | 0 (0.0%) |
| 6-Person Households | 0 (0.0%) | 0 (0.0%) |
| 7+ Person Households | 0 (0.0%) | 0 (0.0%) |
| Total | 36 (54.5%) | 30 (45.5%) |
Female Fertility in Kevin
Fertility by Age in Kevin
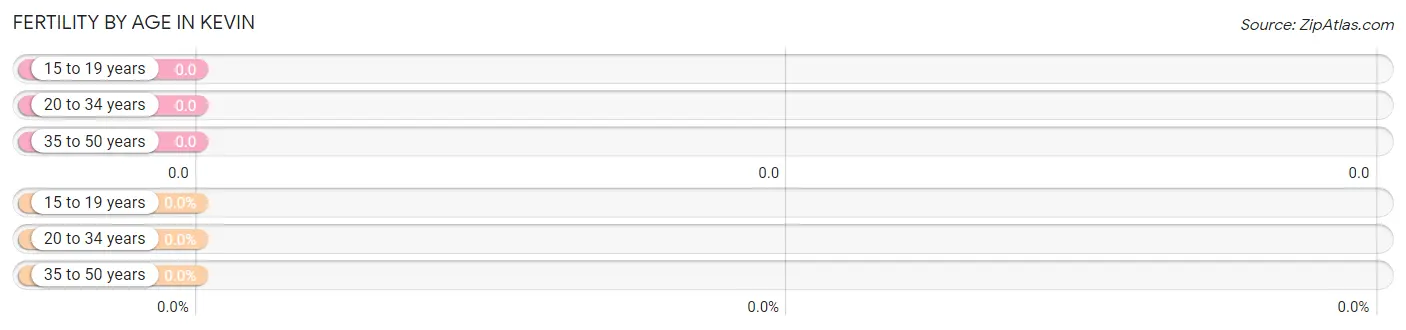
| Age Bracket | Women with Births | Births / 1,000 Women |
| 15 to 19 years | 0 (0.0%) | 0.0 |
| 20 to 34 years | 0 (0.0%) | 0.0 |
| 35 to 50 years | 0 (0.0%) | 0.0 |
| Total | 0 (0.0%) | 0.0 |
Fertility by Age by Marriage Status in Kevin
| Age Bracket | Married | Unmarried |
| 15 to 19 years | 0 (0.0%) | 0 (0.0%) |
| 20 to 34 years | 0 (0.0%) | 0 (0.0%) |
| 35 to 50 years | 0 (0.0%) | 0 (0.0%) |
| Total | 0 (0.0%) | 0 (0.0%) |
Fertility by Education in Kevin
| Educational Attainment | Women with Births | Births / 1,000 Women |
| Less than High School | 0 (0.0%) | 0.0 |
| High School Diploma | 0 (0.0%) | 0.0 |
| College or Associate's Degree | 0 (0.0%) | 0.0 |
| Bachelor's Degree | 0 (0.0%) | 0.0 |
| Graduate Degree | 0 (0.0%) | 0.0 |
| Total | 0 (0.0%) | 0.0 |
Fertility by Education by Marriage Status in Kevin
| Educational Attainment | Married | Unmarried |
| Less than High School | 0 (0.0%) | 0 (0.0%) |
| High School Diploma | 0 (0.0%) | 0 (0.0%) |
| College or Associate's Degree | 0 (0.0%) | 0 (0.0%) |
| Bachelor's Degree | 0 (0.0%) | 0 (0.0%) |
| Graduate Degree | 0 (0.0%) | 0 (0.0%) |
| Total | 0 (0.0%) | 0 (0.0%) |
Employment Characteristics in Kevin
Employment by Class of Employer in Kevin
Among the 64 employed individuals in Kevin, private company employees (40 | 62.5%), local government employees (10 | 15.6%), and self-employed (incorporated) (8 | 12.5%) make up the most common classes of employment.
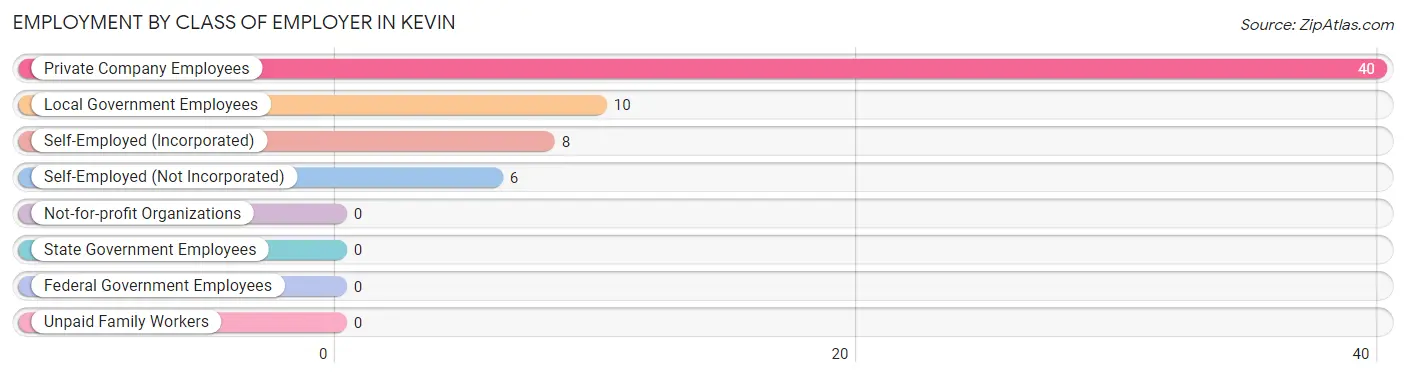
| Employer Class | # Employees | % Employees |
| Private Company Employees | 40 | 62.5% |
| Self-Employed (Incorporated) | 8 | 12.5% |
| Self-Employed (Not Incorporated) | 6 | 9.4% |
| Not-for-profit Organizations | 0 | 0.0% |
| Local Government Employees | 10 | 15.6% |
| State Government Employees | 0 | 0.0% |
| Federal Government Employees | 0 | 0.0% |
| Unpaid Family Workers | 0 | 0.0% |
| Total | 64 | 100.0% |
Employment Status by Age in Kevin
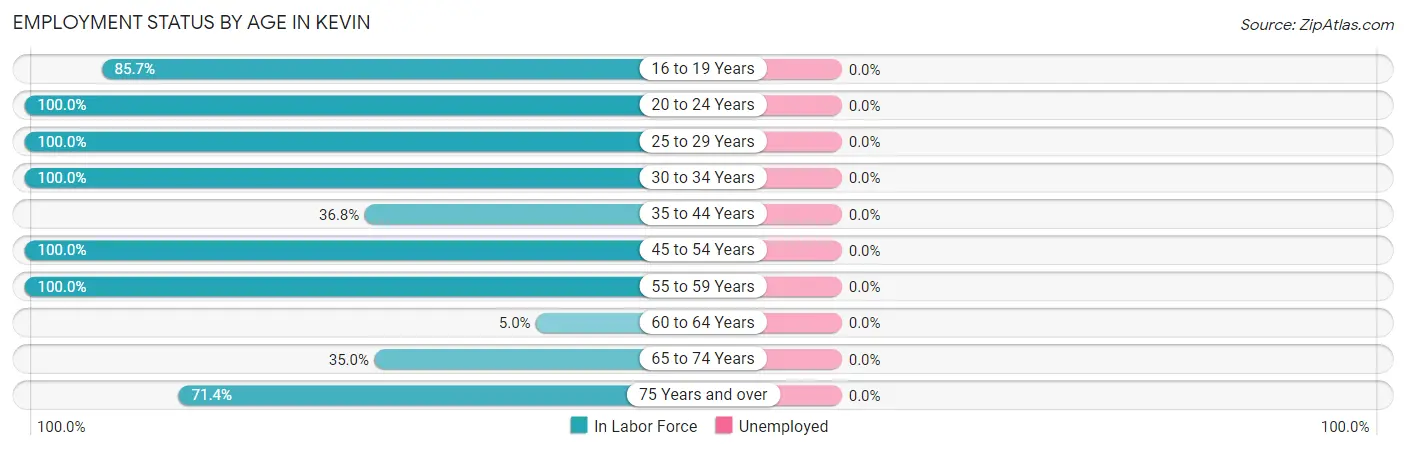
| Age Bracket | In Labor Force | Unemployed |
| 16 to 19 Years | 6 (85.7%) | 0 (0.0%) |
| 20 to 24 Years | 1 (100.0%) | 0 (0.0%) |
| 25 to 29 Years | 6 (100.0%) | 0 (0.0%) |
| 30 to 34 Years | 7 (100.0%) | 0 (0.0%) |
| 35 to 44 Years | 7 (36.8%) | 0 (0.0%) |
| 45 to 54 Years | 19 (100.0%) | 0 (0.0%) |
| 55 to 59 Years | 5 (100.0%) | 0 (0.0%) |
| 60 to 64 Years | 1 (5.0%) | 0 (0.0%) |
| 65 to 74 Years | 7 (35.0%) | 0 (0.0%) |
| 75 Years and over | 5 (71.4%) | 0 (0.0%) |
| Total | 64 (57.7%) | 0 (0.0%) |
Employment Status by Educational Attainment in Kevin
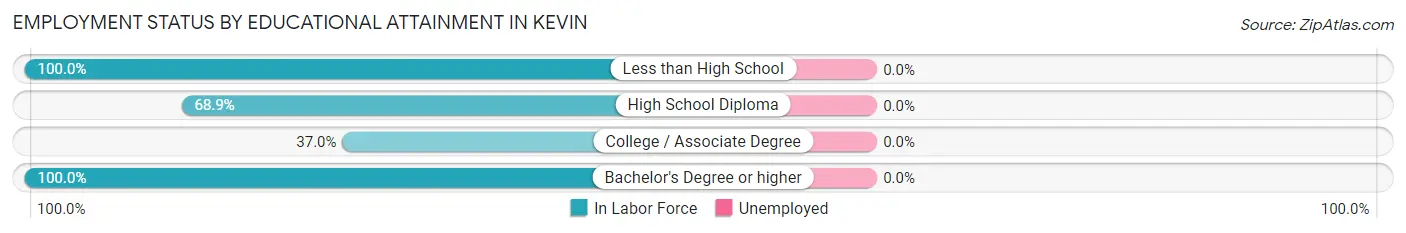
| Educational Attainment | In Labor Force | Unemployed |
| Less than High School | 3 (100.0%) | 0 (0.0%) |
| High School Diploma | 31 (68.9%) | 0 (0.0%) |
| College / Associate Degree | 10 (37.0%) | 0 (0.0%) |
| Bachelor's Degree or higher | 1 (100.0%) | 0 (0.0%) |
| Total | 45 (59.2%) | 0 (0.0%) |
Employment Occupations by Sex in Kevin
Management, Business, Science and Arts Occupations
The most common Management, Business, Science and Arts occupations in Kevin are Management (21 | 32.8%), Business & Financial (4 | 6.2%), Community & Social Service (1 | 1.6%), and Education Instruction & Library (1 | 1.6%).
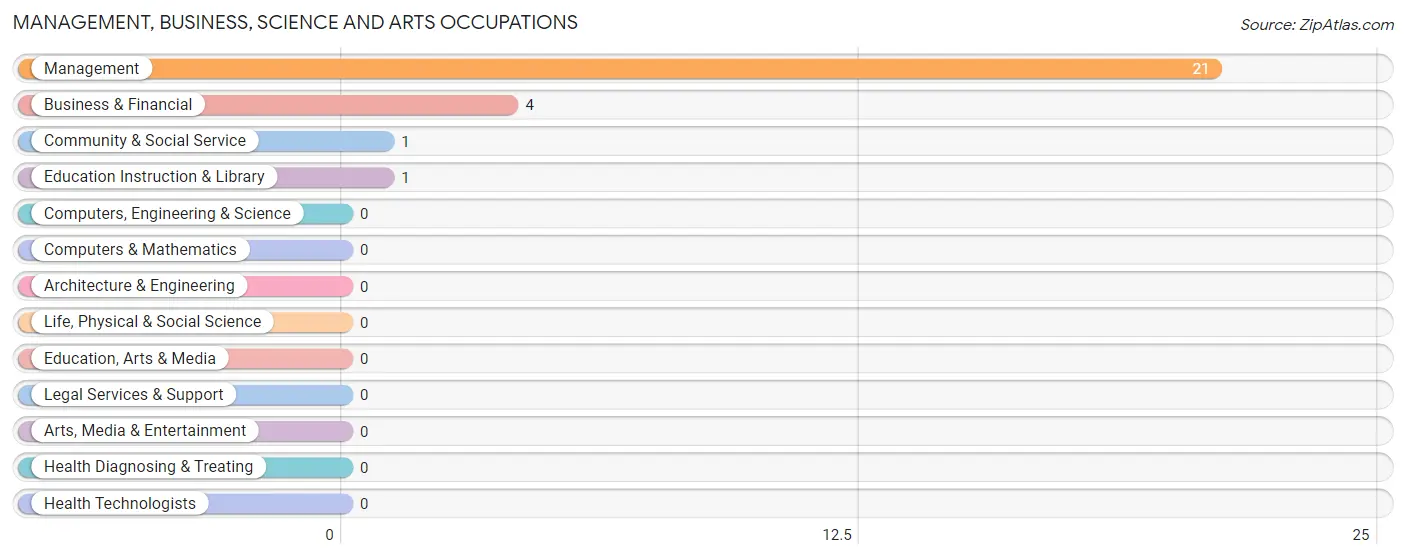
Management, Business, Science and Arts Occupations by Sex
Within the Management, Business, Science and Arts occupations in Kevin, the most male-oriented occupations are Management (85.7%), and Business & Financial (50.0%), while the most female-oriented occupations are Community & Social Service (100.0%), Education Instruction & Library (100.0%), and Business & Financial (50.0%).
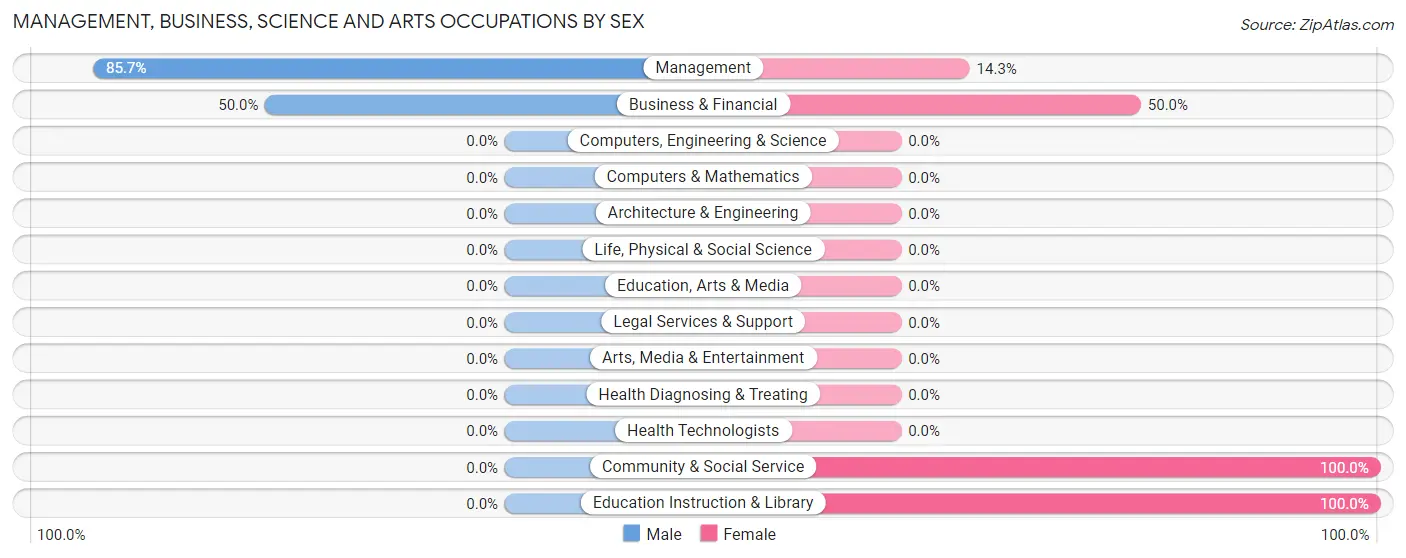
| Occupation | Male | Female |
| Management | 18 (85.7%) | 3 (14.3%) |
| Business & Financial | 2 (50.0%) | 2 (50.0%) |
| Computers, Engineering & Science | 0 (0.0%) | 0 (0.0%) |
| Computers & Mathematics | 0 (0.0%) | 0 (0.0%) |
| Architecture & Engineering | 0 (0.0%) | 0 (0.0%) |
| Life, Physical & Social Science | 0 (0.0%) | 0 (0.0%) |
| Community & Social Service | 0 (0.0%) | 1 (100.0%) |
| Education, Arts & Media | 0 (0.0%) | 0 (0.0%) |
| Legal Services & Support | 0 (0.0%) | 0 (0.0%) |
| Education Instruction & Library | 0 (0.0%) | 1 (100.0%) |
| Arts, Media & Entertainment | 0 (0.0%) | 0 (0.0%) |
| Health Diagnosing & Treating | 0 (0.0%) | 0 (0.0%) |
| Health Technologists | 0 (0.0%) | 0 (0.0%) |
| Total (Category) | 20 (76.9%) | 6 (23.1%) |
| Total (Overall) | 42 (65.6%) | 22 (34.4%) |
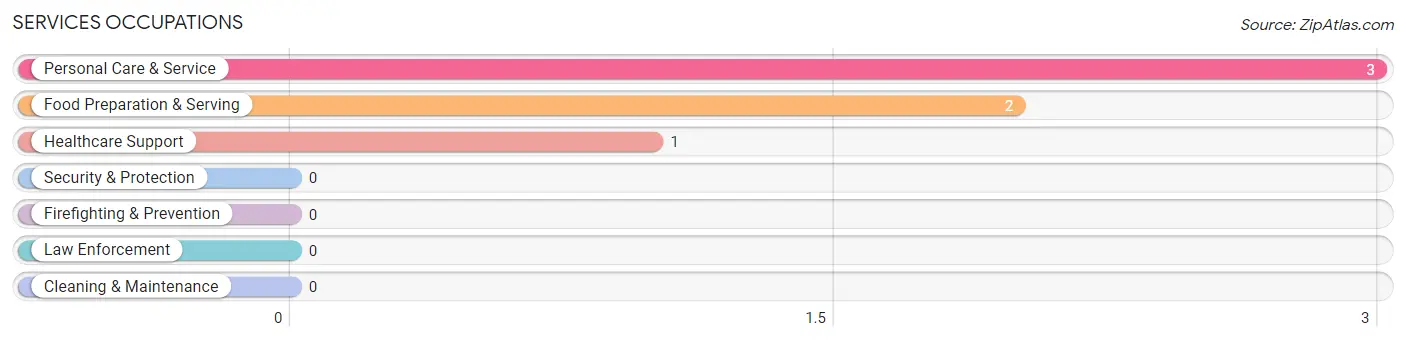
Services Occupations
The most common Services occupations in Kevin are Personal Care & Service (3 | 4.7%), Food Preparation & Serving (2 | 3.1%), and Healthcare Support (1 | 1.6%).
Services Occupations by Sex
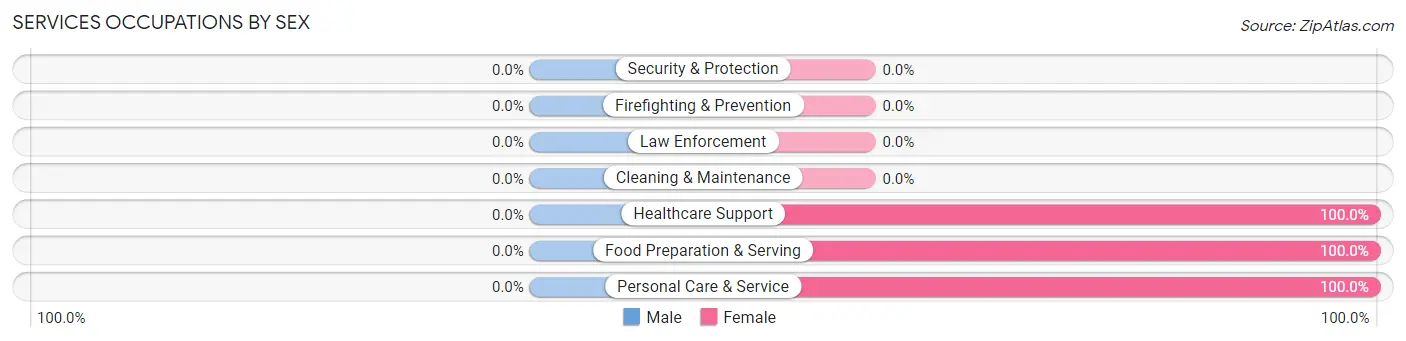
| Occupation | Male | Female |
| Healthcare Support | 0 (0.0%) | 1 (100.0%) |
| Security & Protection | 0 (0.0%) | 0 (0.0%) |
| Firefighting & Prevention | 0 (0.0%) | 0 (0.0%) |
| Law Enforcement | 0 (0.0%) | 0 (0.0%) |
| Food Preparation & Serving | 0 (0.0%) | 2 (100.0%) |
| Cleaning & Maintenance | 0 (0.0%) | 0 (0.0%) |
| Personal Care & Service | 0 (0.0%) | 3 (100.0%) |
| Total (Category) | 0 (0.0%) | 6 (100.0%) |
| Total (Overall) | 42 (65.6%) | 22 (34.4%) |
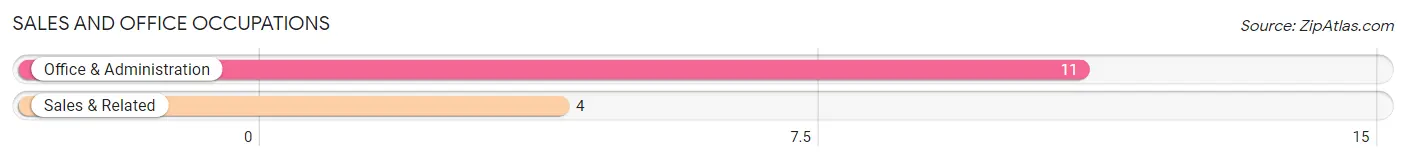
Sales and Office Occupations
The most common Sales and Office occupations in Kevin are Office & Administration (11 | 17.2%), and Sales & Related (4 | 6.2%).
Sales and Office Occupations by Sex
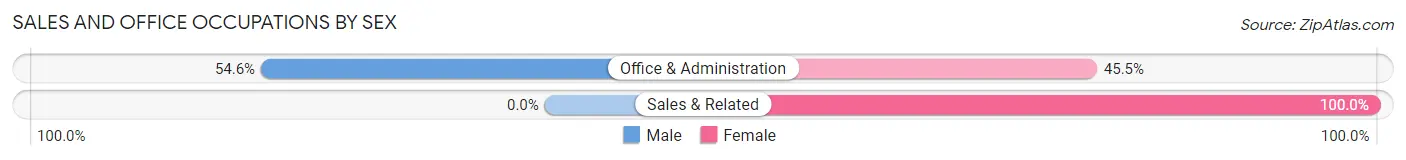
| Occupation | Male | Female |
| Sales & Related | 0 (0.0%) | 4 (100.0%) |
| Office & Administration | 6 (54.5%) | 5 (45.5%) |
| Total (Category) | 6 (40.0%) | 9 (60.0%) |
| Total (Overall) | 42 (65.6%) | 22 (34.4%) |
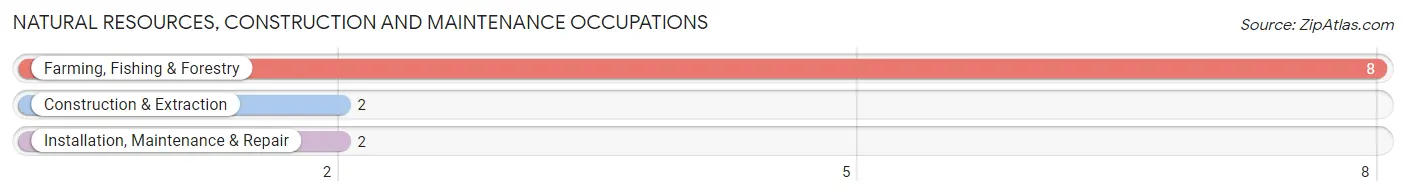
Natural Resources, Construction and Maintenance Occupations
The most common Natural Resources, Construction and Maintenance occupations in Kevin are Farming, Fishing & Forestry (8 | 12.5%), Construction & Extraction (2 | 3.1%), and Installation, Maintenance & Repair (2 | 3.1%).
Natural Resources, Construction and Maintenance Occupations by Sex
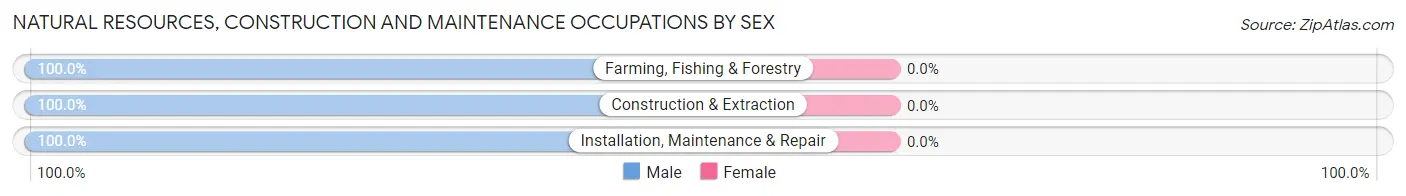
| Occupation | Male | Female |
| Farming, Fishing & Forestry | 8 (100.0%) | 0 (0.0%) |
| Construction & Extraction | 2 (100.0%) | 0 (0.0%) |
| Installation, Maintenance & Repair | 2 (100.0%) | 0 (0.0%) |
| Total (Category) | 12 (100.0%) | 0 (0.0%) |
| Total (Overall) | 42 (65.6%) | 22 (34.4%) |
Production, Transportation and Moving Occupations
The most common Production, Transportation and Moving occupations in Kevin are Production (2 | 3.1%), Material Moving (2 | 3.1%), and Transportation (1 | 1.6%).
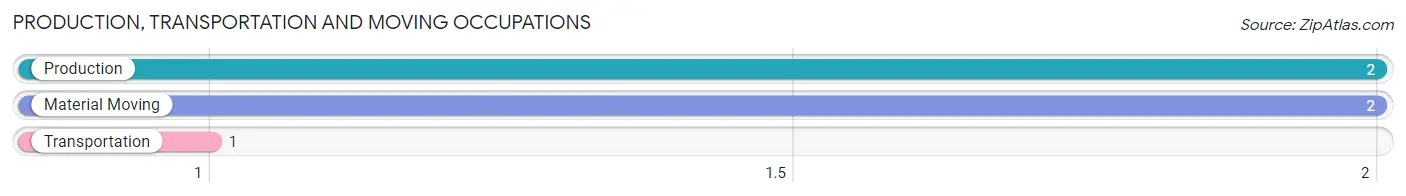
Production, Transportation and Moving Occupations by Sex
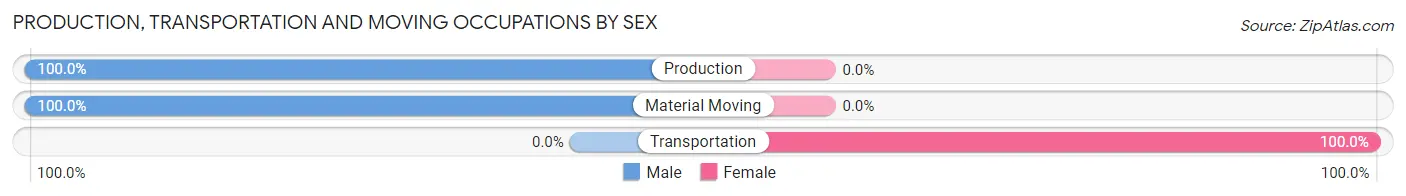
| Occupation | Male | Female |
| Production | 2 (100.0%) | 0 (0.0%) |
| Transportation | 0 (0.0%) | 1 (100.0%) |
| Material Moving | 2 (100.0%) | 0 (0.0%) |
| Total (Category) | 4 (80.0%) | 1 (20.0%) |
| Total (Overall) | 42 (65.6%) | 22 (34.4%) |
Employment Industries by Sex in Kevin
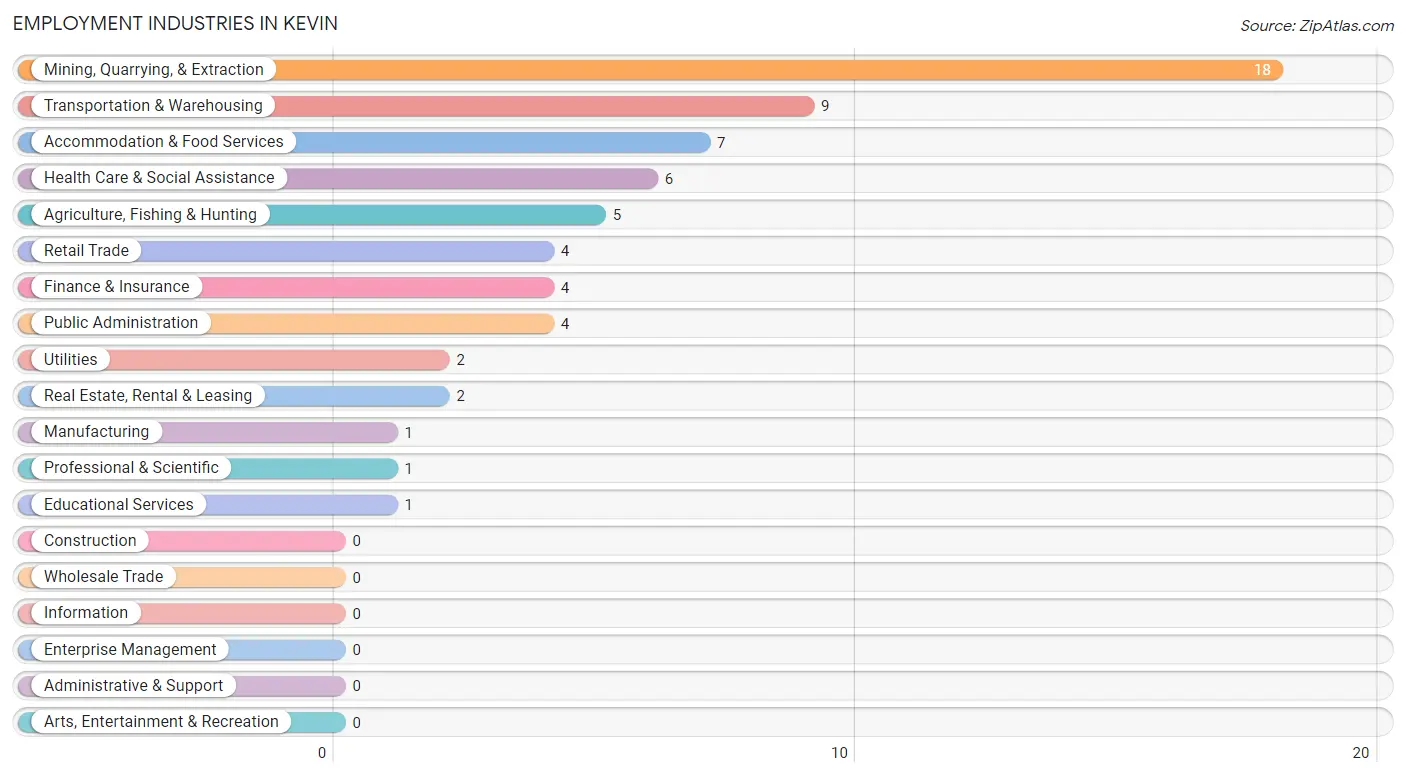
Employment Industries in Kevin
The major employment industries in Kevin include Mining, Quarrying, & Extraction (18 | 28.1%), Transportation & Warehousing (9 | 14.1%), Accommodation & Food Services (7 | 10.9%), Health Care & Social Assistance (6 | 9.4%), and Agriculture, Fishing & Hunting (5 | 7.8%).
Employment Industries by Sex in Kevin
The Kevin industries that see more men than women are Agriculture, Fishing & Hunting (100.0%), Mining, Quarrying, & Extraction (100.0%), and Manufacturing (100.0%), whereas the industries that tend to have a higher number of women are Retail Trade (100.0%), Professional & Scientific (100.0%), and Educational Services (100.0%).
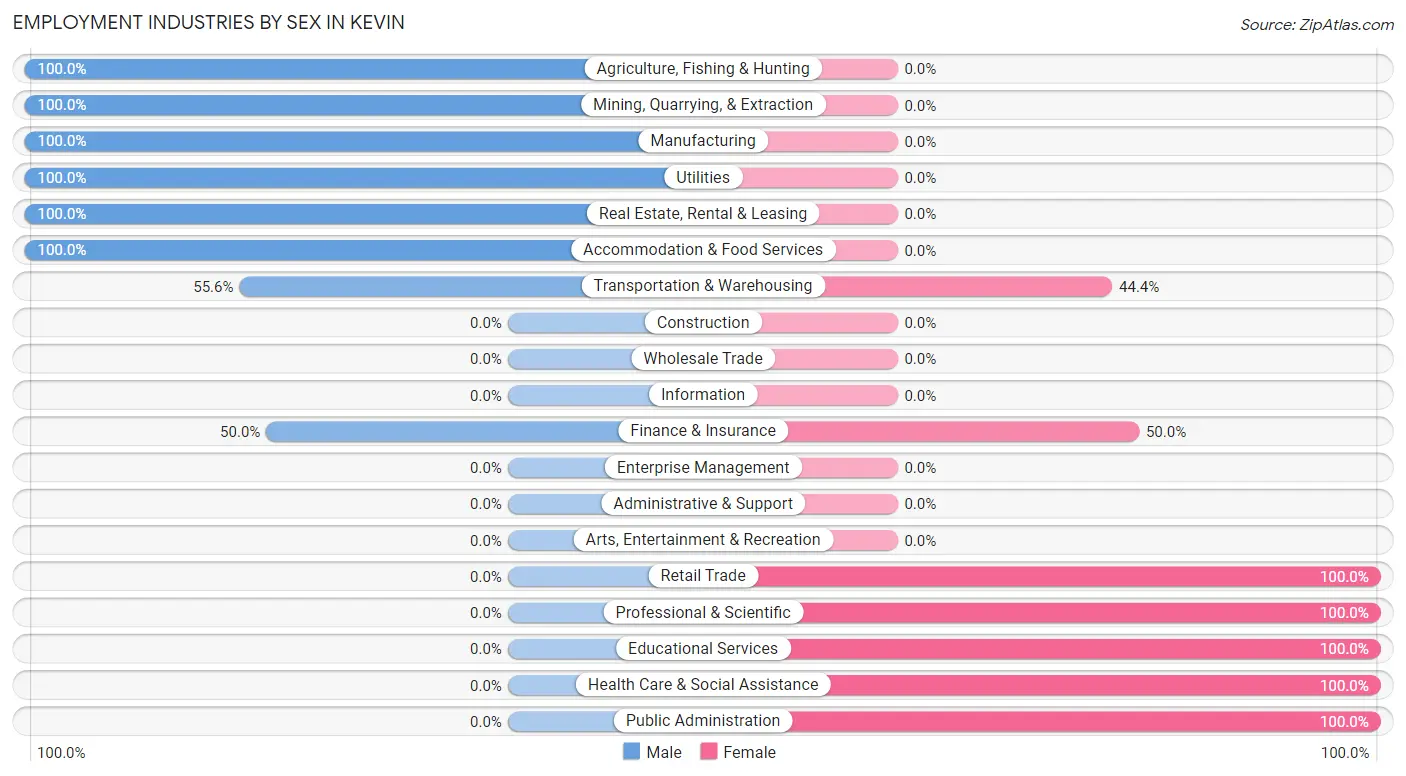
| Industry | Male | Female |
| Agriculture, Fishing & Hunting | 5 (100.0%) | 0 (0.0%) |
| Mining, Quarrying, & Extraction | 18 (100.0%) | 0 (0.0%) |
| Construction | 0 (0.0%) | 0 (0.0%) |
| Manufacturing | 1 (100.0%) | 0 (0.0%) |
| Wholesale Trade | 0 (0.0%) | 0 (0.0%) |
| Retail Trade | 0 (0.0%) | 4 (100.0%) |
| Transportation & Warehousing | 5 (55.6%) | 4 (44.4%) |
| Utilities | 2 (100.0%) | 0 (0.0%) |
| Information | 0 (0.0%) | 0 (0.0%) |
| Finance & Insurance | 2 (50.0%) | 2 (50.0%) |
| Real Estate, Rental & Leasing | 2 (100.0%) | 0 (0.0%) |
| Professional & Scientific | 0 (0.0%) | 1 (100.0%) |
| Enterprise Management | 0 (0.0%) | 0 (0.0%) |
| Administrative & Support | 0 (0.0%) | 0 (0.0%) |
| Educational Services | 0 (0.0%) | 1 (100.0%) |
| Health Care & Social Assistance | 0 (0.0%) | 6 (100.0%) |
| Arts, Entertainment & Recreation | 0 (0.0%) | 0 (0.0%) |
| Accommodation & Food Services | 7 (100.0%) | 0 (0.0%) |
| Public Administration | 0 (0.0%) | 4 (100.0%) |
| Total | 42 (65.6%) | 22 (34.4%) |
Education in Kevin
School Enrollment in Kevin
The most common levels of schooling among the 12 students in Kevin are middle school (10 | 83.3%), and high school (2 | 16.7%).
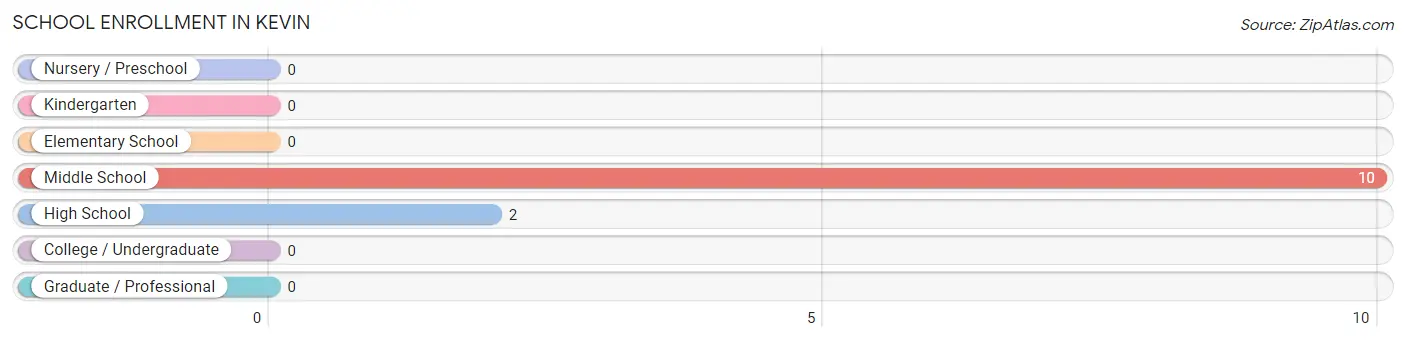
| School Level | # Students | % Students |
| Nursery / Preschool | 0 | 0.0% |
| Kindergarten | 0 | 0.0% |
| Elementary School | 0 | 0.0% |
| Middle School | 10 | 83.3% |
| High School | 2 | 16.7% |
| College / Undergraduate | 0 | 0.0% |
| Graduate / Professional | 0 | 0.0% |
| Total | 12 | 100.0% |
School Enrollment by Age by Funding Source in Kevin
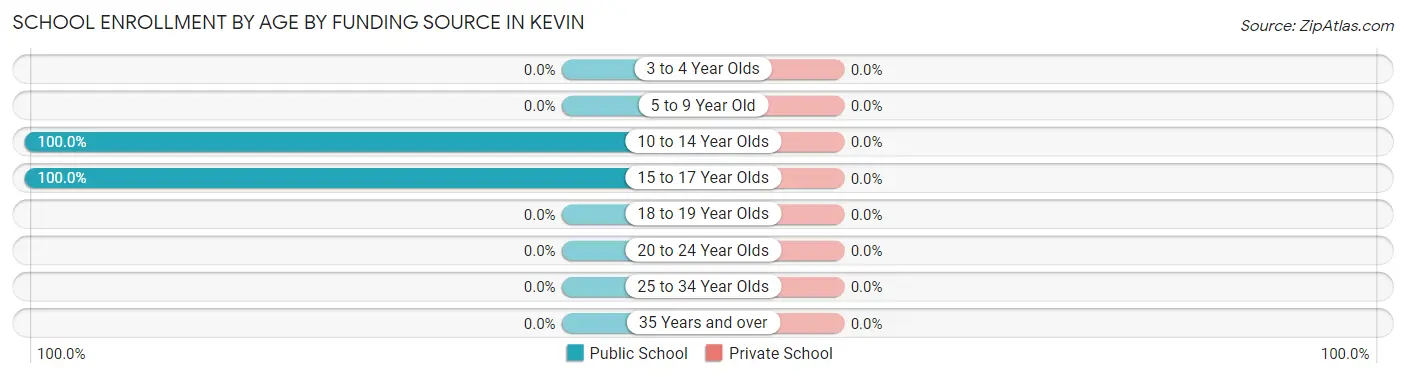
| Age Bracket | Public School | Private School |
| 3 to 4 Year Olds | 0 (0.0%) | 0 (0.0%) |
| 5 to 9 Year Old | 0 (0.0%) | 0 (0.0%) |
| 10 to 14 Year Olds | 6 (100.0%) | 0 (0.0%) |
| 15 to 17 Year Olds | 6 (100.0%) | 0 (0.0%) |
| 18 to 19 Year Olds | 0 (0.0%) | 0 (0.0%) |
| 20 to 24 Year Olds | 0 (0.0%) | 0 (0.0%) |
| 25 to 34 Year Olds | 0 (0.0%) | 0 (0.0%) |
| 35 Years and over | 0 (0.0%) | 0 (0.0%) |
| Total | 12 (100.0%) | 0 (0.0%) |
Educational Attainment by Field of Study in Kevin
, and business (1 | 100.0%) are the most common fields of study among 1 individuals in Kevin who have obtained a bachelor's degree or higher.
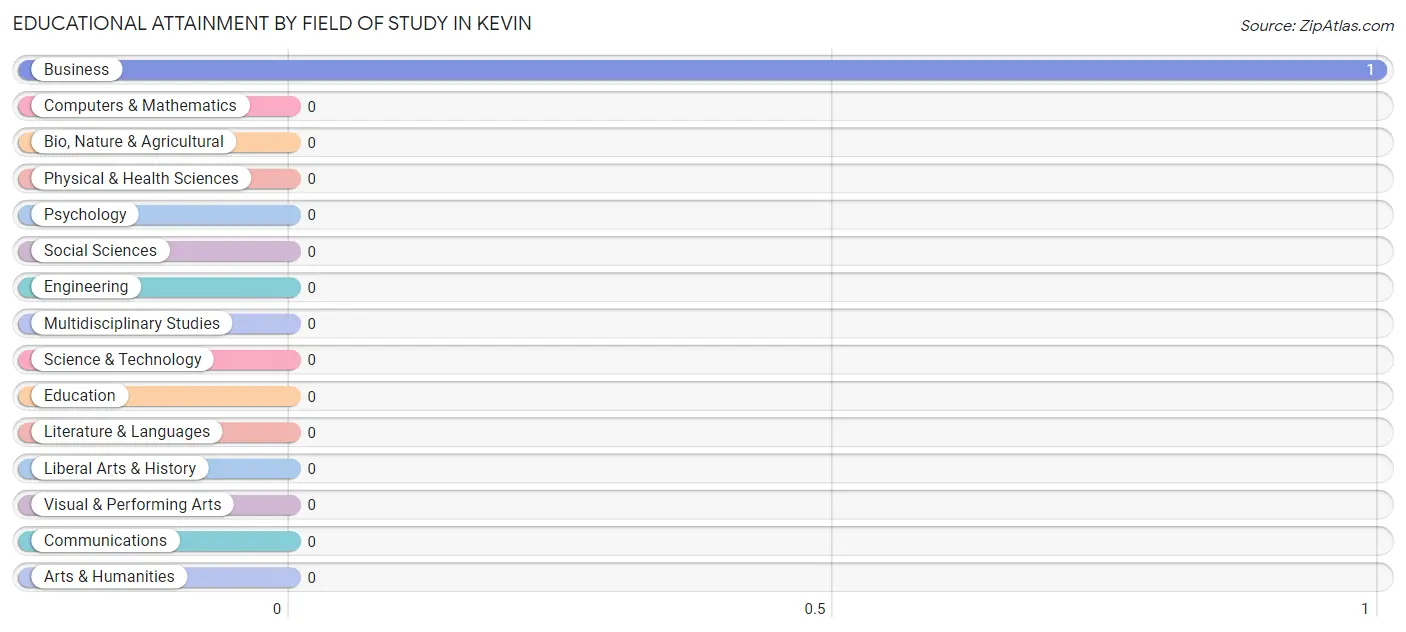
| Field of Study | # Graduates | % Graduates |
| Computers & Mathematics | 0 | 0.0% |
| Bio, Nature & Agricultural | 0 | 0.0% |
| Physical & Health Sciences | 0 | 0.0% |
| Psychology | 0 | 0.0% |
| Social Sciences | 0 | 0.0% |
| Engineering | 0 | 0.0% |
| Multidisciplinary Studies | 0 | 0.0% |
| Science & Technology | 0 | 0.0% |
| Business | 1 | 100.0% |
| Education | 0 | 0.0% |
| Literature & Languages | 0 | 0.0% |
| Liberal Arts & History | 0 | 0.0% |
| Visual & Performing Arts | 0 | 0.0% |
| Communications | 0 | 0.0% |
| Arts & Humanities | 0 | 0.0% |
| Total | 1 | 100.0% |
Transportation & Commute in Kevin
Vehicle Availability by Sex in Kevin
The most prevalent vehicle ownership categories in Kevin are males with 5 or more vehicles (13, accounting for 30.9%) and females with 5 or more vehicles (4, making up 59.1%).
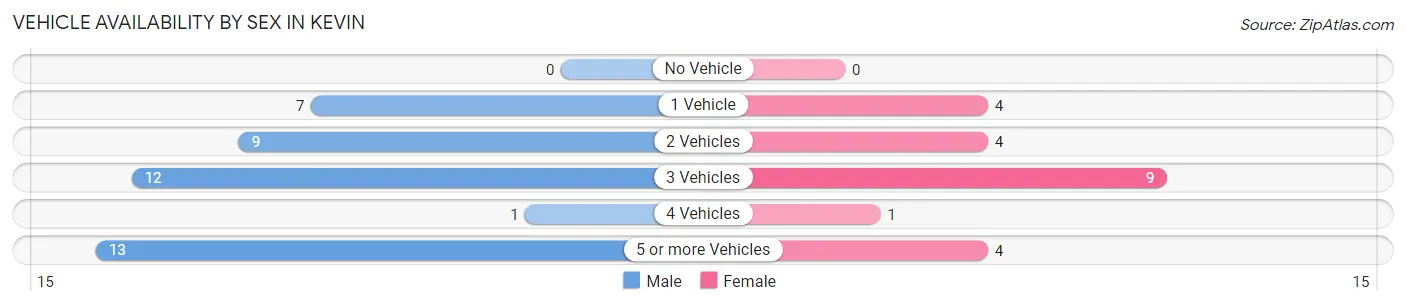
| Vehicles Available | Male | Female |
| No Vehicle | 0 (0.0%) | 0 (0.0%) |
| 1 Vehicle | 7 (16.7%) | 4 (18.2%) |
| 2 Vehicles | 9 (21.4%) | 4 (18.2%) |
| 3 Vehicles | 12 (28.6%) | 9 (40.9%) |
| 4 Vehicles | 1 (2.4%) | 1 (4.5%) |
| 5 or more Vehicles | 13 (30.9%) | 4 (18.2%) |
| Total | 42 (100.0%) | 22 (100.0%) |
Commute Time in Kevin
The most frequently occuring commute durations in Kevin are 30 to 34 minutes (16 commuters, 27.1%), 5 to 9 minutes (13 commuters, 22.0%), and 10 to 14 minutes (9 commuters, 15.2%).
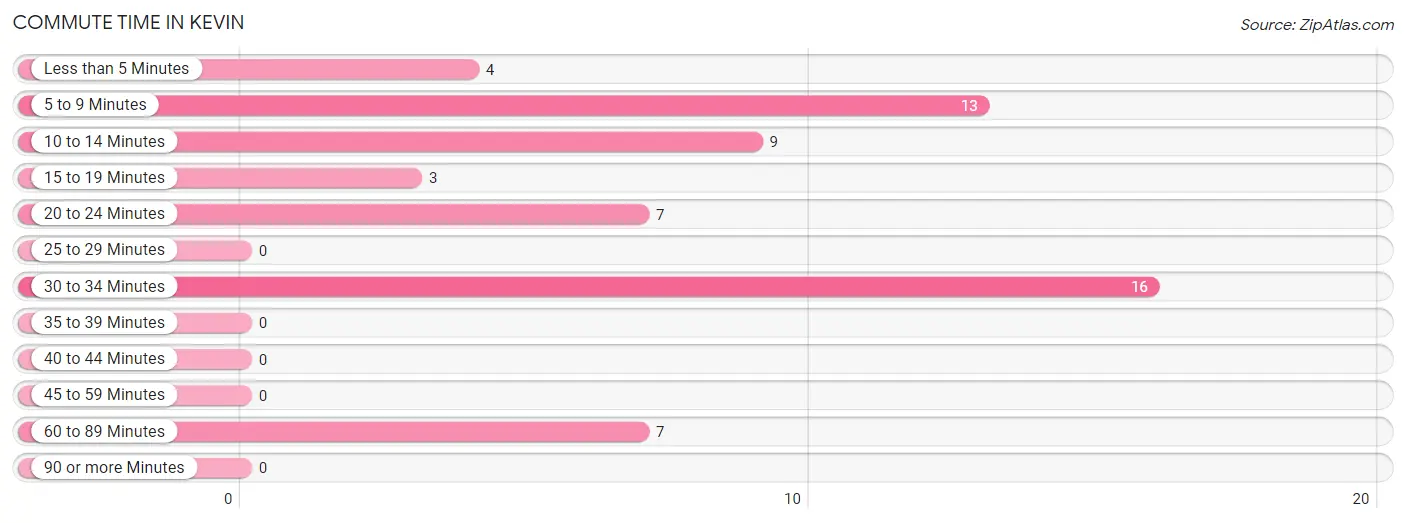
| Commute Time | # Commuters | % Commuters |
| Less than 5 Minutes | 4 | 6.8% |
| 5 to 9 Minutes | 13 | 22.0% |
| 10 to 14 Minutes | 9 | 15.2% |
| 15 to 19 Minutes | 3 | 5.1% |
| 20 to 24 Minutes | 7 | 11.9% |
| 25 to 29 Minutes | 0 | 0.0% |
| 30 to 34 Minutes | 16 | 27.1% |
| 35 to 39 Minutes | 0 | 0.0% |
| 40 to 44 Minutes | 0 | 0.0% |
| 45 to 59 Minutes | 0 | 0.0% |
| 60 to 89 Minutes | 7 | 11.9% |
| 90 or more Minutes | 0 | 0.0% |
Commute Time by Sex in Kevin
The most common commute times in Kevin are 30 to 34 minutes (12 commuters, 28.6%) for males and 20 to 24 minutes (5 commuters, 29.4%) for females.
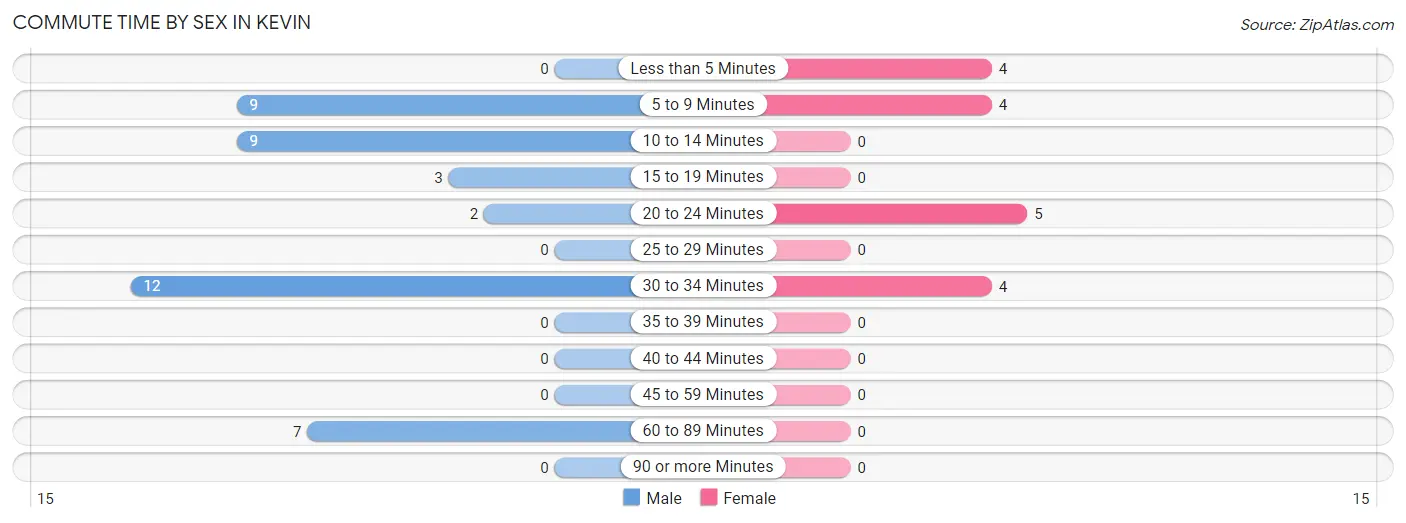
| Commute Time | Male | Female |
| Less than 5 Minutes | 0 (0.0%) | 4 (23.5%) |
| 5 to 9 Minutes | 9 (21.4%) | 4 (23.5%) |
| 10 to 14 Minutes | 9 (21.4%) | 0 (0.0%) |
| 15 to 19 Minutes | 3 (7.1%) | 0 (0.0%) |
| 20 to 24 Minutes | 2 (4.8%) | 5 (29.4%) |
| 25 to 29 Minutes | 0 (0.0%) | 0 (0.0%) |
| 30 to 34 Minutes | 12 (28.6%) | 4 (23.5%) |
| 35 to 39 Minutes | 0 (0.0%) | 0 (0.0%) |
| 40 to 44 Minutes | 0 (0.0%) | 0 (0.0%) |
| 45 to 59 Minutes | 0 (0.0%) | 0 (0.0%) |
| 60 to 89 Minutes | 7 (16.7%) | 0 (0.0%) |
| 90 or more Minutes | 0 (0.0%) | 0 (0.0%) |
Time of Departure to Work by Sex in Kevin
The most frequent times of departure to work in Kevin are 7:30 AM to 7:59 AM (16, 38.1%) for males and 5:00 AM to 5:29 AM (5, 29.4%) for females.
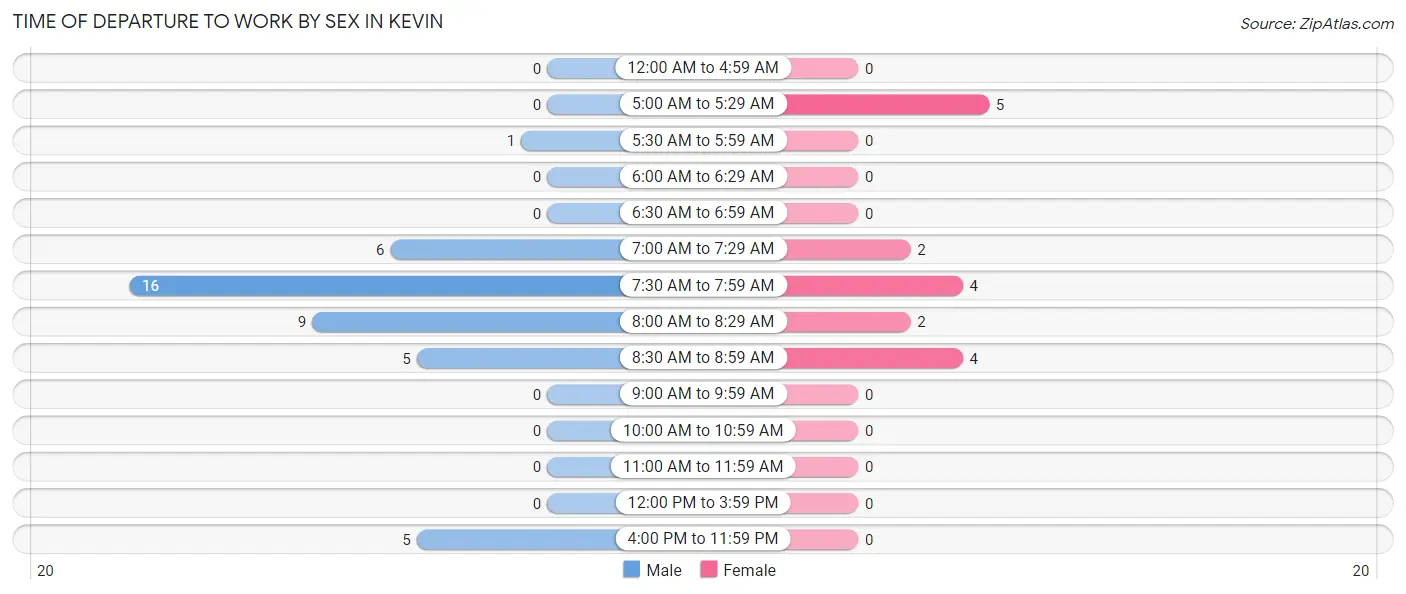
| Time of Departure | Male | Female |
| 12:00 AM to 4:59 AM | 0 (0.0%) | 0 (0.0%) |
| 5:00 AM to 5:29 AM | 0 (0.0%) | 5 (29.4%) |
| 5:30 AM to 5:59 AM | 1 (2.4%) | 0 (0.0%) |
| 6:00 AM to 6:29 AM | 0 (0.0%) | 0 (0.0%) |
| 6:30 AM to 6:59 AM | 0 (0.0%) | 0 (0.0%) |
| 7:00 AM to 7:29 AM | 6 (14.3%) | 2 (11.8%) |
| 7:30 AM to 7:59 AM | 16 (38.1%) | 4 (23.5%) |
| 8:00 AM to 8:29 AM | 9 (21.4%) | 2 (11.8%) |
| 8:30 AM to 8:59 AM | 5 (11.9%) | 4 (23.5%) |
| 9:00 AM to 9:59 AM | 0 (0.0%) | 0 (0.0%) |
| 10:00 AM to 10:59 AM | 0 (0.0%) | 0 (0.0%) |
| 11:00 AM to 11:59 AM | 0 (0.0%) | 0 (0.0%) |
| 12:00 PM to 3:59 PM | 0 (0.0%) | 0 (0.0%) |
| 4:00 PM to 11:59 PM | 5 (11.9%) | 0 (0.0%) |
| Total | 42 (100.0%) | 17 (100.0%) |
Housing Occupancy in Kevin
Occupancy by Ownership in Kevin
Of the total 66 dwellings in Kevin, owner-occupied units account for 56 (84.9%), while renter-occupied units make up 10 (15.1%).
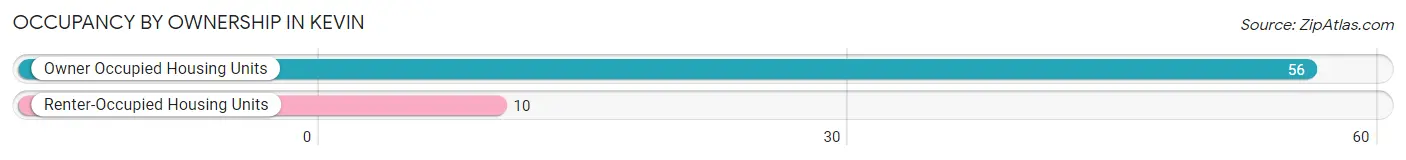
| Occupancy | # Housing Units | % Housing Units |
| Owner Occupied Housing Units | 56 | 84.9% |
| Renter-Occupied Housing Units | 10 | 15.1% |
| Total Occupied Housing Units | 66 | 100.0% |
Occupancy by Household Size in Kevin
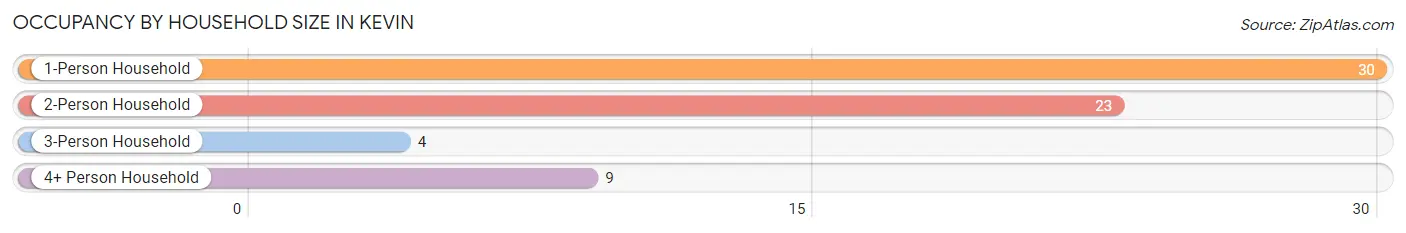
| Household Size | # Housing Units | % Housing Units |
| 1-Person Household | 30 | 45.5% |
| 2-Person Household | 23 | 34.8% |
| 3-Person Household | 4 | 6.1% |
| 4+ Person Household | 9 | 13.6% |
| Total Housing Units | 66 | 100.0% |
Occupancy by Ownership by Household Size in Kevin
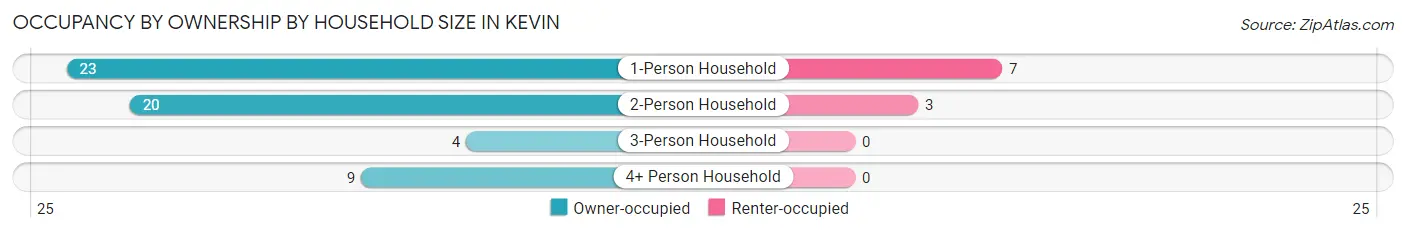
| Household Size | Owner-occupied | Renter-occupied |
| 1-Person Household | 23 (76.7%) | 7 (23.3%) |
| 2-Person Household | 20 (87.0%) | 3 (13.0%) |
| 3-Person Household | 4 (100.0%) | 0 (0.0%) |
| 4+ Person Household | 9 (100.0%) | 0 (0.0%) |
| Total Housing Units | 56 (84.9%) | 10 (15.1%) |
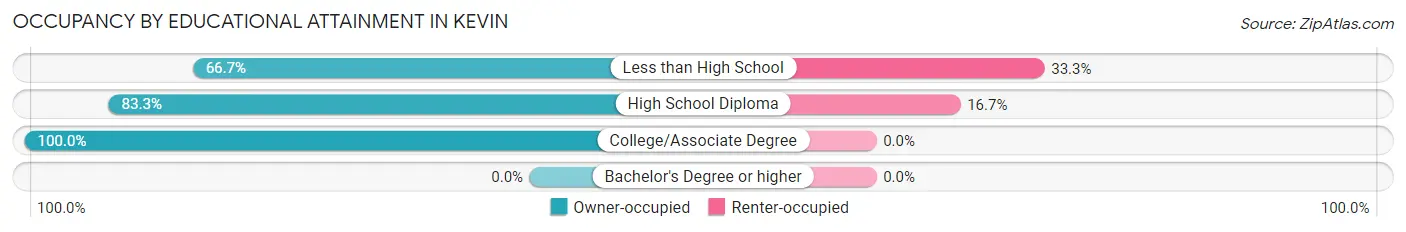
Occupancy by Educational Attainment in Kevin
| Household Size | Owner-occupied | Renter-occupied |
| Less than High School | 6 (66.7%) | 3 (33.3%) |
| High School Diploma | 35 (83.3%) | 7 (16.7%) |
| College/Associate Degree | 15 (100.0%) | 0 (0.0%) |
| Bachelor's Degree or higher | 0 (0.0%) | 0 (0.0%) |
Occupancy by Age of Householder in Kevin
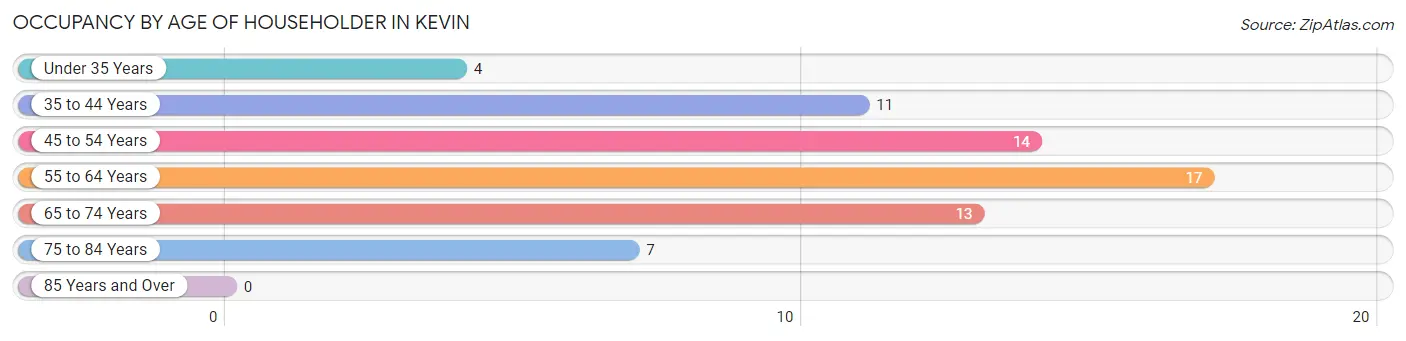
| Age Bracket | # Households | % Households |
| Under 35 Years | 4 | 6.1% |
| 35 to 44 Years | 11 | 16.7% |
| 45 to 54 Years | 14 | 21.2% |
| 55 to 64 Years | 17 | 25.8% |
| 65 to 74 Years | 13 | 19.7% |
| 75 to 84 Years | 7 | 10.6% |
| 85 Years and Over | 0 | 0.0% |
| Total | 66 | 100.0% |
Housing Finances in Kevin
Median Income by Occupancy in Kevin
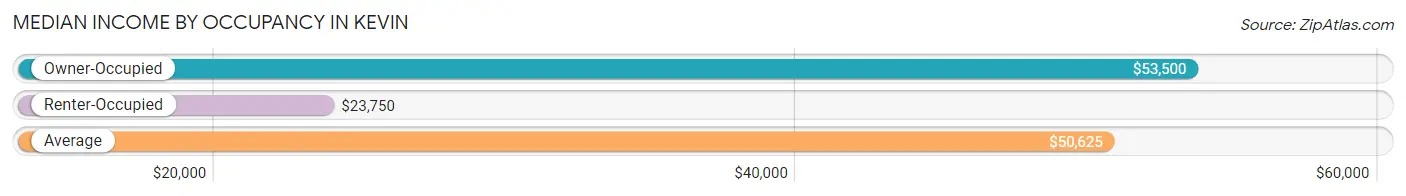
| Occupancy Type | # Households | Median Income |
| Owner-Occupied | 56 (84.9%) | $53,500 |
| Renter-Occupied | 10 (15.1%) | $23,750 |
| Average | 66 (100.0%) | $50,625 |
Occupancy by Householder Income Bracket in Kevin
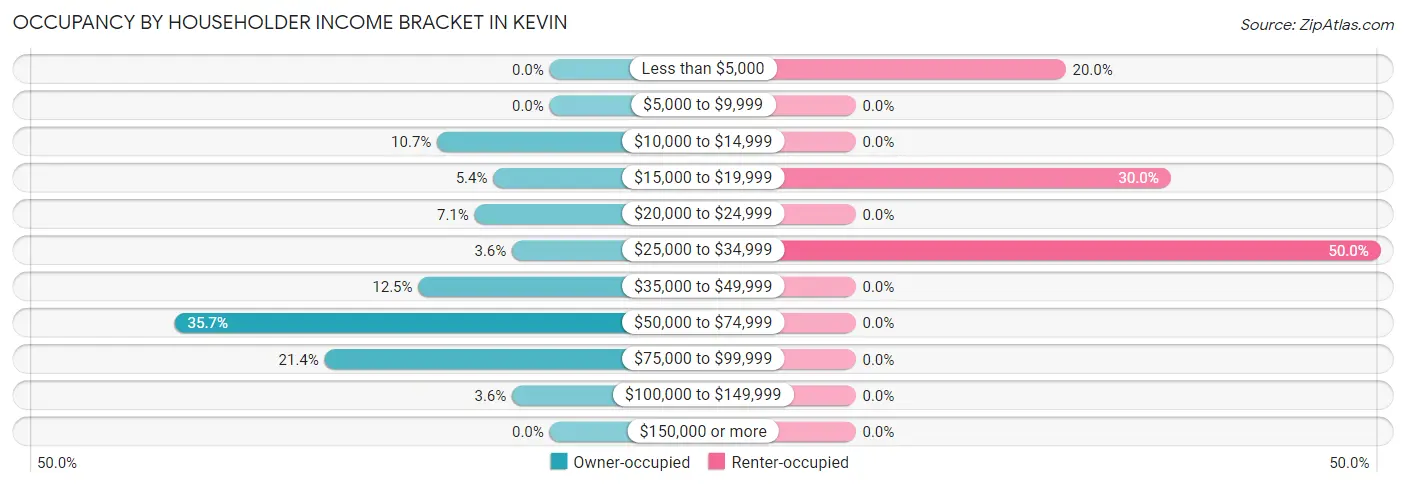
| Income Bracket | Owner-occupied | Renter-occupied |
| Less than $5,000 | 0 (0.0%) | 2 (20.0%) |
| $5,000 to $9,999 | 0 (0.0%) | 0 (0.0%) |
| $10,000 to $14,999 | 6 (10.7%) | 0 (0.0%) |
| $15,000 to $19,999 | 3 (5.4%) | 3 (30.0%) |
| $20,000 to $24,999 | 4 (7.1%) | 0 (0.0%) |
| $25,000 to $34,999 | 2 (3.6%) | 5 (50.0%) |
| $35,000 to $49,999 | 7 (12.5%) | 0 (0.0%) |
| $50,000 to $74,999 | 20 (35.7%) | 0 (0.0%) |
| $75,000 to $99,999 | 12 (21.4%) | 0 (0.0%) |
| $100,000 to $149,999 | 2 (3.6%) | 0 (0.0%) |
| $150,000 or more | 0 (0.0%) | 0 (0.0%) |
| Total | 56 (100.0%) | 10 (100.0%) |
Monthly Housing Cost Tiers in Kevin
| Monthly Cost | Owner-occupied | Renter-occupied |
| Less than $300 | 10 (17.9%) | 0 (0.0%) |
| $300 to $499 | 26 (46.4%) | 0 (0.0%) |
| $500 to $799 | 11 (19.6%) | 5 (50.0%) |
| $800 to $999 | 1 (1.8%) | 0 (0.0%) |
| $1,000 to $1,499 | 8 (14.3%) | 0 (0.0%) |
| $1,500 to $1,999 | 0 (0.0%) | 0 (0.0%) |
| $2,000 to $2,499 | 0 (0.0%) | 0 (0.0%) |
| $2,500 to $2,999 | 0 (0.0%) | 0 (0.0%) |
| $3,000 or more | 0 (0.0%) | 0 (0.0%) |
| Total | 56 (100.0%) | 10 (100.0%) |
Physical Housing Characteristics in Kevin
Housing Structures in Kevin
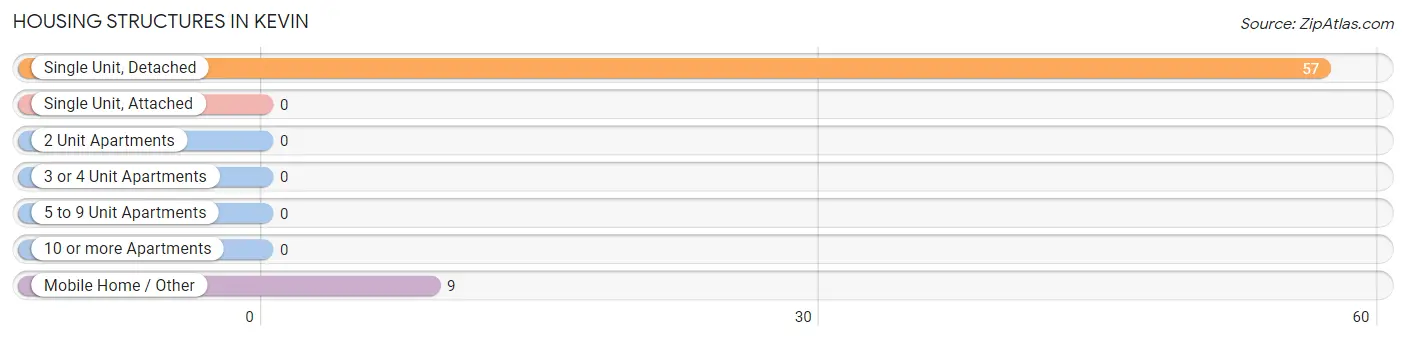
| Structure Type | # Housing Units | % Housing Units |
| Single Unit, Detached | 57 | 86.4% |
| Single Unit, Attached | 0 | 0.0% |
| 2 Unit Apartments | 0 | 0.0% |
| 3 or 4 Unit Apartments | 0 | 0.0% |
| 5 to 9 Unit Apartments | 0 | 0.0% |
| 10 or more Apartments | 0 | 0.0% |
| Mobile Home / Other | 9 | 13.6% |
| Total | 66 | 100.0% |
Housing Structures by Occupancy in Kevin
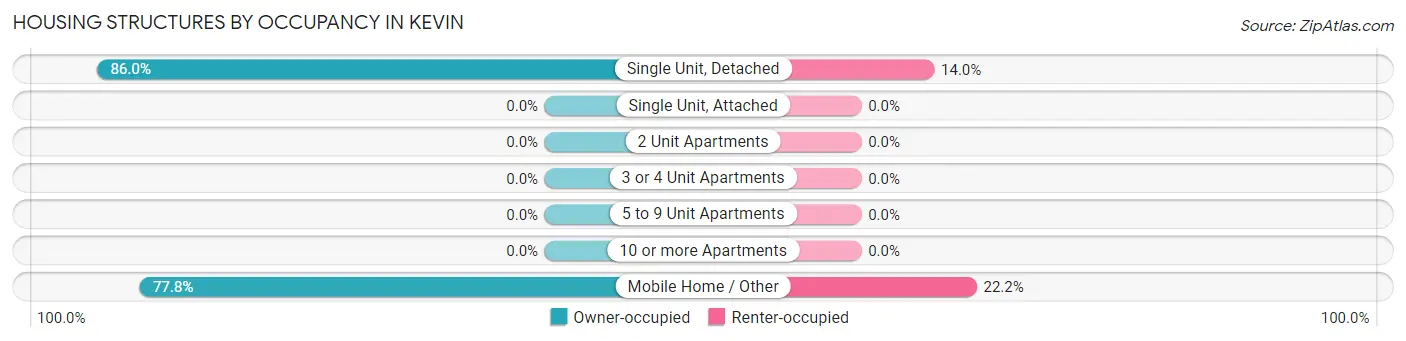
| Structure Type | Owner-occupied | Renter-occupied |
| Single Unit, Detached | 49 (86.0%) | 8 (14.0%) |
| Single Unit, Attached | 0 (0.0%) | 0 (0.0%) |
| 2 Unit Apartments | 0 (0.0%) | 0 (0.0%) |
| 3 or 4 Unit Apartments | 0 (0.0%) | 0 (0.0%) |
| 5 to 9 Unit Apartments | 0 (0.0%) | 0 (0.0%) |
| 10 or more Apartments | 0 (0.0%) | 0 (0.0%) |
| Mobile Home / Other | 7 (77.8%) | 2 (22.2%) |
| Total | 56 (84.9%) | 10 (15.1%) |
Housing Structures by Number of Rooms in Kevin
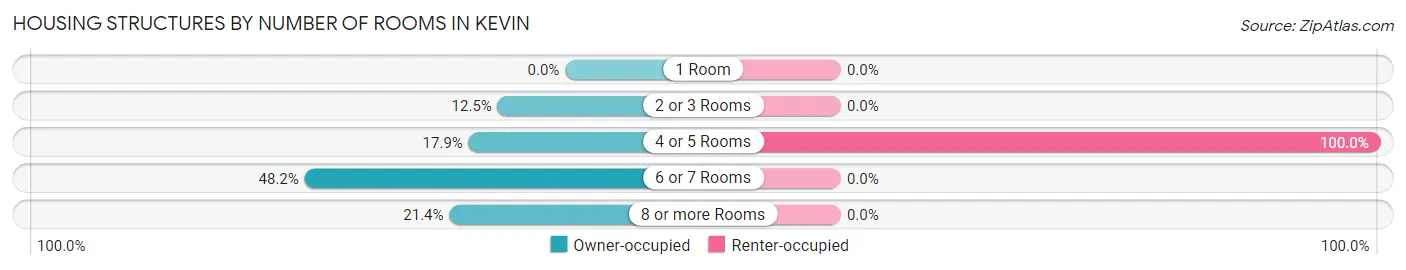
| Number of Rooms | Owner-occupied | Renter-occupied |
| 1 Room | 0 (0.0%) | 0 (0.0%) |
| 2 or 3 Rooms | 7 (12.5%) | 0 (0.0%) |
| 4 or 5 Rooms | 10 (17.9%) | 10 (100.0%) |
| 6 or 7 Rooms | 27 (48.2%) | 0 (0.0%) |
| 8 or more Rooms | 12 (21.4%) | 0 (0.0%) |
| Total | 56 (100.0%) | 10 (100.0%) |
Housing Structure by Heating Type in Kevin
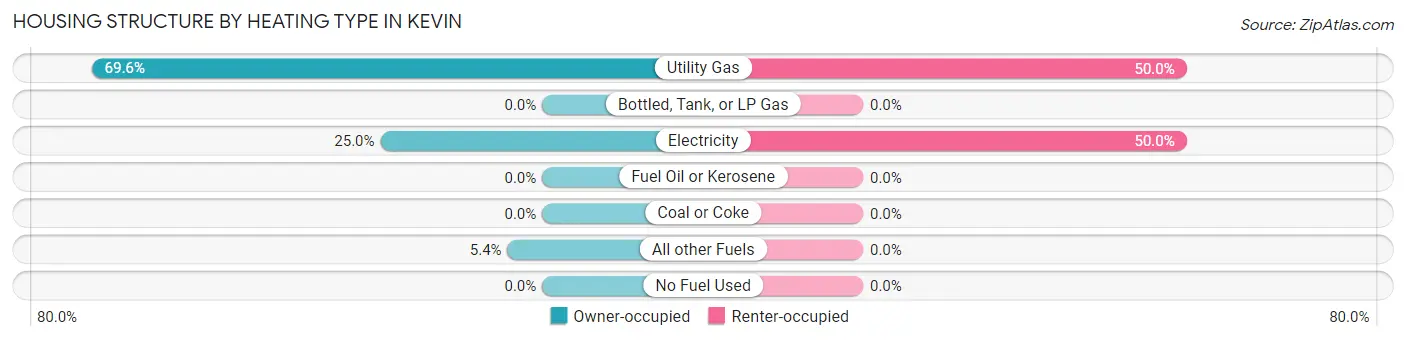
| Heating Type | Owner-occupied | Renter-occupied |
| Utility Gas | 39 (69.6%) | 5 (50.0%) |
| Bottled, Tank, or LP Gas | 0 (0.0%) | 0 (0.0%) |
| Electricity | 14 (25.0%) | 5 (50.0%) |
| Fuel Oil or Kerosene | 0 (0.0%) | 0 (0.0%) |
| Coal or Coke | 0 (0.0%) | 0 (0.0%) |
| All other Fuels | 3 (5.4%) | 0 (0.0%) |
| No Fuel Used | 0 (0.0%) | 0 (0.0%) |
| Total | 56 (100.0%) | 10 (100.0%) |
Household Vehicle Usage in Kevin
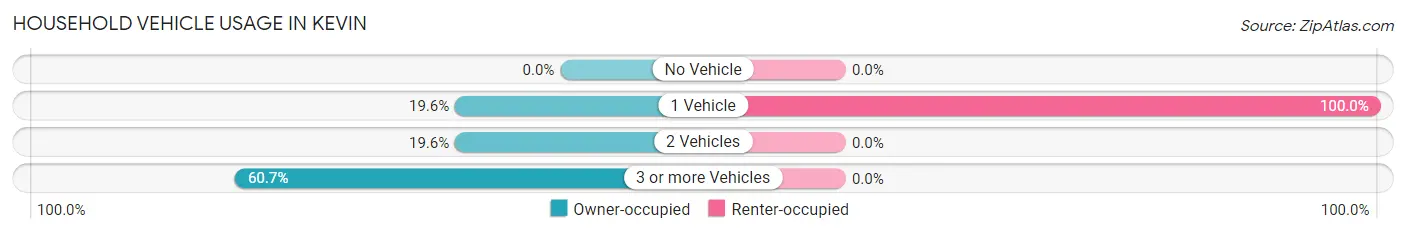
| Vehicles per Household | Owner-occupied | Renter-occupied |
| No Vehicle | 0 (0.0%) | 0 (0.0%) |
| 1 Vehicle | 11 (19.6%) | 10 (100.0%) |
| 2 Vehicles | 11 (19.6%) | 0 (0.0%) |
| 3 or more Vehicles | 34 (60.7%) | 0 (0.0%) |
| Total | 56 (100.0%) | 10 (100.0%) |
Real Estate & Mortgages in Kevin
Real Estate and Mortgage Overview in Kevin
| Characteristic | Without Mortgage | With Mortgage |
| Housing Units | 40 | 16 |
| Median Property Value | - | - |
| Median Household Income | $53,000 | $0 |
| Monthly Housing Costs | $333 | $0 |
| Real Estate Taxes | $533 | $0 |
Property Value by Mortgage Status in Kevin
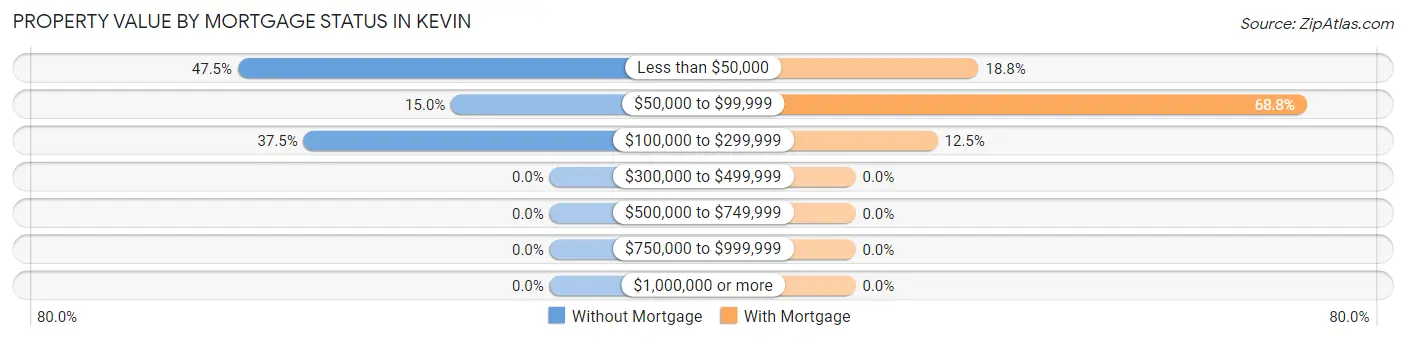
| Property Value | Without Mortgage | With Mortgage |
| Less than $50,000 | 19 (47.5%) | 3 (18.8%) |
| $50,000 to $99,999 | 6 (15.0%) | 11 (68.8%) |
| $100,000 to $299,999 | 15 (37.5%) | 2 (12.5%) |
| $300,000 to $499,999 | 0 (0.0%) | 0 (0.0%) |
| $500,000 to $749,999 | 0 (0.0%) | 0 (0.0%) |
| $750,000 to $999,999 | 0 (0.0%) | 0 (0.0%) |
| $1,000,000 or more | 0 (0.0%) | 0 (0.0%) |
| Total | 40 (100.0%) | 16 (100.0%) |
Household Income by Mortgage Status in Kevin
| Household Income | Without Mortgage | With Mortgage |
| Less than $10,000 | 0 (0.0%) | 0 (0.0%) |
| $10,000 to $24,999 | 13 (32.5%) | 0 (0.0%) |
| $25,000 to $34,999 | 2 (5.0%) | 0 (0.0%) |
| $35,000 to $49,999 | 0 (0.0%) | 0 (0.0%) |
| $50,000 to $74,999 | 15 (37.5%) | 7 (43.8%) |
| $75,000 to $99,999 | 10 (25.0%) | 5 (31.2%) |
| $100,000 to $149,999 | 0 (0.0%) | 2 (12.5%) |
| $150,000 or more | 0 (0.0%) | 2 (12.5%) |
| Total | 40 (100.0%) | 16 (100.0%) |
Property Value to Household Income Ratio in Kevin
| Value-to-Income Ratio | Without Mortgage | With Mortgage |
| Less than 2.0x | 24 (60.0%) | 60,500 (378,125.0%) |
| 2.0x to 2.9x | 10 (25.0%) | 9 (56.2%) |
| 3.0x to 3.9x | 2 (5.0%) | 7 (43.8%) |
| 4.0x or more | 4 (10.0%) | 0 (0.0%) |
| Total | 40 (100.0%) | 16 (100.0%) |
Real Estate Taxes by Mortgage Status in Kevin
| Property Taxes | Without Mortgage | With Mortgage |
| Less than $800 | 27 (67.5%) | 0 (0.0%) |
| $800 to $1,499 | 9 (22.5%) | 9 (56.2%) |
| $800 to $1,499 | 4 (10.0%) | 7 (43.8%) |
| Total | 40 (100.0%) | 16 (100.0%) |
Health & Disability in Kevin
Health Insurance Coverage by Age in Kevin
| Age Bracket | With Coverage | Without Coverage |
| Under 6 Years | 2 (100.0%) | 0 (0.0%) |
| 6 to 18 Years | 12 (100.0%) | 0 (0.0%) |
| 19 to 25 Years | 8 (88.9%) | 1 (11.1%) |
| 26 to 34 Years | 8 (72.7%) | 3 (27.3%) |
| 35 to 44 Years | 6 (31.6%) | 13 (68.4%) |
| 45 to 54 Years | 16 (84.2%) | 3 (15.8%) |
| 55 to 64 Years | 22 (88.0%) | 3 (12.0%) |
| 65 to 74 Years | 20 (100.0%) | 0 (0.0%) |
| 75 Years and older | 7 (100.0%) | 0 (0.0%) |
| Total | 101 (81.5%) | 23 (18.5%) |
Health Insurance Coverage by Citizenship Status in Kevin
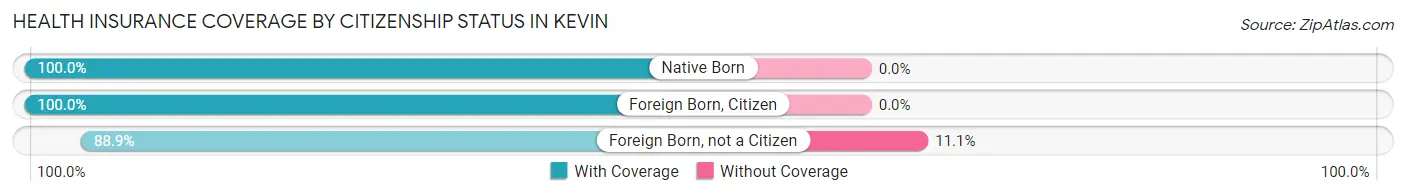
| Citizenship Status | With Coverage | Without Coverage |
| Native Born | 2 (100.0%) | 0 (0.0%) |
| Foreign Born, Citizen | 12 (100.0%) | 0 (0.0%) |
| Foreign Born, not a Citizen | 8 (88.9%) | 1 (11.1%) |
Health Insurance Coverage by Household Income in Kevin
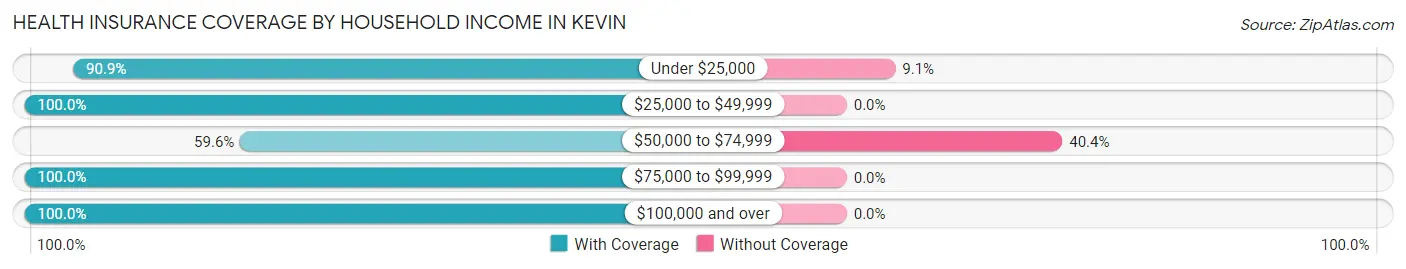
| Household Income | With Coverage | Without Coverage |
| Under $25,000 | 20 (90.9%) | 2 (9.1%) |
| $25,000 to $49,999 | 20 (100.0%) | 0 (0.0%) |
| $50,000 to $74,999 | 31 (59.6%) | 21 (40.4%) |
| $75,000 to $99,999 | 26 (100.0%) | 0 (0.0%) |
| $100,000 and over | 4 (100.0%) | 0 (0.0%) |
Public vs Private Health Insurance Coverage by Age in Kevin
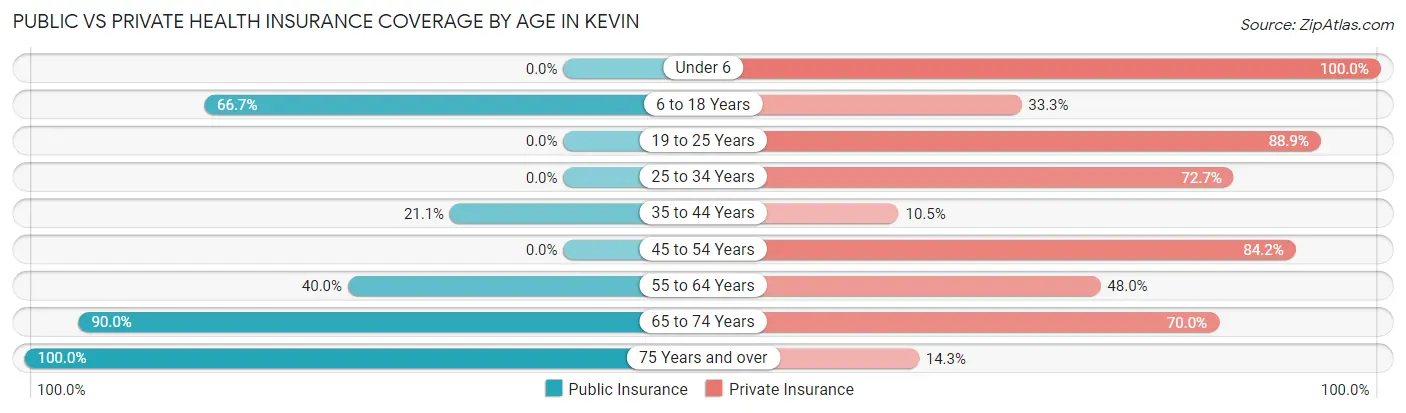
| Age Bracket | Public Insurance | Private Insurance |
| Under 6 | 0 (0.0%) | 2 (100.0%) |
| 6 to 18 Years | 8 (66.7%) | 4 (33.3%) |
| 19 to 25 Years | 0 (0.0%) | 8 (88.9%) |
| 25 to 34 Years | 0 (0.0%) | 8 (72.7%) |
| 35 to 44 Years | 4 (21.0%) | 2 (10.5%) |
| 45 to 54 Years | 0 (0.0%) | 16 (84.2%) |
| 55 to 64 Years | 10 (40.0%) | 12 (48.0%) |
| 65 to 74 Years | 18 (90.0%) | 14 (70.0%) |
| 75 Years and over | 7 (100.0%) | 1 (14.3%) |
| Total | 47 (37.9%) | 67 (54.0%) |
Disability Status by Sex by Age in Kevin
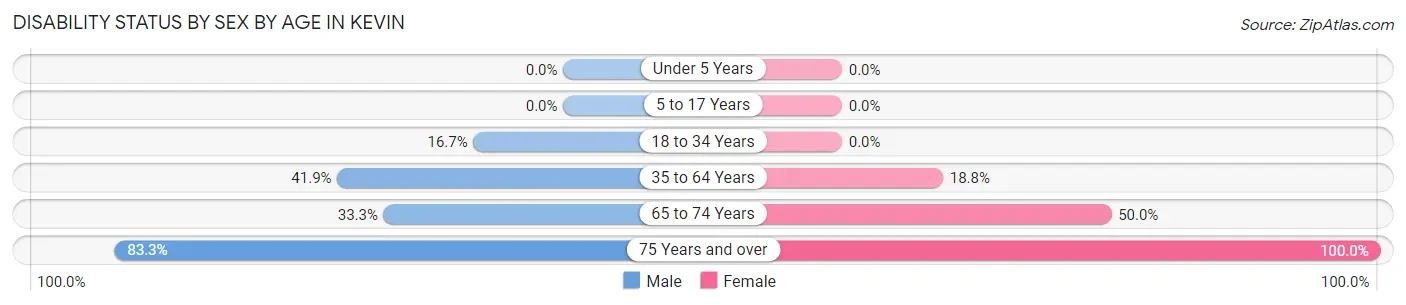
| Age Bracket | Male | Female |
| Under 5 Years | 0 (0.0%) | 0 (0.0%) |
| 5 to 17 Years | 0 (0.0%) | 0 (0.0%) |
| 18 to 34 Years | 2 (16.7%) | 0 (0.0%) |
| 35 to 64 Years | 13 (41.9%) | 6 (18.8%) |
| 65 to 74 Years | 4 (33.3%) | 4 (50.0%) |
| 75 Years and over | 5 (83.3%) | 1 (100.0%) |
Disability Class by Sex by Age in Kevin
Disability Class: Hearing Difficulty
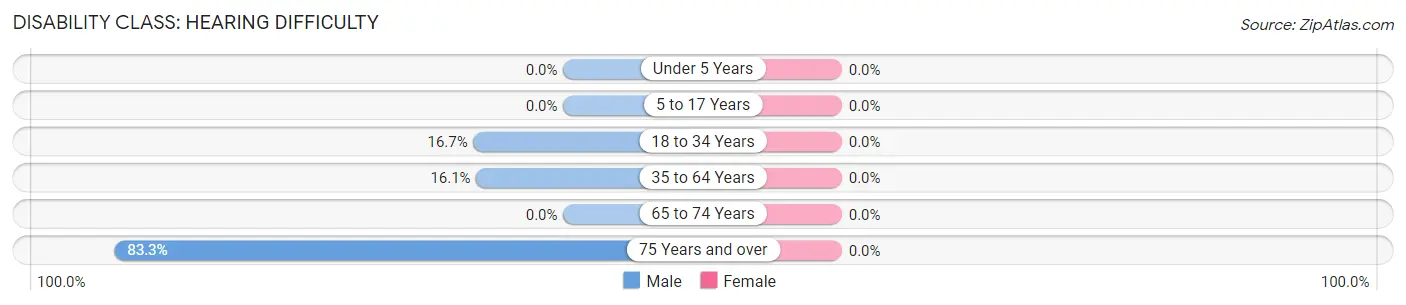
| Age Bracket | Male | Female |
| Under 5 Years | 0 (0.0%) | 0 (0.0%) |
| 5 to 17 Years | 0 (0.0%) | 0 (0.0%) |
| 18 to 34 Years | 2 (16.7%) | 0 (0.0%) |
| 35 to 64 Years | 5 (16.1%) | 0 (0.0%) |
| 65 to 74 Years | 0 (0.0%) | 0 (0.0%) |
| 75 Years and over | 5 (83.3%) | 0 (0.0%) |
Disability Class: Vision Difficulty
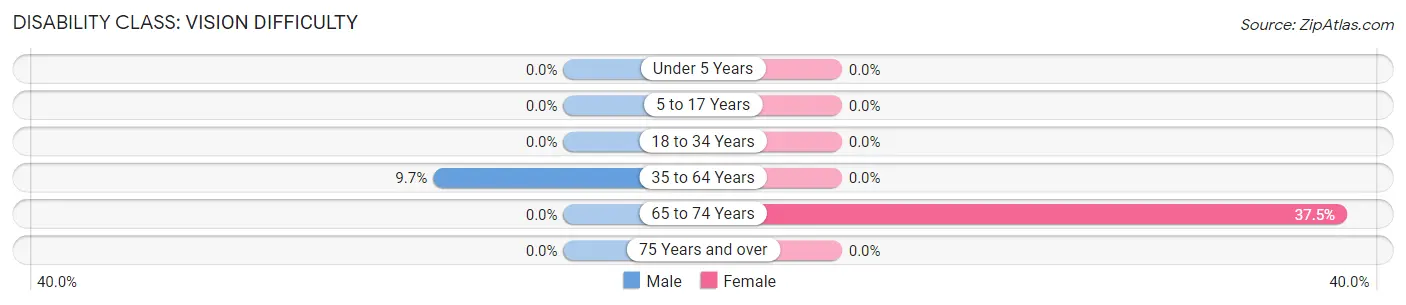
| Age Bracket | Male | Female |
| Under 5 Years | 0 (0.0%) | 0 (0.0%) |
| 5 to 17 Years | 0 (0.0%) | 0 (0.0%) |
| 18 to 34 Years | 0 (0.0%) | 0 (0.0%) |
| 35 to 64 Years | 3 (9.7%) | 0 (0.0%) |
| 65 to 74 Years | 0 (0.0%) | 3 (37.5%) |
| 75 Years and over | 0 (0.0%) | 0 (0.0%) |
Disability Class: Cognitive Difficulty
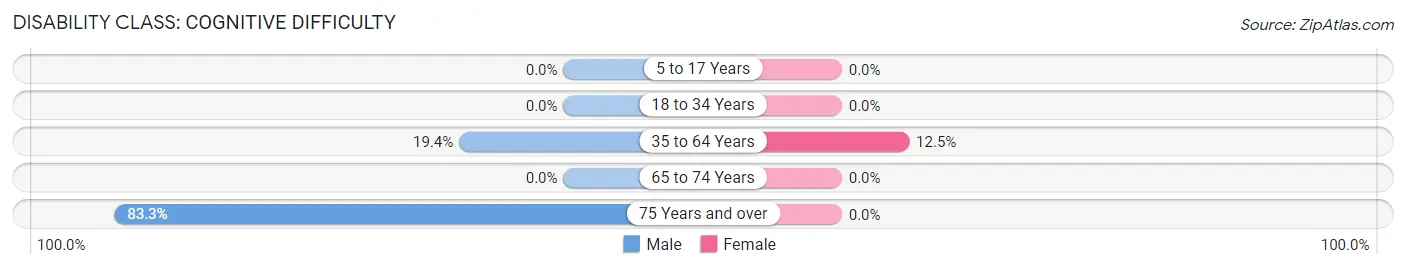
| Age Bracket | Male | Female |
| 5 to 17 Years | 0 (0.0%) | 0 (0.0%) |
| 18 to 34 Years | 0 (0.0%) | 0 (0.0%) |
| 35 to 64 Years | 6 (19.4%) | 4 (12.5%) |
| 65 to 74 Years | 0 (0.0%) | 0 (0.0%) |
| 75 Years and over | 5 (83.3%) | 0 (0.0%) |
Disability Class: Ambulatory Difficulty
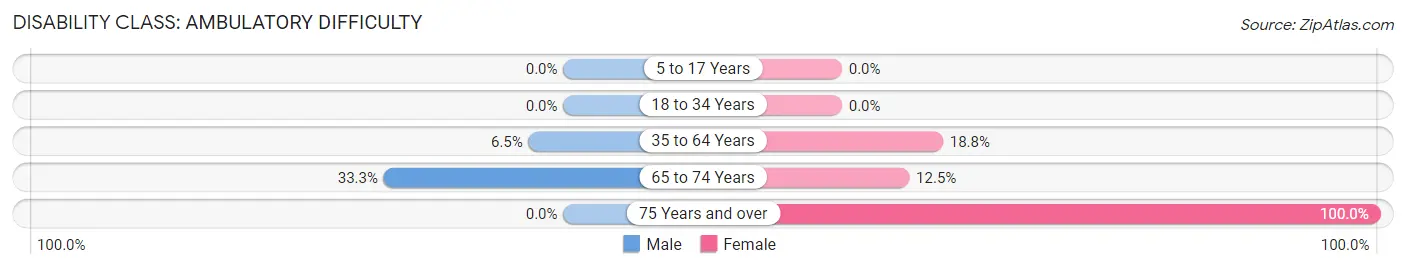
| Age Bracket | Male | Female |
| 5 to 17 Years | 0 (0.0%) | 0 (0.0%) |
| 18 to 34 Years | 0 (0.0%) | 0 (0.0%) |
| 35 to 64 Years | 2 (6.5%) | 6 (18.8%) |
| 65 to 74 Years | 4 (33.3%) | 1 (12.5%) |
| 75 Years and over | 0 (0.0%) | 1 (100.0%) |
Disability Class: Self-Care Difficulty
| Age Bracket | Male | Female |
| 5 to 17 Years | 0 (0.0%) | 0 (0.0%) |
| 18 to 34 Years | 0 (0.0%) | 0 (0.0%) |
| 35 to 64 Years | 0 (0.0%) | 0 (0.0%) |
| 65 to 74 Years | 0 (0.0%) | 0 (0.0%) |
| 75 Years and over | 0 (0.0%) | 0 (0.0%) |
Technology Access in Kevin
Computing Device Access in Kevin
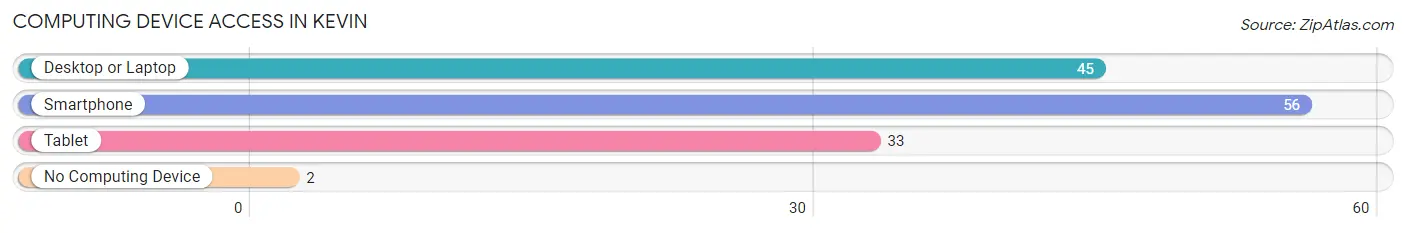
| Device Type | # Households | % Households |
| Desktop or Laptop | 45 | 68.2% |
| Smartphone | 56 | 84.9% |
| Tablet | 33 | 50.0% |
| No Computing Device | 2 | 3.0% |
| Total | 66 | 100.0% |
Internet Access in Kevin
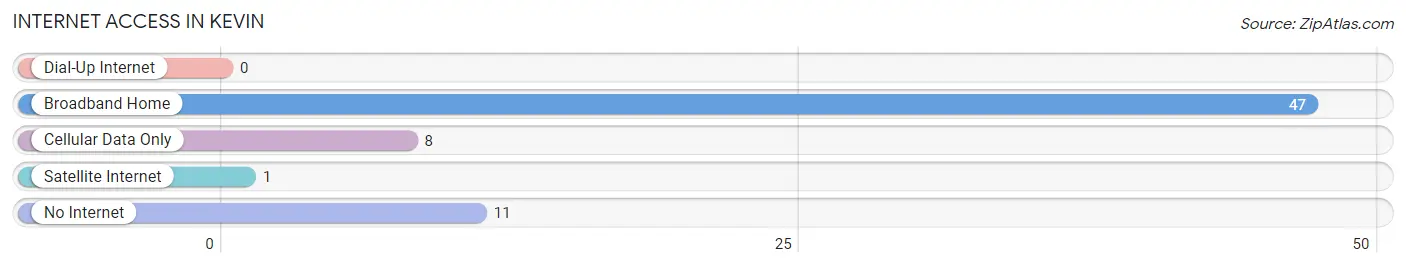
| Internet Type | # Households | % Households |
| Dial-Up Internet | 0 | 0.0% |
| Broadband Home | 47 | 71.2% |
| Cellular Data Only | 8 | 12.1% |
| Satellite Internet | 1 | 1.5% |
| No Internet | 11 | 16.7% |
| Total | 66 | 100.0% |
Kevin Summary
History
The history of Montana is a long and varied one, stretching back to the days of the Native American tribes who first inhabited the area. The first known inhabitants of the area were the Salish, Kootenai, and Pend d’Oreille tribes, who lived in the area for thousands of years before the arrival of Europeans. The first Europeans to explore the area were the Lewis and Clark Expedition, who arrived in 1805. They were followed by fur traders, miners, and settlers, who began to move into the area in the early 19th century.
The area that is now Montana was part of the Louisiana Purchase in 1803, and was then part of the Oregon Territory until 1864, when it became part of the Idaho Territory. In 1864, the Montana Territory was created, and in 1889, it became the 41st state in the Union.
Montana has a long and varied history of mining, ranching, and farming. The discovery of gold in the 1860s brought a rush of miners to the area, and the mining industry has been an important part of the state’s economy ever since. Cattle ranching was also an important part of the state’s economy, and the state is still home to many large ranches. Farming has also been an important part of the state’s economy, and the state is still home to many small family farms.
Montana has also been an important part of the nation’s history. It was the site of the Battle of Little Bighorn in 1876, and the state was also home to the famous outlaws Butch Cassidy and the Sundance Kid. Montana was also the site of the first national park, Yellowstone National Park, which was established in 1872.
Geography
Montana is located in the northern Rocky Mountains region of the United States. It is bordered by Idaho to the west, Wyoming to the south, North Dakota and South Dakota to the east, and the Canadian provinces of Alberta and British Columbia to the north. Montana is the fourth largest state in the United States, with an area of 147,042 square miles.
Montana is a land of mountains, plains, and valleys. The Rocky Mountains run through the western part of the state, and the Great Plains stretch across the eastern part. The highest point in the state is Granite Peak, which is located in the Beartooth Mountains and rises to a height of 12,807 feet. The lowest point in the state is Kootenai River, which is located in the northwest corner of the state and is only 1,804 feet above sea level.
The climate of Montana is generally dry and continental, with cold winters and hot summers. The average annual temperature in the state is 44 degrees Fahrenheit, and the average annual precipitation is 16 inches.
Economy
The economy of Montana is largely based on agriculture, mining, and tourism. Agriculture is the largest sector of the state’s economy, and the state is home to many large ranches and farms. The state is also home to many small family farms, which produce a variety of crops, including wheat, barley, oats, hay, and potatoes.
Mining is also an important part of the state’s economy, and the state is home to many large mining operations. The state is also home to many small mining operations, which produce a variety of minerals, including gold, silver, copper, and coal.
Tourism is also an important part of the state’s economy, and the state is home to many popular tourist attractions, including Yellowstone National Park, Glacier National Park, and the Little Bighorn Battlefield National Monument.
Demographics
As of the 2010 census, the population of Montana was 989,415. The population is spread out across the state, with the largest cities being Billings, Missoula, Great Falls, and Bozeman.
The racial makeup of the state is 87.3% White, 0.7% African American, 6.3% Native American, 0.7% Asian, 0.1% Pacific Islander, 2.7% from other races, and 2.1% from two or more races. The median household income in the state is $45,936, and the median age is 38.7 years.
Common Questions
What is Per Capita Income in Kevin?
Per Capita income in Kevin is $25,410.
What is the Median Family Income in Kevin?
Median Family Income in Kevin is $54,000.
What is the Median Household income in Kevin?
Median Household Income in Kevin is $50,625.
What is Income or Wage Gap in Kevin?
Income or Wage Gap in Kevin is 23.9%.
Women in Kevin earn 76.1 cents for every dollar earned by a man.
What is Inequality or Gini Index in Kevin?
Inequality or Gini Index in Kevin is 0.33.
What is the Total Population of Kevin?
Total Population of Kevin is 124.
What is the Total Male Population of Kevin?
Total Male Population of Kevin is 70.
What is the Total Female Population of Kevin?
Total Female Population of Kevin is 54.
What is the Ratio of Males per 100 Females in Kevin?
There are 129.63 Males per 100 Females in Kevin.
What is the Ratio of Females per 100 Males in Kevin?
There are 77.14 Females per 100 Males in Kevin.
What is the Median Population Age in Kevin?
Median Population Age in Kevin is 50.5 Years.
What is the Average Family Size in Kevin
Average Family Size in Kevin is 2.6 People.
What is the Average Household Size in Kevin
Average Household Size in Kevin is 1.9 People.
How Large is the Labor Force in Kevin?
There are 64 People in the Labor Forcein in Kevin.
What is the Percentage of People in the Labor Force in Kevin?
57.7% of People are in the Labor Force in Kevin.