Grass Range, MT Map & Demographics
Grass Range Map
Grass Range Overview
$23,904
PER CAPITA INCOME
$75,208
AVG FAMILY INCOME
5.2%
WAGE / INCOME GAP [ % ]
94.8¢/ $1
WAGE / INCOME GAP [ $ ]
0.58
INEQUALITY / GINI INDEX
111
TOTAL POPULATION
46
MALE POPULATION
65
FEMALE POPULATION
70.77
MALES / 100 FEMALES
141.30
FEMALES / 100 MALES
68.4
MEDIAN AGE
2.4
AVG FAMILY SIZE
1.5
AVG HOUSEHOLD SIZE
46
LABOR FORCE [ PEOPLE ]
46.0%
PERCENT IN LABOR FORCE
Grass Range Zip Codes
Grass Range Area Codes
Income in Grass Range
Income Overview in Grass Range
| Characteristic | Number | Measure |
| Per Capita Income | 111 | $23,904 |
| Median Family Income | 25 | $75,208 |
| Mean Family Income | 25 | $78,616 |
| Median Household Income | 74 | $0 |
| Mean Household Income | 74 | $38,578 |
| Income Deficit | 25 | $0 |
| Wage / Income Gap (%) | 111 | 5.17% |
| Wage / Income Gap ($) | 111 | 94.83¢ per $1 |
| Gini / Inequality Index | 111 | 0.58 |
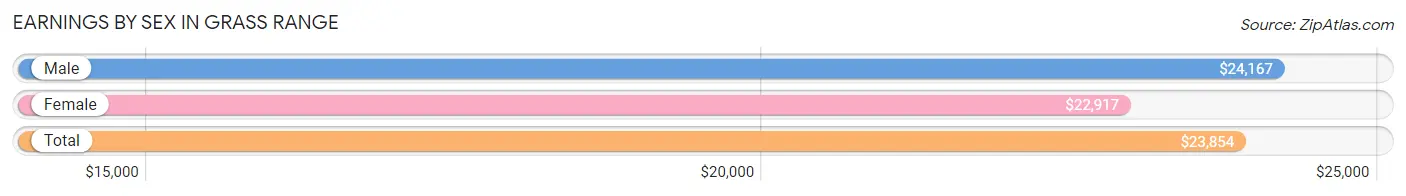
Earnings by Sex in Grass Range
Average Earnings in Grass Range are $23,854, $24,167 for men and $22,917 for women, a difference of 5.2%.
| Sex | Number | Average Earnings |
| Male | 22 (46.8%) | $24,167 |
| Female | 25 (53.2%) | $22,917 |
| Total | 47 (100.0%) | $23,854 |
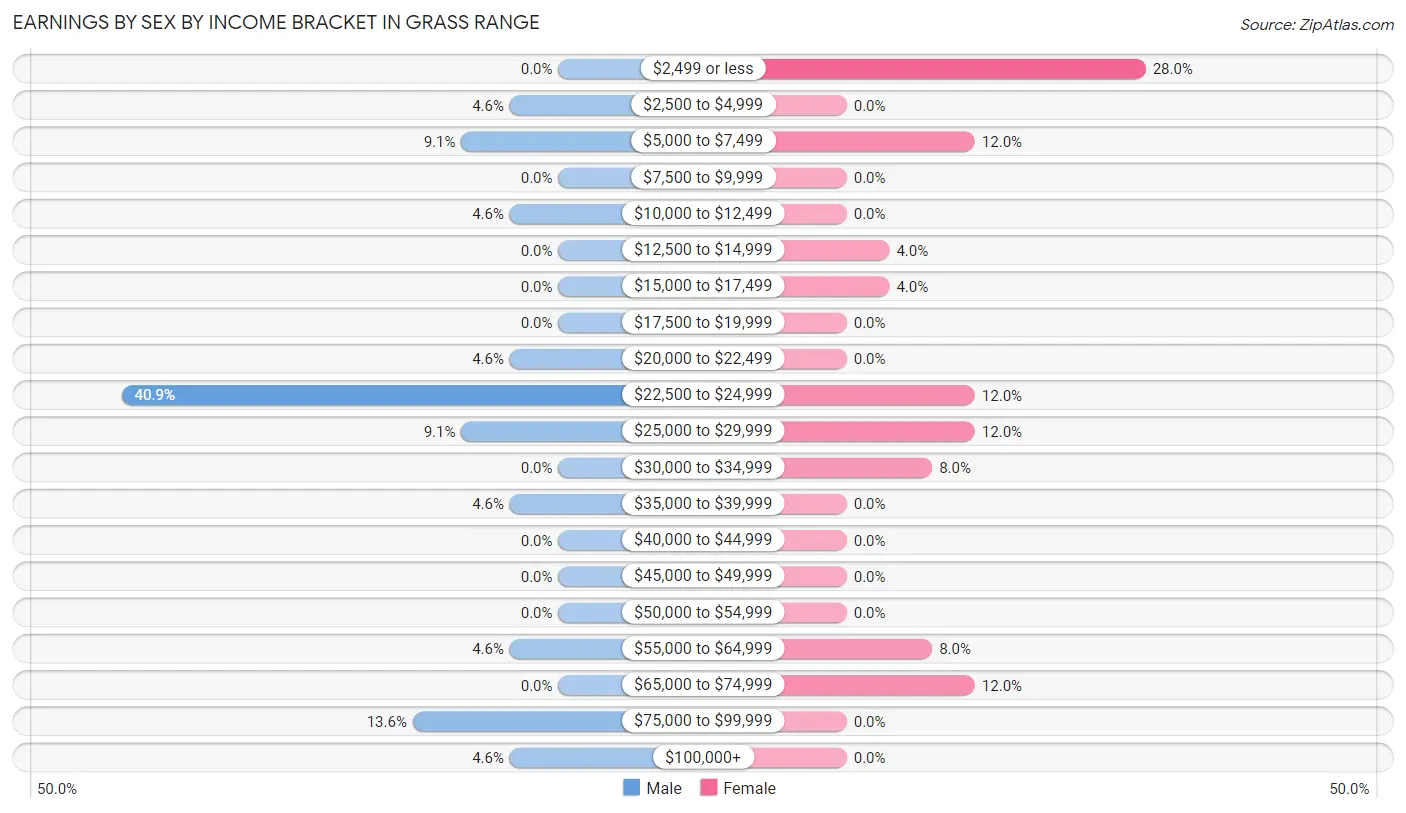
Earnings by Sex by Income Bracket in Grass Range
The most common earnings brackets in Grass Range are $22,500 to $24,999 for men (9 | 40.9%) and $2,499 or less for women (7 | 28.0%).
| Income | Male | Female |
| $2,499 or less | 0 (0.0%) | 7 (28.0%) |
| $2,500 to $4,999 | 1 (4.5%) | 0 (0.0%) |
| $5,000 to $7,499 | 2 (9.1%) | 3 (12.0%) |
| $7,500 to $9,999 | 0 (0.0%) | 0 (0.0%) |
| $10,000 to $12,499 | 1 (4.5%) | 0 (0.0%) |
| $12,500 to $14,999 | 0 (0.0%) | 1 (4.0%) |
| $15,000 to $17,499 | 0 (0.0%) | 1 (4.0%) |
| $17,500 to $19,999 | 0 (0.0%) | 0 (0.0%) |
| $20,000 to $22,499 | 1 (4.5%) | 0 (0.0%) |
| $22,500 to $24,999 | 9 (40.9%) | 3 (12.0%) |
| $25,000 to $29,999 | 2 (9.1%) | 3 (12.0%) |
| $30,000 to $34,999 | 0 (0.0%) | 2 (8.0%) |
| $35,000 to $39,999 | 1 (4.5%) | 0 (0.0%) |
| $40,000 to $44,999 | 0 (0.0%) | 0 (0.0%) |
| $45,000 to $49,999 | 0 (0.0%) | 0 (0.0%) |
| $50,000 to $54,999 | 0 (0.0%) | 0 (0.0%) |
| $55,000 to $64,999 | 1 (4.5%) | 2 (8.0%) |
| $65,000 to $74,999 | 0 (0.0%) | 3 (12.0%) |
| $75,000 to $99,999 | 3 (13.6%) | 0 (0.0%) |
| $100,000+ | 1 (4.5%) | 0 (0.0%) |
| Total | 22 (100.0%) | 25 (100.0%) |
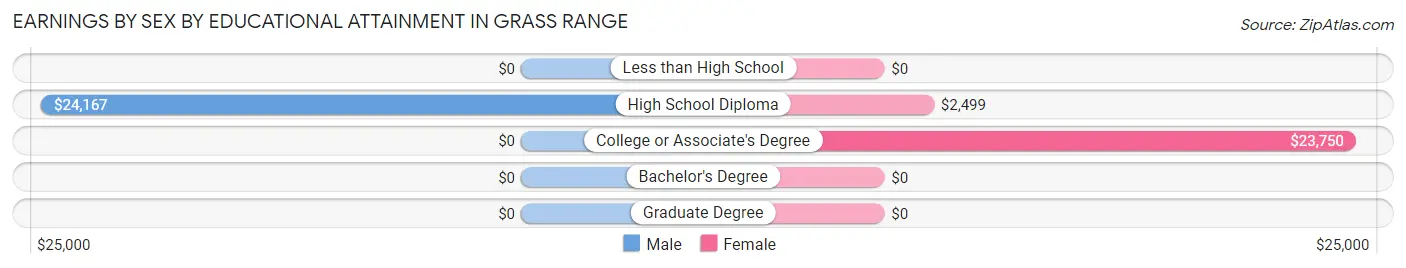
Earnings by Sex by Educational Attainment in Grass Range
Average earnings in Grass Range are $24,167 for men and $22,917 for women, a difference of 5.2%. Men with an educational attainment of high school diploma enjoy the highest average annual earnings of $24,167, while those with high school diploma education earn the least with $24,167. Women with an educational attainment of college or associate's degree earn the most with the average annual earnings of $23,750, while those with high school diploma education have the smallest earnings of $2,499.
| Educational Attainment | Male Income | Female Income |
| Less than High School | - | - |
| High School Diploma | $24,167 | $2,499 |
| College or Associate's Degree | - | - |
| Bachelor's Degree | - | - |
| Graduate Degree | - | - |
| Total | $24,167 | $22,917 |
Family Income in Grass Range
Family Income Brackets in Grass Range
According to the Grass Range family income data, there are 8 families falling into the $75,000 to $99,999 income range, which is the most common income bracket and makes up 32.0% of all families.
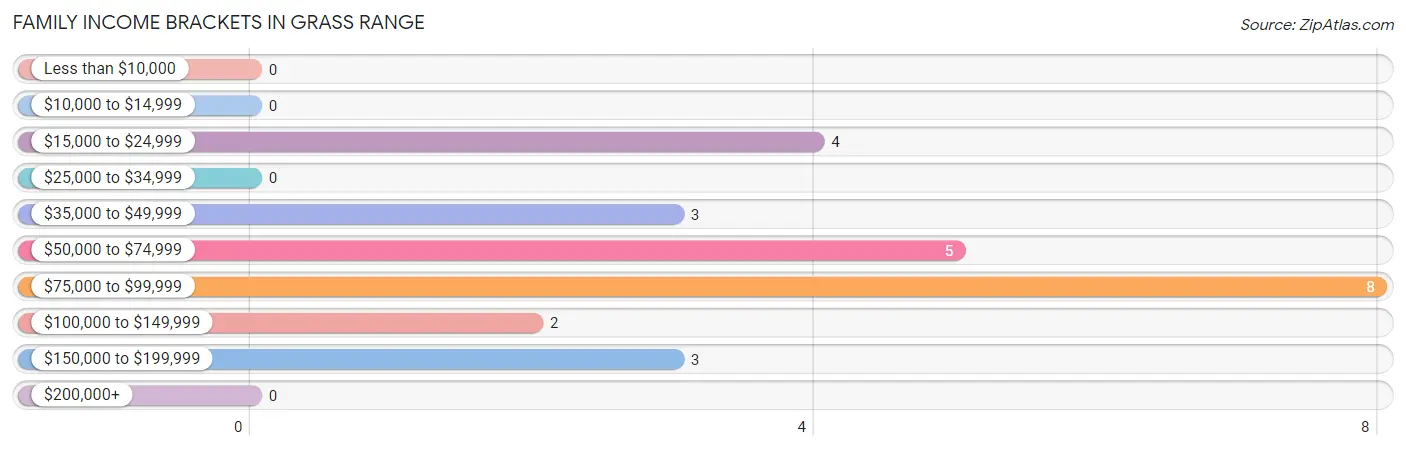
| Income Bracket | # Families | % Families |
| Less than $10,000 | 0 | 0.0% |
| $10,000 to $14,999 | 0 | 0.0% |
| $15,000 to $24,999 | 4 | 16.0% |
| $25,000 to $34,999 | 0 | 0.0% |
| $35,000 to $49,999 | 3 | 12.0% |
| $50,000 to $74,999 | 5 | 20.0% |
| $75,000 to $99,999 | 8 | 32.0% |
| $100,000 to $149,999 | 2 | 8.0% |
| $150,000 to $199,999 | 3 | 12.0% |
| $200,000+ | 0 | 0.0% |
Family Income by Famaliy Size in Grass Range
2-person families (15 | 60.0%) account for the highest median family income in Grass Range with $76,458 per family, while 2-person families (15 | 60.0%) have the highest median income of $38,229 per family member.
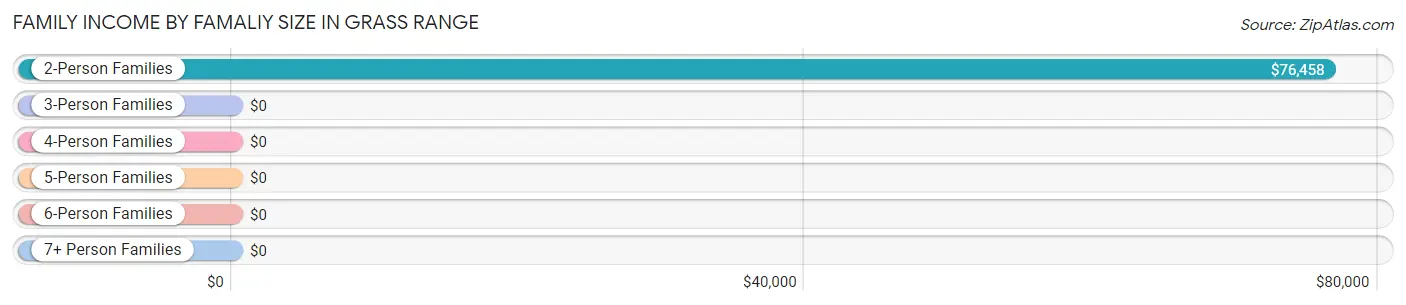
| Income Bracket | # Families | Median Income |
| 2-Person Families | 15 (60.0%) | $76,458 |
| 3-Person Families | 3 (12.0%) | $0 |
| 4-Person Families | 5 (20.0%) | $0 |
| 5-Person Families | 2 (8.0%) | $0 |
| 6-Person Families | 0 (0.0%) | $0 |
| 7+ Person Families | 0 (0.0%) | $0 |
| Total | 25 (100.0%) | $75,208 |
Family Income by Number of Earners in Grass Range
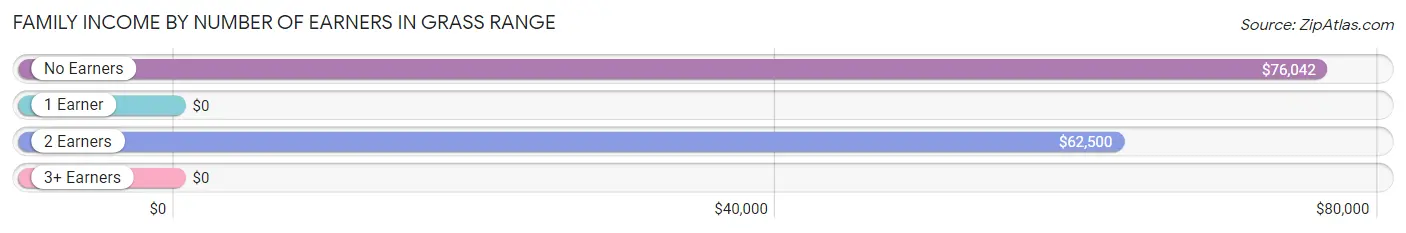
| Number of Earners | # Families | Median Income |
| No Earners | 9 (36.0%) | $76,042 |
| 1 Earner | 0 (0.0%) | $0 |
| 2 Earners | 16 (64.0%) | $62,500 |
| 3+ Earners | 0 (0.0%) | $0 |
| Total | 25 (100.0%) | $75,208 |
Household Income in Grass Range
Household Income Brackets in Grass Range
With 24 households falling in the category, the less than $10,000 income range is the most frequent in Grass Range, accounting for 32.4% of all households.
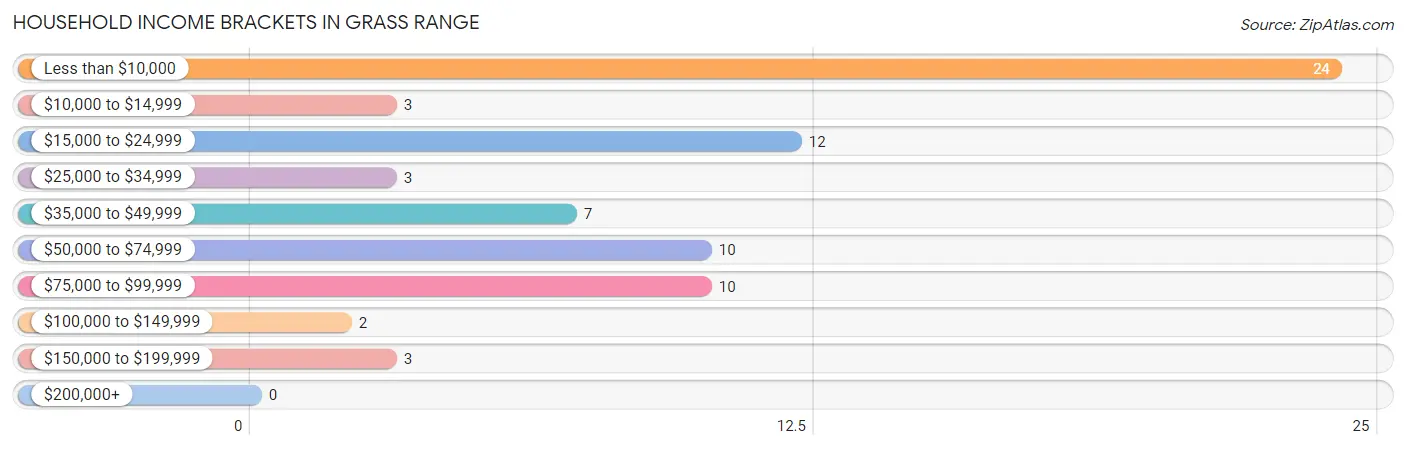
| Income Bracket | # Households | % Households |
| Less than $10,000 | 24 | 32.4% |
| $10,000 to $14,999 | 3 | 4.1% |
| $15,000 to $24,999 | 12 | 16.2% |
| $25,000 to $34,999 | 3 | 4.1% |
| $35,000 to $49,999 | 7 | 9.5% |
| $50,000 to $74,999 | 10 | 13.5% |
| $75,000 to $99,999 | 10 | 13.5% |
| $100,000 to $149,999 | 2 | 2.7% |
| $150,000 to $199,999 | 3 | 4.1% |
| $200,000+ | 0 | 0.0% |
Household Income by Householder Age in Grass Range
The median household income in Grass Range is $0, with the highest median household income of $65,625 found in the 25 to 44 years age bracket for the primary householder. A total of 7 households (9.5%) fall into this category.
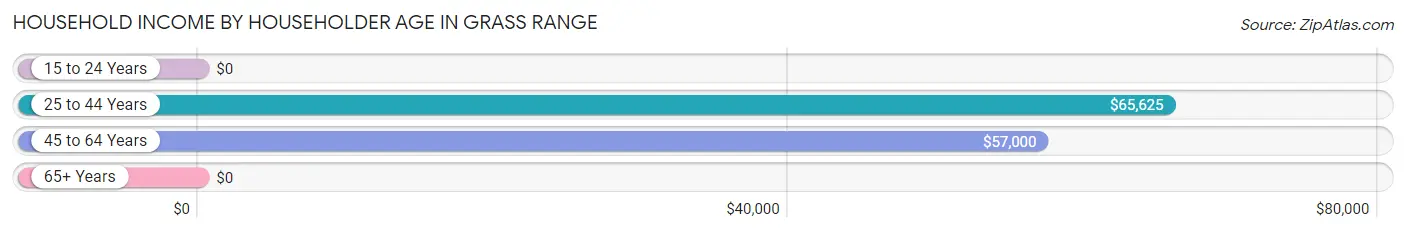
| Income Bracket | # Households | Median Income |
| 15 to 24 Years | 0 (0.0%) | $0 |
| 25 to 44 Years | 7 (9.5%) | $65,625 |
| 45 to 64 Years | 18 (24.3%) | $57,000 |
| 65+ Years | 49 (66.2%) | $0 |
| Total | 74 (100.0%) | $0 |
Poverty in Grass Range
Income Below Poverty by Sex and Age in Grass Range
With 10.9% poverty level for males and 33.9% for females among the residents of Grass Range, 65 to 74 year old males and 65 to 74 year old females are the most vulnerable to poverty, with 2 males (22.2%) and 21 females (58.3%) in their respective age groups living below the poverty level.
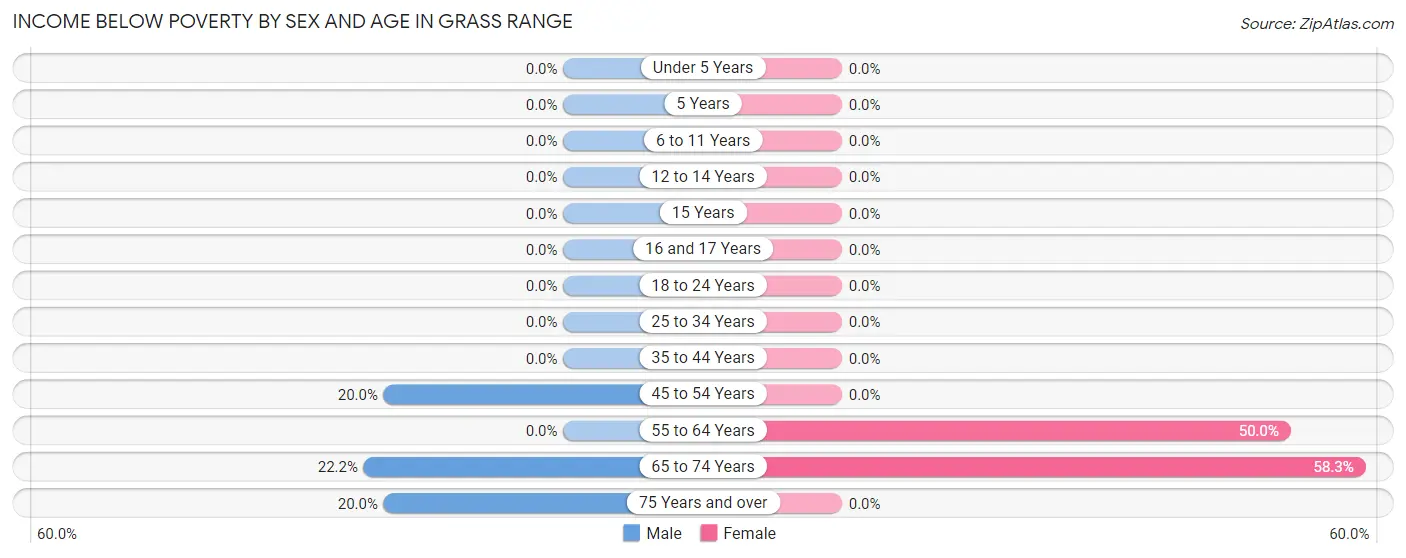
| Age Bracket | Male | Female |
| Under 5 Years | 0 (0.0%) | 0 (0.0%) |
| 5 Years | 0 (0.0%) | 0 (0.0%) |
| 6 to 11 Years | 0 (0.0%) | 0 (0.0%) |
| 12 to 14 Years | 0 (0.0%) | 0 (0.0%) |
| 15 Years | 0 (0.0%) | 0 (0.0%) |
| 16 and 17 Years | 0 (0.0%) | 0 (0.0%) |
| 18 to 24 Years | 0 (0.0%) | 0 (0.0%) |
| 25 to 34 Years | 0 (0.0%) | 0 (0.0%) |
| 35 to 44 Years | 0 (0.0%) | 0 (0.0%) |
| 45 to 54 Years | 1 (20.0%) | 0 (0.0%) |
| 55 to 64 Years | 0 (0.0%) | 1 (50.0%) |
| 65 to 74 Years | 2 (22.2%) | 21 (58.3%) |
| 75 Years and over | 2 (20.0%) | 0 (0.0%) |
| Total | 5 (10.9%) | 22 (33.9%) |
Income Above Poverty by Sex and Age in Grass Range
According to the poverty statistics in Grass Range, males aged under 5 years and females aged under 5 years are the age groups that are most secure financially, with 100.0% of males and 100.0% of females in these age groups living above the poverty line.
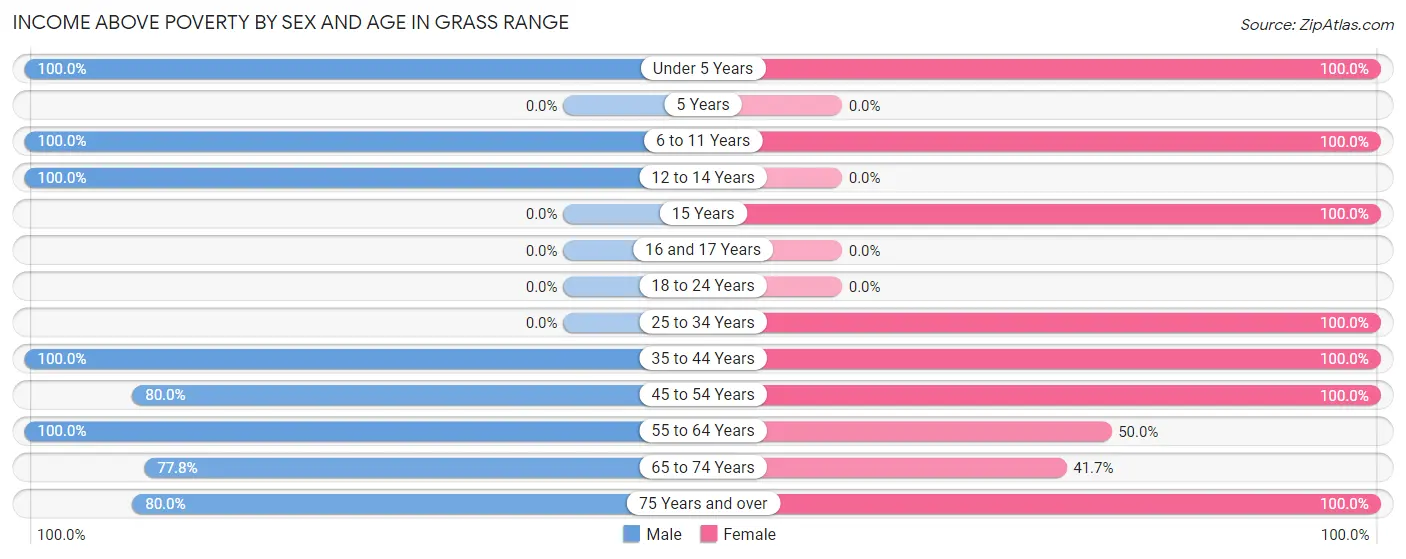
| Age Bracket | Male | Female |
| Under 5 Years | 1 (100.0%) | 3 (100.0%) |
| 5 Years | 0 (0.0%) | 0 (0.0%) |
| 6 to 11 Years | 1 (100.0%) | 1 (100.0%) |
| 12 to 14 Years | 1 (100.0%) | 0 (0.0%) |
| 15 Years | 0 (0.0%) | 4 (100.0%) |
| 16 and 17 Years | 0 (0.0%) | 0 (0.0%) |
| 18 to 24 Years | 0 (0.0%) | 0 (0.0%) |
| 25 to 34 Years | 0 (0.0%) | 3 (100.0%) |
| 35 to 44 Years | 13 (100.0%) | 4 (100.0%) |
| 45 to 54 Years | 4 (80.0%) | 9 (100.0%) |
| 55 to 64 Years | 6 (100.0%) | 1 (50.0%) |
| 65 to 74 Years | 7 (77.8%) | 15 (41.7%) |
| 75 Years and over | 8 (80.0%) | 3 (100.0%) |
| Total | 41 (89.1%) | 43 (66.1%) |
Income Below Poverty Among Married-Couple Families in Grass Range
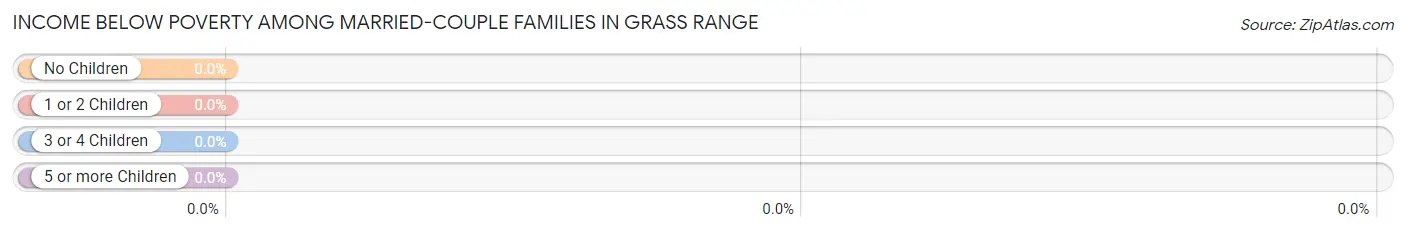
| Children | Above Poverty | Below Poverty |
| No Children | 15 (100.0%) | 0 (0.0%) |
| 1 or 2 Children | 8 (100.0%) | 0 (0.0%) |
| 3 or 4 Children | 2 (100.0%) | 0 (0.0%) |
| 5 or more Children | 0 (0.0%) | 0 (0.0%) |
| Total | 25 (100.0%) | 0 (0.0%) |
Income Below Poverty Among Single-Parent Households in Grass Range
| Children | Single Father | Single Mother |
| No Children | 0 (0.0%) | 0 (0.0%) |
| 1 or 2 Children | 0 (0.0%) | 0 (0.0%) |
| 3 or 4 Children | 0 (0.0%) | 0 (0.0%) |
| 5 or more Children | 0 (0.0%) | 0 (0.0%) |
| Total | 0 (0.0%) | 0 (0.0%) |
Income Below Poverty Among Married-Couple vs Single-Parent Households in Grass Range
| Children | Married-Couple Families | Single-Parent Households |
| No Children | 0 (0.0%) | 0 (0.0%) |
| 1 or 2 Children | 0 (0.0%) | 0 (0.0%) |
| 3 or 4 Children | 0 (0.0%) | 0 (0.0%) |
| 5 or more Children | 0 (0.0%) | 0 (0.0%) |
| Total | 0 (0.0%) | 0 (0.0%) |
Race in Grass Range
The most populous races in Grass Range are White / Caucasian (109 | 98.2%), and Two or more Races (2 | 1.8%).
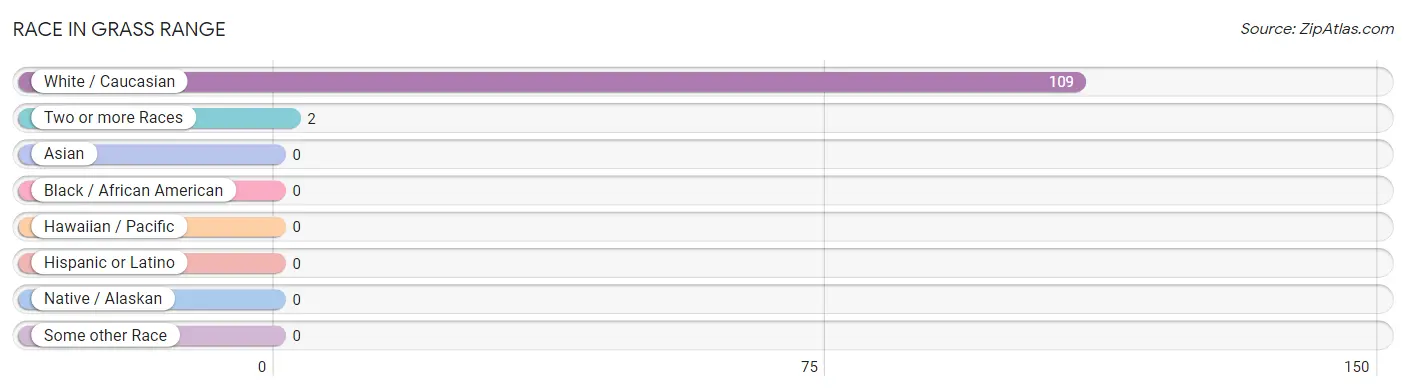
| Race | # Population | % Population |
| Asian | 0 | 0.0% |
| Black / African American | 0 | 0.0% |
| Hawaiian / Pacific | 0 | 0.0% |
| Hispanic or Latino | 0 | 0.0% |
| Native / Alaskan | 0 | 0.0% |
| White / Caucasian | 109 | 98.2% |
| Two or more Races | 2 | 1.8% |
| Some other Race | 0 | 0.0% |
| Total | 111 | 100.0% |
Ancestry in Grass Range
The most populous ancestries reported in Grass Range are Irish (50 | 45.1%), German (24 | 21.6%), English (14 | 12.6%), European (7 | 6.3%), and Norwegian (7 | 6.3%), together accounting for 91.9% of all Grass Range residents.
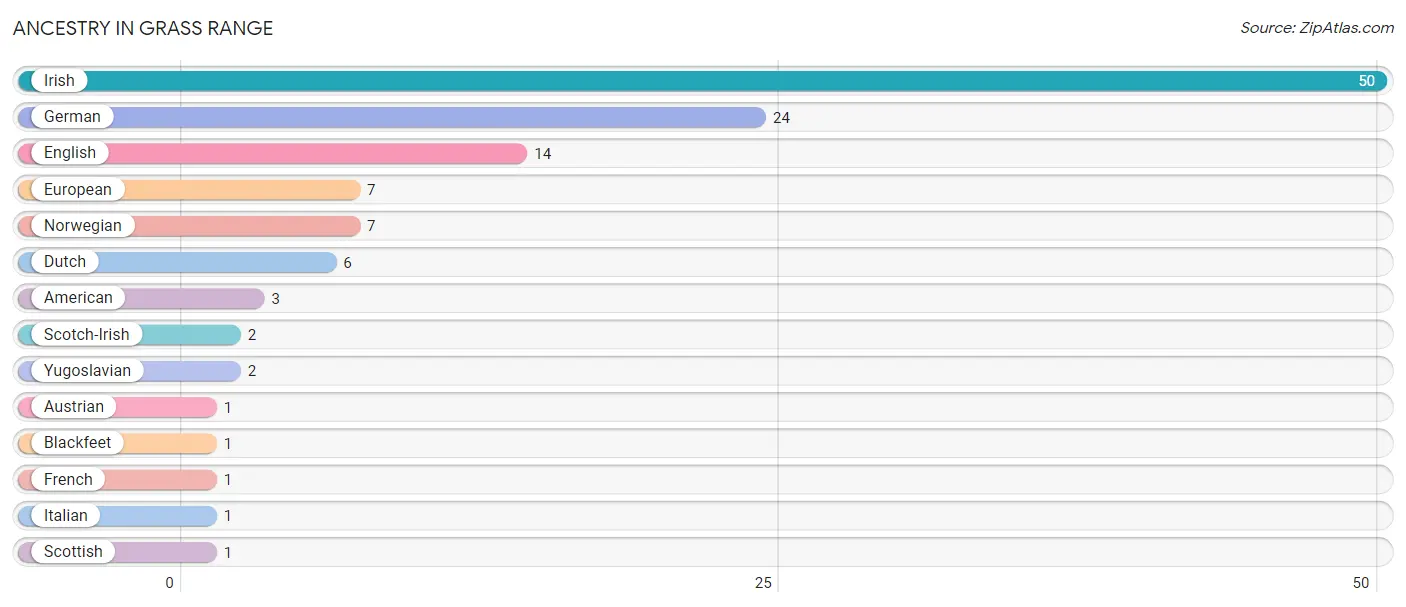
| Ancestry | # Population | % Population |
| American | 3 | 2.7% |
| Austrian | 1 | 0.9% |
| Blackfeet | 1 | 0.9% |
| Dutch | 6 | 5.4% |
| English | 14 | 12.6% |
| European | 7 | 6.3% |
| French | 1 | 0.9% |
| German | 24 | 21.6% |
| Irish | 50 | 45.1% |
| Italian | 1 | 0.9% |
| Norwegian | 7 | 6.3% |
| Scotch-Irish | 2 | 1.8% |
| Scottish | 1 | 0.9% |
| Yugoslavian | 2 | 1.8% | View All 14 Rows |
Immigrants in Grass Range

| Immigration Origin | # Population | % Population | View All 0 Rows |
Sex and Age in Grass Range
Sex and Age in Grass Range
The most populous age groups in Grass Range are 35 to 39 Years (9 | 19.6%) for men and 70 to 74 Years (30 | 46.2%) for women.
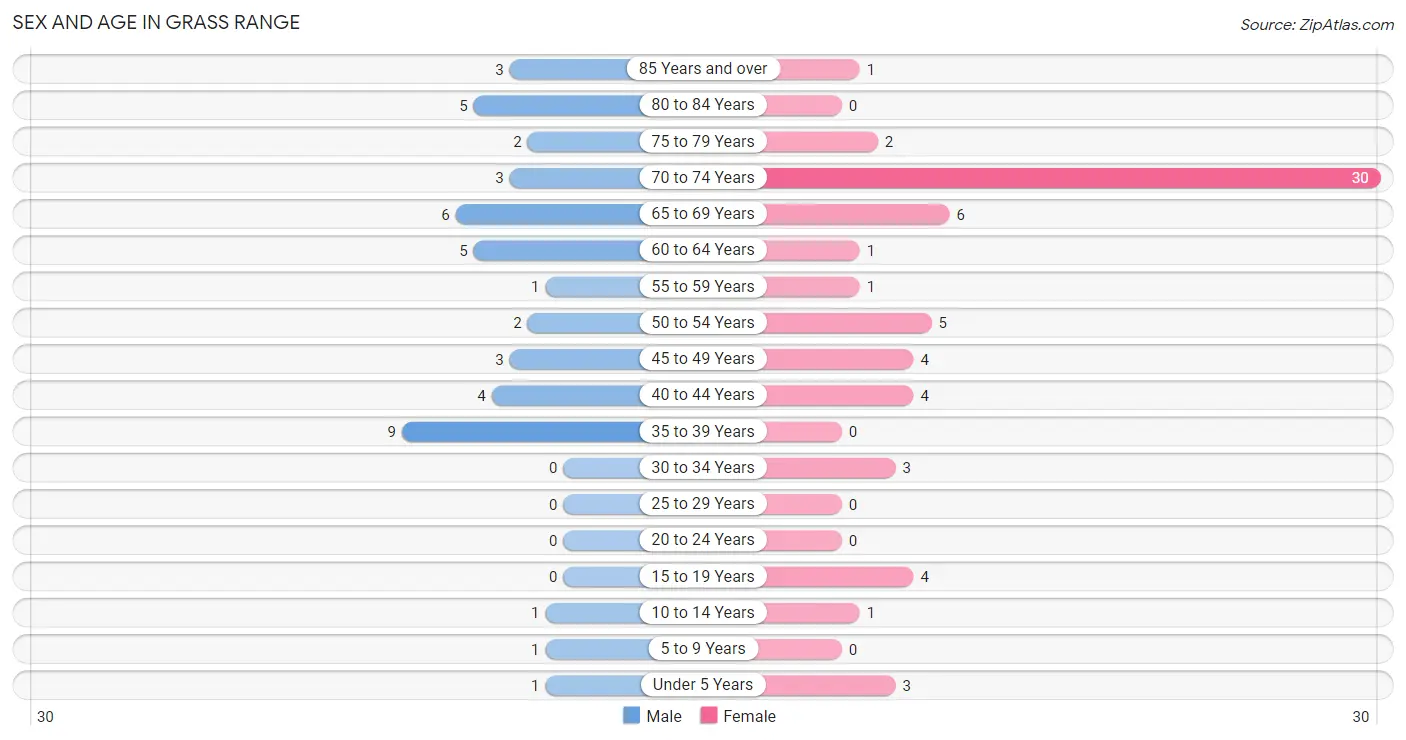
| Age Bracket | Male | Female |
| Under 5 Years | 1 (2.2%) | 3 (4.6%) |
| 5 to 9 Years | 1 (2.2%) | 0 (0.0%) |
| 10 to 14 Years | 1 (2.2%) | 1 (1.5%) |
| 15 to 19 Years | 0 (0.0%) | 4 (6.1%) |
| 20 to 24 Years | 0 (0.0%) | 0 (0.0%) |
| 25 to 29 Years | 0 (0.0%) | 0 (0.0%) |
| 30 to 34 Years | 0 (0.0%) | 3 (4.6%) |
| 35 to 39 Years | 9 (19.6%) | 0 (0.0%) |
| 40 to 44 Years | 4 (8.7%) | 4 (6.1%) |
| 45 to 49 Years | 3 (6.5%) | 4 (6.1%) |
| 50 to 54 Years | 2 (4.3%) | 5 (7.7%) |
| 55 to 59 Years | 1 (2.2%) | 1 (1.5%) |
| 60 to 64 Years | 5 (10.9%) | 1 (1.5%) |
| 65 to 69 Years | 6 (13.0%) | 6 (9.2%) |
| 70 to 74 Years | 3 (6.5%) | 30 (46.2%) |
| 75 to 79 Years | 2 (4.3%) | 2 (3.1%) |
| 80 to 84 Years | 5 (10.9%) | 0 (0.0%) |
| 85 Years and over | 3 (6.5%) | 1 (1.5%) |
| Total | 46 (100.0%) | 65 (100.0%) |
Families and Households in Grass Range
Median Family Size in Grass Range
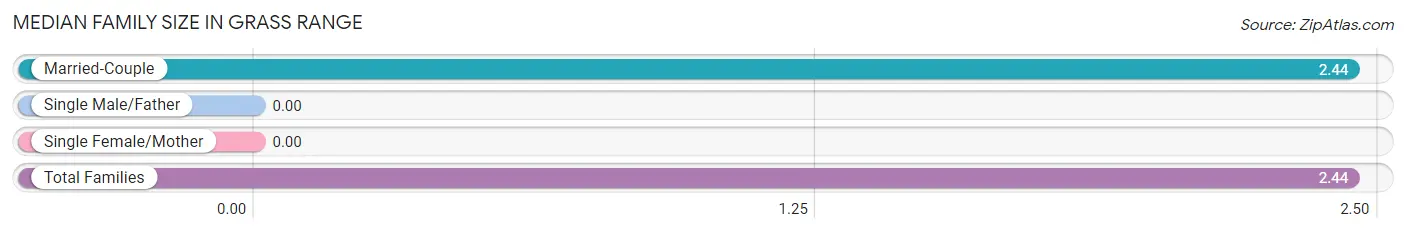
| Family Type | # Families | Family Size |
| Married-Couple | 25 (100.0%) | 2.44 |
| Single Male/Father | 0 (0.0%) | - |
| Single Female/Mother | 0 (0.0%) | - |
| Total Families | 25 (100.0%) | 2.44 |
Median Household Size in Grass Range
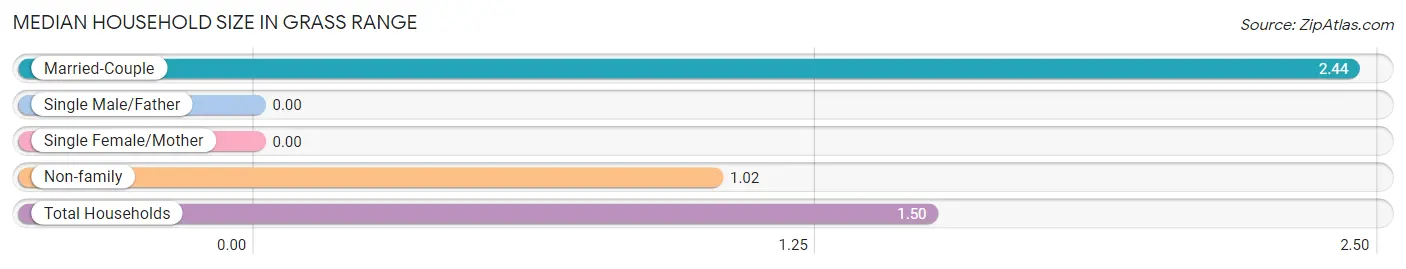
| Household Type | # Households | Household Size |
| Married-Couple | 25 (33.8%) | 2.44 |
| Single Male/Father | 0 (0.0%) | - |
| Single Female/Mother | 0 (0.0%) | - |
| Non-family | 49 (66.2%) | 1.02 |
| Total Households | 74 (100.0%) | 1.50 |
Household Size by Marriage Status in Grass Range
Out of a total of 74 households in Grass Range, 25 (33.8%) are family households, while 49 (66.2%) are nonfamily households. The most numerous type of family households are 2-person households, comprising 15, and the most common type of nonfamily households are 1-person households, comprising 48.
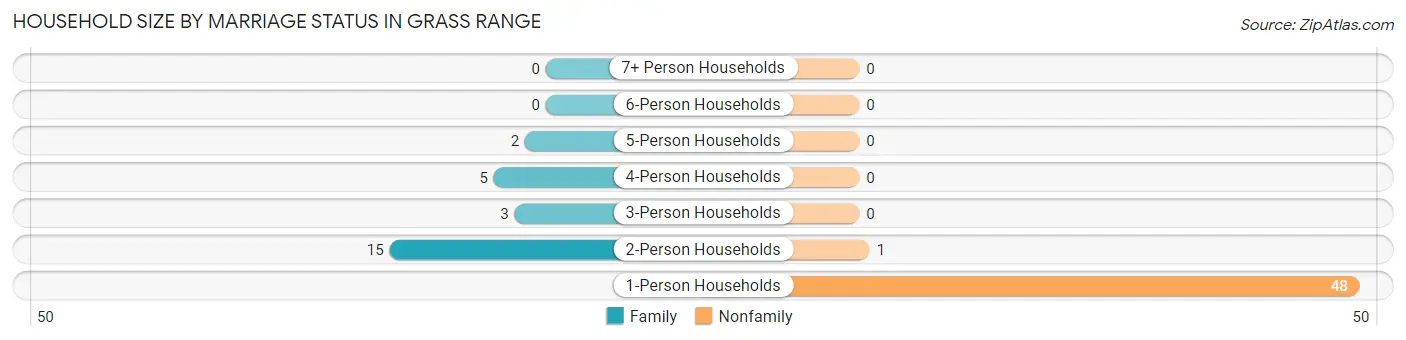
| Household Size | Family Households | Nonfamily Households |
| 1-Person Households | - | 48 (64.9%) |
| 2-Person Households | 15 (20.3%) | 1 (1.3%) |
| 3-Person Households | 3 (4.1%) | 0 (0.0%) |
| 4-Person Households | 5 (6.8%) | 0 (0.0%) |
| 5-Person Households | 2 (2.7%) | 0 (0.0%) |
| 6-Person Households | 0 (0.0%) | 0 (0.0%) |
| 7+ Person Households | 0 (0.0%) | 0 (0.0%) |
| Total | 25 (33.8%) | 49 (66.2%) |
Female Fertility in Grass Range
Fertility by Age in Grass Range
| Age Bracket | Women with Births | Births / 1,000 Women |
| 15 to 19 years | 0 (0.0%) | 0.0 |
| 20 to 34 years | 0 (0.0%) | 0.0 |
| 35 to 50 years | 0 (0.0%) | 0.0 |
| Total | 0 (0.0%) | 0.0 |
Fertility by Age by Marriage Status in Grass Range
| Age Bracket | Married | Unmarried |
| 15 to 19 years | 0 (0.0%) | 0 (0.0%) |
| 20 to 34 years | 0 (0.0%) | 0 (0.0%) |
| 35 to 50 years | 0 (0.0%) | 0 (0.0%) |
| Total | 0 (0.0%) | 0 (0.0%) |
Fertility by Education in Grass Range
| Educational Attainment | Women with Births | Births / 1,000 Women |
| Less than High School | 0 (0.0%) | 0.0 |
| High School Diploma | 0 (0.0%) | 0.0 |
| College or Associate's Degree | 0 (0.0%) | 0.0 |
| Bachelor's Degree | 0 (0.0%) | 0.0 |
| Graduate Degree | 0 (0.0%) | 0.0 |
| Total | 0 (0.0%) | 0.0 |
Fertility by Education by Marriage Status in Grass Range
| Educational Attainment | Married | Unmarried |
| Less than High School | 0 (0.0%) | 0 (0.0%) |
| High School Diploma | 0 (0.0%) | 0 (0.0%) |
| College or Associate's Degree | 0 (0.0%) | 0 (0.0%) |
| Bachelor's Degree | 0 (0.0%) | 0 (0.0%) |
| Graduate Degree | 0 (0.0%) | 0 (0.0%) |
| Total | 0 (0.0%) | 0 (0.0%) |
Employment Characteristics in Grass Range
Employment by Class of Employer in Grass Range
Among the 46 employed individuals in Grass Range, private company employees (18 | 39.1%), self-employed (not incorporated) (11 | 23.9%), and not-for-profit organizations (6 | 13.0%) make up the most common classes of employment.
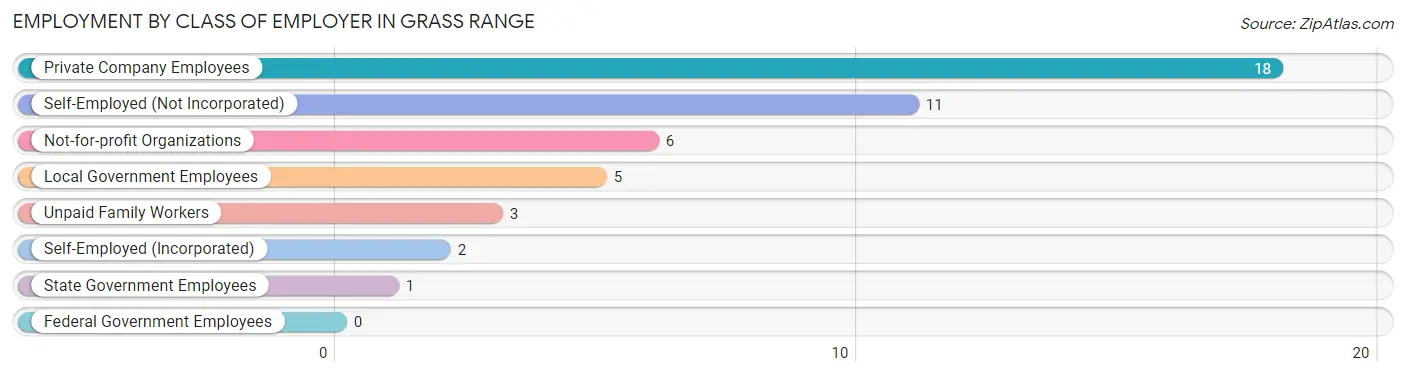
| Employer Class | # Employees | % Employees |
| Private Company Employees | 18 | 39.1% |
| Self-Employed (Incorporated) | 2 | 4.3% |
| Self-Employed (Not Incorporated) | 11 | 23.9% |
| Not-for-profit Organizations | 6 | 13.0% |
| Local Government Employees | 5 | 10.9% |
| State Government Employees | 1 | 2.2% |
| Federal Government Employees | 0 | 0.0% |
| Unpaid Family Workers | 3 | 6.5% |
| Total | 46 | 100.0% |
Employment Status by Age in Grass Range
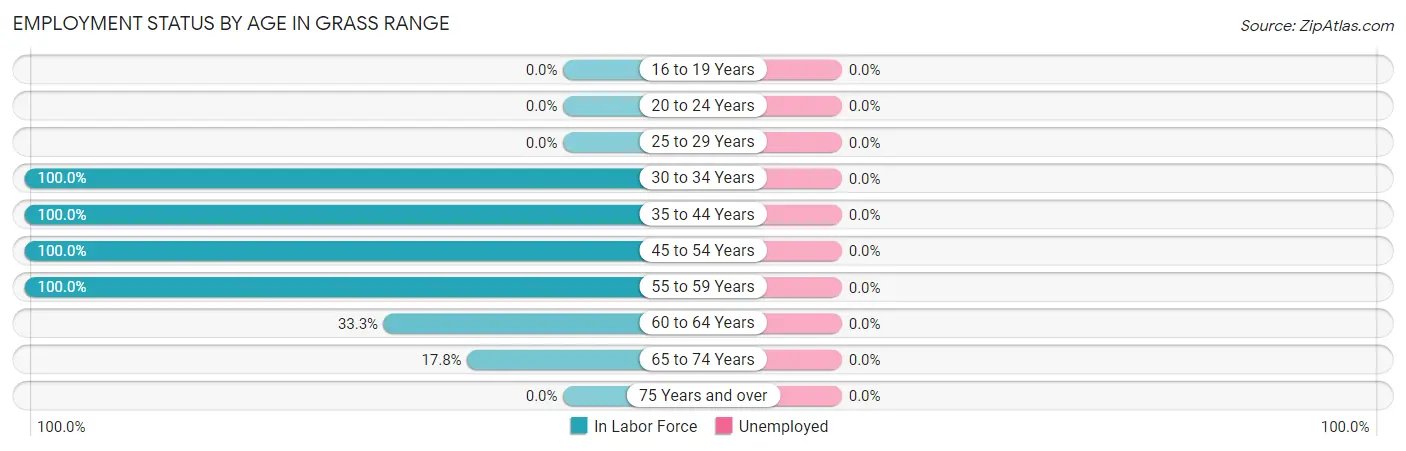
| Age Bracket | In Labor Force | Unemployed |
| 16 to 19 Years | 0 (0.0%) | 0 (0.0%) |
| 20 to 24 Years | 0 (0.0%) | 0 (0.0%) |
| 25 to 29 Years | 0 (0.0%) | 0 (0.0%) |
| 30 to 34 Years | 3 (100.0%) | 0 (0.0%) |
| 35 to 44 Years | 17 (100.0%) | 0 (0.0%) |
| 45 to 54 Years | 14 (100.0%) | 0 (0.0%) |
| 55 to 59 Years | 2 (100.0%) | 0 (0.0%) |
| 60 to 64 Years | 2 (33.3%) | 0 (0.0%) |
| 65 to 74 Years | 8 (17.8%) | 0 (0.0%) |
| 75 Years and over | 0 (0.0%) | 0 (0.0%) |
| Total | 46 (46.0%) | 0 (0.0%) |
Employment Status by Educational Attainment in Grass Range
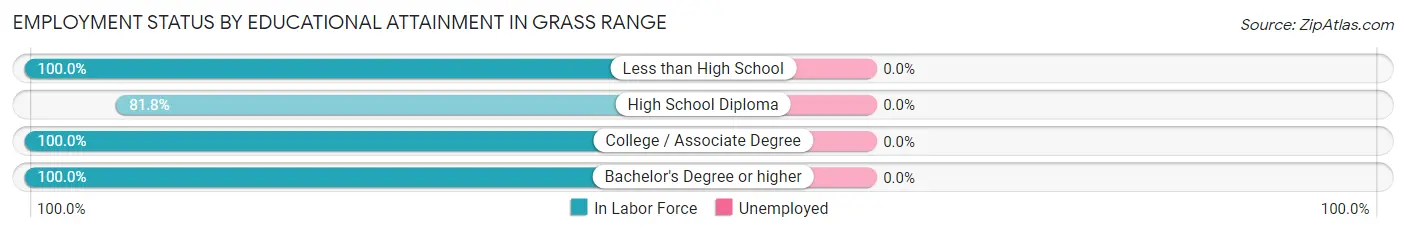
| Educational Attainment | In Labor Force | Unemployed |
| Less than High School | 2 (100.0%) | 0 (0.0%) |
| High School Diploma | 18 (81.8%) | 0 (0.0%) |
| College / Associate Degree | 8 (100.0%) | 0 (0.0%) |
| Bachelor's Degree or higher | 10 (100.0%) | 0 (0.0%) |
| Total | 38 (90.5%) | 0 (0.0%) |
Employment Occupations by Sex in Grass Range
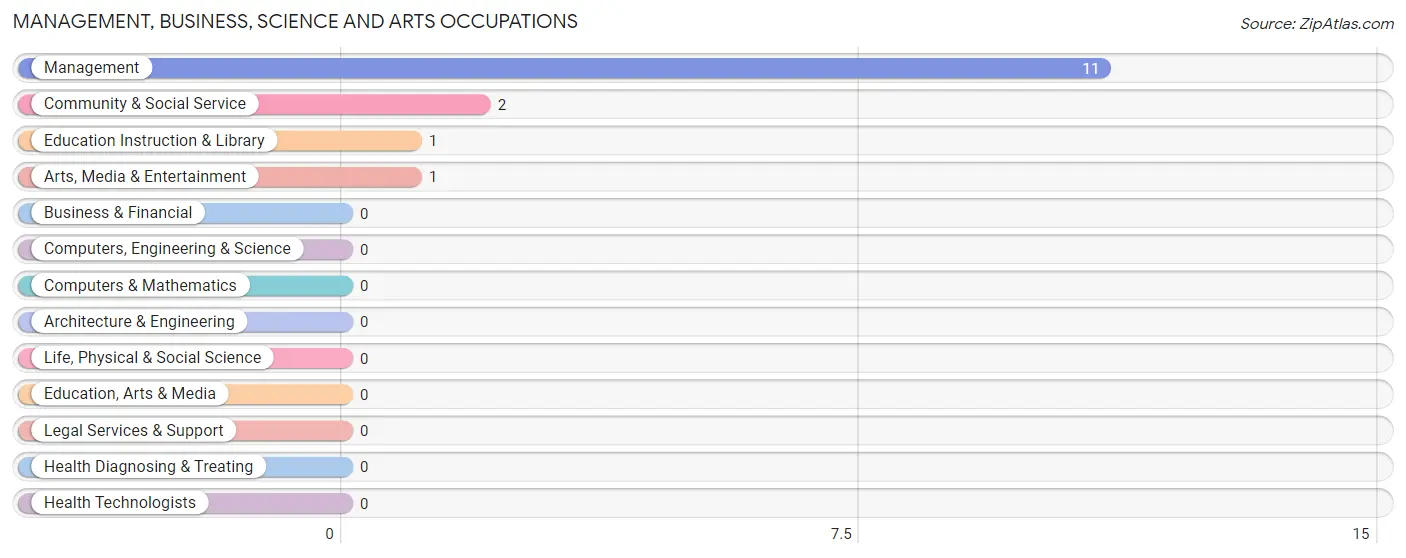
Management, Business, Science and Arts Occupations
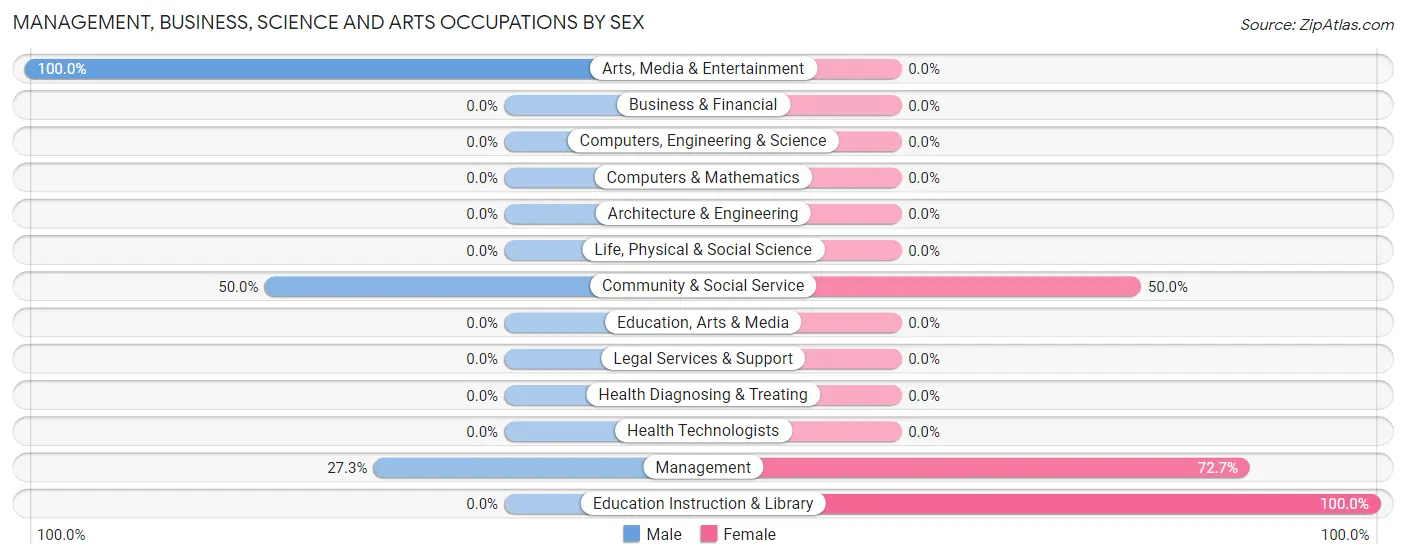
The most common Management, Business, Science and Arts occupations in Grass Range are Management (11 | 23.9%), Community & Social Service (2 | 4.3%), Education Instruction & Library (1 | 2.2%), and Arts, Media & Entertainment (1 | 2.2%).
Management, Business, Science and Arts Occupations by Sex
Within the Management, Business, Science and Arts occupations in Grass Range, the most male-oriented occupations are Arts, Media & Entertainment (100.0%), Community & Social Service (50.0%), and Management (27.3%), while the most female-oriented occupations are Education Instruction & Library (100.0%), Management (72.7%), and Community & Social Service (50.0%).
| Occupation | Male | Female |
| Management | 3 (27.3%) | 8 (72.7%) |
| Business & Financial | 0 (0.0%) | 0 (0.0%) |
| Computers, Engineering & Science | 0 (0.0%) | 0 (0.0%) |
| Computers & Mathematics | 0 (0.0%) | 0 (0.0%) |
| Architecture & Engineering | 0 (0.0%) | 0 (0.0%) |
| Life, Physical & Social Science | 0 (0.0%) | 0 (0.0%) |
| Community & Social Service | 1 (50.0%) | 1 (50.0%) |
| Education, Arts & Media | 0 (0.0%) | 0 (0.0%) |
| Legal Services & Support | 0 (0.0%) | 0 (0.0%) |
| Education Instruction & Library | 0 (0.0%) | 1 (100.0%) |
| Arts, Media & Entertainment | 1 (100.0%) | 0 (0.0%) |
| Health Diagnosing & Treating | 0 (0.0%) | 0 (0.0%) |
| Health Technologists | 0 (0.0%) | 0 (0.0%) |
| Total (Category) | 4 (30.8%) | 9 (69.2%) |
| Total (Overall) | 22 (47.8%) | 24 (52.2%) |
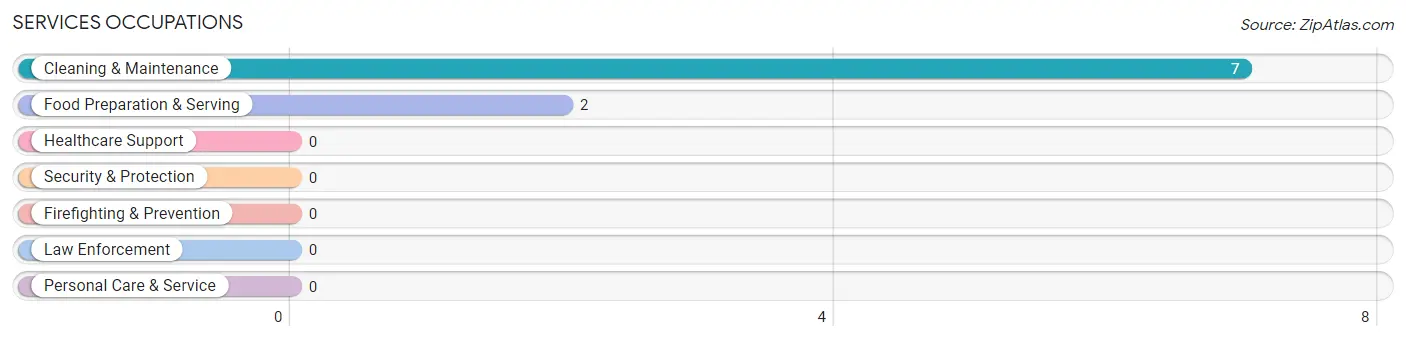
Services Occupations
The most common Services occupations in Grass Range are Cleaning & Maintenance (7 | 15.2%), and Food Preparation & Serving (2 | 4.3%).
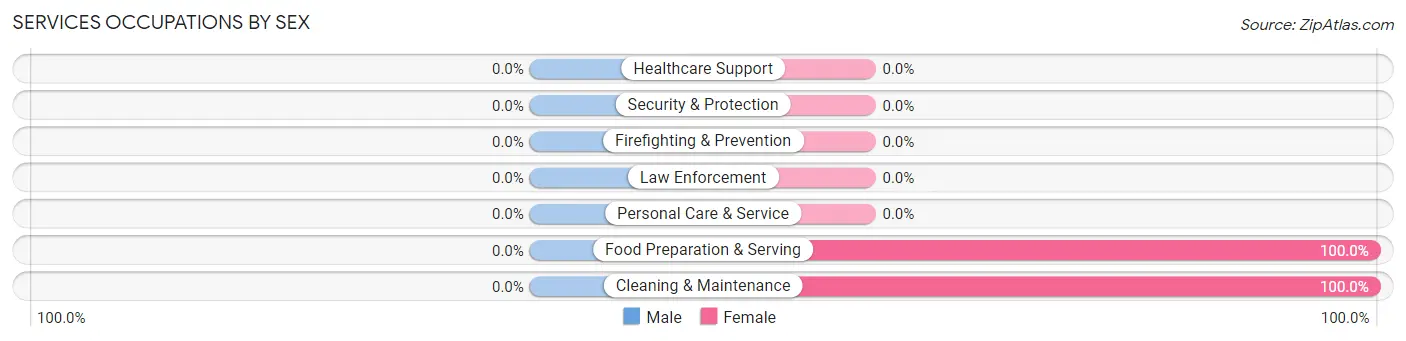
Services Occupations by Sex
| Occupation | Male | Female |
| Healthcare Support | 0 (0.0%) | 0 (0.0%) |
| Security & Protection | 0 (0.0%) | 0 (0.0%) |
| Firefighting & Prevention | 0 (0.0%) | 0 (0.0%) |
| Law Enforcement | 0 (0.0%) | 0 (0.0%) |
| Food Preparation & Serving | 0 (0.0%) | 2 (100.0%) |
| Cleaning & Maintenance | 0 (0.0%) | 7 (100.0%) |
| Personal Care & Service | 0 (0.0%) | 0 (0.0%) |
| Total (Category) | 0 (0.0%) | 9 (100.0%) |
| Total (Overall) | 22 (47.8%) | 24 (52.2%) |
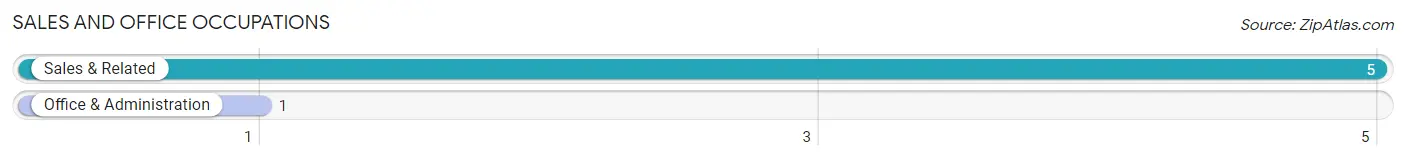
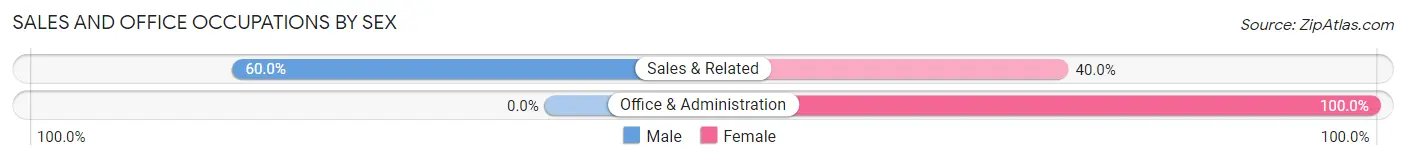
Sales and Office Occupations
The most common Sales and Office occupations in Grass Range are Sales & Related (5 | 10.9%), and Office & Administration (1 | 2.2%).
Sales and Office Occupations by Sex
| Occupation | Male | Female |
| Sales & Related | 3 (60.0%) | 2 (40.0%) |
| Office & Administration | 0 (0.0%) | 1 (100.0%) |
| Total (Category) | 3 (50.0%) | 3 (50.0%) |
| Total (Overall) | 22 (47.8%) | 24 (52.2%) |
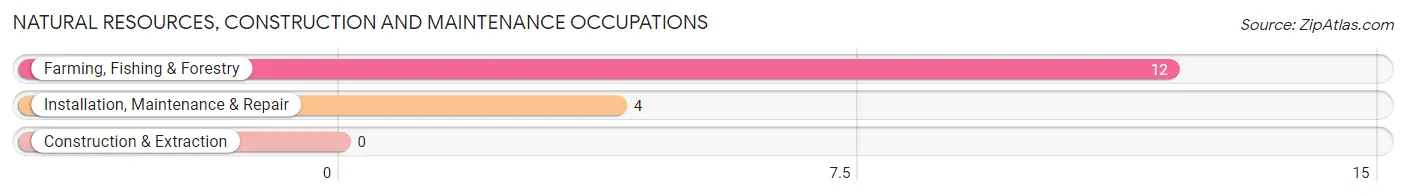
Natural Resources, Construction and Maintenance Occupations
The most common Natural Resources, Construction and Maintenance occupations in Grass Range are Farming, Fishing & Forestry (12 | 26.1%), and Installation, Maintenance & Repair (4 | 8.7%).
Natural Resources, Construction and Maintenance Occupations by Sex
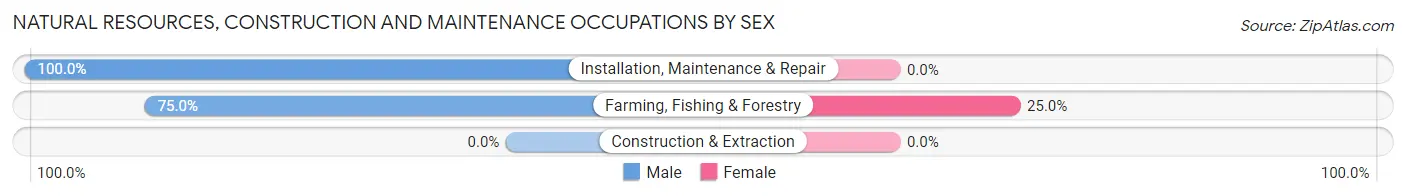
| Occupation | Male | Female |
| Farming, Fishing & Forestry | 9 (75.0%) | 3 (25.0%) |
| Construction & Extraction | 0 (0.0%) | 0 (0.0%) |
| Installation, Maintenance & Repair | 4 (100.0%) | 0 (0.0%) |
| Total (Category) | 13 (81.2%) | 3 (18.8%) |
| Total (Overall) | 22 (47.8%) | 24 (52.2%) |
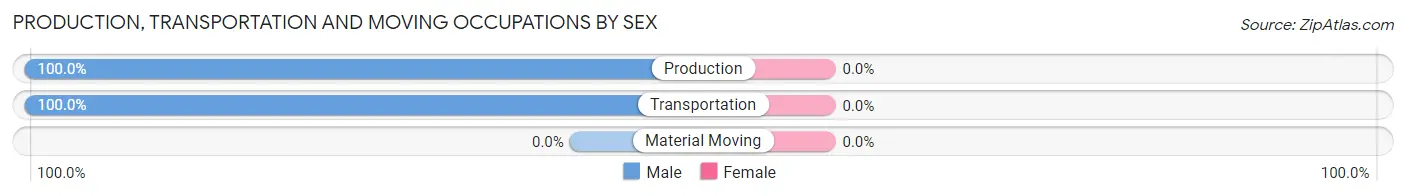
Production, Transportation and Moving Occupations
The most common Production, Transportation and Moving occupations in Grass Range are Production (1 | 2.2%), and Transportation (1 | 2.2%).
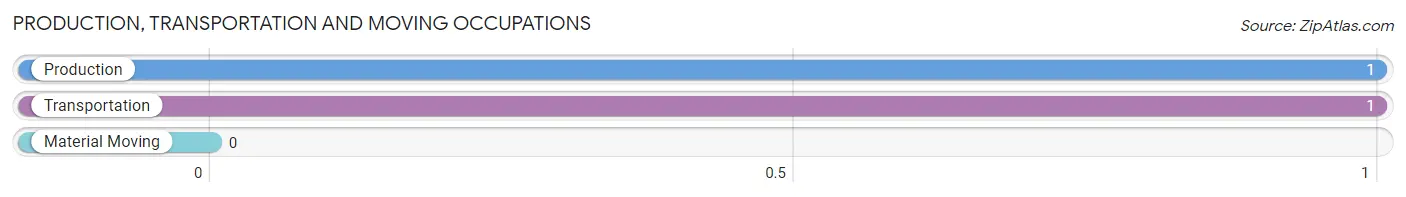
Production, Transportation and Moving Occupations by Sex
| Occupation | Male | Female |
| Production | 1 (100.0%) | 0 (0.0%) |
| Transportation | 1 (100.0%) | 0 (0.0%) |
| Material Moving | 0 (0.0%) | 0 (0.0%) |
| Total (Category) | 2 (100.0%) | 0 (0.0%) |
| Total (Overall) | 22 (47.8%) | 24 (52.2%) |
Employment Industries by Sex in Grass Range
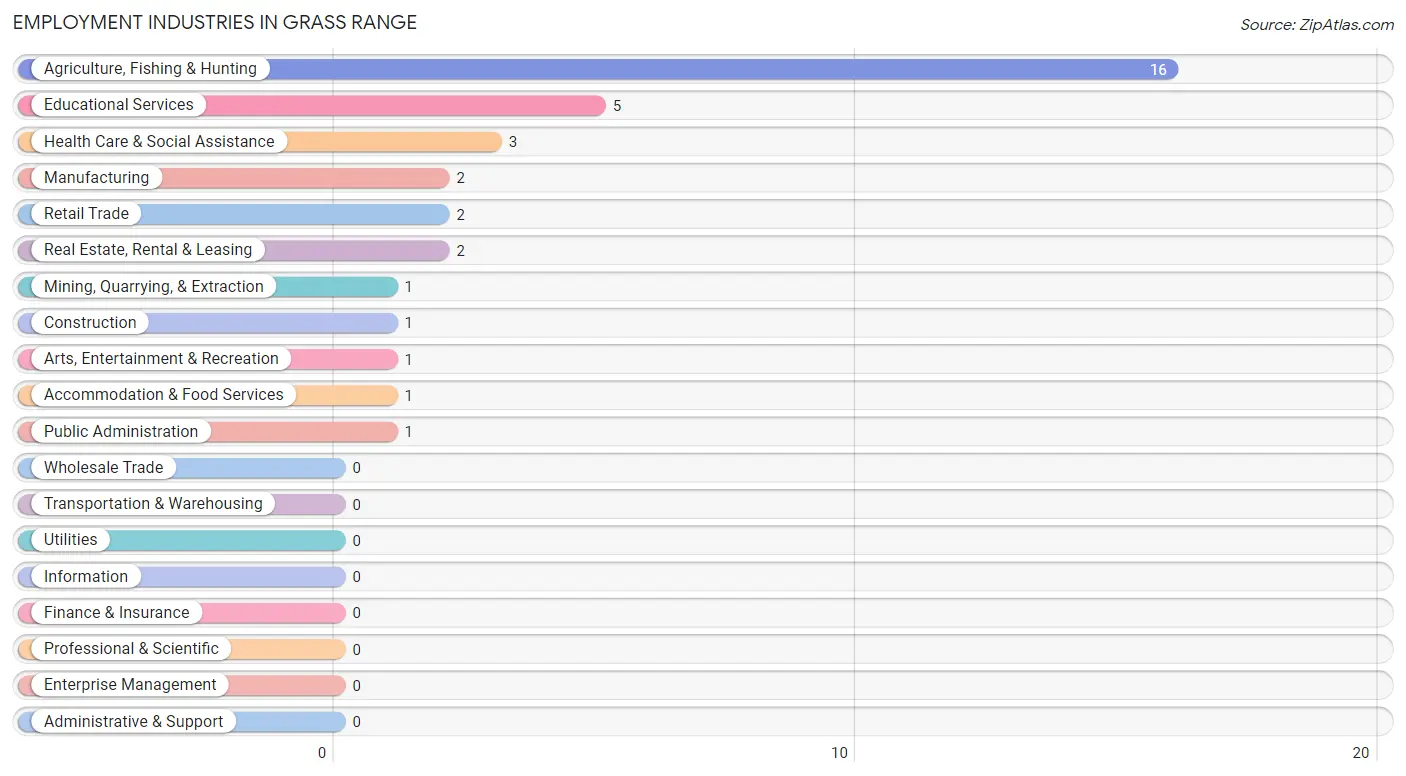
Employment Industries in Grass Range
The major employment industries in Grass Range include Agriculture, Fishing & Hunting (16 | 34.8%), Educational Services (5 | 10.9%), Health Care & Social Assistance (3 | 6.5%), Manufacturing (2 | 4.3%), and Retail Trade (2 | 4.3%).
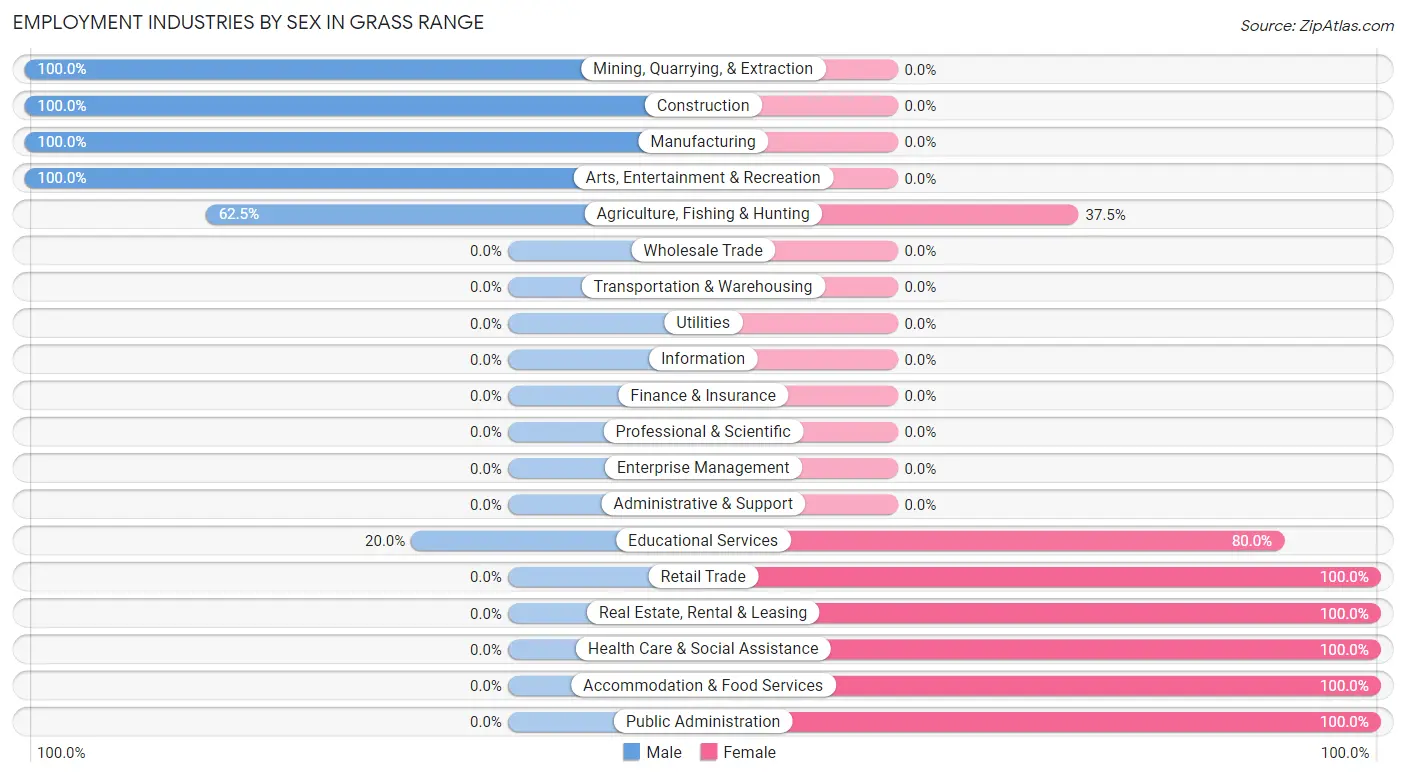
Employment Industries by Sex in Grass Range
The Grass Range industries that see more men than women are Mining, Quarrying, & Extraction (100.0%), Construction (100.0%), and Manufacturing (100.0%), whereas the industries that tend to have a higher number of women are Retail Trade (100.0%), Real Estate, Rental & Leasing (100.0%), and Health Care & Social Assistance (100.0%).
| Industry | Male | Female |
| Agriculture, Fishing & Hunting | 10 (62.5%) | 6 (37.5%) |
| Mining, Quarrying, & Extraction | 1 (100.0%) | 0 (0.0%) |
| Construction | 1 (100.0%) | 0 (0.0%) |
| Manufacturing | 2 (100.0%) | 0 (0.0%) |
| Wholesale Trade | 0 (0.0%) | 0 (0.0%) |
| Retail Trade | 0 (0.0%) | 2 (100.0%) |
| Transportation & Warehousing | 0 (0.0%) | 0 (0.0%) |
| Utilities | 0 (0.0%) | 0 (0.0%) |
| Information | 0 (0.0%) | 0 (0.0%) |
| Finance & Insurance | 0 (0.0%) | 0 (0.0%) |
| Real Estate, Rental & Leasing | 0 (0.0%) | 2 (100.0%) |
| Professional & Scientific | 0 (0.0%) | 0 (0.0%) |
| Enterprise Management | 0 (0.0%) | 0 (0.0%) |
| Administrative & Support | 0 (0.0%) | 0 (0.0%) |
| Educational Services | 1 (20.0%) | 4 (80.0%) |
| Health Care & Social Assistance | 0 (0.0%) | 3 (100.0%) |
| Arts, Entertainment & Recreation | 1 (100.0%) | 0 (0.0%) |
| Accommodation & Food Services | 0 (0.0%) | 1 (100.0%) |
| Public Administration | 0 (0.0%) | 1 (100.0%) |
| Total | 22 (47.8%) | 24 (52.2%) |
Education in Grass Range
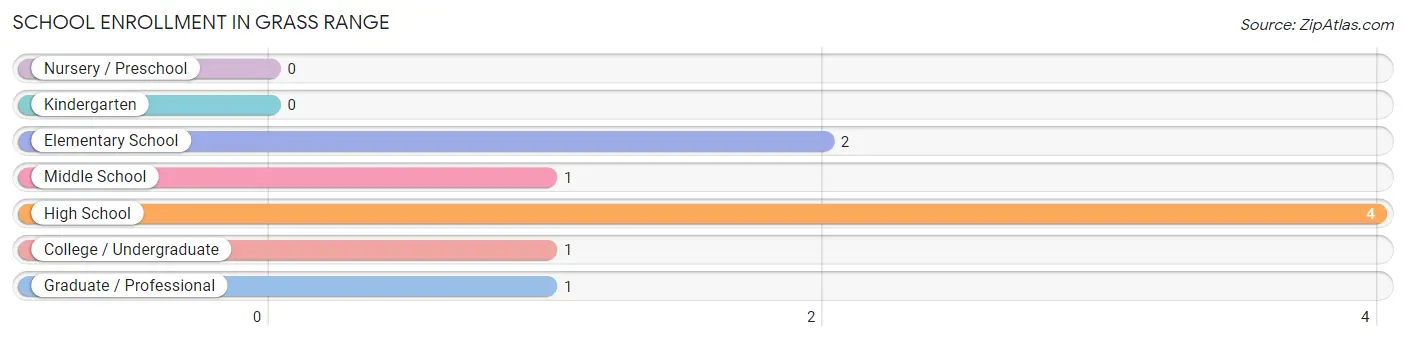
School Enrollment in Grass Range
The most common levels of schooling among the 9 students in Grass Range are high school (4 | 44.4%), elementary school (2 | 22.2%), and middle school (1 | 11.1%).
| School Level | # Students | % Students |
| Nursery / Preschool | 0 | 0.0% |
| Kindergarten | 0 | 0.0% |
| Elementary School | 2 | 22.2% |
| Middle School | 1 | 11.1% |
| High School | 4 | 44.4% |
| College / Undergraduate | 1 | 11.1% |
| Graduate / Professional | 1 | 11.1% |
| Total | 9 | 100.0% |
School Enrollment by Age by Funding Source in Grass Range
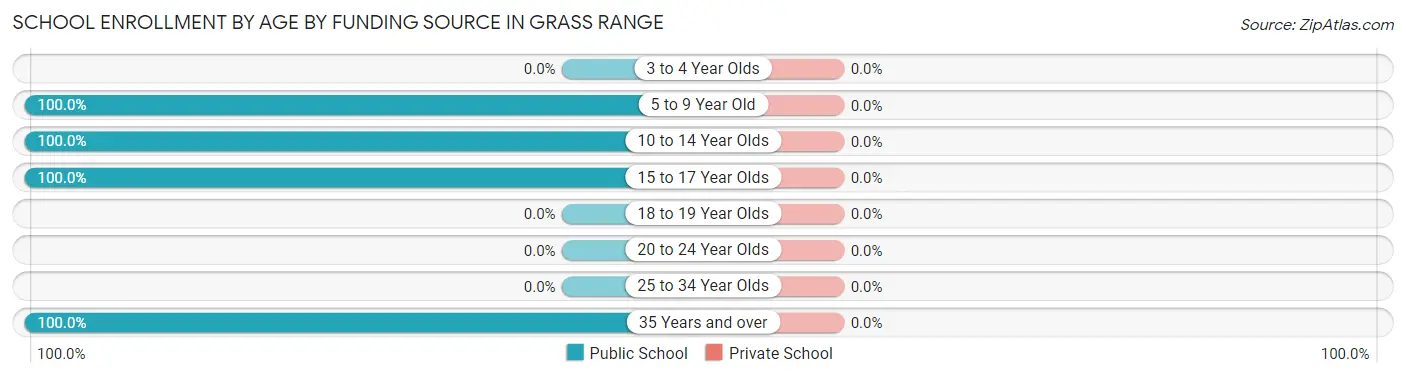
| Age Bracket | Public School | Private School |
| 3 to 4 Year Olds | 0 (0.0%) | 0 (0.0%) |
| 5 to 9 Year Old | 1 (100.0%) | 0 (0.0%) |
| 10 to 14 Year Olds | 2 (100.0%) | 0 (0.0%) |
| 15 to 17 Year Olds | 4 (100.0%) | 0 (0.0%) |
| 18 to 19 Year Olds | 0 (0.0%) | 0 (0.0%) |
| 20 to 24 Year Olds | 0 (0.0%) | 0 (0.0%) |
| 25 to 34 Year Olds | 0 (0.0%) | 0 (0.0%) |
| 35 Years and over | 2 (100.0%) | 0 (0.0%) |
| Total | 9 (100.0%) | 0 (0.0%) |
Educational Attainment by Field of Study in Grass Range
Education (7 | 41.2%), business (6 | 35.3%), bio, nature & agricultural (2 | 11.8%), and liberal arts & history (2 | 11.8%) are the most common fields of study among 17 individuals in Grass Range who have obtained a bachelor's degree or higher.
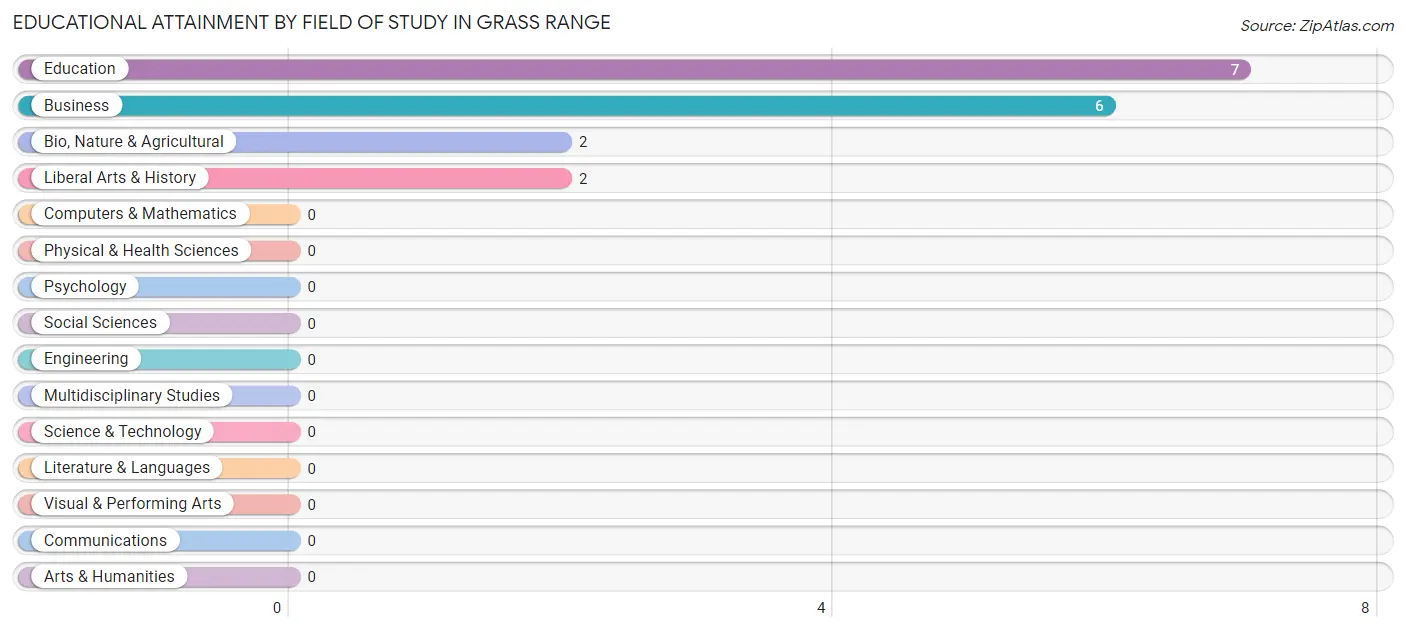
| Field of Study | # Graduates | % Graduates |
| Computers & Mathematics | 0 | 0.0% |
| Bio, Nature & Agricultural | 2 | 11.8% |
| Physical & Health Sciences | 0 | 0.0% |
| Psychology | 0 | 0.0% |
| Social Sciences | 0 | 0.0% |
| Engineering | 0 | 0.0% |
| Multidisciplinary Studies | 0 | 0.0% |
| Science & Technology | 0 | 0.0% |
| Business | 6 | 35.3% |
| Education | 7 | 41.2% |
| Literature & Languages | 0 | 0.0% |
| Liberal Arts & History | 2 | 11.8% |
| Visual & Performing Arts | 0 | 0.0% |
| Communications | 0 | 0.0% |
| Arts & Humanities | 0 | 0.0% |
| Total | 17 | 100.0% |
Transportation & Commute in Grass Range
Vehicle Availability by Sex in Grass Range
The most prevalent vehicle ownership categories in Grass Range are males with 2 vehicles (14, accounting for 63.6%) and females with 2 vehicles (17, making up 58.3%).
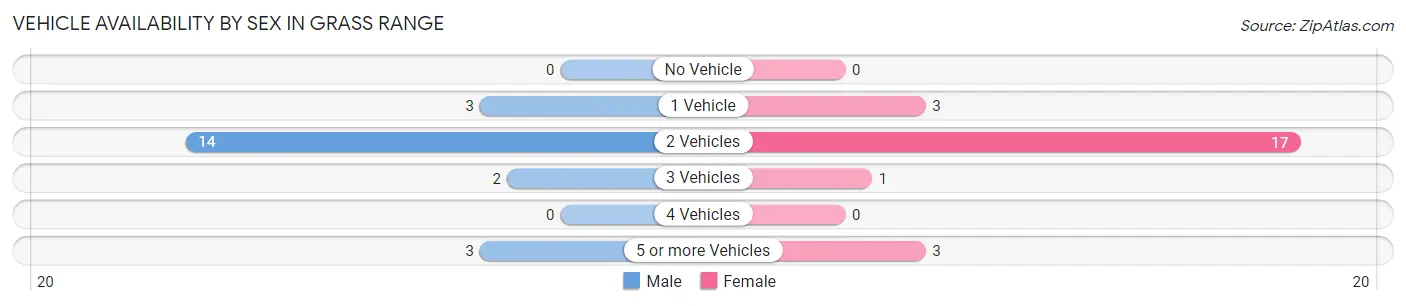
| Vehicles Available | Male | Female |
| No Vehicle | 0 (0.0%) | 0 (0.0%) |
| 1 Vehicle | 3 (13.6%) | 3 (12.5%) |
| 2 Vehicles | 14 (63.6%) | 17 (70.8%) |
| 3 Vehicles | 2 (9.1%) | 1 (4.2%) |
| 4 Vehicles | 0 (0.0%) | 0 (0.0%) |
| 5 or more Vehicles | 3 (13.6%) | 3 (12.5%) |
| Total | 22 (100.0%) | 24 (100.0%) |
Commute Time in Grass Range
The most frequently occuring commute durations in Grass Range are 5 to 9 minutes (15 commuters, 34.9%), 60 to 89 minutes (11 commuters, 25.6%), and 30 to 34 minutes (7 commuters, 16.3%).
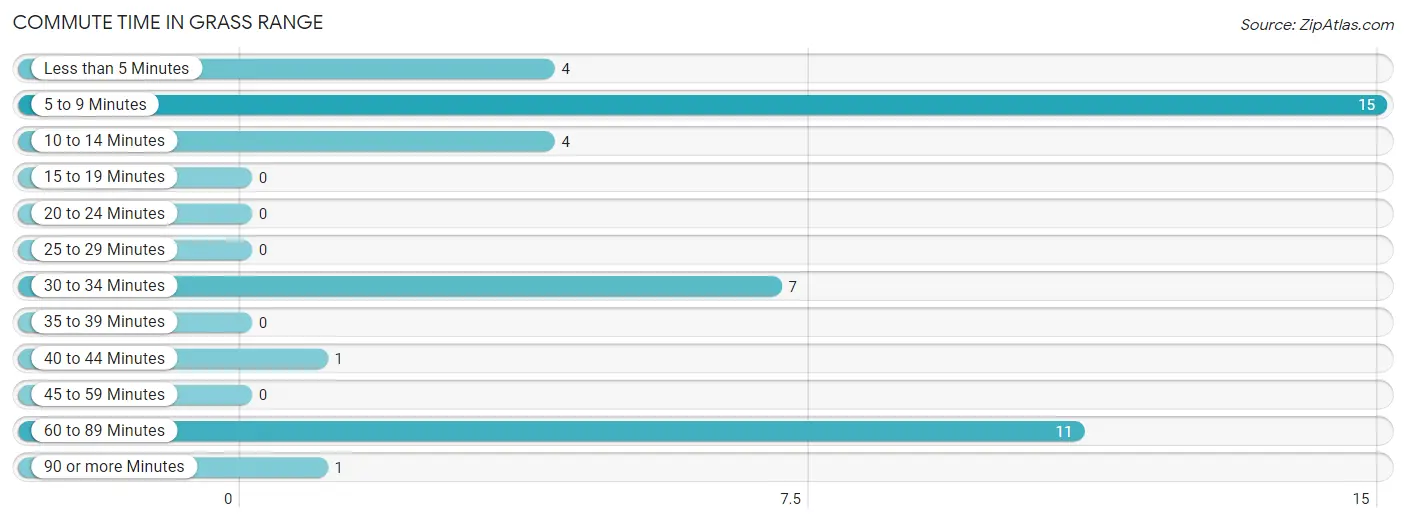
| Commute Time | # Commuters | % Commuters |
| Less than 5 Minutes | 4 | 9.3% |
| 5 to 9 Minutes | 15 | 34.9% |
| 10 to 14 Minutes | 4 | 9.3% |
| 15 to 19 Minutes | 0 | 0.0% |
| 20 to 24 Minutes | 0 | 0.0% |
| 25 to 29 Minutes | 0 | 0.0% |
| 30 to 34 Minutes | 7 | 16.3% |
| 35 to 39 Minutes | 0 | 0.0% |
| 40 to 44 Minutes | 1 | 2.3% |
| 45 to 59 Minutes | 0 | 0.0% |
| 60 to 89 Minutes | 11 | 25.6% |
| 90 or more Minutes | 1 | 2.3% |
Commute Time by Sex in Grass Range
The most common commute times in Grass Range are 60 to 89 minutes (9 commuters, 47.4%) for males and 5 to 9 minutes (11 commuters, 45.8%) for females.
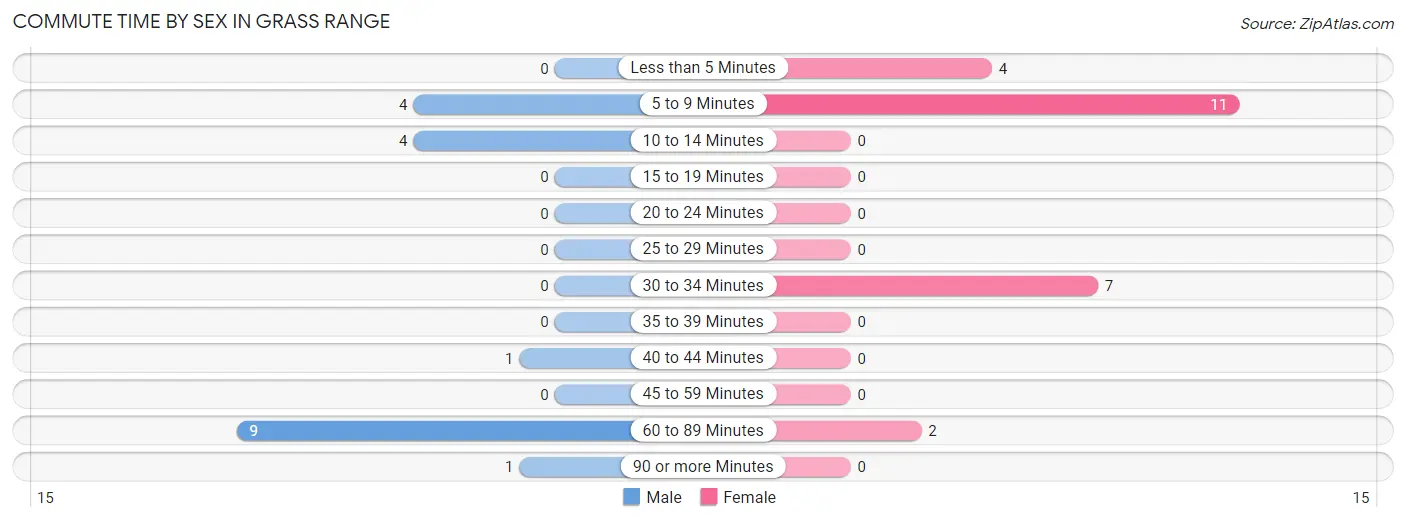
| Commute Time | Male | Female |
| Less than 5 Minutes | 0 (0.0%) | 4 (16.7%) |
| 5 to 9 Minutes | 4 (21.0%) | 11 (45.8%) |
| 10 to 14 Minutes | 4 (21.0%) | 0 (0.0%) |
| 15 to 19 Minutes | 0 (0.0%) | 0 (0.0%) |
| 20 to 24 Minutes | 0 (0.0%) | 0 (0.0%) |
| 25 to 29 Minutes | 0 (0.0%) | 0 (0.0%) |
| 30 to 34 Minutes | 0 (0.0%) | 7 (29.2%) |
| 35 to 39 Minutes | 0 (0.0%) | 0 (0.0%) |
| 40 to 44 Minutes | 1 (5.3%) | 0 (0.0%) |
| 45 to 59 Minutes | 0 (0.0%) | 0 (0.0%) |
| 60 to 89 Minutes | 9 (47.4%) | 2 (8.3%) |
| 90 or more Minutes | 1 (5.3%) | 0 (0.0%) |
Time of Departure to Work by Sex in Grass Range
The most frequent times of departure to work in Grass Range are 4:00 PM to 11:59 PM (9, 47.4%) for males and 7:30 AM to 7:59 AM (6, 25.0%) for females.
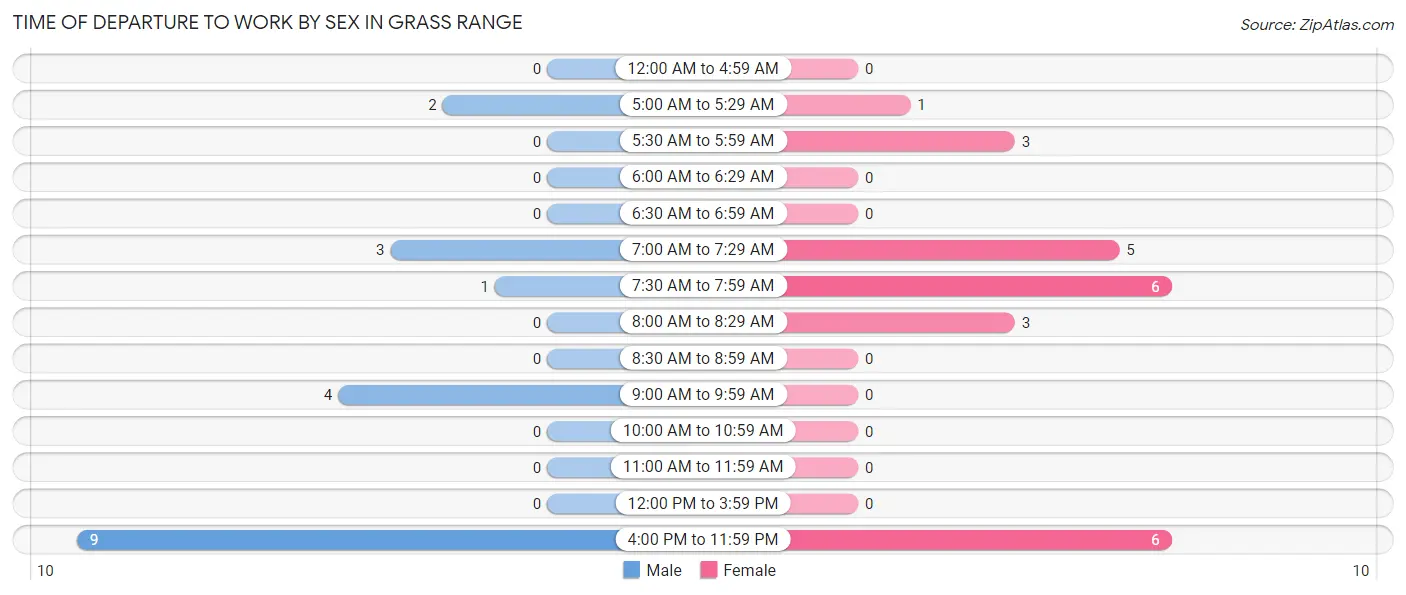
| Time of Departure | Male | Female |
| 12:00 AM to 4:59 AM | 0 (0.0%) | 0 (0.0%) |
| 5:00 AM to 5:29 AM | 2 (10.5%) | 1 (4.2%) |
| 5:30 AM to 5:59 AM | 0 (0.0%) | 3 (12.5%) |
| 6:00 AM to 6:29 AM | 0 (0.0%) | 0 (0.0%) |
| 6:30 AM to 6:59 AM | 0 (0.0%) | 0 (0.0%) |
| 7:00 AM to 7:29 AM | 3 (15.8%) | 5 (20.8%) |
| 7:30 AM to 7:59 AM | 1 (5.3%) | 6 (25.0%) |
| 8:00 AM to 8:29 AM | 0 (0.0%) | 3 (12.5%) |
| 8:30 AM to 8:59 AM | 0 (0.0%) | 0 (0.0%) |
| 9:00 AM to 9:59 AM | 4 (21.0%) | 0 (0.0%) |
| 10:00 AM to 10:59 AM | 0 (0.0%) | 0 (0.0%) |
| 11:00 AM to 11:59 AM | 0 (0.0%) | 0 (0.0%) |
| 12:00 PM to 3:59 PM | 0 (0.0%) | 0 (0.0%) |
| 4:00 PM to 11:59 PM | 9 (47.4%) | 6 (25.0%) |
| Total | 19 (100.0%) | 24 (100.0%) |
Housing Occupancy in Grass Range
Occupancy by Ownership in Grass Range
Of the total 74 dwellings in Grass Range, owner-occupied units account for 62 (83.8%), while renter-occupied units make up 12 (16.2%).
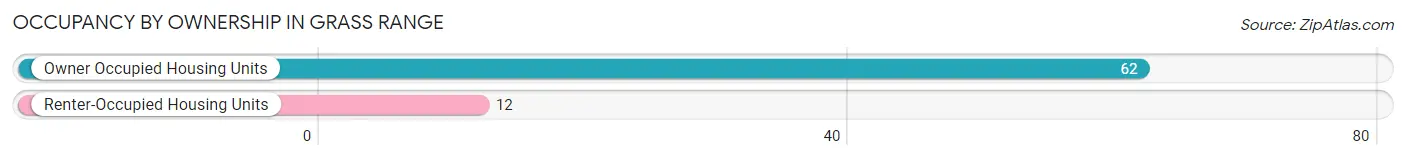
| Occupancy | # Housing Units | % Housing Units |
| Owner Occupied Housing Units | 62 | 83.8% |
| Renter-Occupied Housing Units | 12 | 16.2% |
| Total Occupied Housing Units | 74 | 100.0% |
Occupancy by Household Size in Grass Range
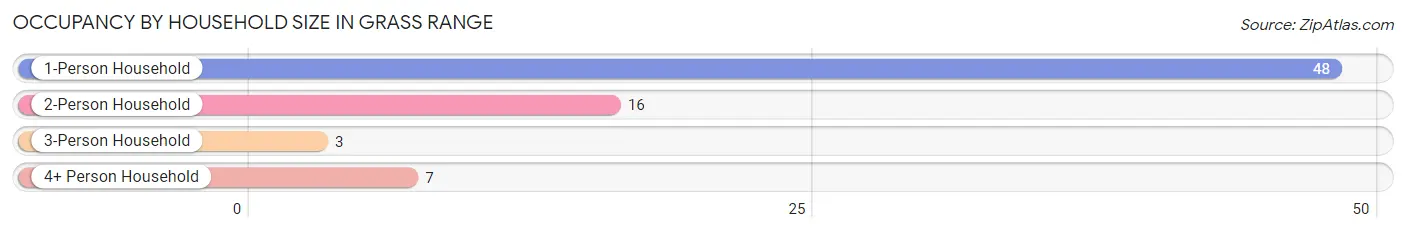
| Household Size | # Housing Units | % Housing Units |
| 1-Person Household | 48 | 64.9% |
| 2-Person Household | 16 | 21.6% |
| 3-Person Household | 3 | 4.1% |
| 4+ Person Household | 7 | 9.5% |
| Total Housing Units | 74 | 100.0% |
Occupancy by Ownership by Household Size in Grass Range
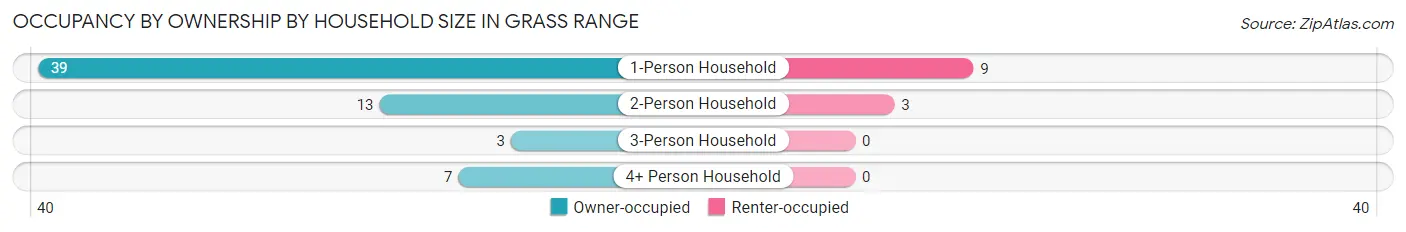
| Household Size | Owner-occupied | Renter-occupied |
| 1-Person Household | 39 (81.2%) | 9 (18.8%) |
| 2-Person Household | 13 (81.2%) | 3 (18.8%) |
| 3-Person Household | 3 (100.0%) | 0 (0.0%) |
| 4+ Person Household | 7 (100.0%) | 0 (0.0%) |
| Total Housing Units | 62 (83.8%) | 12 (16.2%) |
Occupancy by Educational Attainment in Grass Range
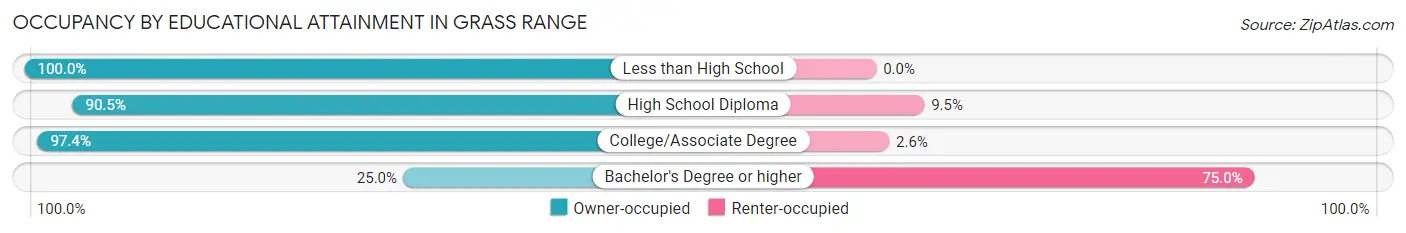
| Household Size | Owner-occupied | Renter-occupied |
| Less than High School | 2 (100.0%) | 0 (0.0%) |
| High School Diploma | 19 (90.5%) | 2 (9.5%) |
| College/Associate Degree | 38 (97.4%) | 1 (2.6%) |
| Bachelor's Degree or higher | 3 (25.0%) | 9 (75.0%) |
Occupancy by Age of Householder in Grass Range
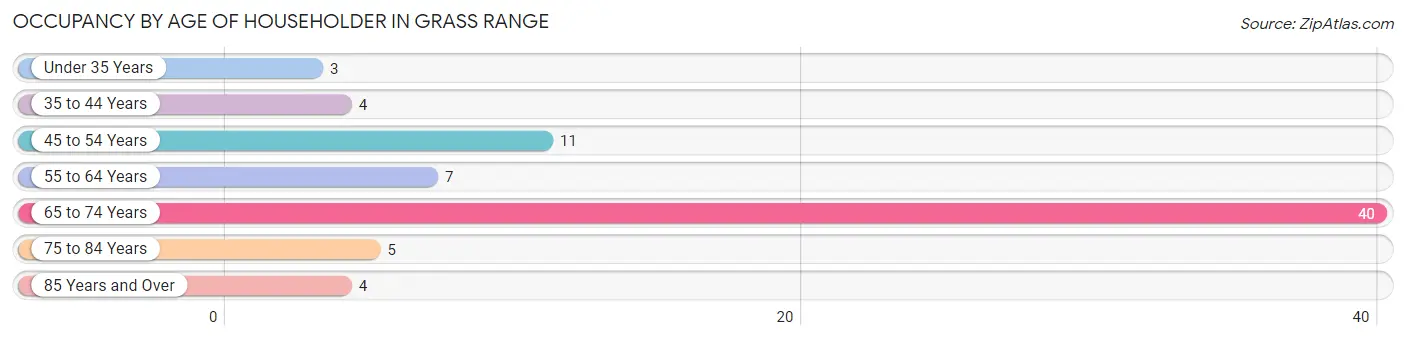
| Age Bracket | # Households | % Households |
| Under 35 Years | 3 | 4.1% |
| 35 to 44 Years | 4 | 5.4% |
| 45 to 54 Years | 11 | 14.9% |
| 55 to 64 Years | 7 | 9.5% |
| 65 to 74 Years | 40 | 54.0% |
| 75 to 84 Years | 5 | 6.8% |
| 85 Years and Over | 4 | 5.4% |
| Total | 74 | 100.0% |
Housing Finances in Grass Range
Median Income by Occupancy in Grass Range
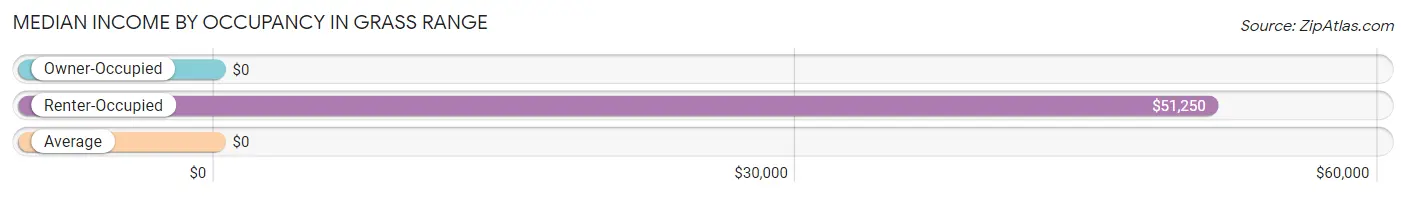
| Occupancy Type | # Households | Median Income |
| Owner-Occupied | 62 (83.8%) | $0 |
| Renter-Occupied | 12 (16.2%) | $51,250 |
| Average | 74 (100.0%) | $0 |
Occupancy by Householder Income Bracket in Grass Range
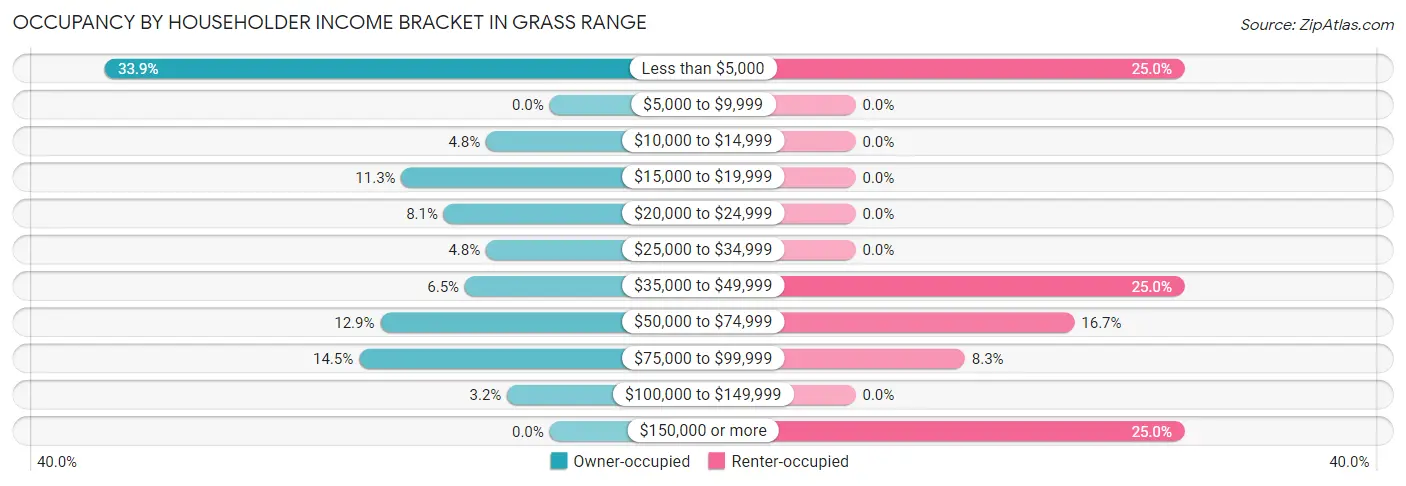
| Income Bracket | Owner-occupied | Renter-occupied |
| Less than $5,000 | 21 (33.9%) | 3 (25.0%) |
| $5,000 to $9,999 | 0 (0.0%) | 0 (0.0%) |
| $10,000 to $14,999 | 3 (4.8%) | 0 (0.0%) |
| $15,000 to $19,999 | 7 (11.3%) | 0 (0.0%) |
| $20,000 to $24,999 | 5 (8.1%) | 0 (0.0%) |
| $25,000 to $34,999 | 3 (4.8%) | 0 (0.0%) |
| $35,000 to $49,999 | 4 (6.5%) | 3 (25.0%) |
| $50,000 to $74,999 | 8 (12.9%) | 2 (16.7%) |
| $75,000 to $99,999 | 9 (14.5%) | 1 (8.3%) |
| $100,000 to $149,999 | 2 (3.2%) | 0 (0.0%) |
| $150,000 or more | 0 (0.0%) | 3 (25.0%) |
| Total | 62 (100.0%) | 12 (100.0%) |
Monthly Housing Cost Tiers in Grass Range
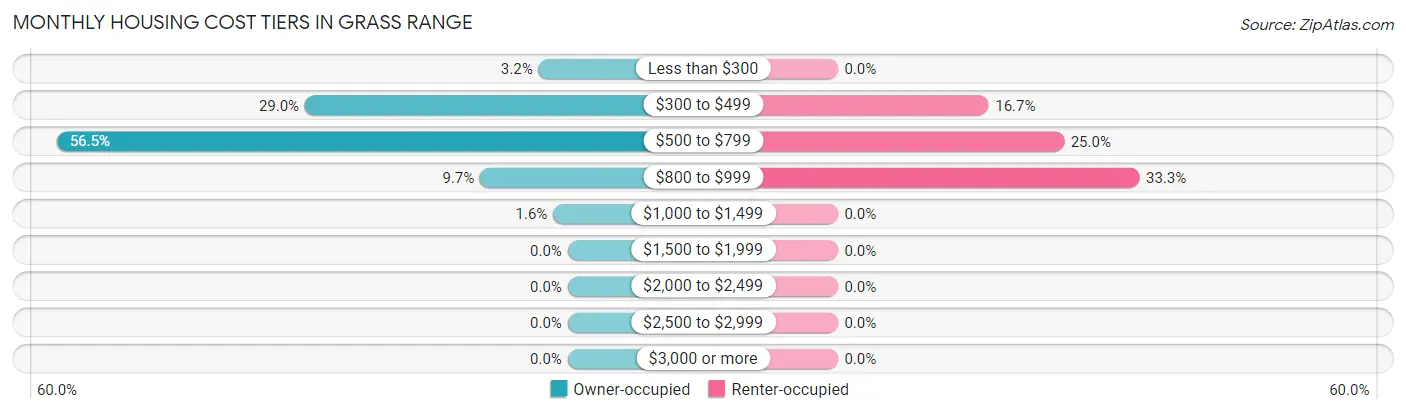
| Monthly Cost | Owner-occupied | Renter-occupied |
| Less than $300 | 2 (3.2%) | 0 (0.0%) |
| $300 to $499 | 18 (29.0%) | 2 (16.7%) |
| $500 to $799 | 35 (56.5%) | 3 (25.0%) |
| $800 to $999 | 6 (9.7%) | 4 (33.3%) |
| $1,000 to $1,499 | 1 (1.6%) | 0 (0.0%) |
| $1,500 to $1,999 | 0 (0.0%) | 0 (0.0%) |
| $2,000 to $2,499 | 0 (0.0%) | 0 (0.0%) |
| $2,500 to $2,999 | 0 (0.0%) | 0 (0.0%) |
| $3,000 or more | 0 (0.0%) | 0 (0.0%) |
| Total | 62 (100.0%) | 12 (100.0%) |
Physical Housing Characteristics in Grass Range
Housing Structures in Grass Range
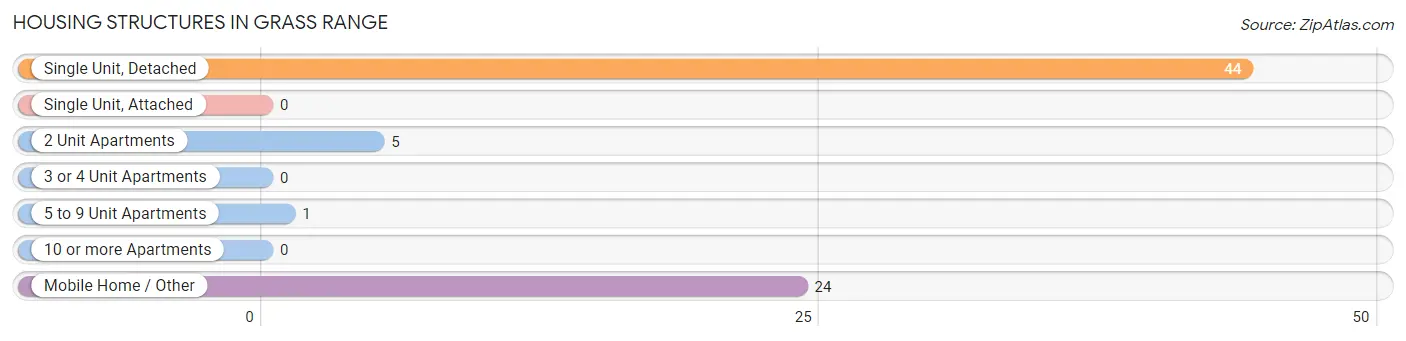
| Structure Type | # Housing Units | % Housing Units |
| Single Unit, Detached | 44 | 59.5% |
| Single Unit, Attached | 0 | 0.0% |
| 2 Unit Apartments | 5 | 6.8% |
| 3 or 4 Unit Apartments | 0 | 0.0% |
| 5 to 9 Unit Apartments | 1 | 1.3% |
| 10 or more Apartments | 0 | 0.0% |
| Mobile Home / Other | 24 | 32.4% |
| Total | 74 | 100.0% |
Housing Structures by Occupancy in Grass Range
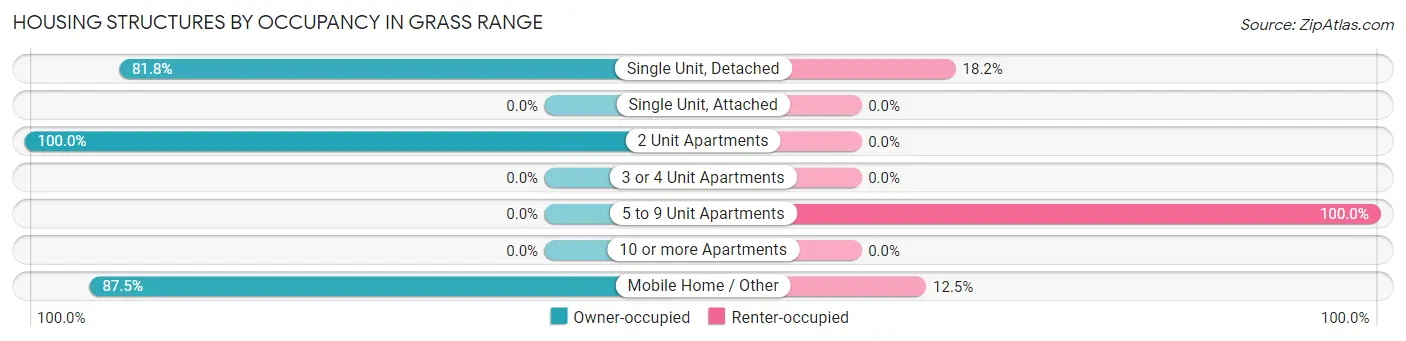
| Structure Type | Owner-occupied | Renter-occupied |
| Single Unit, Detached | 36 (81.8%) | 8 (18.2%) |
| Single Unit, Attached | 0 (0.0%) | 0 (0.0%) |
| 2 Unit Apartments | 5 (100.0%) | 0 (0.0%) |
| 3 or 4 Unit Apartments | 0 (0.0%) | 0 (0.0%) |
| 5 to 9 Unit Apartments | 0 (0.0%) | 1 (100.0%) |
| 10 or more Apartments | 0 (0.0%) | 0 (0.0%) |
| Mobile Home / Other | 21 (87.5%) | 3 (12.5%) |
| Total | 62 (83.8%) | 12 (16.2%) |
Housing Structures by Number of Rooms in Grass Range
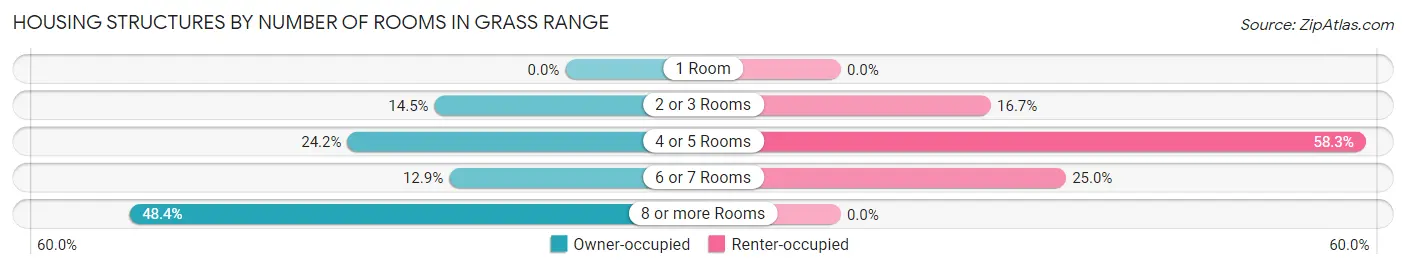
| Number of Rooms | Owner-occupied | Renter-occupied |
| 1 Room | 0 (0.0%) | 0 (0.0%) |
| 2 or 3 Rooms | 9 (14.5%) | 2 (16.7%) |
| 4 or 5 Rooms | 15 (24.2%) | 7 (58.3%) |
| 6 or 7 Rooms | 8 (12.9%) | 3 (25.0%) |
| 8 or more Rooms | 30 (48.4%) | 0 (0.0%) |
| Total | 62 (100.0%) | 12 (100.0%) |
Housing Structure by Heating Type in Grass Range
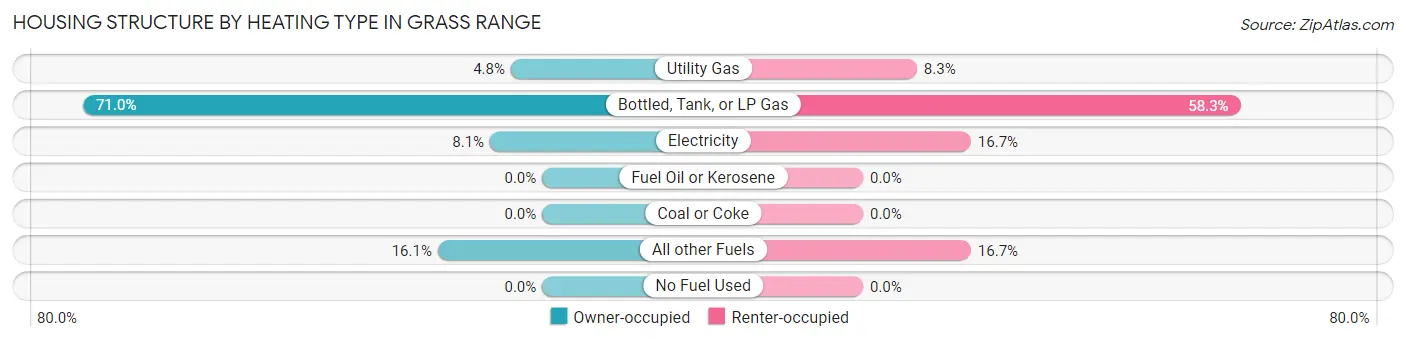
| Heating Type | Owner-occupied | Renter-occupied |
| Utility Gas | 3 (4.8%) | 1 (8.3%) |
| Bottled, Tank, or LP Gas | 44 (71.0%) | 7 (58.3%) |
| Electricity | 5 (8.1%) | 2 (16.7%) |
| Fuel Oil or Kerosene | 0 (0.0%) | 0 (0.0%) |
| Coal or Coke | 0 (0.0%) | 0 (0.0%) |
| All other Fuels | 10 (16.1%) | 2 (16.7%) |
| No Fuel Used | 0 (0.0%) | 0 (0.0%) |
| Total | 62 (100.0%) | 12 (100.0%) |
Household Vehicle Usage in Grass Range
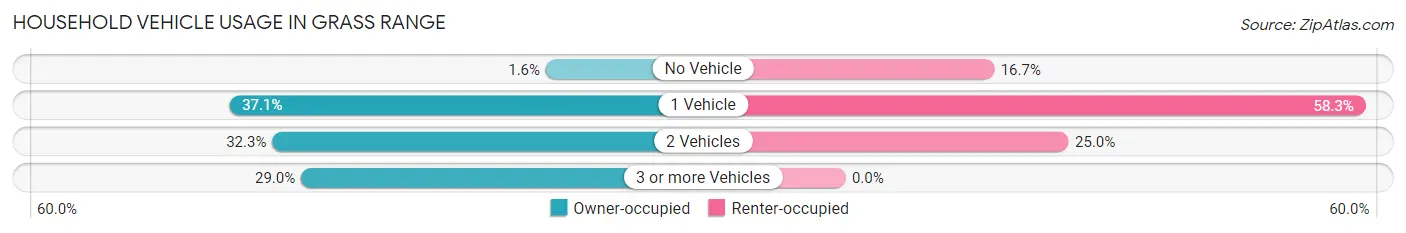
| Vehicles per Household | Owner-occupied | Renter-occupied |
| No Vehicle | 1 (1.6%) | 2 (16.7%) |
| 1 Vehicle | 23 (37.1%) | 7 (58.3%) |
| 2 Vehicles | 20 (32.3%) | 3 (25.0%) |
| 3 or more Vehicles | 18 (29.0%) | 0 (0.0%) |
| Total | 62 (100.0%) | 12 (100.0%) |
Real Estate & Mortgages in Grass Range
Real Estate and Mortgage Overview in Grass Range
| Characteristic | Without Mortgage | With Mortgage |
| Housing Units | 57 | 5 |
| Median Property Value | - | - |
| Median Household Income | - | - |
| Monthly Housing Costs | $529 | $0 |
| Real Estate Taxes | $1,129 | $0 |
Property Value by Mortgage Status in Grass Range
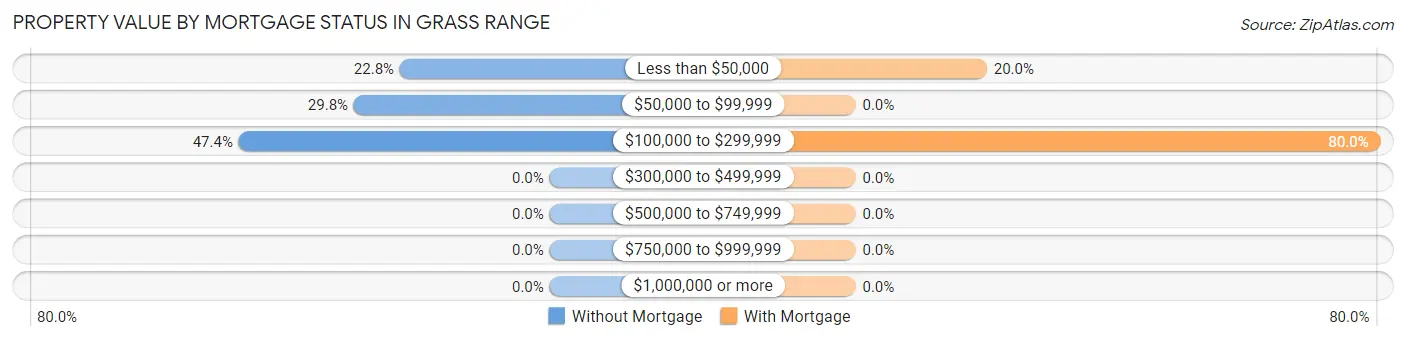
| Property Value | Without Mortgage | With Mortgage |
| Less than $50,000 | 13 (22.8%) | 1 (20.0%) |
| $50,000 to $99,999 | 17 (29.8%) | 0 (0.0%) |
| $100,000 to $299,999 | 27 (47.4%) | 4 (80.0%) |
| $300,000 to $499,999 | 0 (0.0%) | 0 (0.0%) |
| $500,000 to $749,999 | 0 (0.0%) | 0 (0.0%) |
| $750,000 to $999,999 | 0 (0.0%) | 0 (0.0%) |
| $1,000,000 or more | 0 (0.0%) | 0 (0.0%) |
| Total | 57 (100.0%) | 5 (100.0%) |
Household Income by Mortgage Status in Grass Range
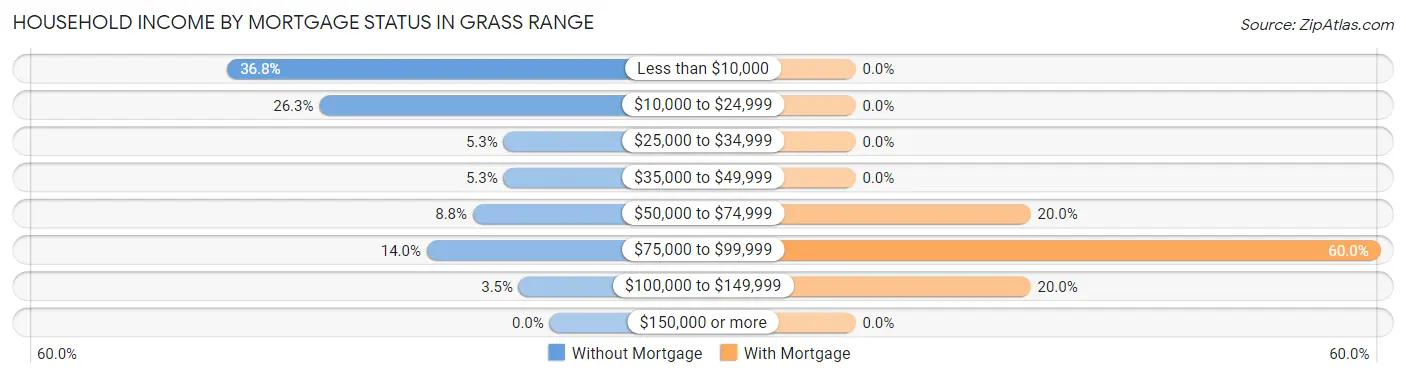
| Household Income | Without Mortgage | With Mortgage |
| Less than $10,000 | 21 (36.8%) | 0 (0.0%) |
| $10,000 to $24,999 | 15 (26.3%) | 0 (0.0%) |
| $25,000 to $34,999 | 3 (5.3%) | 0 (0.0%) |
| $35,000 to $49,999 | 3 (5.3%) | 0 (0.0%) |
| $50,000 to $74,999 | 5 (8.8%) | 1 (20.0%) |
| $75,000 to $99,999 | 8 (14.0%) | 3 (60.0%) |
| $100,000 to $149,999 | 2 (3.5%) | 1 (20.0%) |
| $150,000 or more | 0 (0.0%) | 0 (0.0%) |
| Total | 57 (100.0%) | 5 (100.0%) |
Property Value to Household Income Ratio in Grass Range
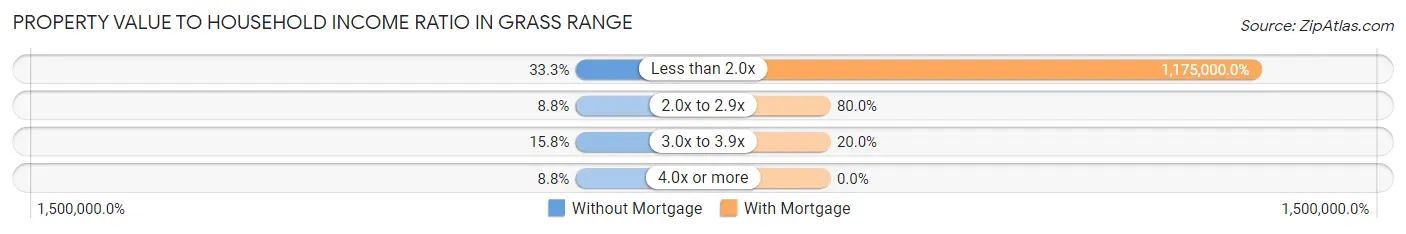
| Value-to-Income Ratio | Without Mortgage | With Mortgage |
| Less than 2.0x | 19 (33.3%) | 58,750 (1,175,000.0%) |
| 2.0x to 2.9x | 5 (8.8%) | 4 (80.0%) |
| 3.0x to 3.9x | 9 (15.8%) | 1 (20.0%) |
| 4.0x or more | 5 (8.8%) | 0 (0.0%) |
| Total | 57 (100.0%) | 5 (100.0%) |
Real Estate Taxes by Mortgage Status in Grass Range
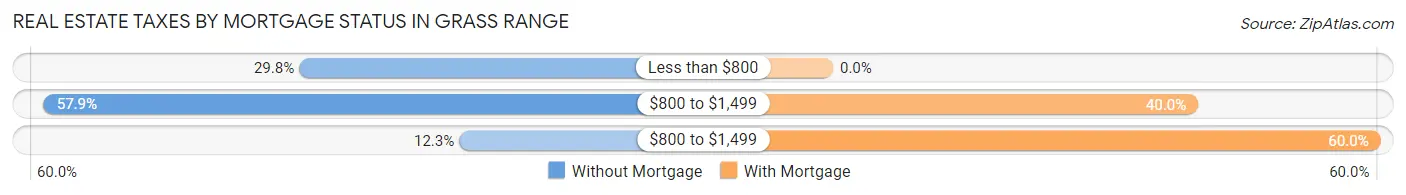
| Property Taxes | Without Mortgage | With Mortgage |
| Less than $800 | 17 (29.8%) | 0 (0.0%) |
| $800 to $1,499 | 33 (57.9%) | 2 (40.0%) |
| $800 to $1,499 | 7 (12.3%) | 3 (60.0%) |
| Total | 57 (100.0%) | 5 (100.0%) |
Health & Disability in Grass Range
Health Insurance Coverage by Age in Grass Range
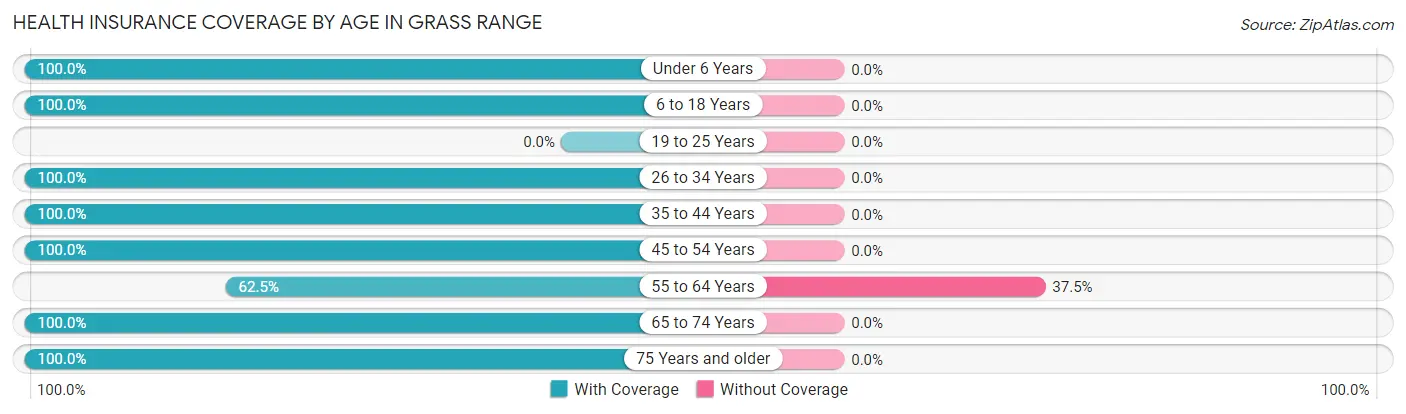
| Age Bracket | With Coverage | Without Coverage |
| Under 6 Years | 4 (100.0%) | 0 (0.0%) |
| 6 to 18 Years | 7 (100.0%) | 0 (0.0%) |
| 19 to 25 Years | 0 (0.0%) | 0 (0.0%) |
| 26 to 34 Years | 3 (100.0%) | 0 (0.0%) |
| 35 to 44 Years | 17 (100.0%) | 0 (0.0%) |
| 45 to 54 Years | 14 (100.0%) | 0 (0.0%) |
| 55 to 64 Years | 5 (62.5%) | 3 (37.5%) |
| 65 to 74 Years | 45 (100.0%) | 0 (0.0%) |
| 75 Years and older | 13 (100.0%) | 0 (0.0%) |
| Total | 108 (97.3%) | 3 (2.7%) |
Health Insurance Coverage by Citizenship Status in Grass Range
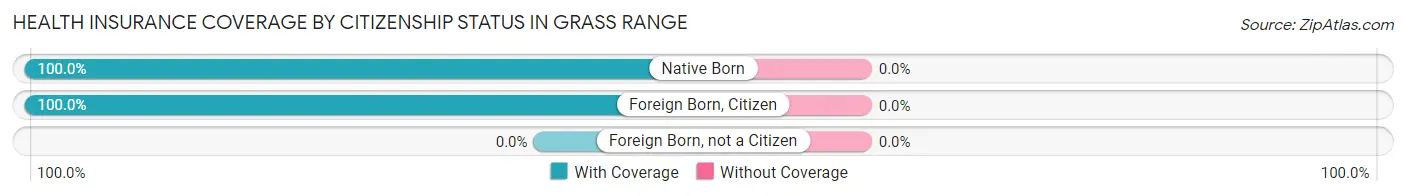
| Citizenship Status | With Coverage | Without Coverage |
| Native Born | 4 (100.0%) | 0 (0.0%) |
| Foreign Born, Citizen | 7 (100.0%) | 0 (0.0%) |
| Foreign Born, not a Citizen | 0 (0.0%) | 0 (0.0%) |
Health Insurance Coverage by Household Income in Grass Range
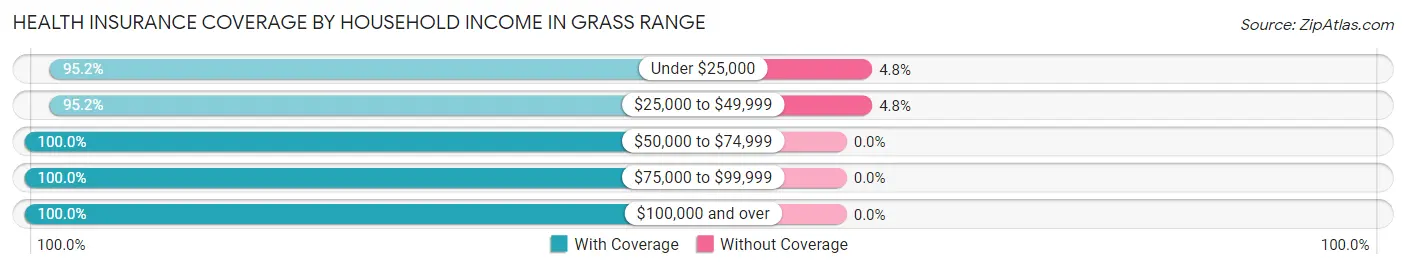
| Household Income | With Coverage | Without Coverage |
| Under $25,000 | 40 (95.2%) | 2 (4.8%) |
| $25,000 to $49,999 | 20 (95.2%) | 1 (4.8%) |
| $50,000 to $74,999 | 20 (100.0%) | 0 (0.0%) |
| $75,000 to $99,999 | 17 (100.0%) | 0 (0.0%) |
| $100,000 and over | 11 (100.0%) | 0 (0.0%) |
Public vs Private Health Insurance Coverage by Age in Grass Range
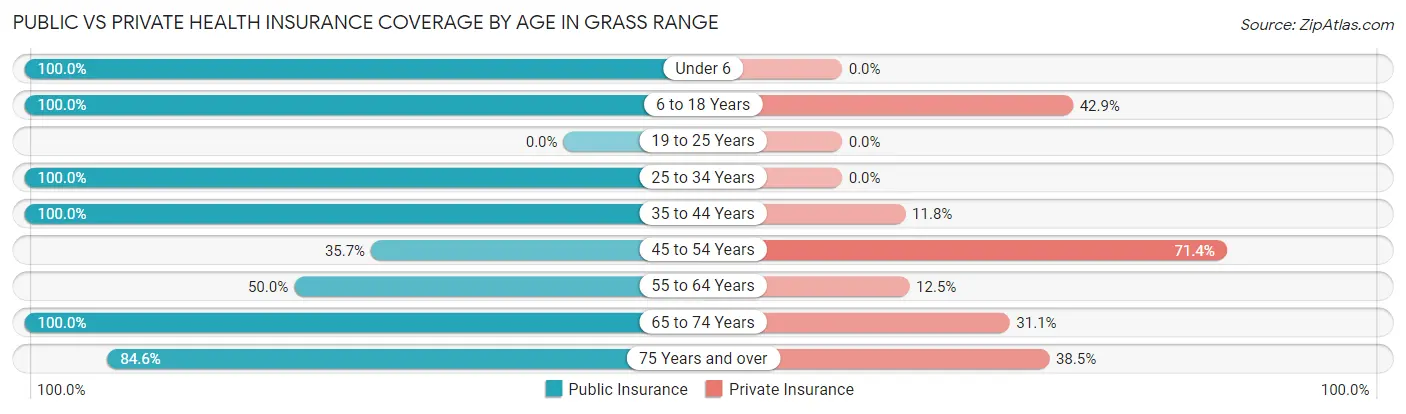
| Age Bracket | Public Insurance | Private Insurance |
| Under 6 | 4 (100.0%) | 0 (0.0%) |
| 6 to 18 Years | 7 (100.0%) | 3 (42.9%) |
| 19 to 25 Years | 0 (0.0%) | 0 (0.0%) |
| 25 to 34 Years | 3 (100.0%) | 0 (0.0%) |
| 35 to 44 Years | 17 (100.0%) | 2 (11.8%) |
| 45 to 54 Years | 5 (35.7%) | 10 (71.4%) |
| 55 to 64 Years | 4 (50.0%) | 1 (12.5%) |
| 65 to 74 Years | 45 (100.0%) | 14 (31.1%) |
| 75 Years and over | 11 (84.6%) | 5 (38.5%) |
| Total | 96 (86.5%) | 35 (31.5%) |
Disability Status by Sex by Age in Grass Range
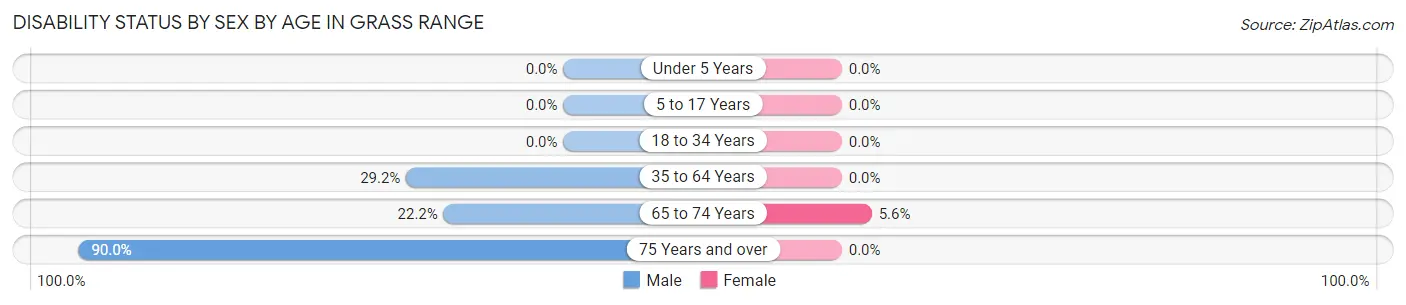
| Age Bracket | Male | Female |
| Under 5 Years | 0 (0.0%) | 0 (0.0%) |
| 5 to 17 Years | 0 (0.0%) | 0 (0.0%) |
| 18 to 34 Years | 0 (0.0%) | 0 (0.0%) |
| 35 to 64 Years | 7 (29.2%) | 0 (0.0%) |
| 65 to 74 Years | 2 (22.2%) | 2 (5.6%) |
| 75 Years and over | 9 (90.0%) | 0 (0.0%) |
Disability Class by Sex by Age in Grass Range
Disability Class: Hearing Difficulty
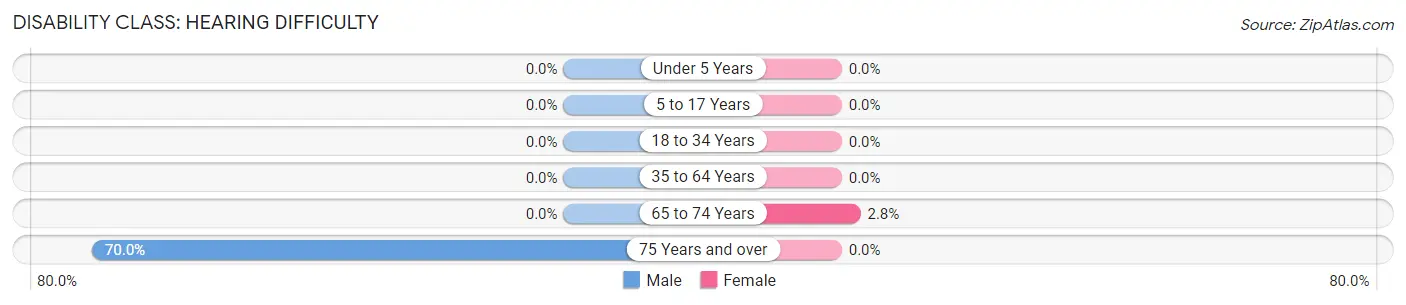
| Age Bracket | Male | Female |
| Under 5 Years | 0 (0.0%) | 0 (0.0%) |
| 5 to 17 Years | 0 (0.0%) | 0 (0.0%) |
| 18 to 34 Years | 0 (0.0%) | 0 (0.0%) |
| 35 to 64 Years | 0 (0.0%) | 0 (0.0%) |
| 65 to 74 Years | 0 (0.0%) | 1 (2.8%) |
| 75 Years and over | 7 (70.0%) | 0 (0.0%) |
Disability Class: Vision Difficulty
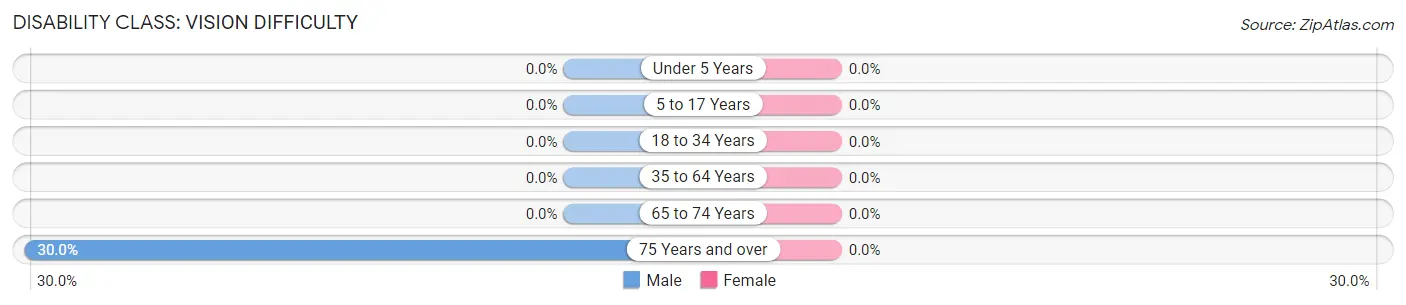
| Age Bracket | Male | Female |
| Under 5 Years | 0 (0.0%) | 0 (0.0%) |
| 5 to 17 Years | 0 (0.0%) | 0 (0.0%) |
| 18 to 34 Years | 0 (0.0%) | 0 (0.0%) |
| 35 to 64 Years | 0 (0.0%) | 0 (0.0%) |
| 65 to 74 Years | 0 (0.0%) | 0 (0.0%) |
| 75 Years and over | 3 (30.0%) | 0 (0.0%) |
Disability Class: Cognitive Difficulty
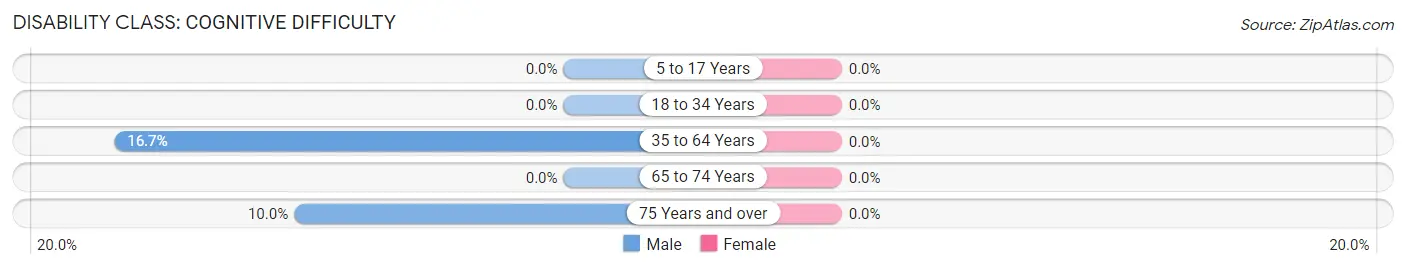
| Age Bracket | Male | Female |
| 5 to 17 Years | 0 (0.0%) | 0 (0.0%) |
| 18 to 34 Years | 0 (0.0%) | 0 (0.0%) |
| 35 to 64 Years | 4 (16.7%) | 0 (0.0%) |
| 65 to 74 Years | 0 (0.0%) | 0 (0.0%) |
| 75 Years and over | 1 (10.0%) | 0 (0.0%) |
Disability Class: Ambulatory Difficulty
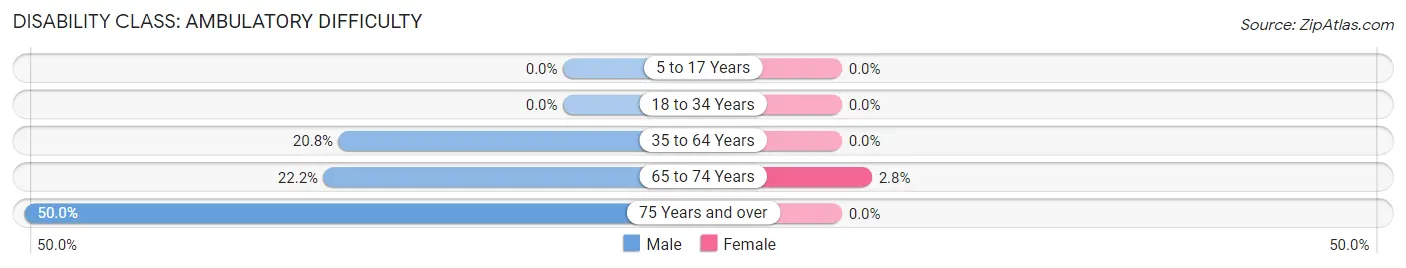
| Age Bracket | Male | Female |
| 5 to 17 Years | 0 (0.0%) | 0 (0.0%) |
| 18 to 34 Years | 0 (0.0%) | 0 (0.0%) |
| 35 to 64 Years | 5 (20.8%) | 0 (0.0%) |
| 65 to 74 Years | 2 (22.2%) | 1 (2.8%) |
| 75 Years and over | 5 (50.0%) | 0 (0.0%) |
Disability Class: Self-Care Difficulty
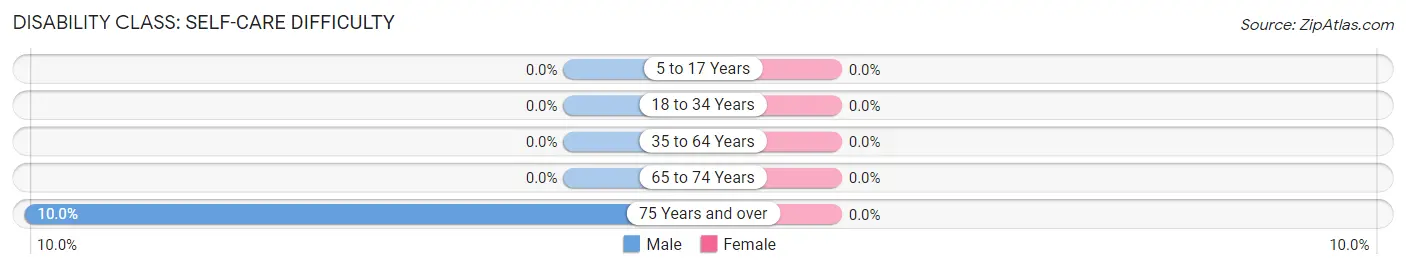
| Age Bracket | Male | Female |
| 5 to 17 Years | 0 (0.0%) | 0 (0.0%) |
| 18 to 34 Years | 0 (0.0%) | 0 (0.0%) |
| 35 to 64 Years | 0 (0.0%) | 0 (0.0%) |
| 65 to 74 Years | 0 (0.0%) | 0 (0.0%) |
| 75 Years and over | 1 (10.0%) | 0 (0.0%) |
Technology Access in Grass Range
Computing Device Access in Grass Range
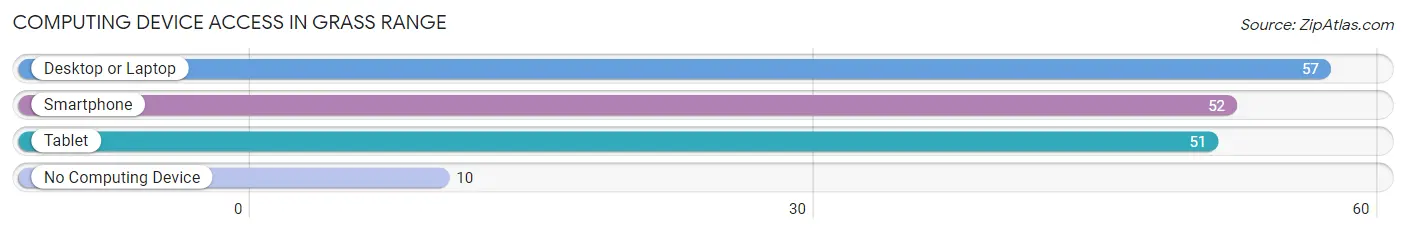
| Device Type | # Households | % Households |
| Desktop or Laptop | 57 | 77.0% |
| Smartphone | 52 | 70.3% |
| Tablet | 51 | 68.9% |
| No Computing Device | 10 | 13.5% |
| Total | 74 | 100.0% |
Internet Access in Grass Range
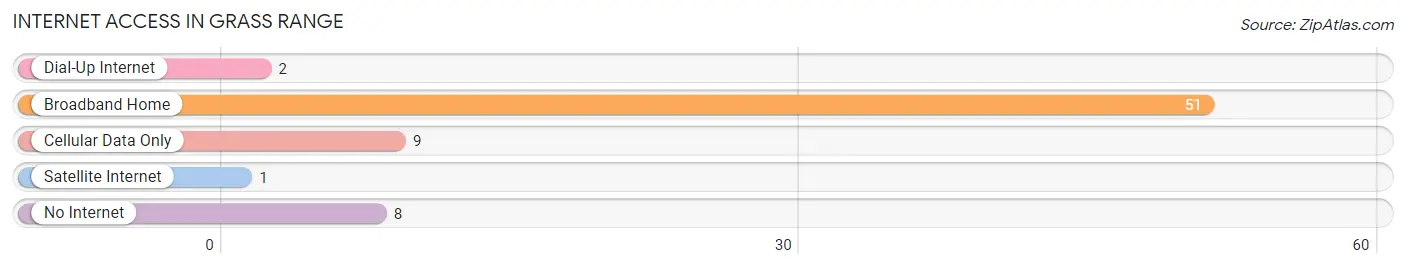
| Internet Type | # Households | % Households |
| Dial-Up Internet | 2 | 2.7% |
| Broadband Home | 51 | 68.9% |
| Cellular Data Only | 9 | 12.2% |
| Satellite Internet | 1 | 1.3% |
| No Internet | 8 | 10.8% |
| Total | 74 | 100.0% |
Grass Range Summary
Grass Range is a small town located in Fergus County, Montana. It is situated in the foothills of the Little Belt Mountains, approximately 40 miles south of Lewistown. The town was founded in 1883 and was named after the grassy range land that surrounded it. The population of Grass Range was estimated to be around 200 people in 2000.
Geography
Grass Range is located in the foothills of the Little Belt Mountains, approximately 40 miles south of Lewistown. The town is situated in a valley surrounded by rolling hills and grassy plains. The area is known for its wide open spaces and beautiful scenery. The climate in Grass Range is semi-arid, with hot summers and cold winters. The average annual precipitation is around 12 inches.
Economy
Grass Range’s economy is largely based on agriculture and ranching. The town is home to several large ranches, including the historic Grass Range Ranch, which was established in 1883. The ranch is still in operation today and is one of the largest in the area. Other local businesses include a grocery store, a hardware store, a gas station, and a few restaurants.
Demographics
The population of Grass Range was estimated to be around 200 people in 2000. The majority of the population is white (97.5%), with a small percentage of Native Americans (2.5%). The median household income in Grass Range is $31,250, and the median age is 44. The town is served by the Grass Range School District, which includes a K-12 school.
Conclusion
Grass Range is a small town located in Fergus County, Montana. It is situated in the foothills of the Little Belt Mountains, approximately 40 miles south of Lewistown. The town was founded in 1883 and was named after the grassy range land that surrounded it. The population of Grass Range was estimated to be around 200 people in 2000. The economy of Grass Range is largely based on agriculture and ranching, and the majority of the population is white. The median household income in Grass Range is $31,250, and the median age is 44. The town is served by the Grass Range School District, which includes a K-12 school.
Common Questions
What is Per Capita Income in Grass Range?
Per Capita income in Grass Range is $23,904.
What is the Median Family Income in Grass Range?
Median Family Income in Grass Range is $75,208.
What is Income or Wage Gap in Grass Range?
Income or Wage Gap in Grass Range is 5.2%.
Women in Grass Range earn 94.8 cents for every dollar earned by a man.
What is Inequality or Gini Index in Grass Range?
Inequality or Gini Index in Grass Range is 0.58.
What is the Total Population of Grass Range?
Total Population of Grass Range is 111.
What is the Total Male Population of Grass Range?
Total Male Population of Grass Range is 46.
What is the Total Female Population of Grass Range?
Total Female Population of Grass Range is 65.
What is the Ratio of Males per 100 Females in Grass Range?
There are 70.77 Males per 100 Females in Grass Range.
What is the Ratio of Females per 100 Males in Grass Range?
There are 141.30 Females per 100 Males in Grass Range.
What is the Median Population Age in Grass Range?
Median Population Age in Grass Range is 68.4 Years.
What is the Average Family Size in Grass Range
Average Family Size in Grass Range is 2.4 People.
What is the Average Household Size in Grass Range
Average Household Size in Grass Range is 1.5 People.
How Large is the Labor Force in Grass Range?
There are 46 People in the Labor Forcein in Grass Range.
What is the Percentage of People in the Labor Force in Grass Range?
46.0% of People are in the Labor Force in Grass Range.