Zip Codes with the Highest Percentage of Population Employed in Real Estate, Rental & Leasing in Montana
RELATED REPORTS & OPTIONS
Real Estate, Rental & Leasing
Montana
Compare Zip Codes
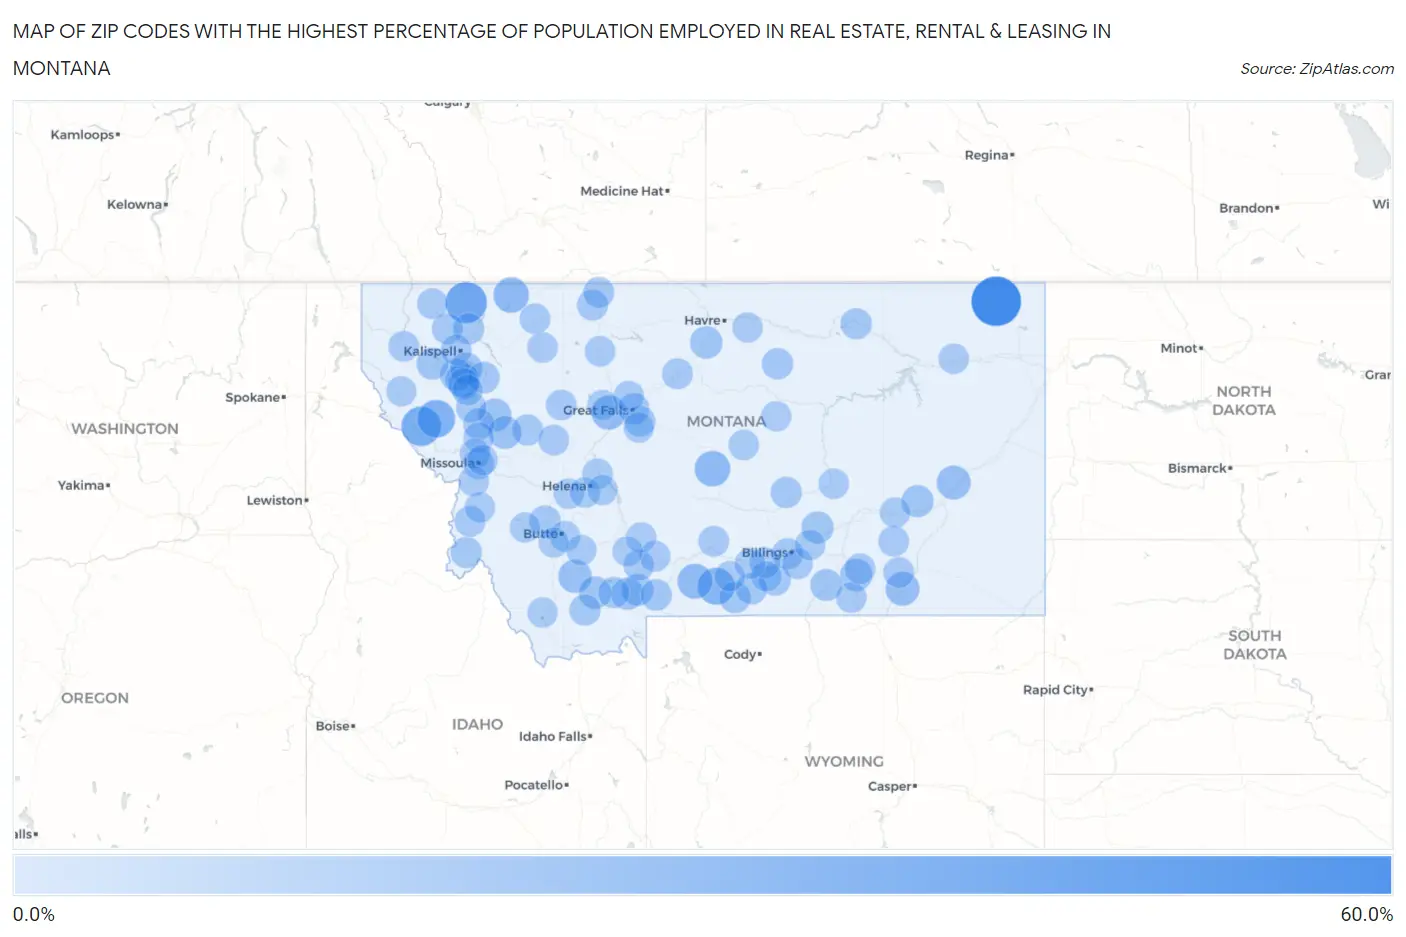
Map of Zip Codes with the Highest Percentage of Population Employed in Real Estate, Rental & Leasing in Montana
0.0%
60.0%
Zip Codes with the Highest Percentage of Population Employed in Real Estate, Rental & Leasing in Montana
| Zip Code | % Employed | vs State | vs National | |
| 1. | 59257 | 53.8% | 1.8%(+52.0)#1 | 1.9%(+52.0)#10 |
| 2. | 59928 | 31.0% | 1.8%(+29.2)#2 | 1.9%(+29.1)#41 |
| 3. | 59866 | 25.5% | 1.8%(+23.7)#3 | 1.9%(+23.6)#70 |
| 4. | 59856 | 20.8% | 1.8%(+19.0)#4 | 1.9%(+18.9)#102 |
| 5. | 59061 | 18.8% | 1.8%(+16.9)#5 | 1.9%(+16.9)#116 |
| 6. | 59418 | 15.2% | 1.8%(+13.3)#6 | 1.9%(+13.3)#168 |
| 7. | 59411 | 14.8% | 1.8%(+13.0)#7 | 1.9%(+12.9)#178 |
| 8. | 59052 | 14.1% | 1.8%(+12.3)#8 | 1.9%(+12.2)#195 |
| 9. | 59483 | 12.1% | 1.8%(+10.3)#9 | 1.9%(+10.2)#259 |
| 10. | 59012 | 10.7% | 1.8%(+8.88)#10 | 1.9%(+8.82)#325 |
| 11. | 59338 | 10.7% | 1.8%(+8.83)#11 | 1.9%(+8.77)#332 |
| 12. | 59914 | 10.3% | 1.8%(+8.46)#12 | 1.9%(+8.40)#357 |
| 13. | 59754 | 9.5% | 1.8%(+7.63)#13 | 1.9%(+7.57)#426 |
| 14. | 59826 | 7.9% | 1.8%(+6.09)#14 | 1.9%(+6.03)#566 |
| 15. | 59868 | 7.8% | 1.8%(+6.00)#15 | 1.9%(+5.95)#578 |
| 16. | 59031 | 6.9% | 1.8%(+5.06)#16 | 1.9%(+5.00)#746 |
| 17. | 59521 | 6.8% | 1.8%(+4.92)#17 | 1.9%(+4.86)#775 |
| 18. | 59929 | 6.7% | 1.8%(+4.83)#18 | 1.9%(+4.77)#791 |
| 19. | 59922 | 6.6% | 1.8%(+4.80)#19 | 1.9%(+4.74)#798 |
| 20. | 59755 | 6.6% | 1.8%(+4.72)#20 | 1.9%(+4.67)#808 |
| 21. | 59716 | 6.3% | 1.8%(+4.50)#21 | 1.9%(+4.44)#876 |
| 22. | 59347 | 5.9% | 1.8%(+4.08)#22 | 1.9%(+4.02)#1,006 |
| 23. | 59088 | 5.9% | 1.8%(+4.08)#23 | 1.9%(+4.02)#1,007 |
| 24. | 59730 | 5.5% | 1.8%(+3.66)#24 | 1.9%(+3.60)#1,151 |
| 25. | 59925 | 5.5% | 1.8%(+3.63)#25 | 1.9%(+3.57)#1,165 |
| 26. | 59075 | 5.3% | 1.8%(+3.43)#26 | 1.9%(+3.37)#1,265 |
| 27. | 59911 | 4.8% | 1.8%(+2.96)#27 | 1.9%(+2.90)#1,511 |
| 28. | 59756 | 4.5% | 1.8%(+2.71)#28 | 1.9%(+2.65)#1,682 |
| 29. | 59026 | 4.3% | 1.8%(+2.51)#29 | 1.9%(+2.46)#1,834 |
| 30. | 59027 | 4.2% | 1.8%(+2.39)#30 | 1.9%(+2.33)#1,935 |
| 31. | 59068 | 4.1% | 1.8%(+2.25)#31 | 1.9%(+2.20)#2,080 |
| 32. | 59527 | 4.0% | 1.8%(+2.19)#32 | 1.9%(+2.13)#2,140 |
| 33. | 59070 | 3.9% | 1.8%(+2.10)#33 | 1.9%(+2.04)#2,248 |
| 34. | 59261 | 3.8% | 1.8%(+2.01)#34 | 1.9%(+1.95)#2,333 |
| 35. | 59401 | 3.6% | 1.8%(+1.81)#35 | 1.9%(+1.75)#2,595 |
| 36. | 59912 | 3.6% | 1.8%(+1.73)#36 | 1.9%(+1.67)#2,733 |
| 37. | 59910 | 3.5% | 1.8%(+1.71)#37 | 1.9%(+1.65)#2,764 |
| 38. | 59710 | 3.5% | 1.8%(+1.71)#38 | 1.9%(+1.65)#2,772 |
| 39. | 59072 | 3.5% | 1.8%(+1.69)#39 | 1.9%(+1.63)#2,788 |
| 40. | 59829 | 3.5% | 1.8%(+1.64)#40 | 1.9%(+1.58)#2,892 |
| 41. | 59937 | 3.4% | 1.8%(+1.52)#41 | 1.9%(+1.47)#3,119 |
| 42. | 59102 | 3.2% | 1.8%(+1.40)#42 | 1.9%(+1.34)#3,347 |
| 43. | 59854 | 3.2% | 1.8%(+1.39)#43 | 1.9%(+1.33)#3,362 |
| 44. | 59729 | 3.2% | 1.8%(+1.38)#44 | 1.9%(+1.32)#3,384 |
| 45. | 59454 | 3.1% | 1.8%(+1.29)#45 | 1.9%(+1.23)#3,578 |
| 46. | 59865 | 3.1% | 1.8%(+1.24)#46 | 1.9%(+1.18)#3,685 |
| 47. | 59482 | 2.9% | 1.8%(+1.08)#47 | 1.9%(+1.03)#4,120 |
| 48. | 59472 | 2.9% | 1.8%(+1.05)#48 | 1.9%(+0.989)#4,223 |
| 49. | 59801 | 2.8% | 1.8%(+0.974)#49 | 1.9%(+0.916)#4,411 |
| 50. | 59043 | 2.7% | 1.8%(+0.827)#50 | 1.9%(+0.769)#4,891 |
| 51. | 59715 | 2.6% | 1.8%(+0.742)#51 | 1.9%(+0.684)#5,181 |
| 52. | 59840 | 2.5% | 1.8%(+0.689)#52 | 1.9%(+0.631)#5,397 |
| 53. | 59442 | 2.5% | 1.8%(+0.621)#53 | 1.9%(+0.563)#5,652 |
| 54. | 59901 | 2.4% | 1.8%(+0.540)#54 | 1.9%(+0.482)#6,002 |
| 55. | 59718 | 2.4% | 1.8%(+0.518)#55 | 1.9%(+0.460)#6,096 |
| 56. | 59050 | 2.3% | 1.8%(+0.439)#56 | 1.9%(+0.381)#6,444 |
| 57. | 59022 | 2.2% | 1.8%(+0.405)#57 | 1.9%(+0.347)#6,617 |
| 58. | 59918 | 2.2% | 1.8%(+0.369)#58 | 1.9%(+0.311)#6,800 |
| 59. | 59923 | 2.2% | 1.8%(+0.367)#59 | 1.9%(+0.309)#6,807 |
| 60. | 59063 | 2.2% | 1.8%(+0.354)#60 | 1.9%(+0.296)#6,867 |
| 61. | 59864 | 2.1% | 1.8%(+0.262)#61 | 1.9%(+0.204)#7,343 |
| 62. | 59011 | 2.1% | 1.8%(+0.255)#62 | 1.9%(+0.197)#7,382 |
| 63. | 59639 | 2.0% | 1.8%(+0.196)#63 | 1.9%(+0.138)#7,694 |
| 64. | 59101 | 2.0% | 1.8%(+0.186)#64 | 1.9%(+0.128)#7,741 |
| 65. | 59410 | 2.0% | 1.8%(+0.174)#65 | 1.9%(+0.116)#7,788 |
| 66. | 59821 | 2.0% | 1.8%(+0.134)#66 | 1.9%(+0.076)#8,026 |
| 67. | 59404 | 2.0% | 1.8%(+0.127)#67 | 1.9%(+0.069)#8,060 |
| 68. | 59602 | 1.9% | 1.8%(+0.064)#68 | 1.9%(+0.006)#8,488 |
| 69. | 59417 | 1.9% | 1.8%(+0.058)#69 | 1.9%(-0.000)#8,527 |
| 70. | 59041 | 1.9% | 1.8%(+0.018)#70 | 1.9%(-0.040)#8,767 |
| 71. | 59425 | 1.8% | 1.8%(+0.007)#71 | 1.9%(-0.051)#8,858 |
| 72. | 59808 | 1.8% | 1.8%(+0.007)#72 | 1.9%(-0.051)#8,861 |
| 73. | 59054 | 1.8% | 1.8%(-0.032)#73 | 1.9%(-0.090)#9,120 |
| 74. | 59323 | 1.8% | 1.8%(-0.036)#74 | 1.9%(-0.094)#9,150 |
| 75. | 59860 | 1.8% | 1.8%(-0.056)#75 | 1.9%(-0.114)#9,266 |
| 76. | 59448 | 1.8% | 1.8%(-0.064)#76 | 1.9%(-0.122)#9,314 |
| 77. | 59019 | 1.8% | 1.8%(-0.065)#77 | 1.9%(-0.123)#9,325 |
| 78. | 59828 | 1.7% | 1.8%(-0.141)#78 | 1.9%(-0.199)#9,814 |
| 79. | 59037 | 1.6% | 1.8%(-0.214)#79 | 1.9%(-0.272)#10,315 |
| 80. | 59457 | 1.6% | 1.8%(-0.232)#80 | 1.9%(-0.290)#10,432 |
| 81. | 59701 | 1.6% | 1.8%(-0.242)#81 | 1.9%(-0.300)#10,503 |
| 82. | 59833 | 1.6% | 1.8%(-0.248)#82 | 1.9%(-0.306)#10,545 |
| 83. | 59802 | 1.6% | 1.8%(-0.274)#83 | 1.9%(-0.332)#10,723 |
| 84. | 59327 | 1.5% | 1.8%(-0.294)#84 | 1.9%(-0.352)#10,856 |
| 85. | 59759 | 1.5% | 1.8%(-0.297)#85 | 1.9%(-0.355)#10,879 |
| 86. | 59001 | 1.5% | 1.8%(-0.312)#86 | 1.9%(-0.370)#10,990 |
| 87. | 59714 | 1.5% | 1.8%(-0.338)#87 | 1.9%(-0.396)#11,183 |
| 88. | 59728 | 1.5% | 1.8%(-0.349)#88 | 1.9%(-0.407)#11,267 |
| 89. | 59523 | 1.5% | 1.8%(-0.380)#89 | 1.9%(-0.438)#11,549 |
| 90. | 59405 | 1.4% | 1.8%(-0.387)#90 | 1.9%(-0.445)#11,605 |
| 91. | 59201 | 1.4% | 1.8%(-0.387)#91 | 1.9%(-0.445)#11,607 |
| 92. | 59443 | 1.4% | 1.8%(-0.435)#92 | 1.9%(-0.493)#11,993 |
| 93. | 59741 | 1.4% | 1.8%(-0.454)#93 | 1.9%(-0.512)#12,141 |
| 94. | 59601 | 1.4% | 1.8%(-0.461)#94 | 1.9%(-0.519)#12,194 |
| 95. | 59750 | 1.4% | 1.8%(-0.478)#95 | 1.9%(-0.536)#12,302 |
| 96. | 59471 | 1.3% | 1.8%(-0.500)#96 | 1.9%(-0.558)#12,467 |
| 97. | 59725 | 1.3% | 1.8%(-0.504)#97 | 1.9%(-0.562)#12,493 |
| 98. | 59635 | 1.3% | 1.8%(-0.510)#98 | 1.9%(-0.568)#12,552 |
| 99. | 59711 | 1.3% | 1.8%(-0.515)#99 | 1.9%(-0.573)#12,583 |
| 100. | 59873 | 1.3% | 1.8%(-0.577)#100 | 1.9%(-0.635)#13,033 |
Common Questions
What are the Top 10 Zip Codes with the Highest Percentage of Population Employed in Real Estate, Rental & Leasing in Montana?
Top 10 Zip Codes with the Highest Percentage of Population Employed in Real Estate, Rental & Leasing in Montana are:
What zip code has the Highest Percentage of Population Employed in Real Estate, Rental & Leasing in Montana?
59257 has the Highest Percentage of Population Employed in Real Estate, Rental & Leasing in Montana with 53.8%.
What is the Percentage of Population Employed in Real Estate, Rental & Leasing in the State of Montana?
Percentage of Population Employed in Real Estate, Rental & Leasing in Montana is 1.8%.
What is the Percentage of Population Employed in Real Estate, Rental & Leasing in the United States?
Percentage of Population Employed in Real Estate, Rental & Leasing in the United States is 1.9%.