Washington, LA Map & Demographics
Washington Map
Washington Overview
$17,601
PER CAPITA INCOME
$24,628
AVG FAMILY INCOME
$36,719
AVG HOUSEHOLD INCOME
11.8%
WAGE / INCOME GAP [ % ]
88.2¢/ $1
WAGE / INCOME GAP [ $ ]
0.40
INEQUALITY / GINI INDEX
819
TOTAL POPULATION
347
MALE POPULATION
472
FEMALE POPULATION
73.52
MALES / 100 FEMALES
136.02
FEMALES / 100 MALES
26.6
MEDIAN AGE
2.5
AVG FAMILY SIZE
2.3
AVG HOUSEHOLD SIZE
341
LABOR FORCE [ PEOPLE ]
54.6%
PERCENT IN LABOR FORCE
Washington Zip Codes
Washington Area Codes
Income in Washington
Income Overview in Washington
Per Capita Income in Washington is $17,601, while median incomes of families and households are $24,628 and $36,719 respectively.
| Characteristic | Number | Measure |
| Per Capita Income | 819 | $17,601 |
| Median Family Income | 244 | $24,628 |
| Mean Family Income | 244 | $41,071 |
| Median Household Income | 359 | $36,719 |
| Mean Household Income | 359 | $41,580 |
| Income Deficit | 244 | $0 |
| Wage / Income Gap (%) | 819 | 11.77% |
| Wage / Income Gap ($) | 819 | 88.23¢ per $1 |
| Gini / Inequality Index | 819 | 0.40 |
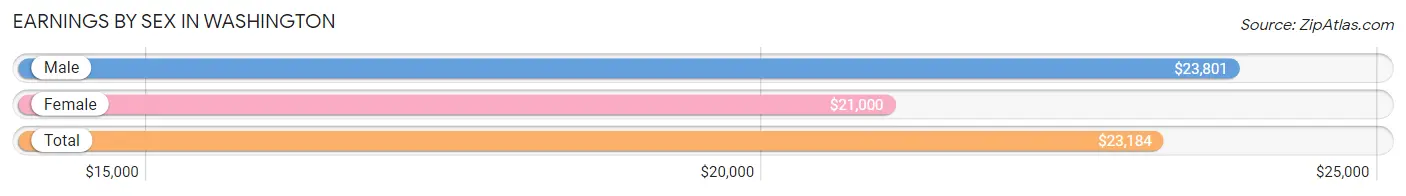
Earnings by Sex in Washington
Average Earnings in Washington are $23,184, $23,801 for men and $21,000 for women, a difference of 11.8%.
| Sex | Number | Average Earnings |
| Male | 156 (45.4%) | $23,801 |
| Female | 188 (54.6%) | $21,000 |
| Total | 344 (100.0%) | $23,184 |
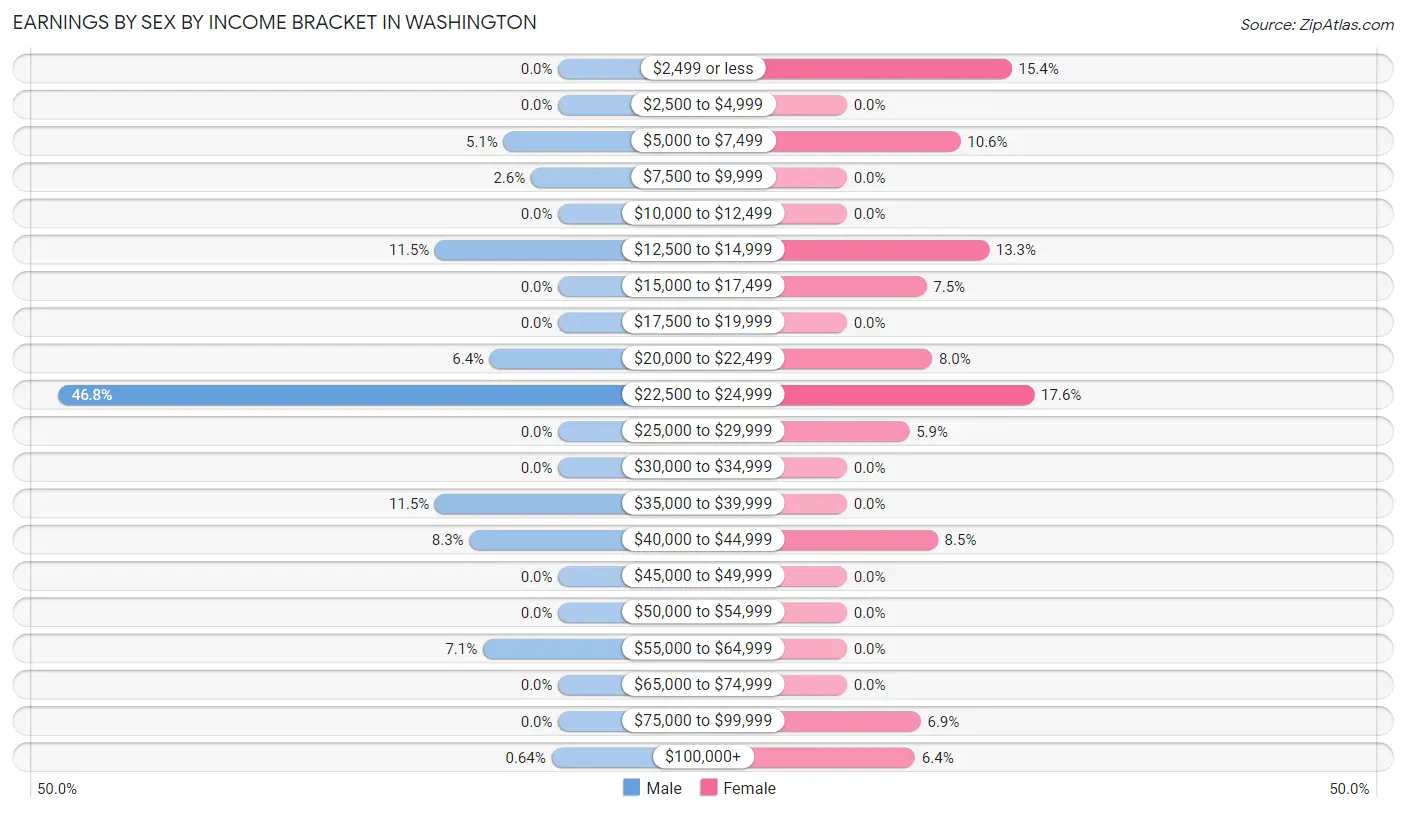
Earnings by Sex by Income Bracket in Washington
The most common earnings brackets in Washington are $22,500 to $24,999 for men (73 | 46.8%) and $22,500 to $24,999 for women (33 | 17.5%).
| Income | Male | Female |
| $2,499 or less | 0 (0.0%) | 29 (15.4%) |
| $2,500 to $4,999 | 0 (0.0%) | 0 (0.0%) |
| $5,000 to $7,499 | 8 (5.1%) | 20 (10.6%) |
| $7,500 to $9,999 | 4 (2.6%) | 0 (0.0%) |
| $10,000 to $12,499 | 0 (0.0%) | 0 (0.0%) |
| $12,500 to $14,999 | 18 (11.5%) | 25 (13.3%) |
| $15,000 to $17,499 | 0 (0.0%) | 14 (7.4%) |
| $17,500 to $19,999 | 0 (0.0%) | 0 (0.0%) |
| $20,000 to $22,499 | 10 (6.4%) | 15 (8.0%) |
| $22,500 to $24,999 | 73 (46.8%) | 33 (17.5%) |
| $25,000 to $29,999 | 0 (0.0%) | 11 (5.9%) |
| $30,000 to $34,999 | 0 (0.0%) | 0 (0.0%) |
| $35,000 to $39,999 | 18 (11.5%) | 0 (0.0%) |
| $40,000 to $44,999 | 13 (8.3%) | 16 (8.5%) |
| $45,000 to $49,999 | 0 (0.0%) | 0 (0.0%) |
| $50,000 to $54,999 | 0 (0.0%) | 0 (0.0%) |
| $55,000 to $64,999 | 11 (7.0%) | 0 (0.0%) |
| $65,000 to $74,999 | 0 (0.0%) | 0 (0.0%) |
| $75,000 to $99,999 | 0 (0.0%) | 13 (6.9%) |
| $100,000+ | 1 (0.6%) | 12 (6.4%) |
| Total | 156 (100.0%) | 188 (100.0%) |
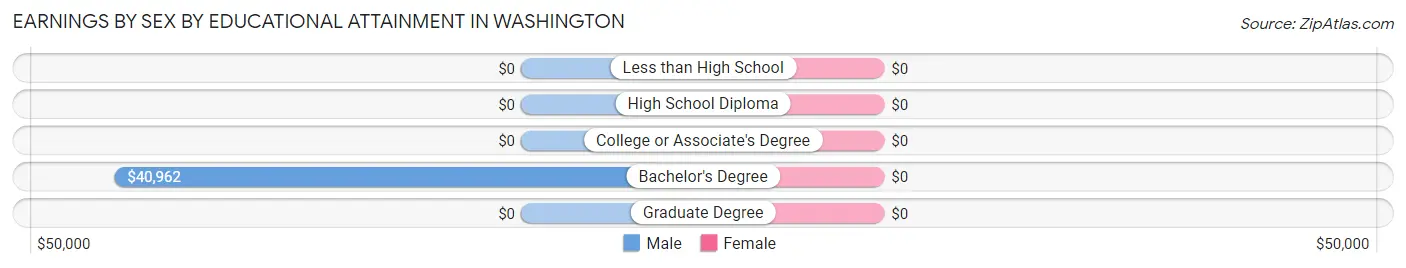
Earnings by Sex by Educational Attainment in Washington
| Educational Attainment | Male Income | Female Income |
| Less than High School | - | - |
| High School Diploma | - | - |
| College or Associate's Degree | - | - |
| Bachelor's Degree | $40,962 | $0 |
| Graduate Degree | - | - |
| Total | $23,818 | $23,144 |
Family Income in Washington
Family Income Brackets in Washington
According to the Washington family income data, there are 99 families falling into the $15,000 to $24,999 income range, which is the most common income bracket and makes up 40.6% of all families.
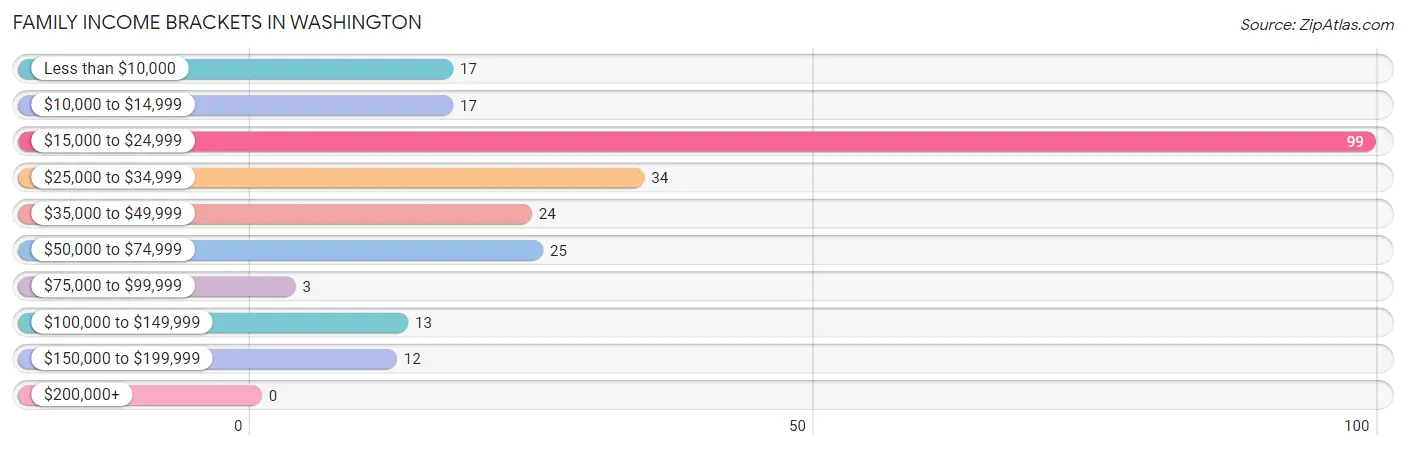
| Income Bracket | # Families | % Families |
| Less than $10,000 | 17 | 7.0% |
| $10,000 to $14,999 | 17 | 7.0% |
| $15,000 to $24,999 | 99 | 40.6% |
| $25,000 to $34,999 | 34 | 13.9% |
| $35,000 to $49,999 | 24 | 9.8% |
| $50,000 to $74,999 | 25 | 10.2% |
| $75,000 to $99,999 | 3 | 1.2% |
| $100,000 to $149,999 | 13 | 5.3% |
| $150,000 to $199,999 | 12 | 4.9% |
| $200,000+ | 0 | 0.0% |
Family Income by Famaliy Size in Washington
2-person families (172 | 70.5%) account for the highest median family income in Washington with $23,986 per family, while 2-person families (172 | 70.5%) have the highest median income of $11,993 per family member.
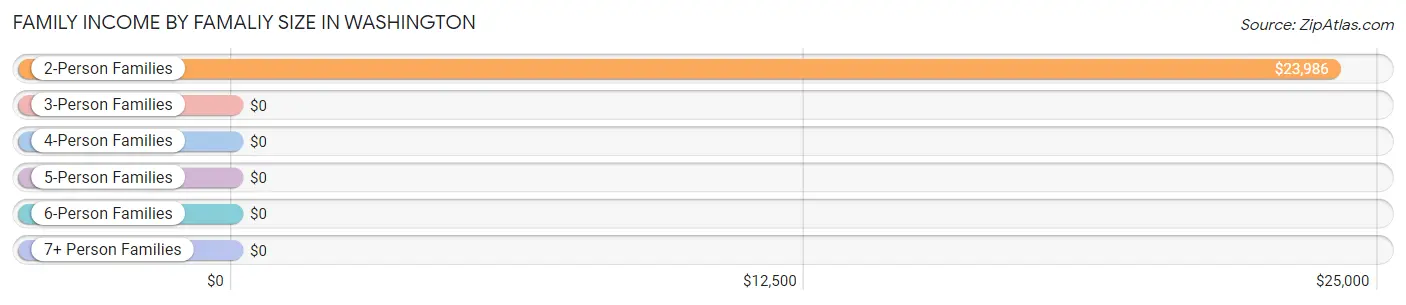
| Income Bracket | # Families | Median Income |
| 2-Person Families | 172 (70.5%) | $23,986 |
| 3-Person Families | 23 (9.4%) | $0 |
| 4-Person Families | 46 (18.9%) | $0 |
| 5-Person Families | 0 (0.0%) | $0 |
| 6-Person Families | 0 (0.0%) | $0 |
| 7+ Person Families | 3 (1.2%) | $0 |
| Total | 244 (100.0%) | $24,628 |
Family Income by Number of Earners in Washington
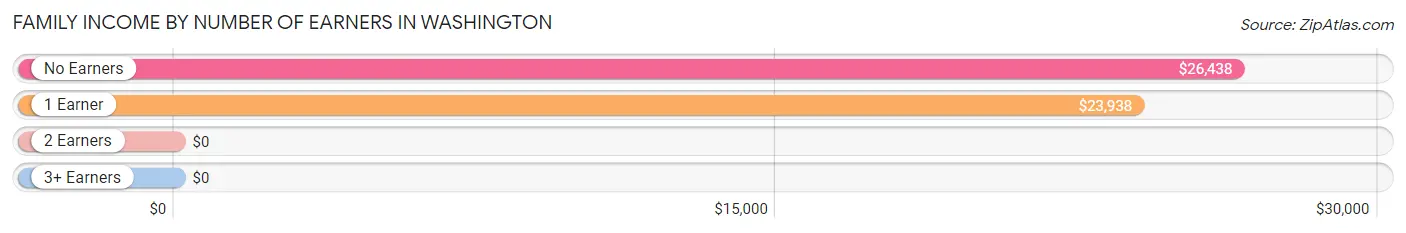
| Number of Earners | # Families | Median Income |
| No Earners | 79 (32.4%) | $26,438 |
| 1 Earner | 118 (48.4%) | $23,938 |
| 2 Earners | 47 (19.3%) | $0 |
| 3+ Earners | 0 (0.0%) | $0 |
| Total | 244 (100.0%) | $24,628 |
Household Income in Washington
Household Income Brackets in Washington
With 103 households falling in the category, the $35,000 to $49,999 income range is the most frequent in Washington, accounting for 28.7% of all households.
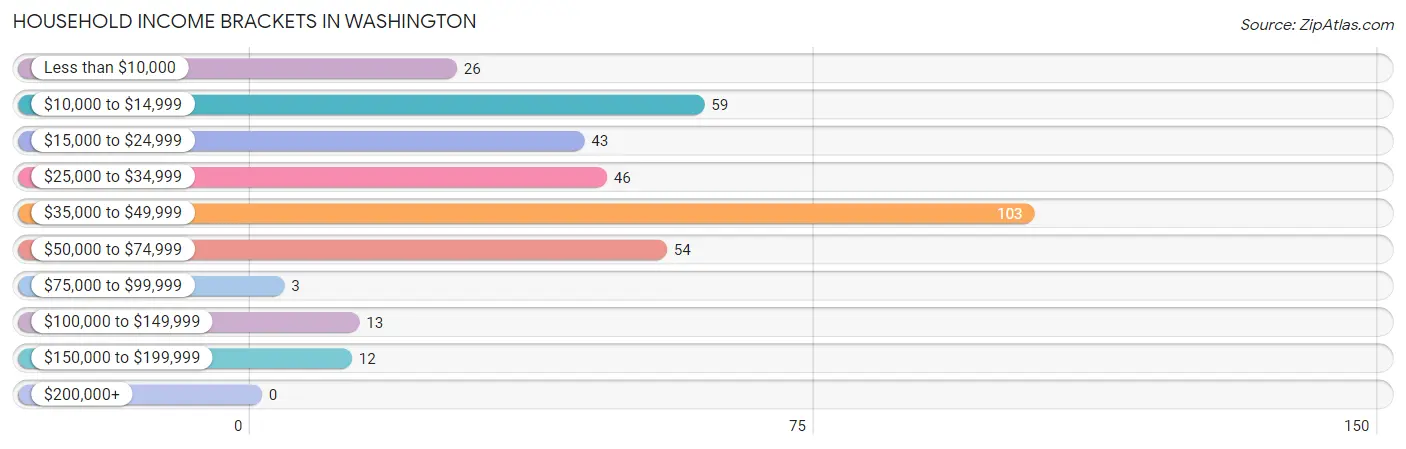
| Income Bracket | # Households | % Households |
| Less than $10,000 | 26 | 7.2% |
| $10,000 to $14,999 | 59 | 16.4% |
| $15,000 to $24,999 | 43 | 12.0% |
| $25,000 to $34,999 | 46 | 12.8% |
| $35,000 to $49,999 | 103 | 28.7% |
| $50,000 to $74,999 | 54 | 15.0% |
| $75,000 to $99,999 | 3 | 0.8% |
| $100,000 to $149,999 | 13 | 3.6% |
| $150,000 to $199,999 | 12 | 3.3% |
| $200,000+ | 0 | 0.0% |
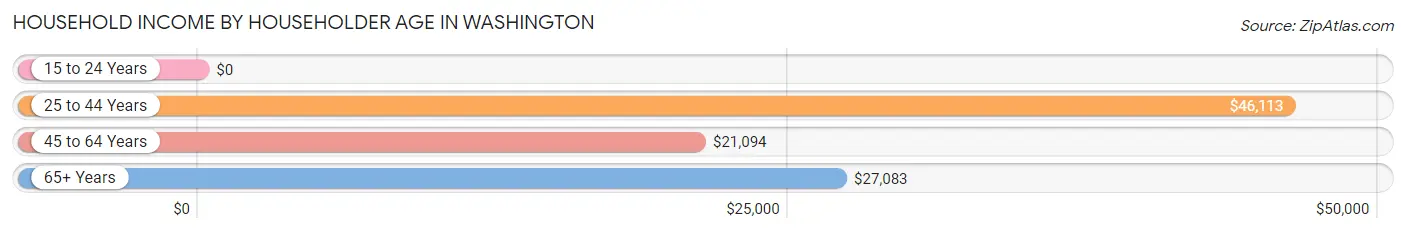
Household Income by Householder Age in Washington
The median household income in Washington is $36,719, with the highest median household income of $46,113 found in the 25 to 44 years age bracket for the primary householder. A total of 107 households (29.8%) fall into this category. Meanwhile, the 15 to 24 years age bracket for the primary householder has the lowest median household income of $0, with 34 households (9.5%) in this group.
| Income Bracket | # Households | Median Income |
| 15 to 24 Years | 34 (9.5%) | $0 |
| 25 to 44 Years | 107 (29.8%) | $46,113 |
| 45 to 64 Years | 122 (34.0%) | $21,094 |
| 65+ Years | 96 (26.7%) | $27,083 |
| Total | 359 (100.0%) | $36,719 |
Poverty in Washington
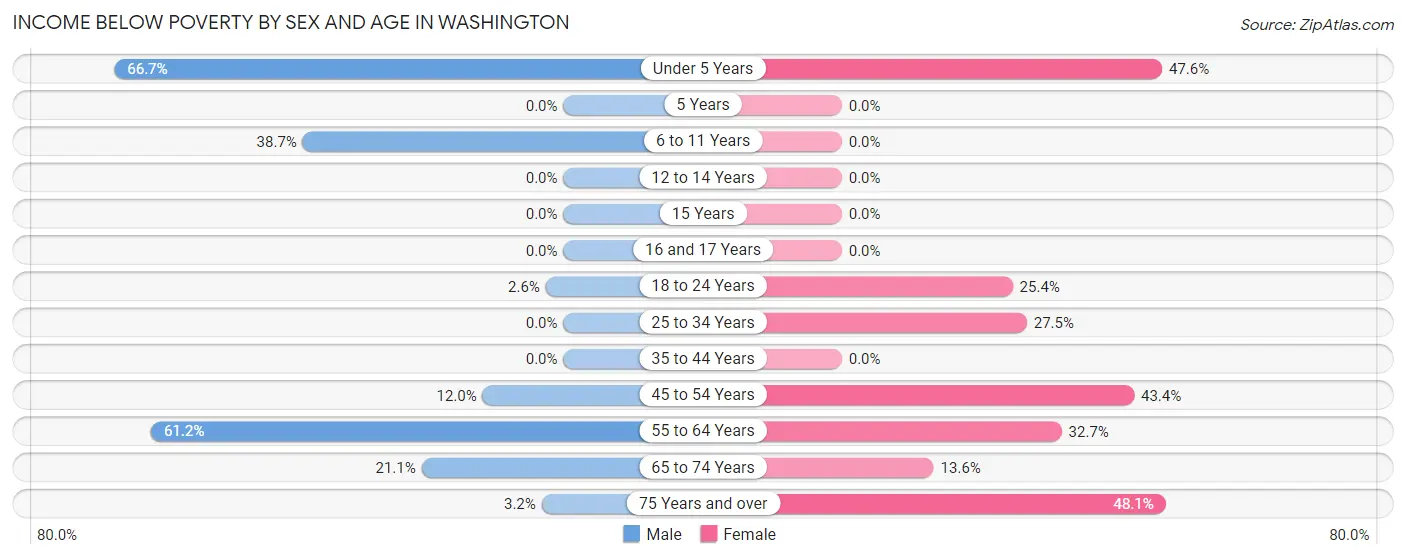
Income Below Poverty by Sex and Age in Washington
With 24.0% poverty level for males and 32.5% for females among the residents of Washington, under 5 year old males and 75 year old and over females are the most vulnerable to poverty, with 26 males (66.7%) and 25 females (48.1%) in their respective age groups living below the poverty level.
| Age Bracket | Male | Female |
| Under 5 Years | 26 (66.7%) | 39 (47.6%) |
| 5 Years | 0 (0.0%) | 0 (0.0%) |
| 6 to 11 Years | 12 (38.7%) | 0 (0.0%) |
| 12 to 14 Years | 0 (0.0%) | 0 (0.0%) |
| 15 Years | 0 (0.0%) | 0 (0.0%) |
| 16 and 17 Years | 0 (0.0%) | 0 (0.0%) |
| 18 to 24 Years | 1 (2.6%) | 17 (25.4%) |
| 25 to 34 Years | 0 (0.0%) | 25 (27.5%) |
| 35 to 44 Years | 0 (0.0%) | 0 (0.0%) |
| 45 to 54 Years | 3 (12.0%) | 23 (43.4%) |
| 55 to 64 Years | 30 (61.2%) | 16 (32.7%) |
| 65 to 74 Years | 8 (21.0%) | 3 (13.6%) |
| 75 Years and over | 1 (3.2%) | 25 (48.1%) |
| Total | 81 (24.0%) | 148 (32.5%) |
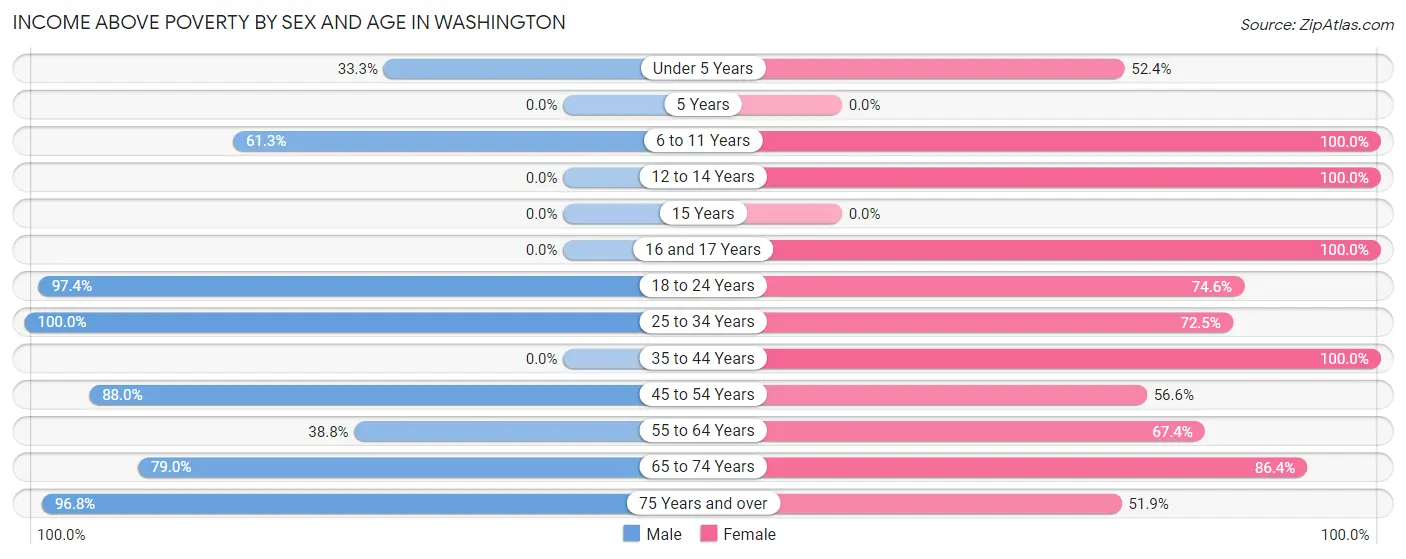
Income Above Poverty by Sex and Age in Washington
According to the poverty statistics in Washington, males aged 25 to 34 years and females aged 6 to 11 years are the age groups that are most secure financially, with 100.0% of males and 100.0% of females in these age groups living above the poverty line.
| Age Bracket | Male | Female |
| Under 5 Years | 13 (33.3%) | 43 (52.4%) |
| 5 Years | 0 (0.0%) | 0 (0.0%) |
| 6 to 11 Years | 19 (61.3%) | 5 (100.0%) |
| 12 to 14 Years | 0 (0.0%) | 11 (100.0%) |
| 15 Years | 0 (0.0%) | 0 (0.0%) |
| 16 and 17 Years | 0 (0.0%) | 12 (100.0%) |
| 18 to 24 Years | 37 (97.4%) | 50 (74.6%) |
| 25 to 34 Years | 87 (100.0%) | 66 (72.5%) |
| 35 to 44 Years | 0 (0.0%) | 11 (100.0%) |
| 45 to 54 Years | 22 (88.0%) | 30 (56.6%) |
| 55 to 64 Years | 19 (38.8%) | 33 (67.3%) |
| 65 to 74 Years | 30 (78.9%) | 19 (86.4%) |
| 75 Years and over | 30 (96.8%) | 27 (51.9%) |
| Total | 257 (76.0%) | 307 (67.5%) |
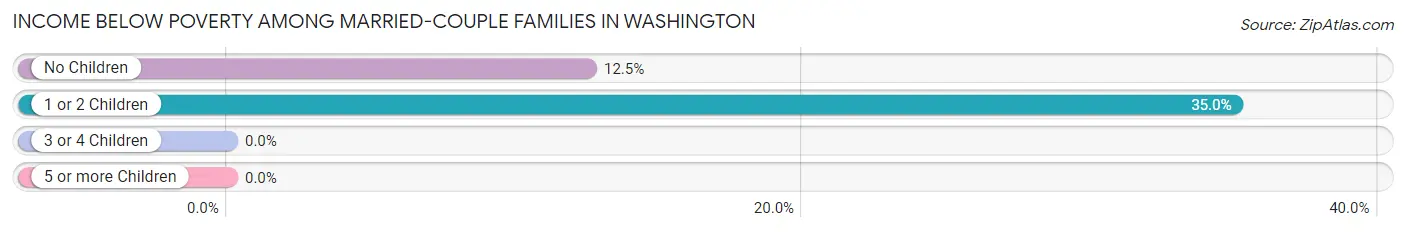
Income Below Poverty Among Married-Couple Families in Washington
The poverty statistics for married-couple families in Washington show that 18.4% or 14 of the total 76 families live below the poverty line. Families with 1 or 2 children have the highest poverty rate of 35.0%, comprising of 7 families. On the other hand, families with no children have the lowest poverty rate of 12.5%, which includes 7 families.
| Children | Above Poverty | Below Poverty |
| No Children | 49 (87.5%) | 7 (12.5%) |
| 1 or 2 Children | 13 (65.0%) | 7 (35.0%) |
| 3 or 4 Children | 0 (0.0%) | 0 (0.0%) |
| 5 or more Children | 0 (0.0%) | 0 (0.0%) |
| Total | 62 (81.6%) | 14 (18.4%) |
Income Below Poverty Among Single-Parent Households in Washington
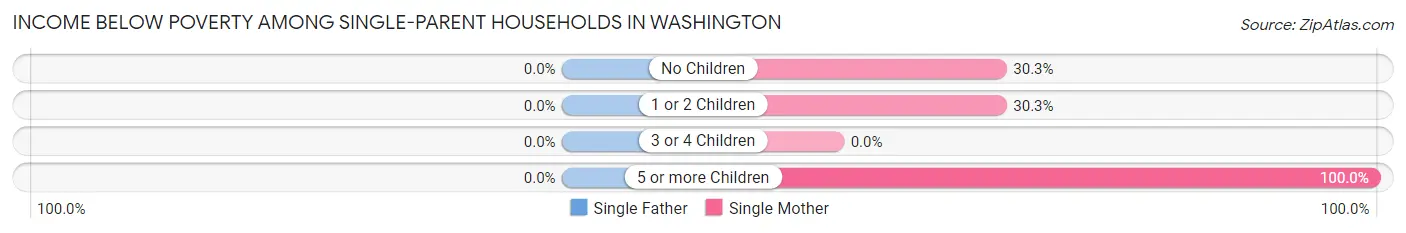
| Children | Single Father | Single Mother |
| No Children | 0 (0.0%) | 10 (30.3%) |
| 1 or 2 Children | 0 (0.0%) | 10 (30.3%) |
| 3 or 4 Children | 0 (0.0%) | 0 (0.0%) |
| 5 or more Children | 0 (0.0%) | 3 (100.0%) |
| Total | 0 (0.0%) | 23 (27.1%) |
Income Below Poverty Among Married-Couple vs Single-Parent Households in Washington
The poverty data for Washington shows that 14 of the married-couple family households (18.4%) and 23 of the single-parent households (13.7%) are living below the poverty level. Within the married-couple family households, those with 1 or 2 children have the highest poverty rate, with 7 households (35.0%) falling below the poverty line. Among the single-parent households, those with 5 or more children have the highest poverty rate, with 3 household (100.0%) living below poverty.
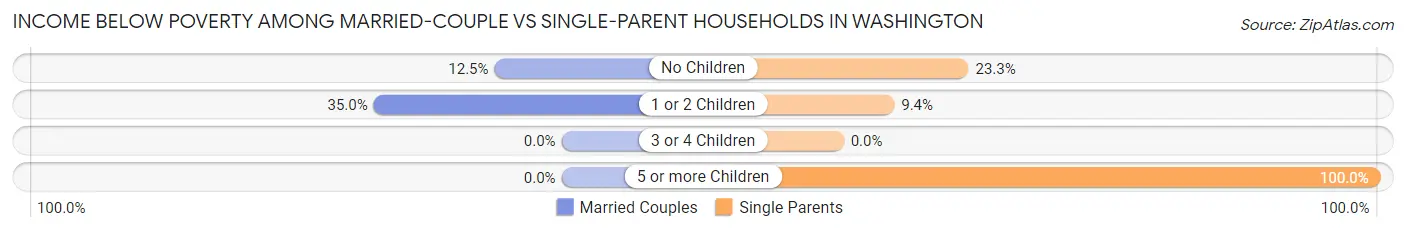
| Children | Married-Couple Families | Single-Parent Households |
| No Children | 7 (12.5%) | 10 (23.3%) |
| 1 or 2 Children | 7 (35.0%) | 10 (9.4%) |
| 3 or 4 Children | 0 (0.0%) | 0 (0.0%) |
| 5 or more Children | 0 (0.0%) | 3 (100.0%) |
| Total | 14 (18.4%) | 23 (13.7%) |
Race in Washington
The most populous races in Washington are Black / African American (473 | 57.8%), White / Caucasian (259 | 31.6%), and Two or more Races (87 | 10.6%).
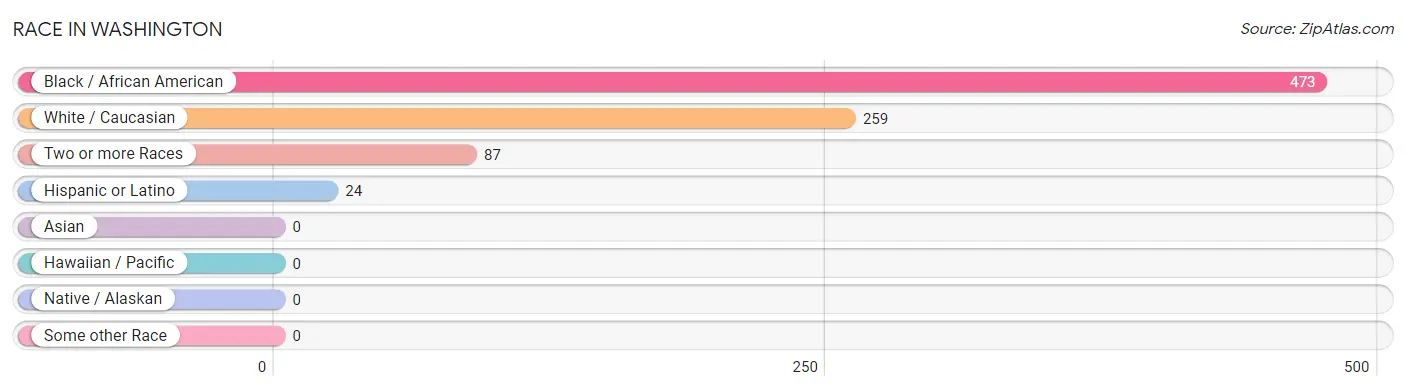
| Race | # Population | % Population |
| Asian | 0 | 0.0% |
| Black / African American | 473 | 57.8% |
| Hawaiian / Pacific | 0 | 0.0% |
| Hispanic or Latino | 24 | 2.9% |
| Native / Alaskan | 0 | 0.0% |
| White / Caucasian | 259 | 31.6% |
| Two or more Races | 87 | 10.6% |
| Some other Race | 0 | 0.0% |
| Total | 819 | 100.0% |
Ancestry in Washington
The most populous ancestries reported in Washington are French Canadian (99 | 12.1%), German (55 | 6.7%), Cajun (37 | 4.5%), English (28 | 3.4%), and Cuban (8 | 1.0%), together accounting for 27.7% of all Washington residents.
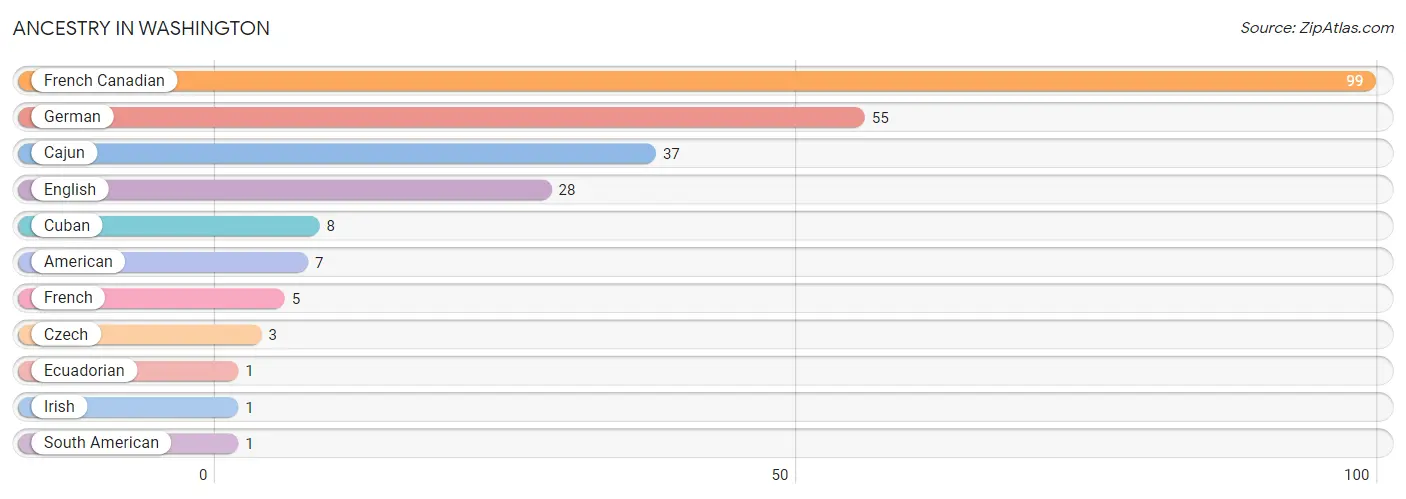
| Ancestry | # Population | % Population |
| American | 7 | 0.9% |
| Cajun | 37 | 4.5% |
| Cuban | 8 | 1.0% |
| Czech | 3 | 0.4% |
| Ecuadorian | 1 | 0.1% |
| English | 28 | 3.4% |
| French | 5 | 0.6% |
| French Canadian | 99 | 12.1% |
| German | 55 | 6.7% |
| Irish | 1 | 0.1% |
| South American | 1 | 0.1% | View All 11 Rows |
Immigrants in Washington
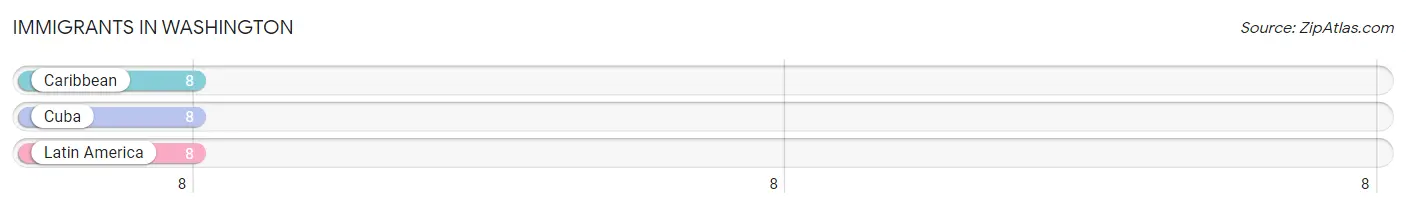
The most numerous immigrant groups reported in Washington came from Caribbean (8 | 1.0%), Cuba (8 | 1.0%), and Latin America (8 | 1.0%), together accounting for 2.9% of all Washington residents.
| Immigration Origin | # Population | % Population |
| Caribbean | 8 | 1.0% |
| Cuba | 8 | 1.0% |
| Latin America | 8 | 1.0% | View All 3 Rows |
Sex and Age in Washington
Sex and Age in Washington
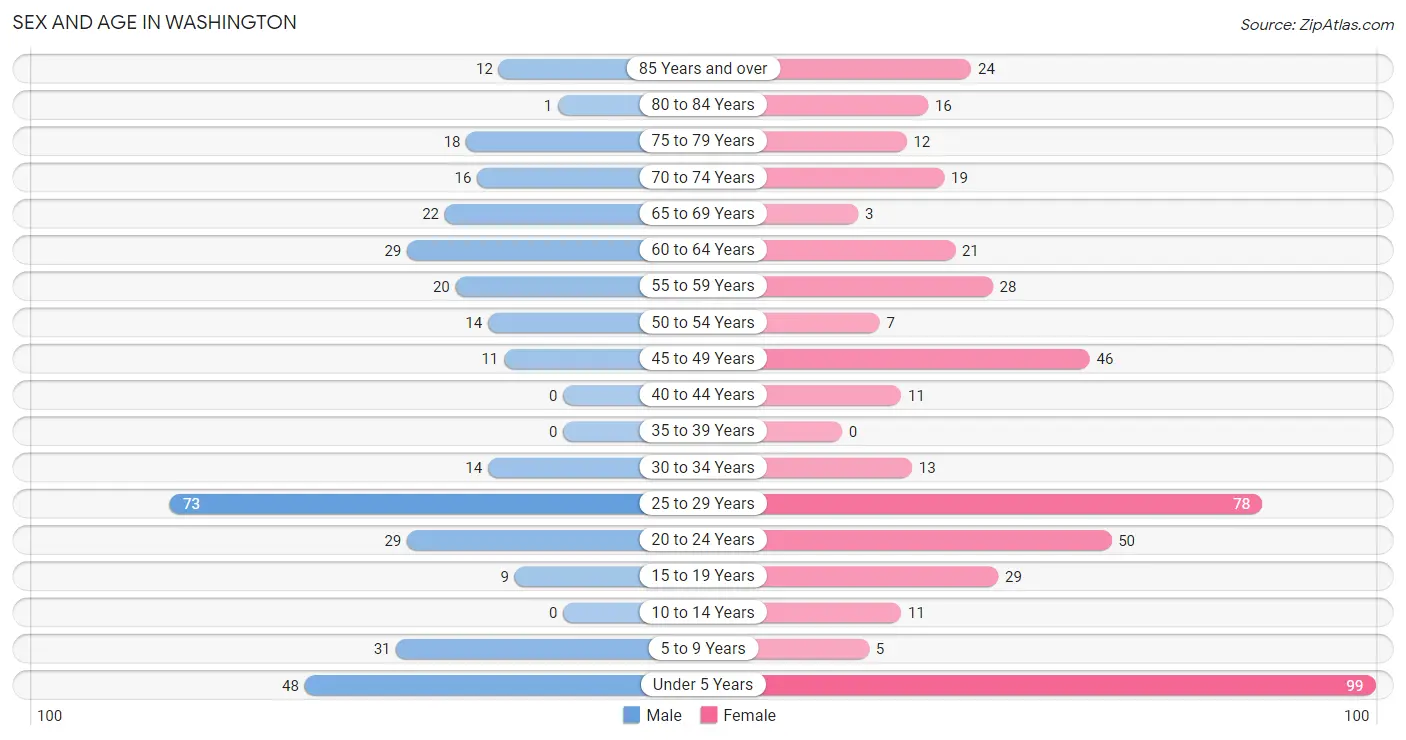
The most populous age groups in Washington are 25 to 29 Years (73 | 21.0%) for men and Under 5 Years (99 | 21.0%) for women.
| Age Bracket | Male | Female |
| Under 5 Years | 48 (13.8%) | 99 (21.0%) |
| 5 to 9 Years | 31 (8.9%) | 5 (1.1%) |
| 10 to 14 Years | 0 (0.0%) | 11 (2.3%) |
| 15 to 19 Years | 9 (2.6%) | 29 (6.1%) |
| 20 to 24 Years | 29 (8.4%) | 50 (10.6%) |
| 25 to 29 Years | 73 (21.0%) | 78 (16.5%) |
| 30 to 34 Years | 14 (4.0%) | 13 (2.8%) |
| 35 to 39 Years | 0 (0.0%) | 0 (0.0%) |
| 40 to 44 Years | 0 (0.0%) | 11 (2.3%) |
| 45 to 49 Years | 11 (3.2%) | 46 (9.8%) |
| 50 to 54 Years | 14 (4.0%) | 7 (1.5%) |
| 55 to 59 Years | 20 (5.8%) | 28 (5.9%) |
| 60 to 64 Years | 29 (8.4%) | 21 (4.4%) |
| 65 to 69 Years | 22 (6.3%) | 3 (0.6%) |
| 70 to 74 Years | 16 (4.6%) | 19 (4.0%) |
| 75 to 79 Years | 18 (5.2%) | 12 (2.5%) |
| 80 to 84 Years | 1 (0.3%) | 16 (3.4%) |
| 85 Years and over | 12 (3.5%) | 24 (5.1%) |
| Total | 347 (100.0%) | 472 (100.0%) |
Families and Households in Washington
Median Family Size in Washington
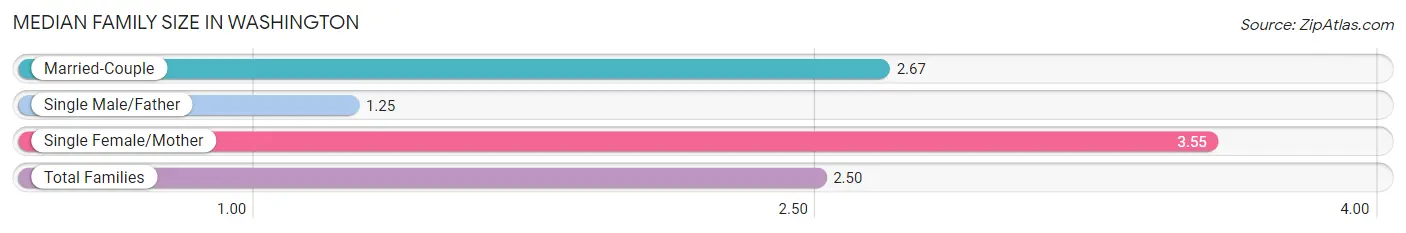
The median family size in Washington is 2.50 persons per family, with single female/mother families (85 | 34.8%) accounting for the largest median family size of 3.55 persons per family. On the other hand, single male/father families (83 | 34.0%) represent the smallest median family size with 1.25 persons per family.
| Family Type | # Families | Family Size |
| Married-Couple | 76 (31.1%) | 2.67 |
| Single Male/Father | 83 (34.0%) | 1.25 |
| Single Female/Mother | 85 (34.8%) | 3.55 |
| Total Families | 244 (100.0%) | 2.50 |
Median Household Size in Washington
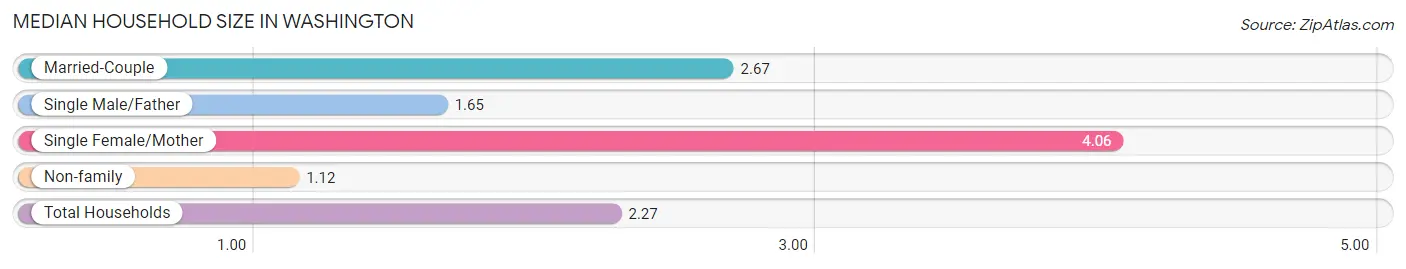
The median household size in Washington is 2.27 persons per household, with single female/mother households (85 | 23.7%) accounting for the largest median household size of 4.06 persons per household. non-family households (115 | 32.0%) represent the smallest median household size with 1.12 persons per household.
| Household Type | # Households | Household Size |
| Married-Couple | 76 (21.2%) | 2.67 |
| Single Male/Father | 83 (23.1%) | 1.65 |
| Single Female/Mother | 85 (23.7%) | 4.06 |
| Non-family | 115 (32.0%) | 1.12 |
| Total Households | 359 (100.0%) | 2.27 |
Household Size by Marriage Status in Washington
Out of a total of 359 households in Washington, 244 (68.0%) are family households, while 115 (32.0%) are nonfamily households. The most numerous type of family households are 2-person households, comprising 99, and the most common type of nonfamily households are 1-person households, comprising 97.
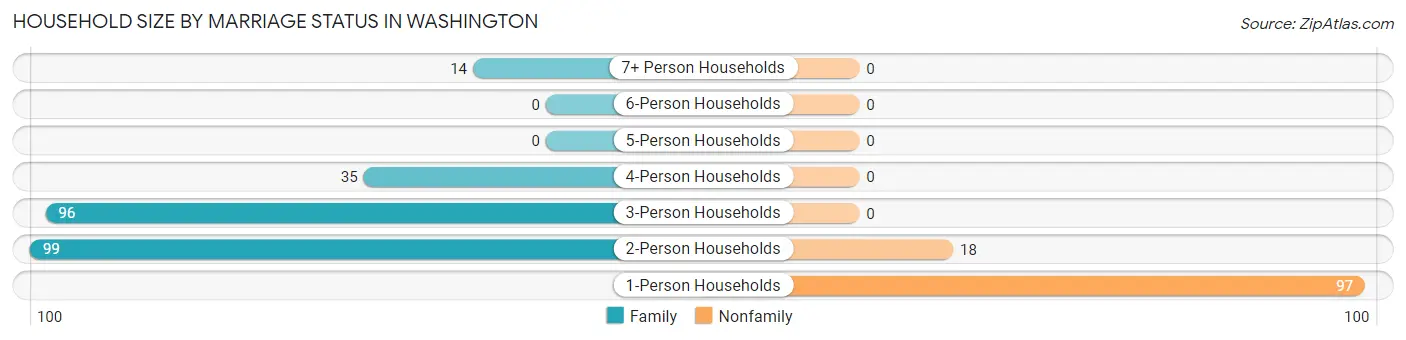
| Household Size | Family Households | Nonfamily Households |
| 1-Person Households | - | 97 (27.0%) |
| 2-Person Households | 99 (27.6%) | 18 (5.0%) |
| 3-Person Households | 96 (26.7%) | 0 (0.0%) |
| 4-Person Households | 35 (9.8%) | 0 (0.0%) |
| 5-Person Households | 0 (0.0%) | 0 (0.0%) |
| 6-Person Households | 0 (0.0%) | 0 (0.0%) |
| 7+ Person Households | 14 (3.9%) | 0 (0.0%) |
| Total | 244 (68.0%) | 115 (32.0%) |
Female Fertility in Washington
Fertility by Age in Washington
Average fertility rate in Washington is 141.0 births per 1,000 women. Women in the age bracket of 20 to 34 years have the highest fertility rate with 206.0 births per 1,000 women. Women in the age bracket of 20 to 34 years acount for 90.6% of all women with births.
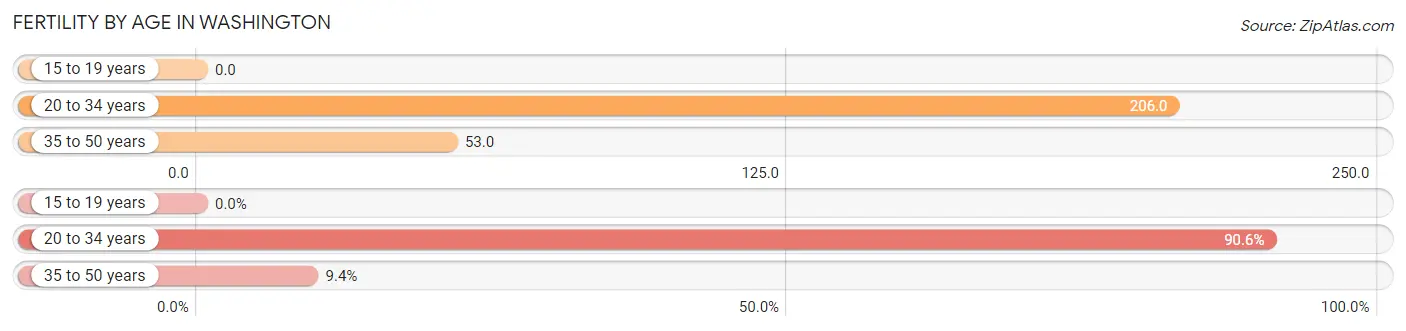
| Age Bracket | Women with Births | Births / 1,000 Women |
| 15 to 19 years | 0 (0.0%) | 0.0 |
| 20 to 34 years | 29 (90.6%) | 206.0 |
| 35 to 50 years | 3 (9.4%) | 53.0 |
| Total | 32 (100.0%) | 141.0 |
Fertility by Age by Marriage Status in Washington
50.0% of women with births (32) in Washington are married. The highest percentage of unmarried women with births falls into 20 to 34 years age bracket with 55.2% of them unmarried at the time of birth, while the lowest percentage of unmarried women with births belong to 35 to 50 years age bracket with 0.0% of them unmarried.
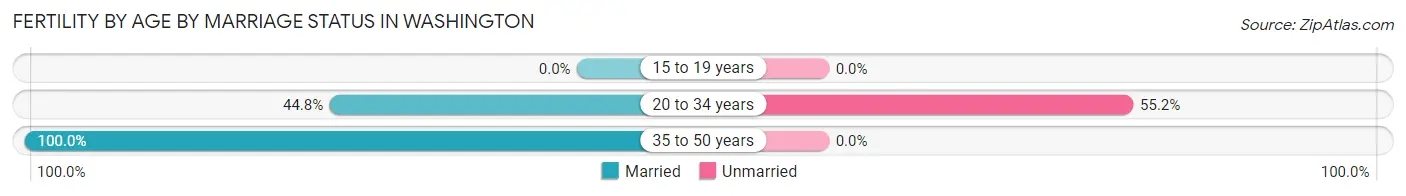
| Age Bracket | Married | Unmarried |
| 15 to 19 years | 0 (0.0%) | 0 (0.0%) |
| 20 to 34 years | 13 (44.8%) | 16 (55.2%) |
| 35 to 50 years | 3 (100.0%) | 0 (0.0%) |
| Total | 16 (50.0%) | 16 (50.0%) |
Fertility by Education in Washington
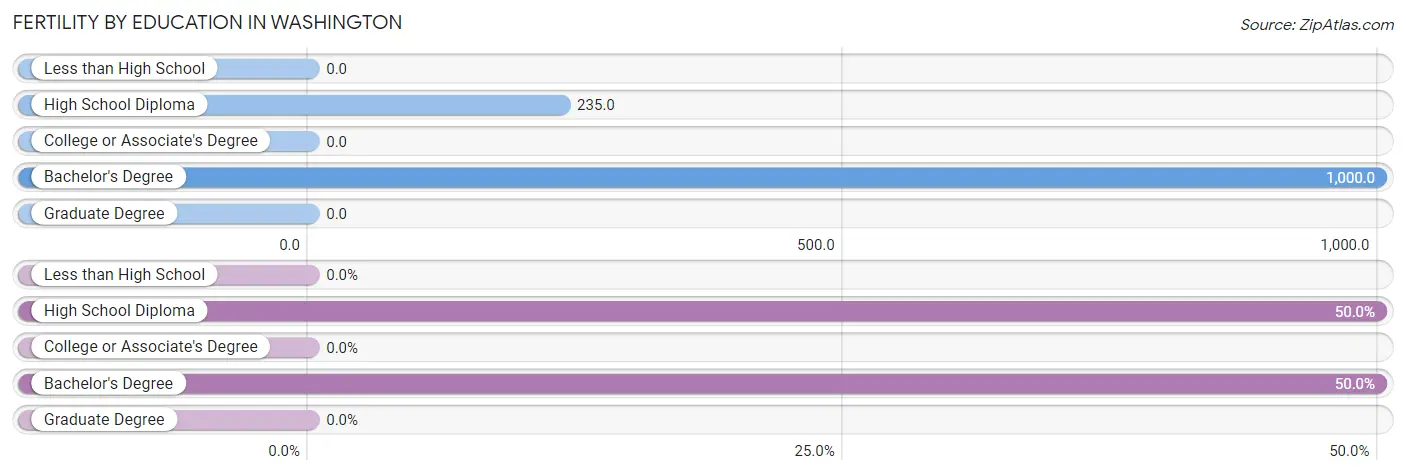
| Educational Attainment | Women with Births | Births / 1,000 Women |
| Less than High School | 0 (0.0%) | 0.0 |
| High School Diploma | 16 (50.0%) | 235.0 |
| College or Associate's Degree | 0 (0.0%) | 0.0 |
| Bachelor's Degree | 16 (50.0%) | 1,000.0 |
| Graduate Degree | 0 (0.0%) | 0.0 |
| Total | 32 (100.0%) | 141.0 |
Fertility by Education by Marriage Status in Washington
50.0% of women with births in Washington are unmarried. Women with the educational attainment of bachelor's degree are most likely to be married with 100.0% of them married at childbirth, while women with the educational attainment of high school diploma are least likely to be married with 100.0% of them unmarried at childbirth.
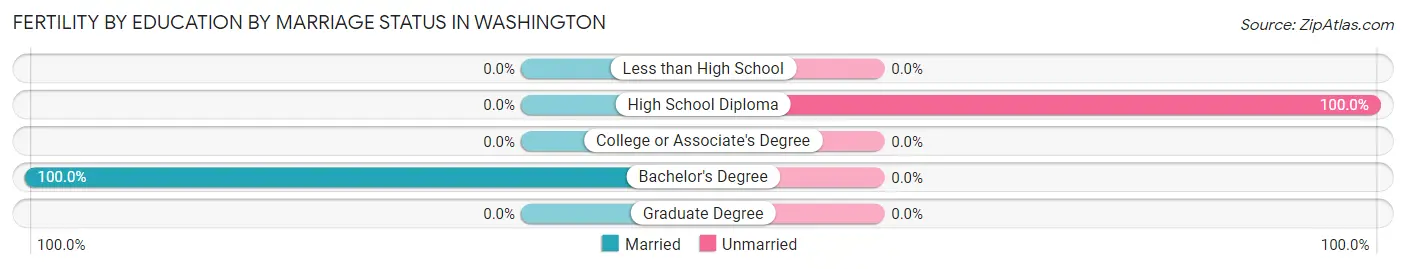
| Educational Attainment | Married | Unmarried |
| Less than High School | 0 (0.0%) | 0 (0.0%) |
| High School Diploma | 0 (0.0%) | 16 (100.0%) |
| College or Associate's Degree | 0 (0.0%) | 0 (0.0%) |
| Bachelor's Degree | 16 (100.0%) | 0 (0.0%) |
| Graduate Degree | 0 (0.0%) | 0 (0.0%) |
| Total | 16 (50.0%) | 16 (50.0%) |
Employment Characteristics in Washington
Employment by Class of Employer in Washington
Among the 308 employed individuals in Washington, private company employees (225 | 73.1%), self-employed (not incorporated) (48 | 15.6%), and not-for-profit organizations (25 | 8.1%) make up the most common classes of employment.
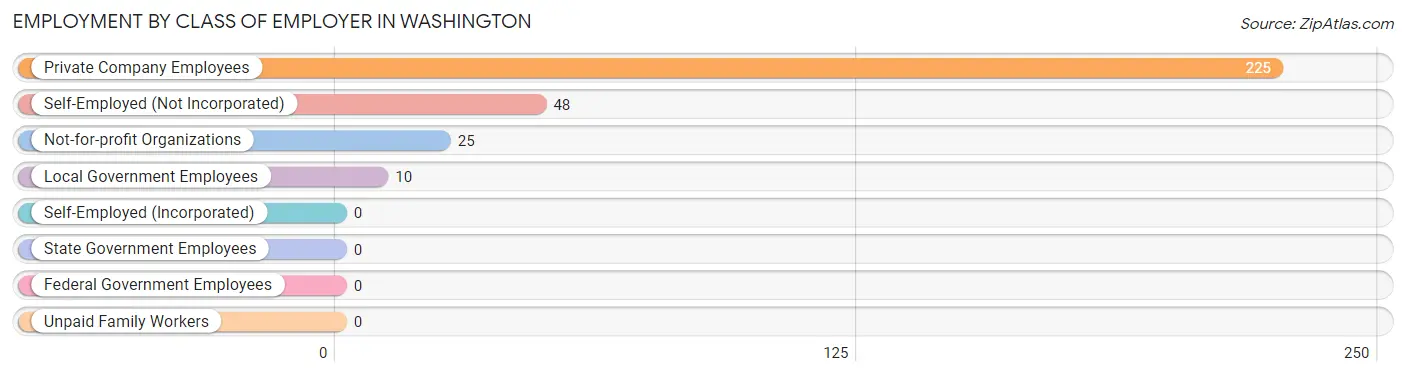
| Employer Class | # Employees | % Employees |
| Private Company Employees | 225 | 73.1% |
| Self-Employed (Incorporated) | 0 | 0.0% |
| Self-Employed (Not Incorporated) | 48 | 15.6% |
| Not-for-profit Organizations | 25 | 8.1% |
| Local Government Employees | 10 | 3.3% |
| State Government Employees | 0 | 0.0% |
| Federal Government Employees | 0 | 0.0% |
| Unpaid Family Workers | 0 | 0.0% |
| Total | 308 | 100.0% |
Employment Status by Age in Washington
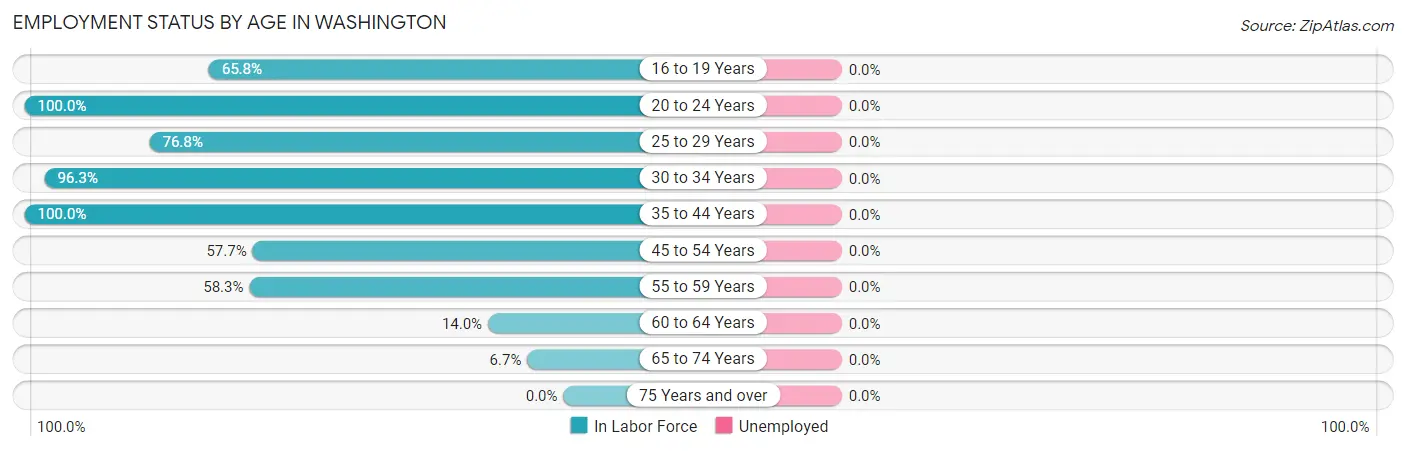
| Age Bracket | In Labor Force | Unemployed |
| 16 to 19 Years | 25 (65.8%) | 0 (0.0%) |
| 20 to 24 Years | 79 (100.0%) | 0 (0.0%) |
| 25 to 29 Years | 116 (76.8%) | 0 (0.0%) |
| 30 to 34 Years | 26 (96.3%) | 0 (0.0%) |
| 35 to 44 Years | 11 (100.0%) | 0 (0.0%) |
| 45 to 54 Years | 45 (57.7%) | 0 (0.0%) |
| 55 to 59 Years | 28 (58.3%) | 0 (0.0%) |
| 60 to 64 Years | 7 (14.0%) | 0 (0.0%) |
| 65 to 74 Years | 4 (6.7%) | 0 (0.0%) |
| 75 Years and over | 0 (0.0%) | 0 (0.0%) |
| Total | 341 (54.6%) | 0 (0.0%) |
Employment Status by Educational Attainment in Washington
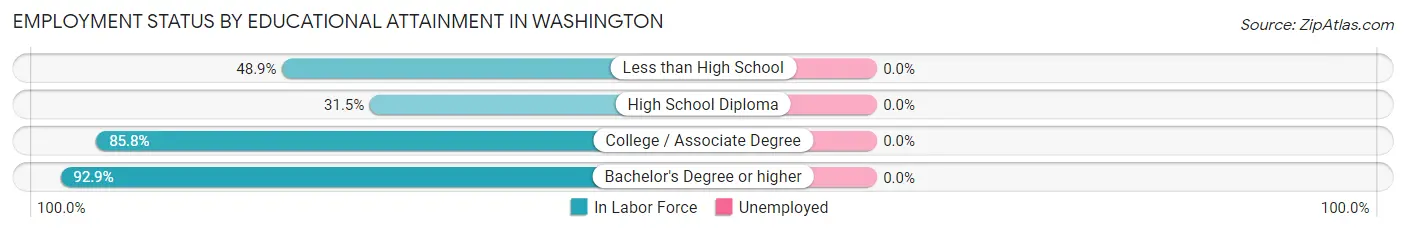
| Educational Attainment | In Labor Force | Unemployed |
| Less than High School | 44 (48.9%) | 0 (0.0%) |
| High School Diploma | 29 (31.5%) | 0 (0.0%) |
| College / Associate Degree | 121 (85.8%) | 0 (0.0%) |
| Bachelor's Degree or higher | 39 (92.9%) | 0 (0.0%) |
| Total | 233 (63.8%) | 0 (0.0%) |
Employment Occupations by Sex in Washington
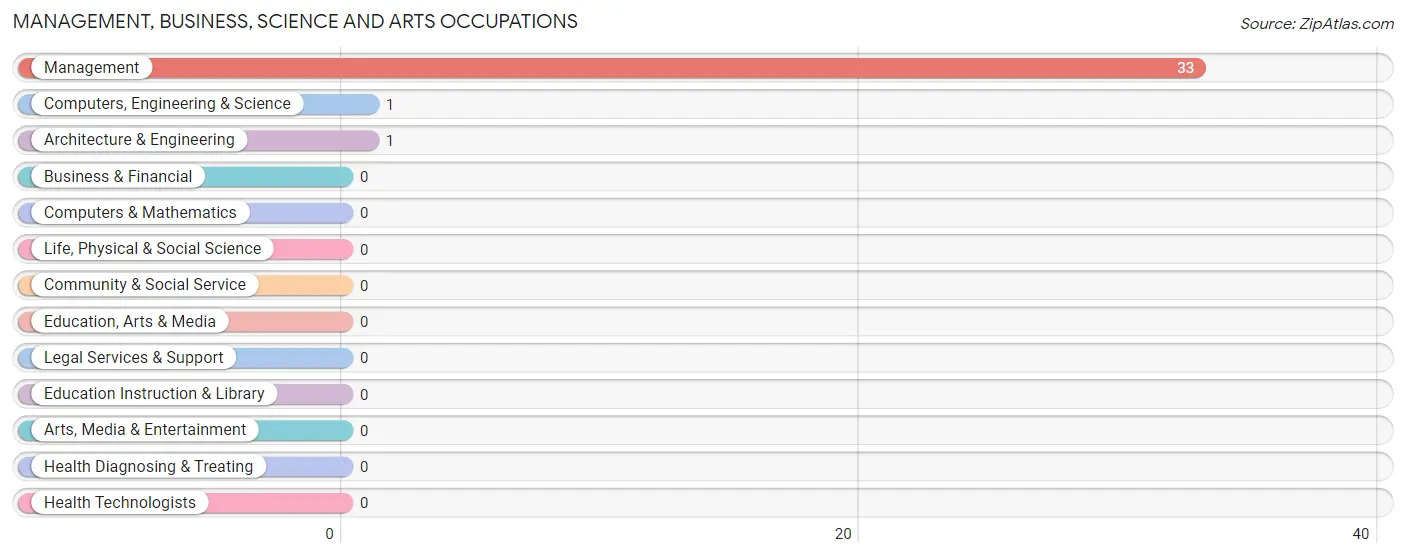
Management, Business, Science and Arts Occupations
The most common Management, Business, Science and Arts occupations in Washington are Management (33 | 9.7%), Computers, Engineering & Science (1 | 0.3%), and Architecture & Engineering (1 | 0.3%).
Management, Business, Science and Arts Occupations by Sex
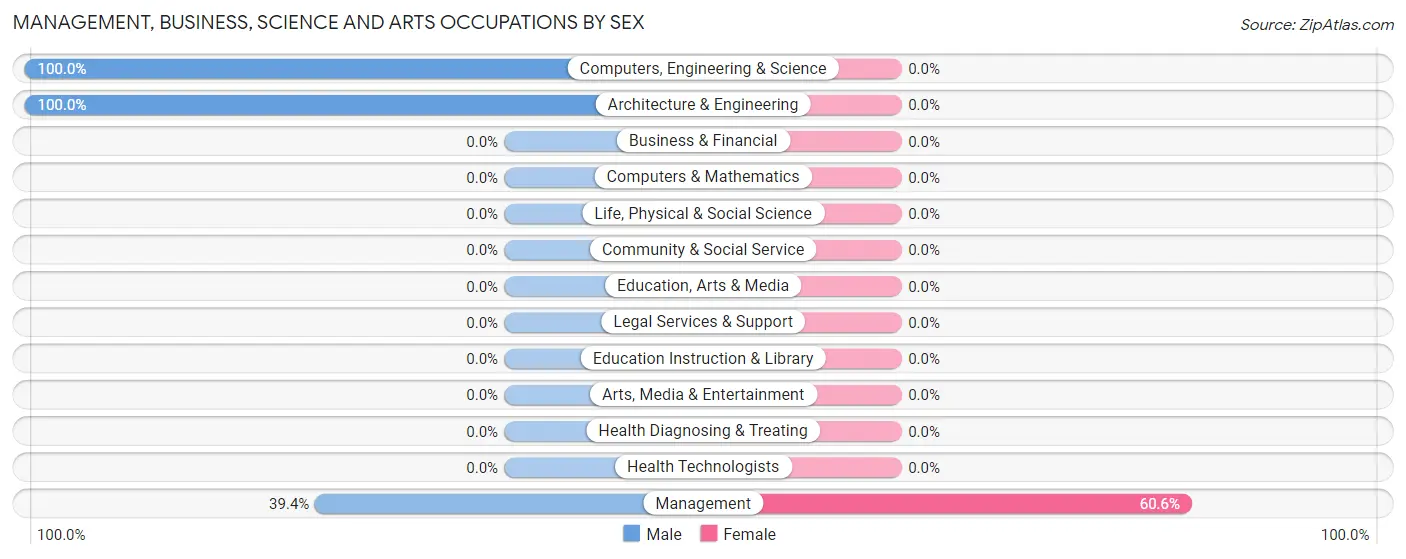
| Occupation | Male | Female |
| Management | 13 (39.4%) | 20 (60.6%) |
| Business & Financial | 0 (0.0%) | 0 (0.0%) |
| Computers, Engineering & Science | 1 (100.0%) | 0 (0.0%) |
| Computers & Mathematics | 0 (0.0%) | 0 (0.0%) |
| Architecture & Engineering | 1 (100.0%) | 0 (0.0%) |
| Life, Physical & Social Science | 0 (0.0%) | 0 (0.0%) |
| Community & Social Service | 0 (0.0%) | 0 (0.0%) |
| Education, Arts & Media | 0 (0.0%) | 0 (0.0%) |
| Legal Services & Support | 0 (0.0%) | 0 (0.0%) |
| Education Instruction & Library | 0 (0.0%) | 0 (0.0%) |
| Arts, Media & Entertainment | 0 (0.0%) | 0 (0.0%) |
| Health Diagnosing & Treating | 0 (0.0%) | 0 (0.0%) |
| Health Technologists | 0 (0.0%) | 0 (0.0%) |
| Total (Category) | 14 (41.2%) | 20 (58.8%) |
| Total (Overall) | 156 (45.8%) | 185 (54.2%) |
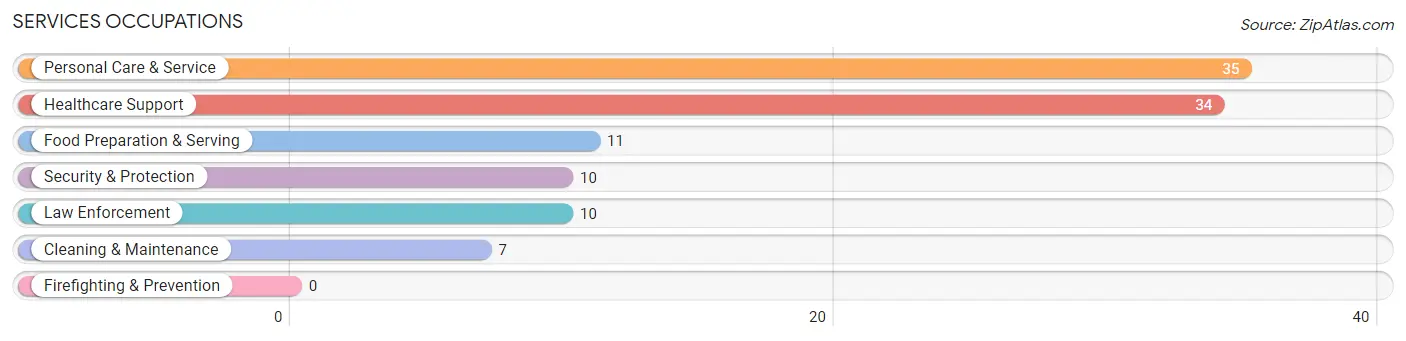
Services Occupations
The most common Services occupations in Washington are Personal Care & Service (35 | 10.3%), Healthcare Support (34 | 10.0%), Food Preparation & Serving (11 | 3.2%), Security & Protection (10 | 2.9%), and Law Enforcement (10 | 2.9%).
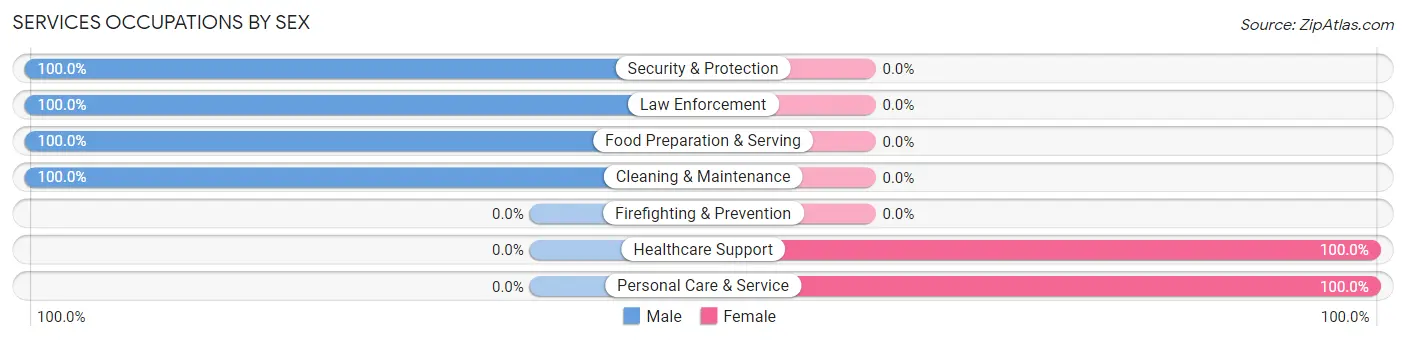
Services Occupations by Sex
Within the Services occupations in Washington, the most male-oriented occupations are Security & Protection (100.0%), Law Enforcement (100.0%), and Food Preparation & Serving (100.0%), while the most female-oriented occupations are Healthcare Support (100.0%), and Personal Care & Service (100.0%).
| Occupation | Male | Female |
| Healthcare Support | 0 (0.0%) | 34 (100.0%) |
| Security & Protection | 10 (100.0%) | 0 (0.0%) |
| Firefighting & Prevention | 0 (0.0%) | 0 (0.0%) |
| Law Enforcement | 10 (100.0%) | 0 (0.0%) |
| Food Preparation & Serving | 11 (100.0%) | 0 (0.0%) |
| Cleaning & Maintenance | 7 (100.0%) | 0 (0.0%) |
| Personal Care & Service | 0 (0.0%) | 35 (100.0%) |
| Total (Category) | 28 (28.9%) | 69 (71.1%) |
| Total (Overall) | 156 (45.8%) | 185 (54.2%) |
Sales and Office Occupations
The most common Sales and Office occupations in Washington are Office & Administration (63 | 18.5%), and Sales & Related (21 | 6.2%).
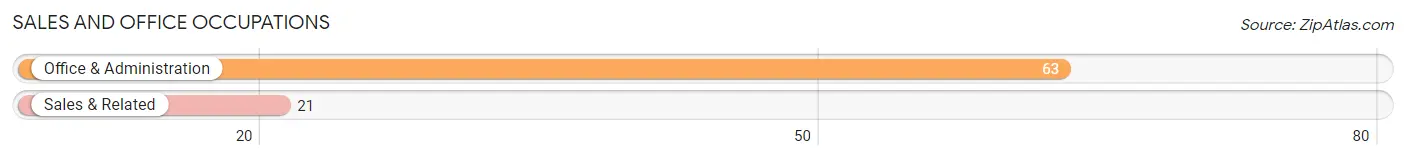
Sales and Office Occupations by Sex
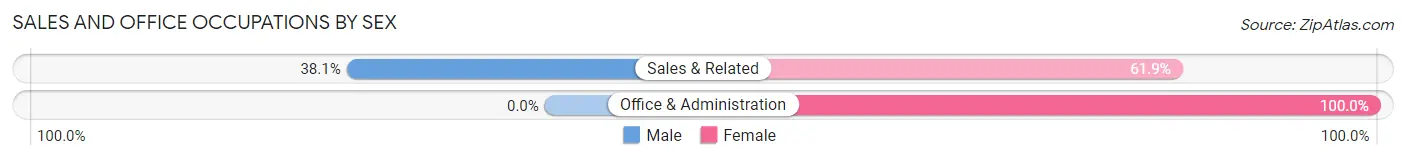
| Occupation | Male | Female |
| Sales & Related | 8 (38.1%) | 13 (61.9%) |
| Office & Administration | 0 (0.0%) | 63 (100.0%) |
| Total (Category) | 8 (9.5%) | 76 (90.5%) |
| Total (Overall) | 156 (45.8%) | 185 (54.2%) |
Natural Resources, Construction and Maintenance Occupations
The most common Natural Resources, Construction and Maintenance occupations in Washington are Construction & Extraction (15 | 4.4%), and Farming, Fishing & Forestry (9 | 2.6%).
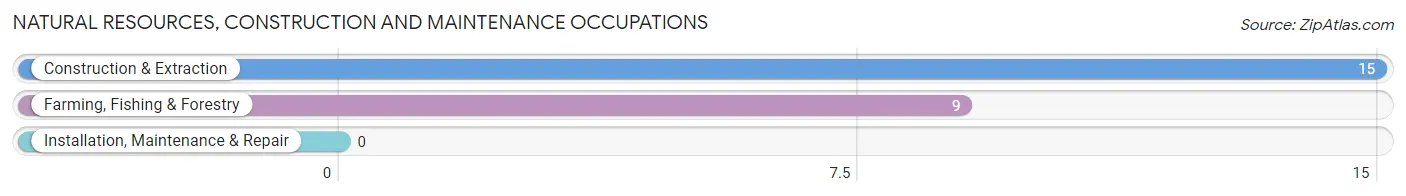
Natural Resources, Construction and Maintenance Occupations by Sex
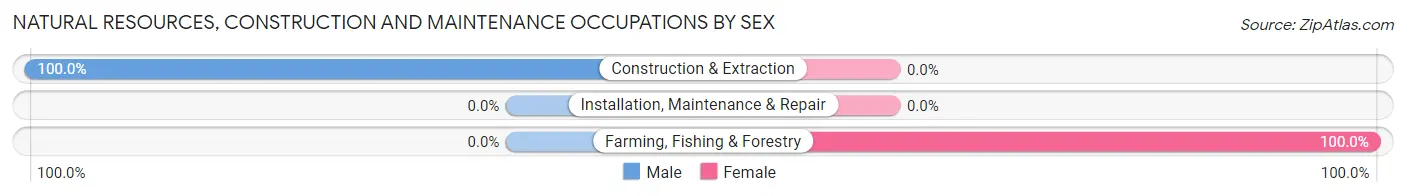
| Occupation | Male | Female |
| Farming, Fishing & Forestry | 0 (0.0%) | 9 (100.0%) |
| Construction & Extraction | 15 (100.0%) | 0 (0.0%) |
| Installation, Maintenance & Repair | 0 (0.0%) | 0 (0.0%) |
| Total (Category) | 15 (62.5%) | 9 (37.5%) |
| Total (Overall) | 156 (45.8%) | 185 (54.2%) |
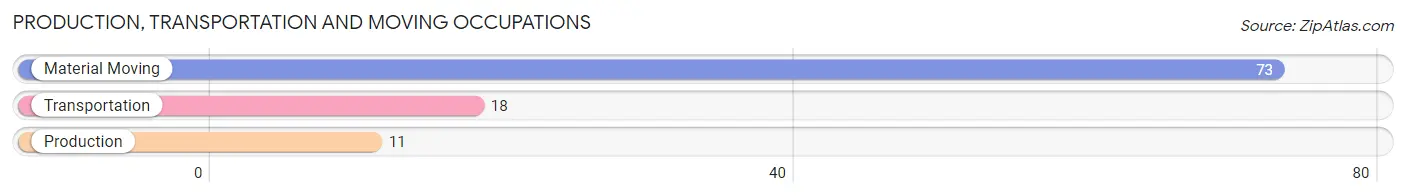
Production, Transportation and Moving Occupations
The most common Production, Transportation and Moving occupations in Washington are Material Moving (73 | 21.4%), Transportation (18 | 5.3%), and Production (11 | 3.2%).
Production, Transportation and Moving Occupations by Sex
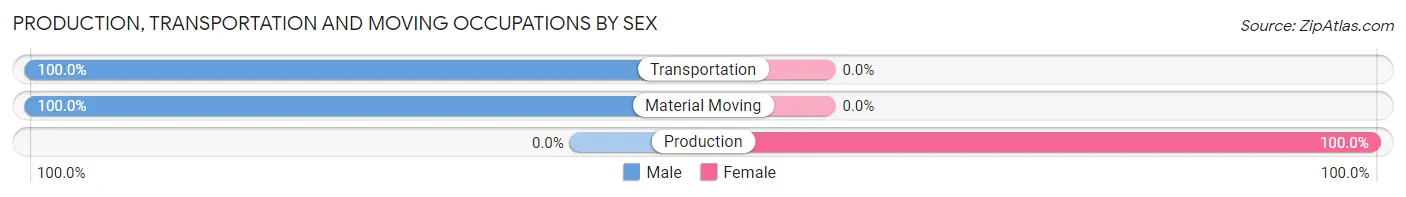
| Occupation | Male | Female |
| Production | 0 (0.0%) | 11 (100.0%) |
| Transportation | 18 (100.0%) | 0 (0.0%) |
| Material Moving | 73 (100.0%) | 0 (0.0%) |
| Total (Category) | 91 (89.2%) | 11 (10.8%) |
| Total (Overall) | 156 (45.8%) | 185 (54.2%) |
Employment Industries by Sex in Washington
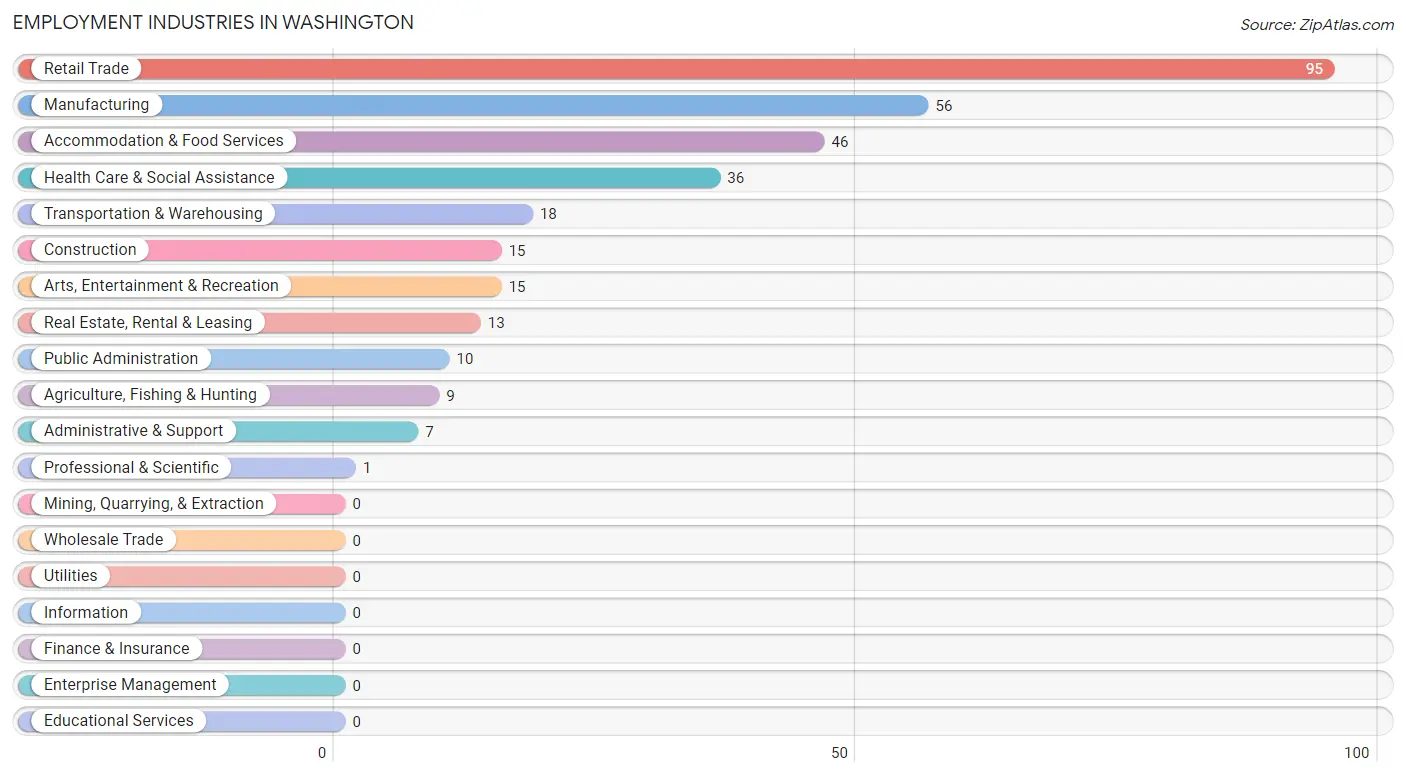
Employment Industries in Washington
The major employment industries in Washington include Retail Trade (95 | 27.9%), Manufacturing (56 | 16.4%), Accommodation & Food Services (46 | 13.5%), Health Care & Social Assistance (36 | 10.6%), and Transportation & Warehousing (18 | 5.3%).
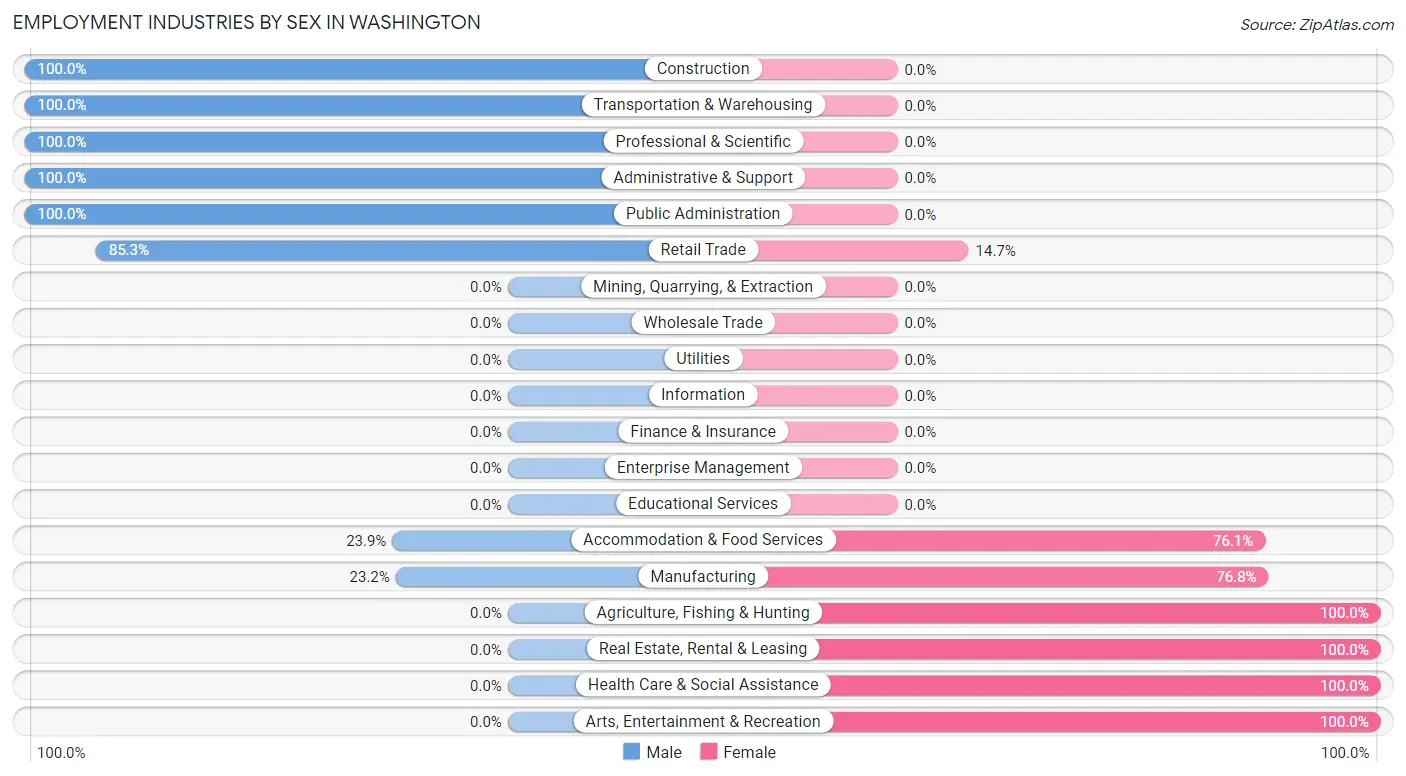
Employment Industries by Sex in Washington
The Washington industries that see more men than women are Construction (100.0%), Transportation & Warehousing (100.0%), and Professional & Scientific (100.0%), whereas the industries that tend to have a higher number of women are Agriculture, Fishing & Hunting (100.0%), Real Estate, Rental & Leasing (100.0%), and Health Care & Social Assistance (100.0%).
| Industry | Male | Female |
| Agriculture, Fishing & Hunting | 0 (0.0%) | 9 (100.0%) |
| Mining, Quarrying, & Extraction | 0 (0.0%) | 0 (0.0%) |
| Construction | 15 (100.0%) | 0 (0.0%) |
| Manufacturing | 13 (23.2%) | 43 (76.8%) |
| Wholesale Trade | 0 (0.0%) | 0 (0.0%) |
| Retail Trade | 81 (85.3%) | 14 (14.7%) |
| Transportation & Warehousing | 18 (100.0%) | 0 (0.0%) |
| Utilities | 0 (0.0%) | 0 (0.0%) |
| Information | 0 (0.0%) | 0 (0.0%) |
| Finance & Insurance | 0 (0.0%) | 0 (0.0%) |
| Real Estate, Rental & Leasing | 0 (0.0%) | 13 (100.0%) |
| Professional & Scientific | 1 (100.0%) | 0 (0.0%) |
| Enterprise Management | 0 (0.0%) | 0 (0.0%) |
| Administrative & Support | 7 (100.0%) | 0 (0.0%) |
| Educational Services | 0 (0.0%) | 0 (0.0%) |
| Health Care & Social Assistance | 0 (0.0%) | 36 (100.0%) |
| Arts, Entertainment & Recreation | 0 (0.0%) | 15 (100.0%) |
| Accommodation & Food Services | 11 (23.9%) | 35 (76.1%) |
| Public Administration | 10 (100.0%) | 0 (0.0%) |
| Total | 156 (45.8%) | 185 (54.2%) |
Education in Washington
School Enrollment in Washington
The most common levels of schooling among the 108 students in Washington are high school (28 | 25.9%), kindergarten (24 | 22.2%), and college / undergraduate (21 | 19.4%).
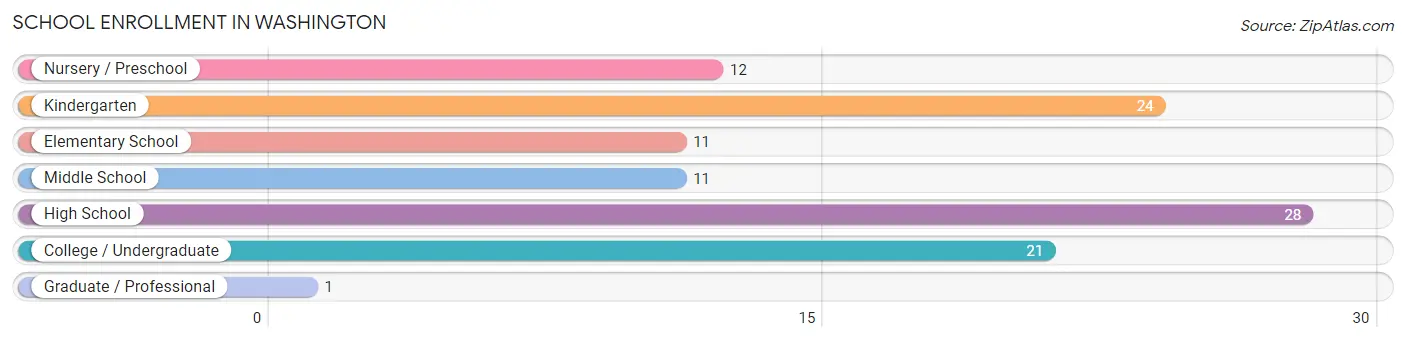
| School Level | # Students | % Students |
| Nursery / Preschool | 12 | 11.1% |
| Kindergarten | 24 | 22.2% |
| Elementary School | 11 | 10.2% |
| Middle School | 11 | 10.2% |
| High School | 28 | 25.9% |
| College / Undergraduate | 21 | 19.4% |
| Graduate / Professional | 1 | 0.9% |
| Total | 108 | 100.0% |
School Enrollment by Age by Funding Source in Washington
Out of a total of 108 students who are enrolled in schools in Washington, 31 (28.7%) attend a private institution, while the remaining 77 (71.3%) are enrolled in public schools. The age group of 3 to 4 year olds has the highest likelihood of being enrolled in private schools, with 11 (100.0% in the age bracket) enrolled. Conversely, the age group of 5 to 9 year old has the lowest likelihood of being enrolled in a private school, with 36 (100.0% in the age bracket) attending a public institution.
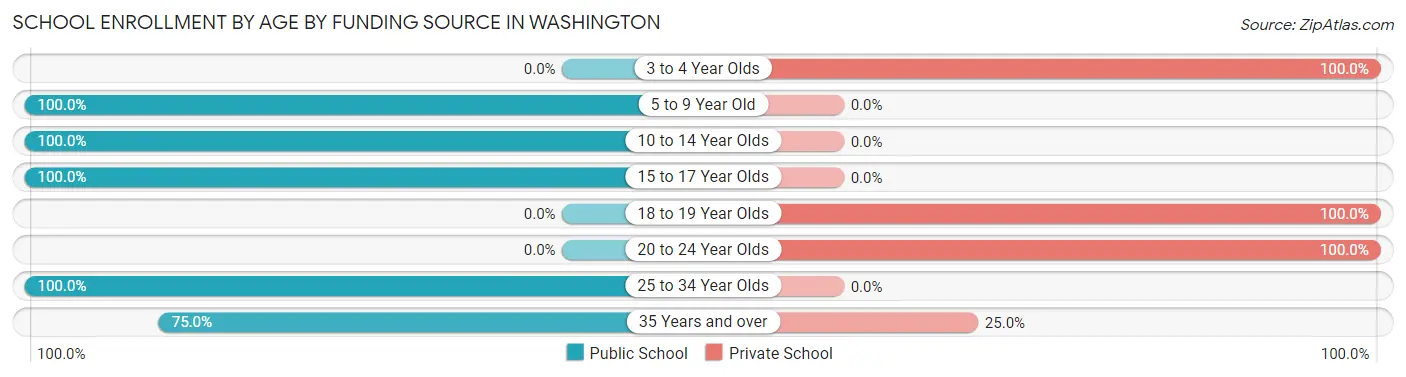
| Age Bracket | Public School | Private School |
| 3 to 4 Year Olds | 0 (0.0%) | 11 (100.0%) |
| 5 to 9 Year Old | 36 (100.0%) | 0 (0.0%) |
| 10 to 14 Year Olds | 11 (100.0%) | 0 (0.0%) |
| 15 to 17 Year Olds | 12 (100.0%) | 0 (0.0%) |
| 18 to 19 Year Olds | 0 (0.0%) | 1 (100.0%) |
| 20 to 24 Year Olds | 0 (0.0%) | 18 (100.0%) |
| 25 to 34 Year Olds | 15 (100.0%) | 0 (0.0%) |
| 35 Years and over | 3 (75.0%) | 1 (25.0%) |
| Total | 77 (71.3%) | 31 (28.7%) |
Educational Attainment by Field of Study in Washington
Business (28 | 51.8%), arts & humanities (13 | 24.1%), bio, nature & agricultural (4 | 7.4%), engineering (4 | 7.4%), and education (4 | 7.4%) are the most common fields of study among 54 individuals in Washington who have obtained a bachelor's degree or higher.

| Field of Study | # Graduates | % Graduates |
| Computers & Mathematics | 0 | 0.0% |
| Bio, Nature & Agricultural | 4 | 7.4% |
| Physical & Health Sciences | 0 | 0.0% |
| Psychology | 0 | 0.0% |
| Social Sciences | 0 | 0.0% |
| Engineering | 4 | 7.4% |
| Multidisciplinary Studies | 0 | 0.0% |
| Science & Technology | 0 | 0.0% |
| Business | 28 | 51.8% |
| Education | 4 | 7.4% |
| Literature & Languages | 0 | 0.0% |
| Liberal Arts & History | 1 | 1.8% |
| Visual & Performing Arts | 0 | 0.0% |
| Communications | 0 | 0.0% |
| Arts & Humanities | 13 | 24.1% |
| Total | 54 | 100.0% |
Transportation & Commute in Washington
Vehicle Availability by Sex in Washington
The most prevalent vehicle ownership categories in Washington are males with 2 vehicles (95, accounting for 61.3%) and females with 2 vehicles (53, making up 62.5%).
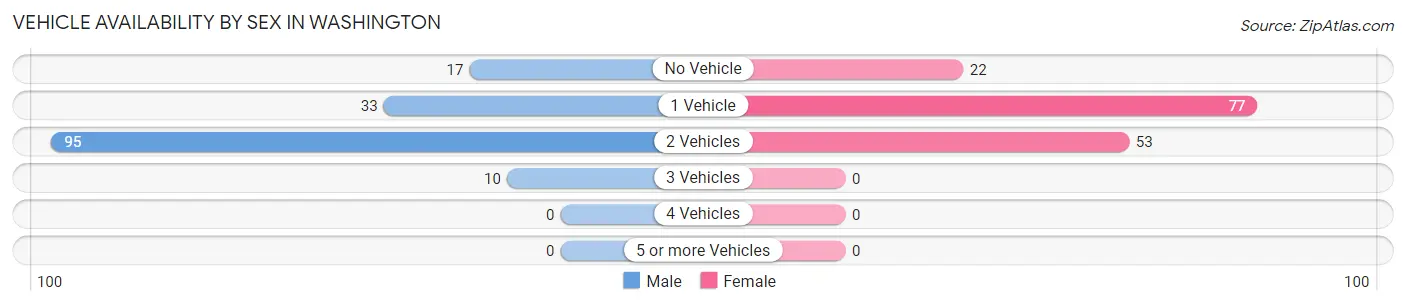
| Vehicles Available | Male | Female |
| No Vehicle | 17 (11.0%) | 22 (14.5%) |
| 1 Vehicle | 33 (21.3%) | 77 (50.7%) |
| 2 Vehicles | 95 (61.3%) | 53 (34.9%) |
| 3 Vehicles | 10 (6.5%) | 0 (0.0%) |
| 4 Vehicles | 0 (0.0%) | 0 (0.0%) |
| 5 or more Vehicles | 0 (0.0%) | 0 (0.0%) |
| Total | 155 (100.0%) | 152 (100.0%) |
Commute Time in Washington
The most frequently occuring commute durations in Washington are 90 or more minutes (100 commuters, 34.7%), 5 to 9 minutes (63 commuters, 21.9%), and 15 to 19 minutes (30 commuters, 10.4%).
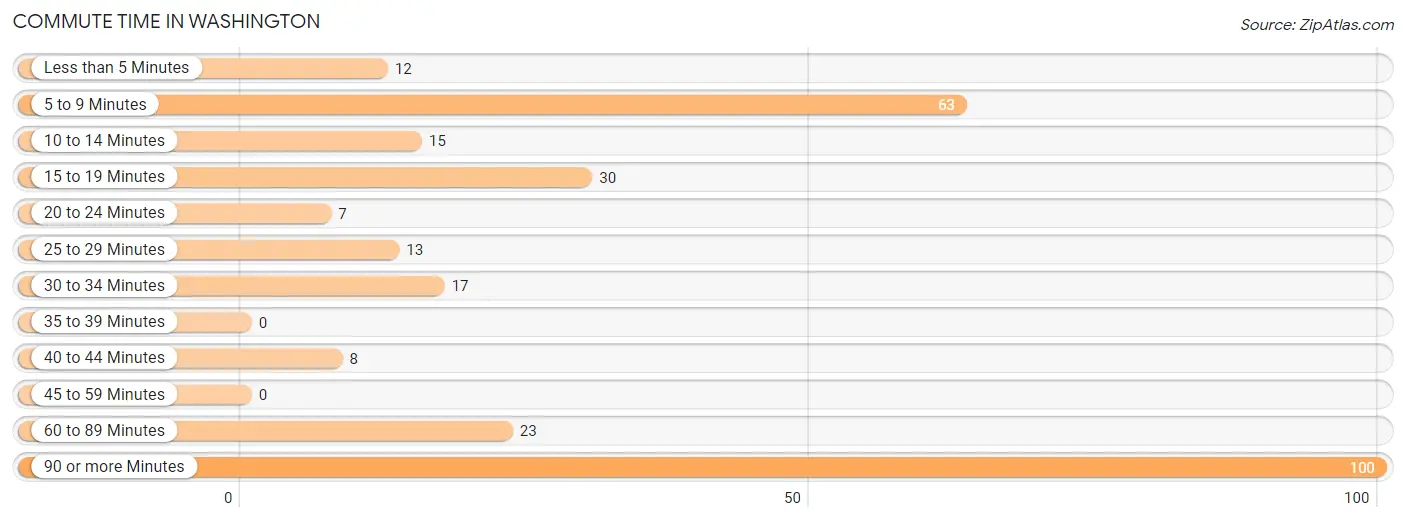
| Commute Time | # Commuters | % Commuters |
| Less than 5 Minutes | 12 | 4.2% |
| 5 to 9 Minutes | 63 | 21.9% |
| 10 to 14 Minutes | 15 | 5.2% |
| 15 to 19 Minutes | 30 | 10.4% |
| 20 to 24 Minutes | 7 | 2.4% |
| 25 to 29 Minutes | 13 | 4.5% |
| 30 to 34 Minutes | 17 | 5.9% |
| 35 to 39 Minutes | 0 | 0.0% |
| 40 to 44 Minutes | 8 | 2.8% |
| 45 to 59 Minutes | 0 | 0.0% |
| 60 to 89 Minutes | 23 | 8.0% |
| 90 or more Minutes | 100 | 34.7% |
Commute Time by Sex in Washington
The most common commute times in Washington are 90 or more minutes (91 commuters, 58.3%) for males and 5 to 9 minutes (55 commuters, 41.7%) for females.
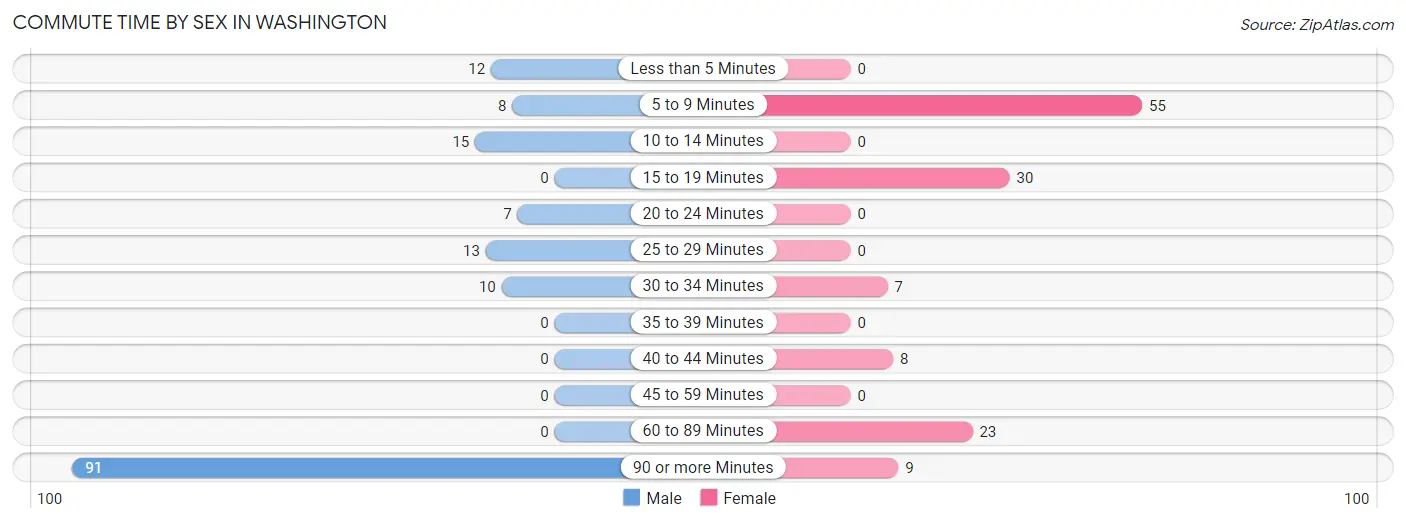
| Commute Time | Male | Female |
| Less than 5 Minutes | 12 (7.7%) | 0 (0.0%) |
| 5 to 9 Minutes | 8 (5.1%) | 55 (41.7%) |
| 10 to 14 Minutes | 15 (9.6%) | 0 (0.0%) |
| 15 to 19 Minutes | 0 (0.0%) | 30 (22.7%) |
| 20 to 24 Minutes | 7 (4.5%) | 0 (0.0%) |
| 25 to 29 Minutes | 13 (8.3%) | 0 (0.0%) |
| 30 to 34 Minutes | 10 (6.4%) | 7 (5.3%) |
| 35 to 39 Minutes | 0 (0.0%) | 0 (0.0%) |
| 40 to 44 Minutes | 0 (0.0%) | 8 (6.1%) |
| 45 to 59 Minutes | 0 (0.0%) | 0 (0.0%) |
| 60 to 89 Minutes | 0 (0.0%) | 23 (17.4%) |
| 90 or more Minutes | 91 (58.3%) | 9 (6.8%) |
Time of Departure to Work by Sex in Washington
The most frequent times of departure to work in Washington are 7:00 AM to 7:29 AM (73, 46.8%) for males and 8:00 AM to 8:29 AM (34, 25.8%) for females.
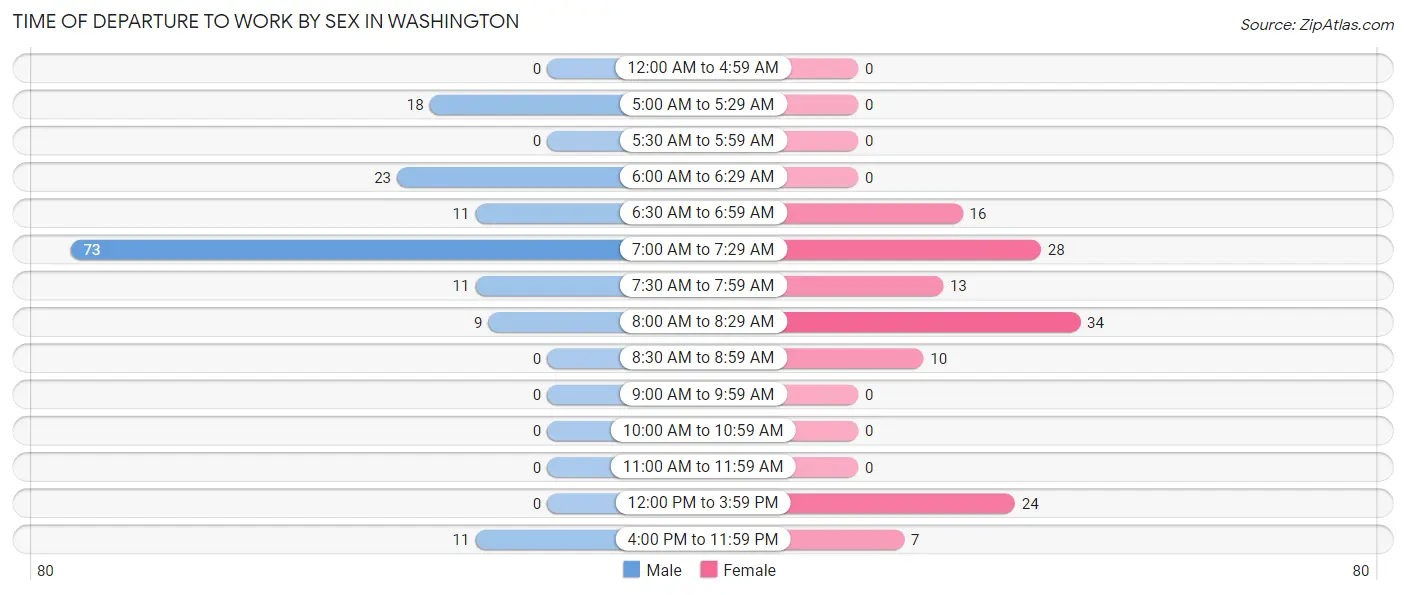
| Time of Departure | Male | Female |
| 12:00 AM to 4:59 AM | 0 (0.0%) | 0 (0.0%) |
| 5:00 AM to 5:29 AM | 18 (11.5%) | 0 (0.0%) |
| 5:30 AM to 5:59 AM | 0 (0.0%) | 0 (0.0%) |
| 6:00 AM to 6:29 AM | 23 (14.7%) | 0 (0.0%) |
| 6:30 AM to 6:59 AM | 11 (7.0%) | 16 (12.1%) |
| 7:00 AM to 7:29 AM | 73 (46.8%) | 28 (21.2%) |
| 7:30 AM to 7:59 AM | 11 (7.0%) | 13 (9.9%) |
| 8:00 AM to 8:29 AM | 9 (5.8%) | 34 (25.8%) |
| 8:30 AM to 8:59 AM | 0 (0.0%) | 10 (7.6%) |
| 9:00 AM to 9:59 AM | 0 (0.0%) | 0 (0.0%) |
| 10:00 AM to 10:59 AM | 0 (0.0%) | 0 (0.0%) |
| 11:00 AM to 11:59 AM | 0 (0.0%) | 0 (0.0%) |
| 12:00 PM to 3:59 PM | 0 (0.0%) | 24 (18.2%) |
| 4:00 PM to 11:59 PM | 11 (7.0%) | 7 (5.3%) |
| Total | 156 (100.0%) | 132 (100.0%) |
Housing Occupancy in Washington
Occupancy by Ownership in Washington
Of the total 359 dwellings in Washington, owner-occupied units account for 151 (42.1%), while renter-occupied units make up 208 (57.9%).
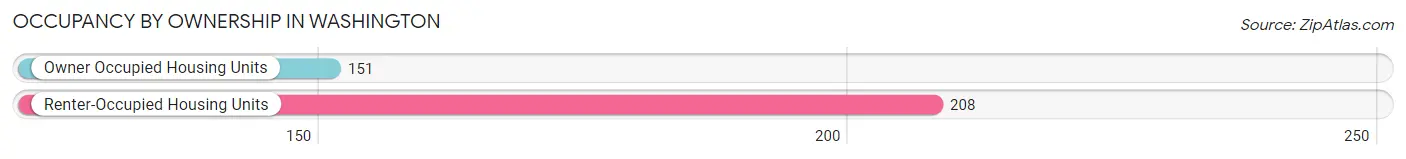
| Occupancy | # Housing Units | % Housing Units |
| Owner Occupied Housing Units | 151 | 42.1% |
| Renter-Occupied Housing Units | 208 | 57.9% |
| Total Occupied Housing Units | 359 | 100.0% |
Occupancy by Household Size in Washington
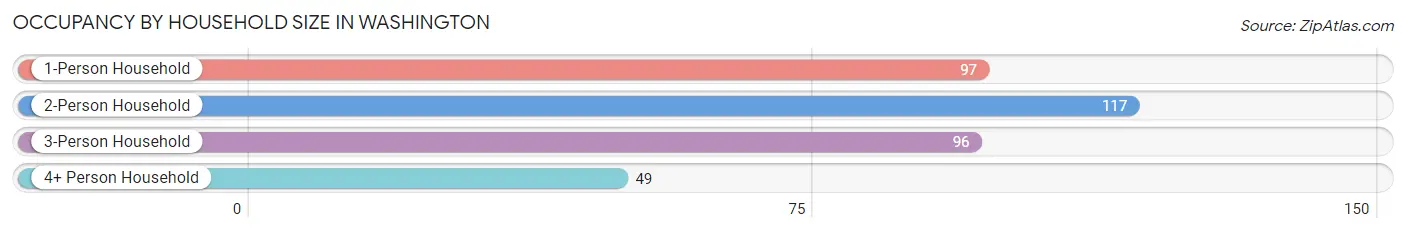
| Household Size | # Housing Units | % Housing Units |
| 1-Person Household | 97 | 27.0% |
| 2-Person Household | 117 | 32.6% |
| 3-Person Household | 96 | 26.7% |
| 4+ Person Household | 49 | 13.7% |
| Total Housing Units | 359 | 100.0% |
Occupancy by Ownership by Household Size in Washington
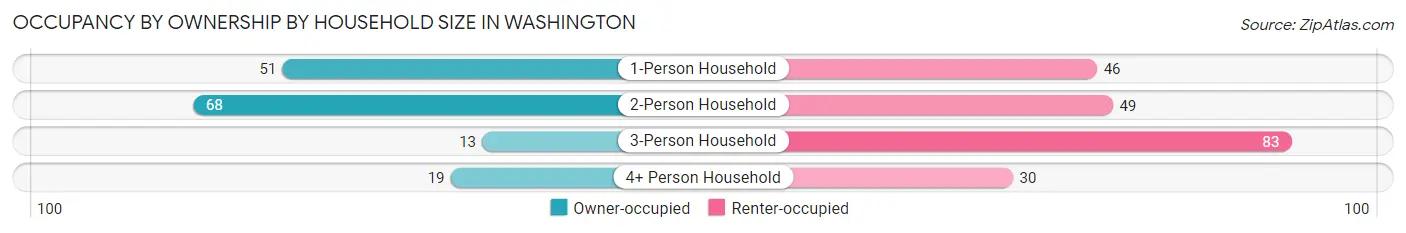
| Household Size | Owner-occupied | Renter-occupied |
| 1-Person Household | 51 (52.6%) | 46 (47.4%) |
| 2-Person Household | 68 (58.1%) | 49 (41.9%) |
| 3-Person Household | 13 (13.5%) | 83 (86.5%) |
| 4+ Person Household | 19 (38.8%) | 30 (61.2%) |
| Total Housing Units | 151 (42.1%) | 208 (57.9%) |
Occupancy by Educational Attainment in Washington
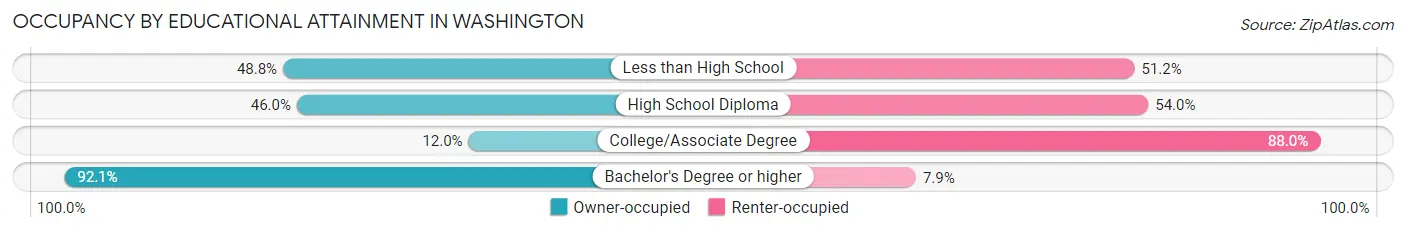
| Household Size | Owner-occupied | Renter-occupied |
| Less than High School | 40 (48.8%) | 42 (51.2%) |
| High School Diploma | 64 (46.0%) | 75 (54.0%) |
| College/Associate Degree | 12 (12.0%) | 88 (88.0%) |
| Bachelor's Degree or higher | 35 (92.1%) | 3 (7.9%) |
Occupancy by Age of Householder in Washington
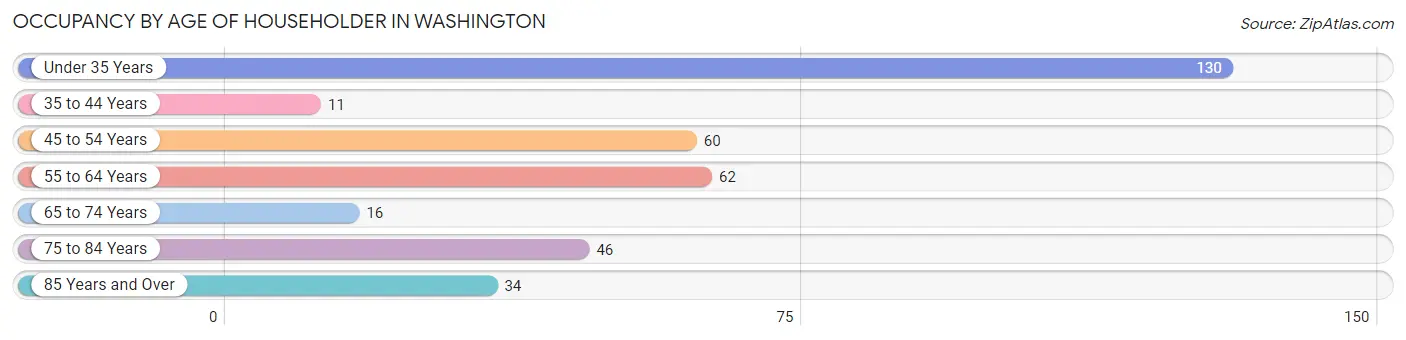
| Age Bracket | # Households | % Households |
| Under 35 Years | 130 | 36.2% |
| 35 to 44 Years | 11 | 3.1% |
| 45 to 54 Years | 60 | 16.7% |
| 55 to 64 Years | 62 | 17.3% |
| 65 to 74 Years | 16 | 4.5% |
| 75 to 84 Years | 46 | 12.8% |
| 85 Years and Over | 34 | 9.5% |
| Total | 359 | 100.0% |
Housing Finances in Washington
Median Income by Occupancy in Washington
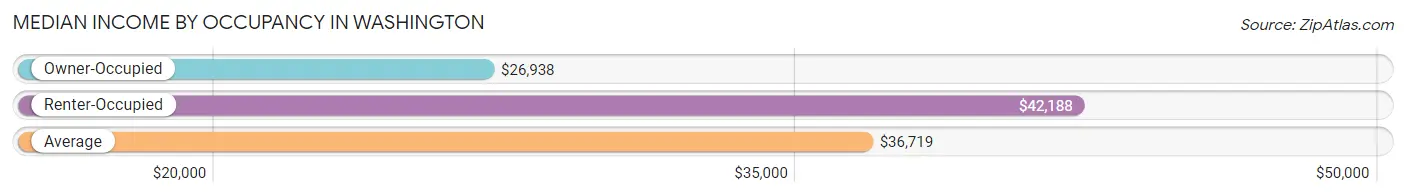
| Occupancy Type | # Households | Median Income |
| Owner-Occupied | 151 (42.1%) | $26,938 |
| Renter-Occupied | 208 (57.9%) | $42,188 |
| Average | 359 (100.0%) | $36,719 |
Occupancy by Householder Income Bracket in Washington
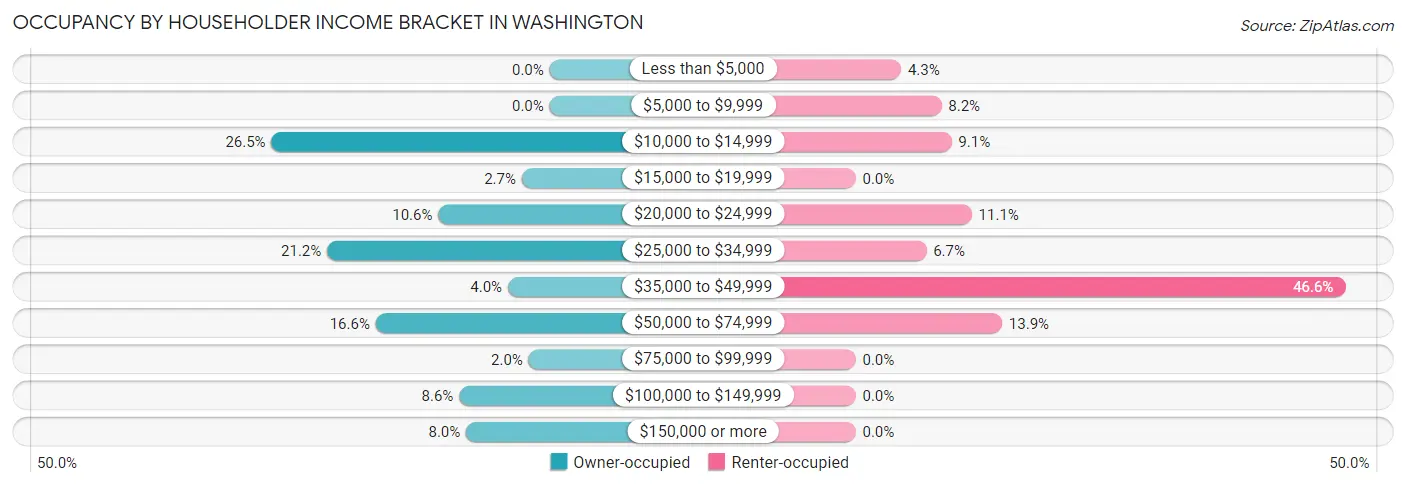
| Income Bracket | Owner-occupied | Renter-occupied |
| Less than $5,000 | 0 (0.0%) | 9 (4.3%) |
| $5,000 to $9,999 | 0 (0.0%) | 17 (8.2%) |
| $10,000 to $14,999 | 40 (26.5%) | 19 (9.1%) |
| $15,000 to $19,999 | 4 (2.6%) | 0 (0.0%) |
| $20,000 to $24,999 | 16 (10.6%) | 23 (11.1%) |
| $25,000 to $34,999 | 32 (21.2%) | 14 (6.7%) |
| $35,000 to $49,999 | 6 (4.0%) | 97 (46.6%) |
| $50,000 to $74,999 | 25 (16.6%) | 29 (13.9%) |
| $75,000 to $99,999 | 3 (2.0%) | 0 (0.0%) |
| $100,000 to $149,999 | 13 (8.6%) | 0 (0.0%) |
| $150,000 or more | 12 (8.0%) | 0 (0.0%) |
| Total | 151 (100.0%) | 208 (100.0%) |
Monthly Housing Cost Tiers in Washington
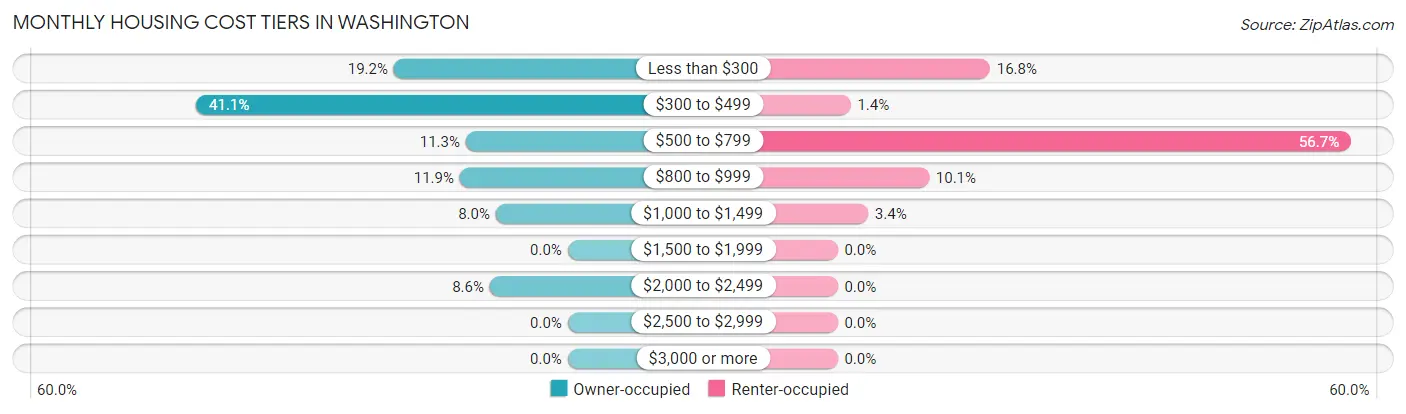
| Monthly Cost | Owner-occupied | Renter-occupied |
| Less than $300 | 29 (19.2%) | 35 (16.8%) |
| $300 to $499 | 62 (41.1%) | 3 (1.4%) |
| $500 to $799 | 17 (11.3%) | 118 (56.7%) |
| $800 to $999 | 18 (11.9%) | 21 (10.1%) |
| $1,000 to $1,499 | 12 (8.0%) | 7 (3.4%) |
| $1,500 to $1,999 | 0 (0.0%) | 0 (0.0%) |
| $2,000 to $2,499 | 13 (8.6%) | 0 (0.0%) |
| $2,500 to $2,999 | 0 (0.0%) | 0 (0.0%) |
| $3,000 or more | 0 (0.0%) | 0 (0.0%) |
| Total | 151 (100.0%) | 208 (100.0%) |
Physical Housing Characteristics in Washington
Housing Structures in Washington
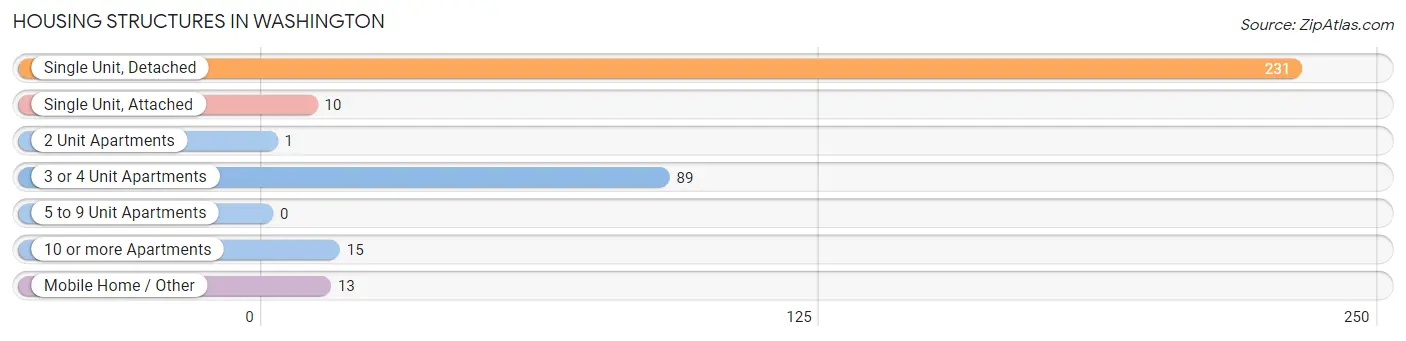
| Structure Type | # Housing Units | % Housing Units |
| Single Unit, Detached | 231 | 64.3% |
| Single Unit, Attached | 10 | 2.8% |
| 2 Unit Apartments | 1 | 0.3% |
| 3 or 4 Unit Apartments | 89 | 24.8% |
| 5 to 9 Unit Apartments | 0 | 0.0% |
| 10 or more Apartments | 15 | 4.2% |
| Mobile Home / Other | 13 | 3.6% |
| Total | 359 | 100.0% |
Housing Structures by Occupancy in Washington
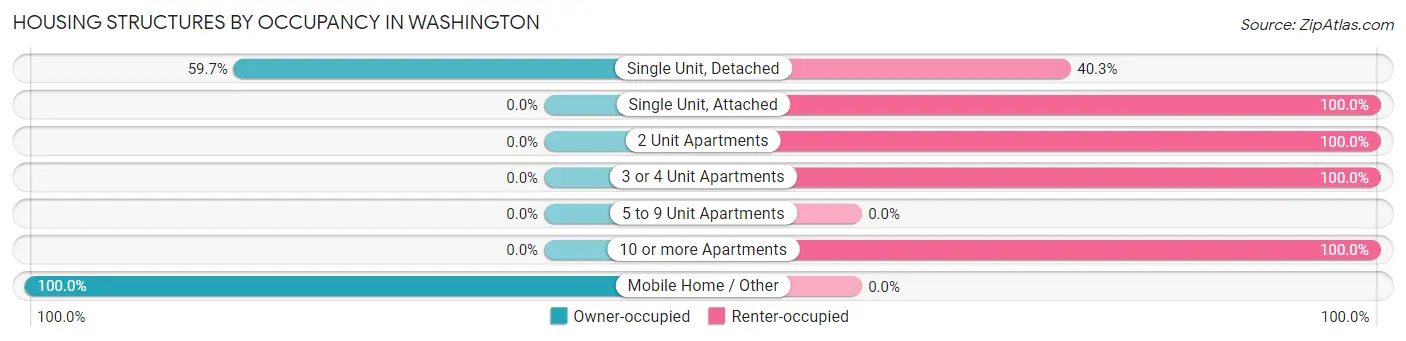
| Structure Type | Owner-occupied | Renter-occupied |
| Single Unit, Detached | 138 (59.7%) | 93 (40.3%) |
| Single Unit, Attached | 0 (0.0%) | 10 (100.0%) |
| 2 Unit Apartments | 0 (0.0%) | 1 (100.0%) |
| 3 or 4 Unit Apartments | 0 (0.0%) | 89 (100.0%) |
| 5 to 9 Unit Apartments | 0 (0.0%) | 0 (0.0%) |
| 10 or more Apartments | 0 (0.0%) | 15 (100.0%) |
| Mobile Home / Other | 13 (100.0%) | 0 (0.0%) |
| Total | 151 (42.1%) | 208 (57.9%) |
Housing Structures by Number of Rooms in Washington
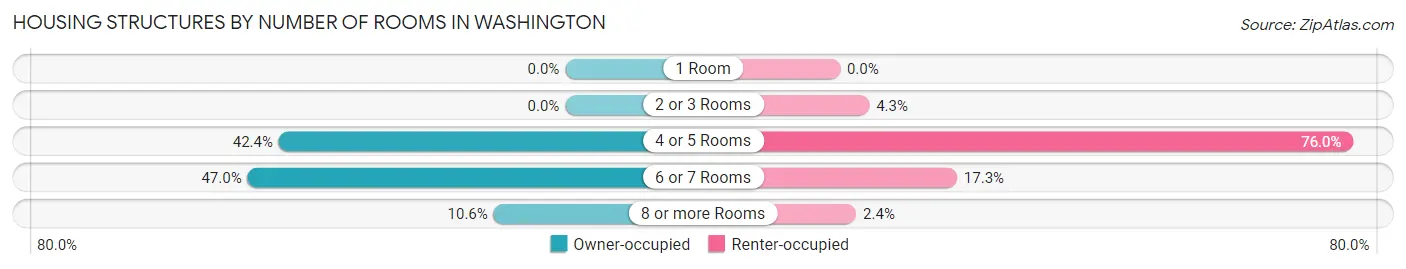
| Number of Rooms | Owner-occupied | Renter-occupied |
| 1 Room | 0 (0.0%) | 0 (0.0%) |
| 2 or 3 Rooms | 0 (0.0%) | 9 (4.3%) |
| 4 or 5 Rooms | 64 (42.4%) | 158 (76.0%) |
| 6 or 7 Rooms | 71 (47.0%) | 36 (17.3%) |
| 8 or more Rooms | 16 (10.6%) | 5 (2.4%) |
| Total | 151 (100.0%) | 208 (100.0%) |
Housing Structure by Heating Type in Washington
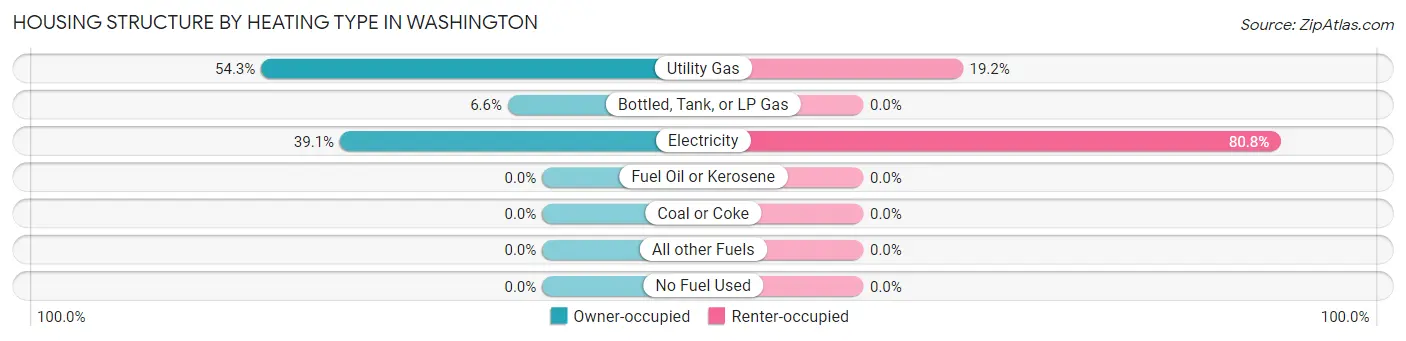
| Heating Type | Owner-occupied | Renter-occupied |
| Utility Gas | 82 (54.3%) | 40 (19.2%) |
| Bottled, Tank, or LP Gas | 10 (6.6%) | 0 (0.0%) |
| Electricity | 59 (39.1%) | 168 (80.8%) |
| Fuel Oil or Kerosene | 0 (0.0%) | 0 (0.0%) |
| Coal or Coke | 0 (0.0%) | 0 (0.0%) |
| All other Fuels | 0 (0.0%) | 0 (0.0%) |
| No Fuel Used | 0 (0.0%) | 0 (0.0%) |
| Total | 151 (100.0%) | 208 (100.0%) |
Household Vehicle Usage in Washington
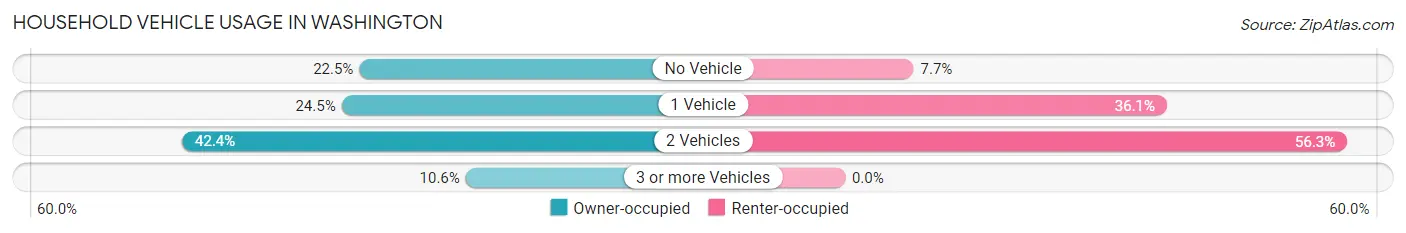
| Vehicles per Household | Owner-occupied | Renter-occupied |
| No Vehicle | 34 (22.5%) | 16 (7.7%) |
| 1 Vehicle | 37 (24.5%) | 75 (36.1%) |
| 2 Vehicles | 64 (42.4%) | 117 (56.2%) |
| 3 or more Vehicles | 16 (10.6%) | 0 (0.0%) |
| Total | 151 (100.0%) | 208 (100.0%) |
Real Estate & Mortgages in Washington
Real Estate and Mortgage Overview in Washington
| Characteristic | Without Mortgage | With Mortgage |
| Housing Units | 118 | 33 |
| Median Property Value | $116,700 | $0 |
| Median Household Income | $22,344 | $12 |
| Monthly Housing Costs | $345 | $0 |
| Real Estate Taxes | - | - |
Property Value by Mortgage Status in Washington
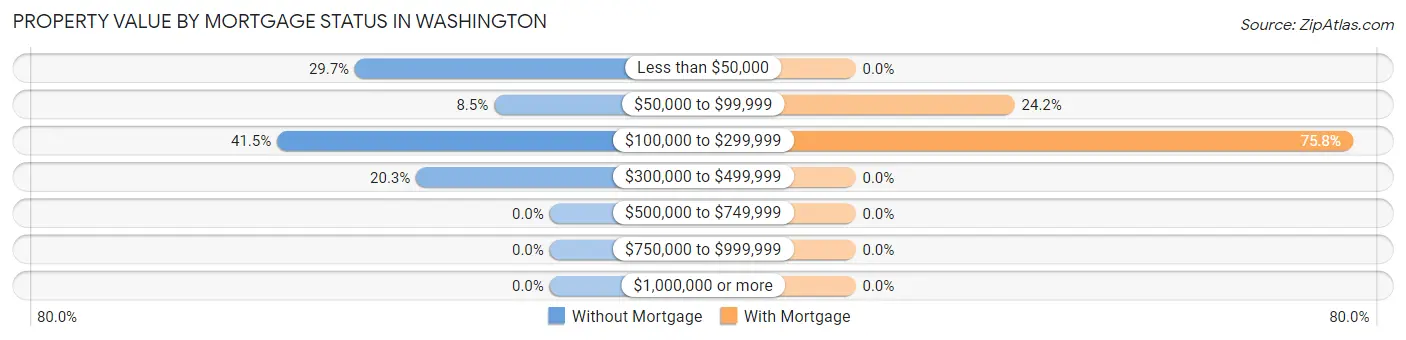
| Property Value | Without Mortgage | With Mortgage |
| Less than $50,000 | 35 (29.7%) | 0 (0.0%) |
| $50,000 to $99,999 | 10 (8.5%) | 8 (24.2%) |
| $100,000 to $299,999 | 49 (41.5%) | 25 (75.8%) |
| $300,000 to $499,999 | 24 (20.3%) | 0 (0.0%) |
| $500,000 to $749,999 | 0 (0.0%) | 0 (0.0%) |
| $750,000 to $999,999 | 0 (0.0%) | 0 (0.0%) |
| $1,000,000 or more | 0 (0.0%) | 0 (0.0%) |
| Total | 118 (100.0%) | 33 (100.0%) |
Household Income by Mortgage Status in Washington
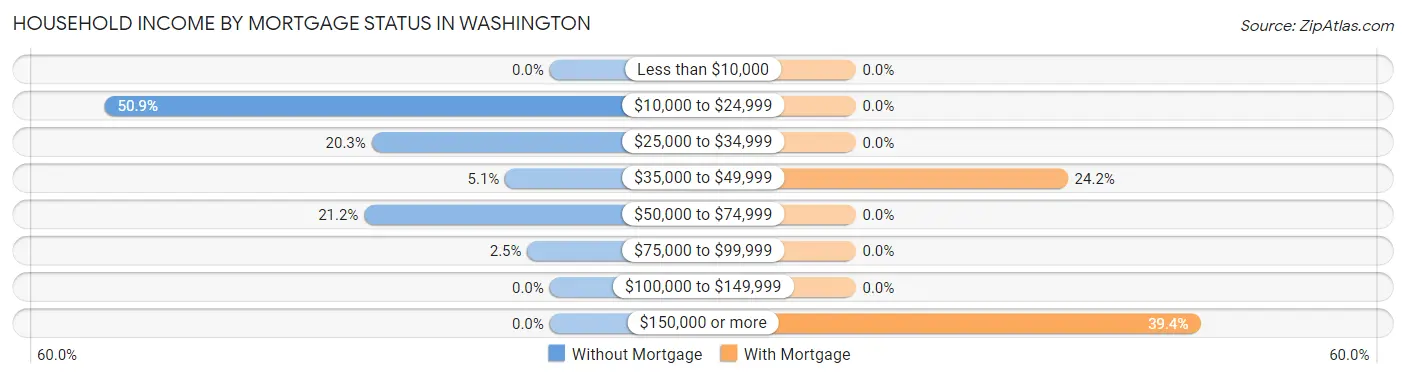
| Household Income | Without Mortgage | With Mortgage |
| Less than $10,000 | 0 (0.0%) | 0 (0.0%) |
| $10,000 to $24,999 | 60 (50.8%) | 0 (0.0%) |
| $25,000 to $34,999 | 24 (20.3%) | 0 (0.0%) |
| $35,000 to $49,999 | 6 (5.1%) | 8 (24.2%) |
| $50,000 to $74,999 | 25 (21.2%) | 0 (0.0%) |
| $75,000 to $99,999 | 3 (2.5%) | 0 (0.0%) |
| $100,000 to $149,999 | 0 (0.0%) | 0 (0.0%) |
| $150,000 or more | 0 (0.0%) | 13 (39.4%) |
| Total | 118 (100.0%) | 33 (100.0%) |
Property Value to Household Income Ratio in Washington
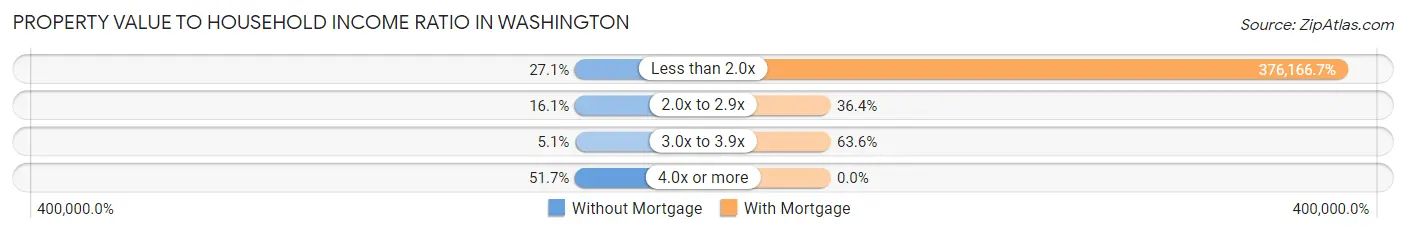
| Value-to-Income Ratio | Without Mortgage | With Mortgage |
| Less than 2.0x | 32 (27.1%) | 124,135 (376,166.7%) |
| 2.0x to 2.9x | 19 (16.1%) | 12 (36.4%) |
| 3.0x to 3.9x | 6 (5.1%) | 21 (63.6%) |
| 4.0x or more | 61 (51.7%) | 0 (0.0%) |
| Total | 118 (100.0%) | 33 (100.0%) |
Real Estate Taxes by Mortgage Status in Washington
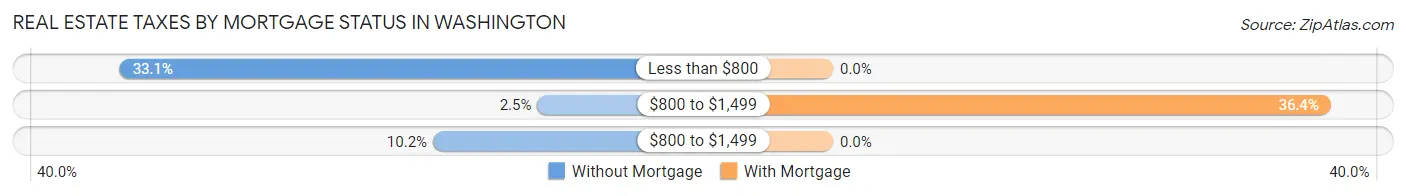
| Property Taxes | Without Mortgage | With Mortgage |
| Less than $800 | 39 (33.1%) | 0 (0.0%) |
| $800 to $1,499 | 3 (2.5%) | 12 (36.4%) |
| $800 to $1,499 | 12 (10.2%) | 0 (0.0%) |
| Total | 118 (100.0%) | 33 (100.0%) |
Health & Disability in Washington
Health Insurance Coverage by Age in Washington
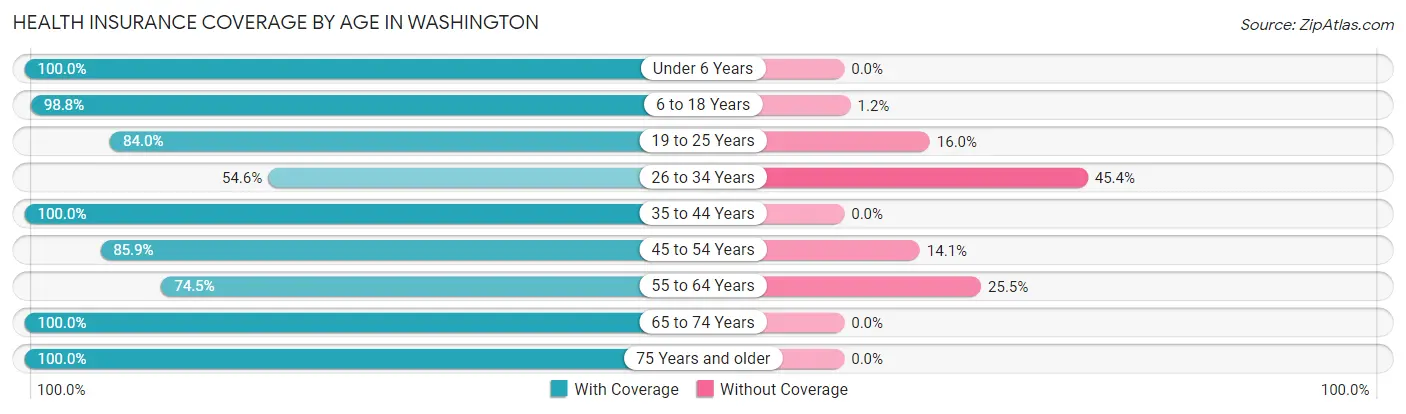
| Age Bracket | With Coverage | Without Coverage |
| Under 6 Years | 147 (100.0%) | 0 (0.0%) |
| 6 to 18 Years | 84 (98.8%) | 1 (1.2%) |
| 19 to 25 Years | 79 (84.0%) | 15 (16.0%) |
| 26 to 34 Years | 89 (54.6%) | 74 (45.4%) |
| 35 to 44 Years | 11 (100.0%) | 0 (0.0%) |
| 45 to 54 Years | 67 (85.9%) | 11 (14.1%) |
| 55 to 64 Years | 73 (74.5%) | 25 (25.5%) |
| 65 to 74 Years | 60 (100.0%) | 0 (0.0%) |
| 75 Years and older | 83 (100.0%) | 0 (0.0%) |
| Total | 693 (84.6%) | 126 (15.4%) |
Health Insurance Coverage by Citizenship Status in Washington
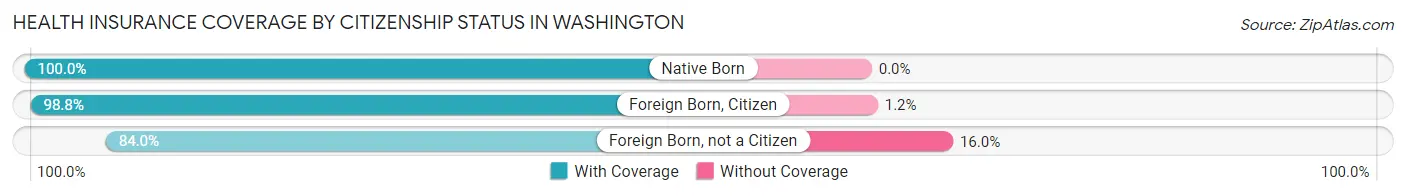
| Citizenship Status | With Coverage | Without Coverage |
| Native Born | 147 (100.0%) | 0 (0.0%) |
| Foreign Born, Citizen | 84 (98.8%) | 1 (1.2%) |
| Foreign Born, not a Citizen | 79 (84.0%) | 15 (16.0%) |
Health Insurance Coverage by Household Income in Washington
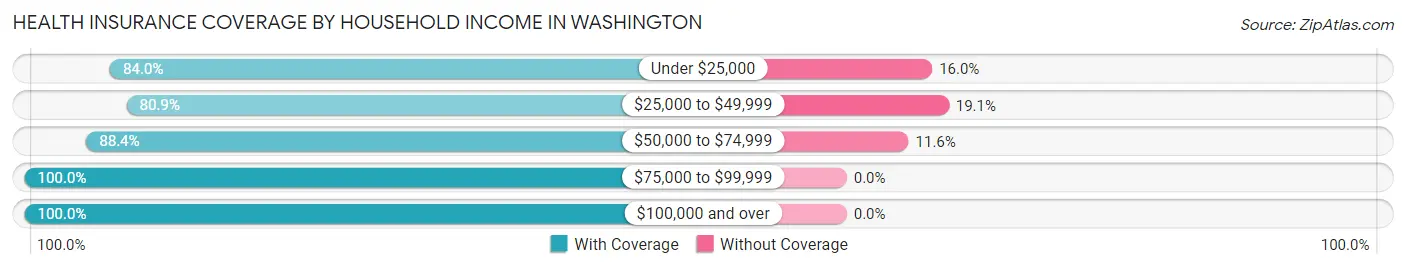
| Household Income | With Coverage | Without Coverage |
| Under $25,000 | 210 (84.0%) | 40 (16.0%) |
| $25,000 to $49,999 | 309 (80.9%) | 73 (19.1%) |
| $50,000 to $74,999 | 84 (88.4%) | 11 (11.6%) |
| $75,000 to $99,999 | 7 (100.0%) | 0 (0.0%) |
| $100,000 and over | 80 (100.0%) | 0 (0.0%) |
Public vs Private Health Insurance Coverage by Age in Washington
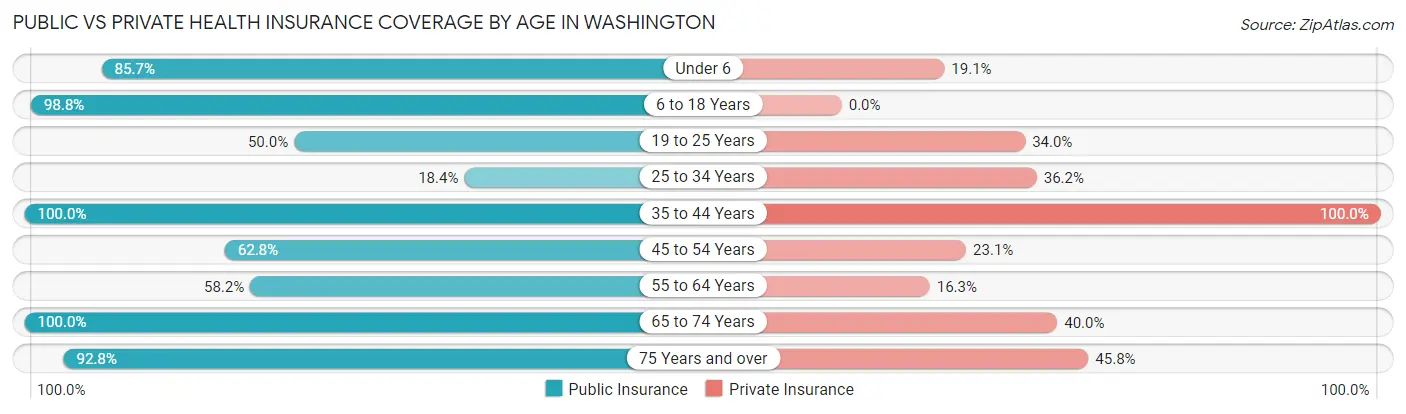
| Age Bracket | Public Insurance | Private Insurance |
| Under 6 | 126 (85.7%) | 28 (19.1%) |
| 6 to 18 Years | 84 (98.8%) | 0 (0.0%) |
| 19 to 25 Years | 47 (50.0%) | 32 (34.0%) |
| 25 to 34 Years | 30 (18.4%) | 59 (36.2%) |
| 35 to 44 Years | 11 (100.0%) | 11 (100.0%) |
| 45 to 54 Years | 49 (62.8%) | 18 (23.1%) |
| 55 to 64 Years | 57 (58.2%) | 16 (16.3%) |
| 65 to 74 Years | 60 (100.0%) | 24 (40.0%) |
| 75 Years and over | 77 (92.8%) | 38 (45.8%) |
| Total | 541 (66.1%) | 226 (27.6%) |
Disability Status by Sex by Age in Washington
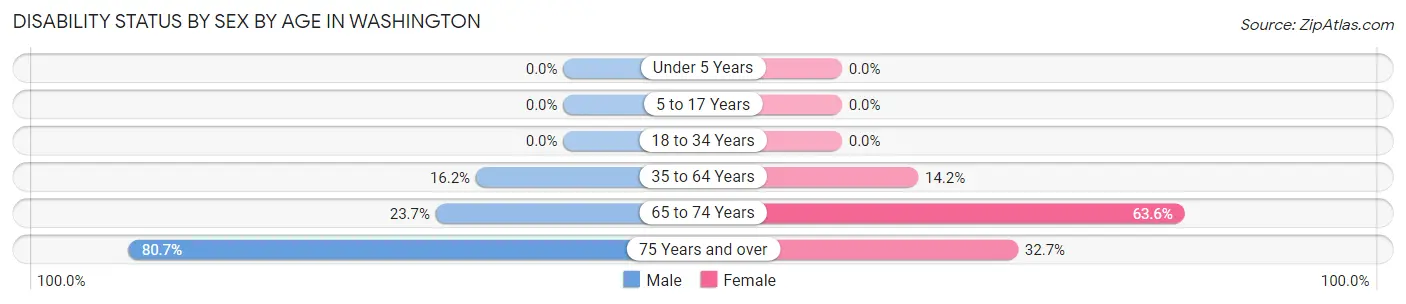
| Age Bracket | Male | Female |
| Under 5 Years | 0 (0.0%) | 0 (0.0%) |
| 5 to 17 Years | 0 (0.0%) | 0 (0.0%) |
| 18 to 34 Years | 0 (0.0%) | 0 (0.0%) |
| 35 to 64 Years | 12 (16.2%) | 16 (14.2%) |
| 65 to 74 Years | 9 (23.7%) | 14 (63.6%) |
| 75 Years and over | 25 (80.6%) | 17 (32.7%) |
Disability Class by Sex by Age in Washington
Disability Class: Hearing Difficulty
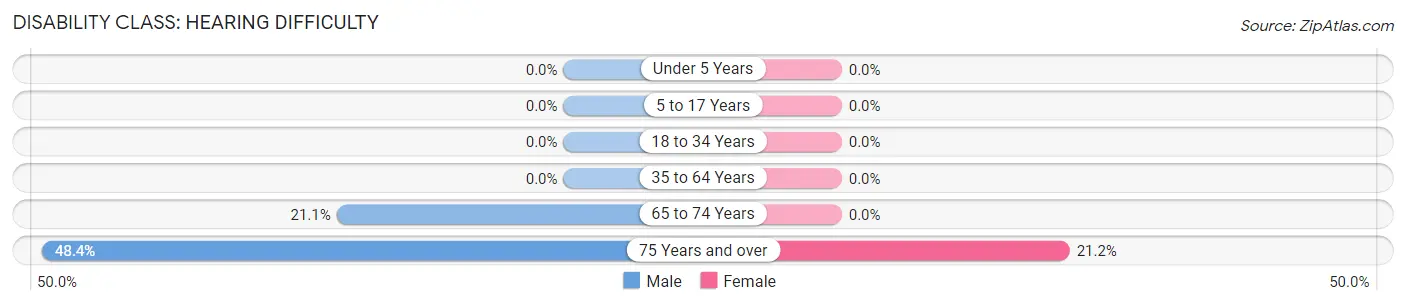
| Age Bracket | Male | Female |
| Under 5 Years | 0 (0.0%) | 0 (0.0%) |
| 5 to 17 Years | 0 (0.0%) | 0 (0.0%) |
| 18 to 34 Years | 0 (0.0%) | 0 (0.0%) |
| 35 to 64 Years | 0 (0.0%) | 0 (0.0%) |
| 65 to 74 Years | 8 (21.0%) | 0 (0.0%) |
| 75 Years and over | 15 (48.4%) | 11 (21.1%) |
Disability Class: Vision Difficulty
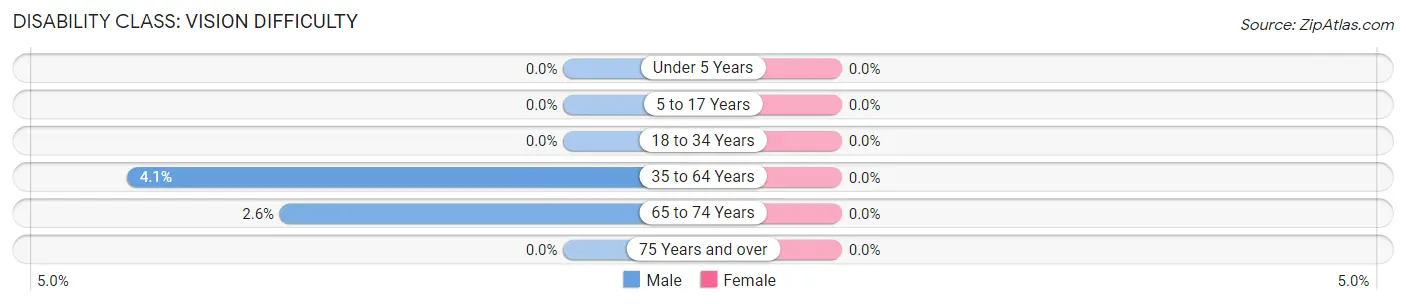
| Age Bracket | Male | Female |
| Under 5 Years | 0 (0.0%) | 0 (0.0%) |
| 5 to 17 Years | 0 (0.0%) | 0 (0.0%) |
| 18 to 34 Years | 0 (0.0%) | 0 (0.0%) |
| 35 to 64 Years | 3 (4.1%) | 0 (0.0%) |
| 65 to 74 Years | 1 (2.6%) | 0 (0.0%) |
| 75 Years and over | 0 (0.0%) | 0 (0.0%) |
Disability Class: Cognitive Difficulty
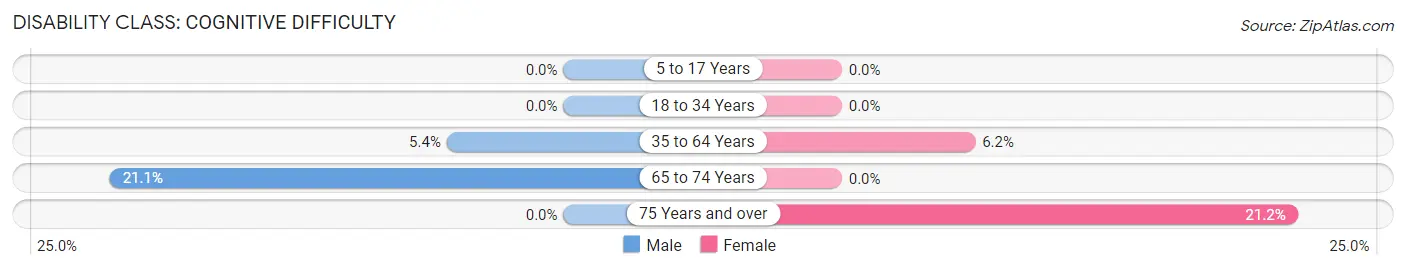
| Age Bracket | Male | Female |
| 5 to 17 Years | 0 (0.0%) | 0 (0.0%) |
| 18 to 34 Years | 0 (0.0%) | 0 (0.0%) |
| 35 to 64 Years | 4 (5.4%) | 7 (6.2%) |
| 65 to 74 Years | 8 (21.0%) | 0 (0.0%) |
| 75 Years and over | 0 (0.0%) | 11 (21.1%) |
Disability Class: Ambulatory Difficulty
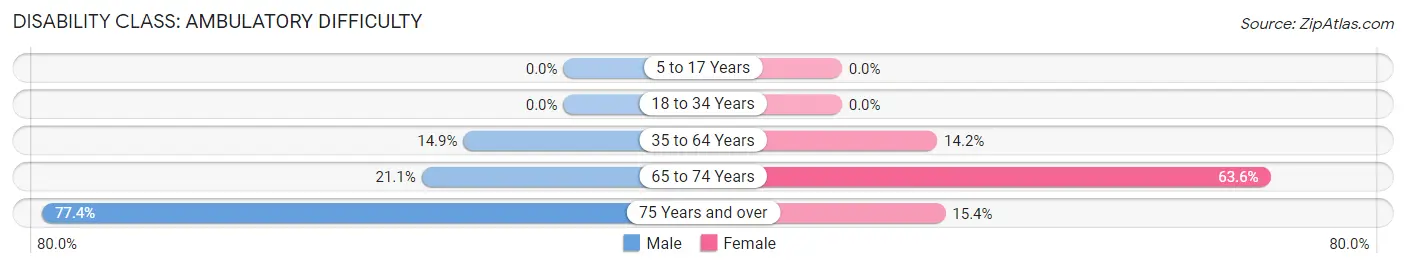
| Age Bracket | Male | Female |
| 5 to 17 Years | 0 (0.0%) | 0 (0.0%) |
| 18 to 34 Years | 0 (0.0%) | 0 (0.0%) |
| 35 to 64 Years | 11 (14.9%) | 16 (14.2%) |
| 65 to 74 Years | 8 (21.0%) | 14 (63.6%) |
| 75 Years and over | 24 (77.4%) | 8 (15.4%) |
Disability Class: Self-Care Difficulty
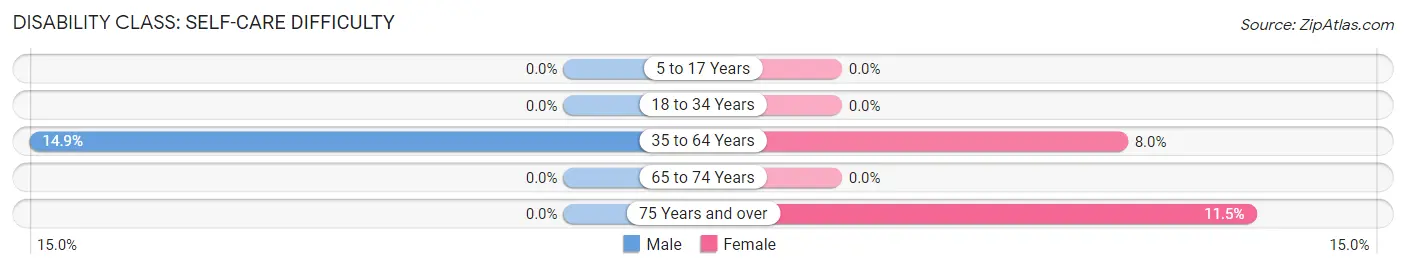
| Age Bracket | Male | Female |
| 5 to 17 Years | 0 (0.0%) | 0 (0.0%) |
| 18 to 34 Years | 0 (0.0%) | 0 (0.0%) |
| 35 to 64 Years | 11 (14.9%) | 9 (8.0%) |
| 65 to 74 Years | 0 (0.0%) | 0 (0.0%) |
| 75 Years and over | 0 (0.0%) | 6 (11.5%) |
Technology Access in Washington
Computing Device Access in Washington
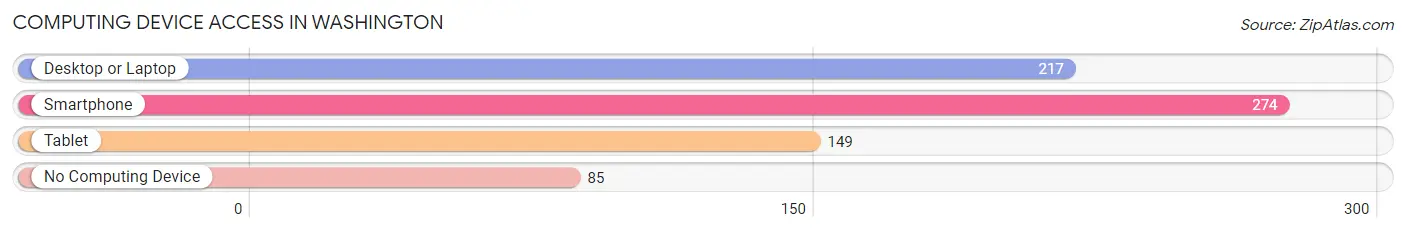
| Device Type | # Households | % Households |
| Desktop or Laptop | 217 | 60.5% |
| Smartphone | 274 | 76.3% |
| Tablet | 149 | 41.5% |
| No Computing Device | 85 | 23.7% |
| Total | 359 | 100.0% |
Internet Access in Washington
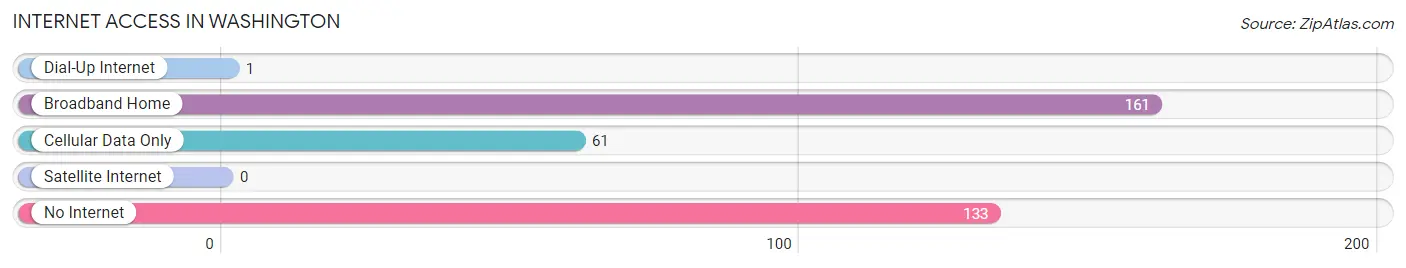
| Internet Type | # Households | % Households |
| Dial-Up Internet | 1 | 0.3% |
| Broadband Home | 161 | 44.9% |
| Cellular Data Only | 61 | 17.0% |
| Satellite Internet | 0 | 0.0% |
| No Internet | 133 | 37.0% |
| Total | 359 | 100.0% |
Washington Summary
Washington is a state located in the Pacific Northwest region of the United States. It is bordered by Oregon to the south, Idaho to the east, and the Canadian province of British Columbia to the north. Washington is the 18th largest state in the United States, with an area of 71,362 square miles, and the 13th most populous state, with a population of 7.4 million as of 2019. The state capital is Olympia, and the largest city is Seattle.
History
The area that is now Washington was first inhabited by Native American tribes, including the Chinook, Nisqually, and Klickitat. The first European to explore the area was British explorer George Vancouver in 1792. The area was part of the Oregon Country, a disputed region between the United States and Great Britain, until 1846 when the Oregon Treaty established the 49th parallel as the border between the two countries.
In 1853, Washington Territory was established, and in 1889, it was admitted to the Union as the 42nd state. During the late 19th and early 20th centuries, Washington experienced rapid population growth due to the influx of settlers from the East Coast and immigrants from Europe. This growth was fueled by the development of the timber, fishing, and mining industries.
Geography
Washington is located in the Pacific Northwest region of the United States. It is bordered by Oregon to the south, Idaho to the east, and the Canadian province of British Columbia to the north. The state has a total area of 71,362 square miles, making it the 18th largest state in the country.
Washington is divided into three distinct geographic regions: the Cascade Mountains, the Columbia Plateau, and the Olympic Peninsula. The Cascade Mountains run through the western part of the state and are home to several active volcanoes, including Mount Rainier, the highest peak in the state. The Columbia Plateau is located in the eastern part of the state and is characterized by rolling hills and grasslands. The Olympic Peninsula is located in the northwest corner of the state and is home to temperate rainforests and rugged coastline.
Economy
Washington has a diverse economy that is driven by the technology, manufacturing, and agricultural sectors. The state is home to several major companies, including Microsoft, Amazon, Boeing, and Starbucks.
The state’s agricultural sector is the largest in the country, producing apples, wheat, potatoes, and other crops. The state is also a major producer of timber, and the lumber industry is a major contributor to the state’s economy.
The technology sector is a major driver of the state’s economy, with Seattle being home to several major tech companies, including Microsoft, Amazon, and Expedia. The state is also home to several major aerospace companies, including Boeing and Lockheed Martin.
Demographics
As of 2019, the population of Washington was estimated to be 7.4 million. The state is ethnically diverse, with the largest ethnic groups being White (77.2%), Hispanic or Latino (11.2%), and Asian (7.2%).
The median household income in Washington is $71,835, and the median home value is $395,000. The state has a poverty rate of 11.2%, and the unemployment rate is 4.3%.
Conclusion
Washington is a state located in the Pacific Northwest region of the United States. It is bordered by Oregon to the south, Idaho to the east, and the Canadian province of British Columbia to the north. The state has a diverse geography, with the Cascade Mountains, the Columbia Plateau, and the Olympic Peninsula all located within its borders. The state has a diverse economy that is driven by the technology, manufacturing, and agricultural sectors. The population of Washington is estimated to be 7.4 million, and the state is ethnically diverse, with the largest ethnic groups being White, Hispanic or Latino, and Asian.
Common Questions
What is Per Capita Income in Washington?
Per Capita income in Washington is $17,601.
What is the Median Family Income in Washington?
Median Family Income in Washington is $24,628.
What is the Median Household income in Washington?
Median Household Income in Washington is $36,719.
What is Income or Wage Gap in Washington?
Income or Wage Gap in Washington is 11.8%.
Women in Washington earn 88.2 cents for every dollar earned by a man.
What is Inequality or Gini Index in Washington?
Inequality or Gini Index in Washington is 0.40.
What is the Total Population of Washington?
Total Population of Washington is 819.
What is the Total Male Population of Washington?
Total Male Population of Washington is 347.
What is the Total Female Population of Washington?
Total Female Population of Washington is 472.
What is the Ratio of Males per 100 Females in Washington?
There are 73.52 Males per 100 Females in Washington.
What is the Ratio of Females per 100 Males in Washington?
There are 136.02 Females per 100 Males in Washington.
What is the Median Population Age in Washington?
Median Population Age in Washington is 26.6 Years.
What is the Average Family Size in Washington
Average Family Size in Washington is 2.5 People.
What is the Average Household Size in Washington
Average Household Size in Washington is 2.3 People.
How Large is the Labor Force in Washington?
There are 341 People in the Labor Forcein in Washington.
What is the Percentage of People in the Labor Force in Washington?
54.6% of People are in the Labor Force in Washington.