St Martinville, LA Map & Demographics
St Martinville Map
St Martinville Overview
$28,470
PER CAPITA INCOME
$36,692
AVG FAMILY INCOME
$32,781
AVG HOUSEHOLD INCOME
5.2%
WAGE / INCOME GAP [ % ]
94.8¢/ $1
WAGE / INCOME GAP [ $ ]
$7,315
FAMILY INCOME DEFICIT
0.51
INEQUALITY / GINI INDEX
5,447
TOTAL POPULATION
2,594
MALE POPULATION
2,853
FEMALE POPULATION
90.92
MALES / 100 FEMALES
109.98
FEMALES / 100 MALES
48.5
MEDIAN AGE
2.6
AVG FAMILY SIZE
1.9
AVG HOUSEHOLD SIZE
2,595
LABOR FORCE [ PEOPLE ]
52.9%
PERCENT IN LABOR FORCE
15.9%
UNEMPLOYMENT RATE
Income in St Martinville
Income Overview in St Martinville
Per Capita Income in St Martinville is $28,470, while median incomes of families and households are $36,692 and $32,781 respectively.
| Characteristic | Number | Measure |
| Per Capita Income | 5,447 | $28,470 |
| Median Family Income | 1,347 | $36,692 |
| Mean Family Income | 1,347 | $71,503 |
| Median Household Income | 2,803 | $32,781 |
| Mean Household Income | 2,803 | $53,709 |
| Income Deficit | 1,347 | $7,315 |
| Wage / Income Gap (%) | 5,447 | 5.24% |
| Wage / Income Gap ($) | 5,447 | 94.76¢ per $1 |
| Gini / Inequality Index | 5,447 | 0.51 |
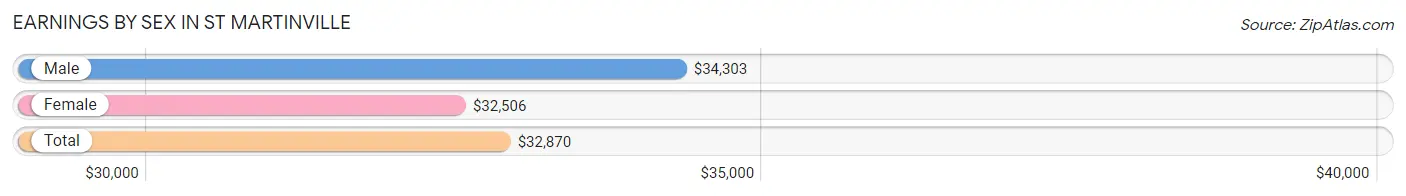
Earnings by Sex in St Martinville
Average Earnings in St Martinville are $32,870, $34,303 for men and $32,506 for women, a difference of 5.2%.
| Sex | Number | Average Earnings |
| Male | 1,147 (47.3%) | $34,303 |
| Female | 1,277 (52.7%) | $32,506 |
| Total | 2,424 (100.0%) | $32,870 |
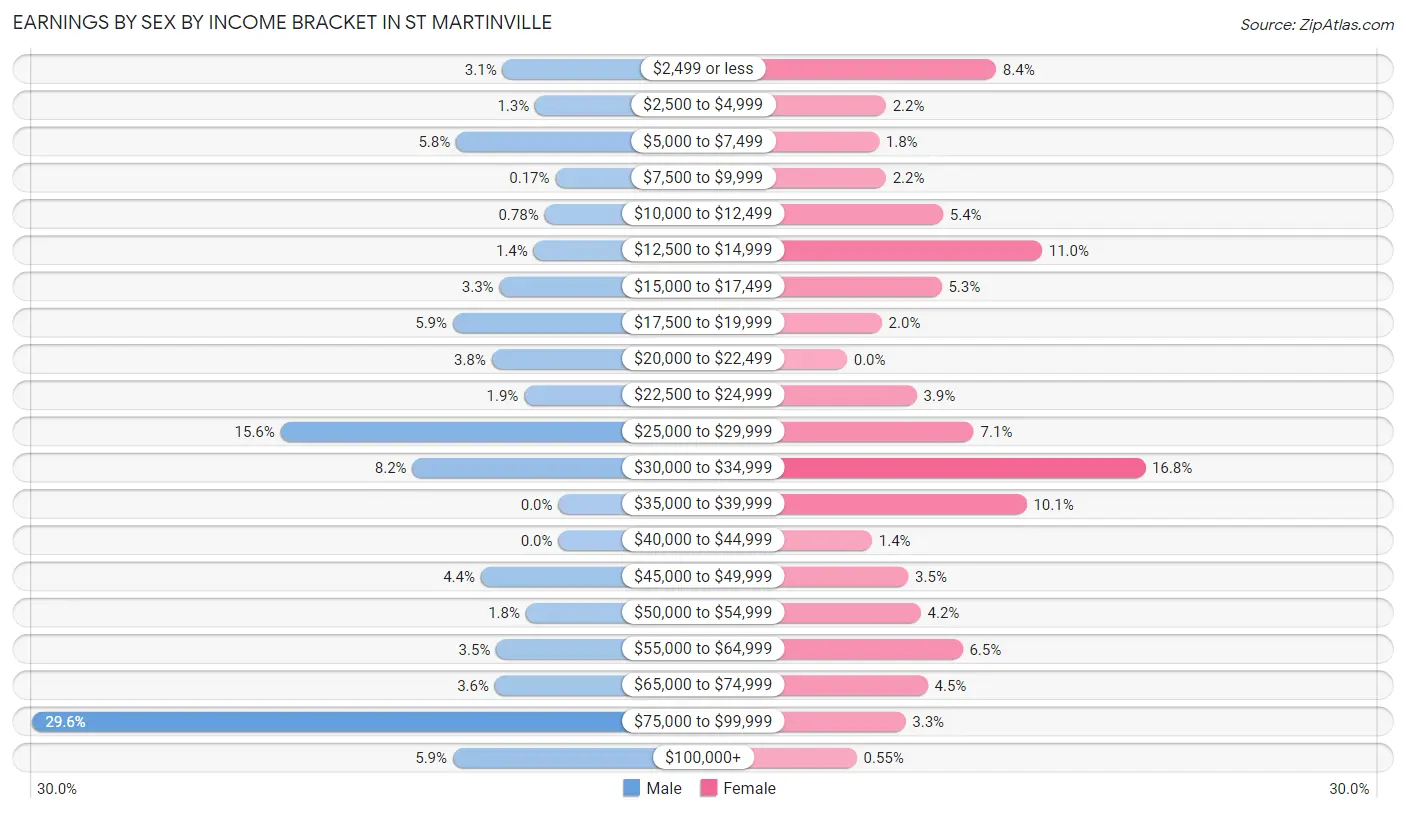
Earnings by Sex by Income Bracket in St Martinville
The most common earnings brackets in St Martinville are $75,000 to $99,999 for men (339 | 29.6%) and $30,000 to $34,999 for women (214 | 16.8%).
| Income | Male | Female |
| $2,499 or less | 36 (3.1%) | 107 (8.4%) |
| $2,500 to $4,999 | 15 (1.3%) | 28 (2.2%) |
| $5,000 to $7,499 | 66 (5.8%) | 23 (1.8%) |
| $7,500 to $9,999 | 2 (0.2%) | 28 (2.2%) |
| $10,000 to $12,499 | 9 (0.8%) | 69 (5.4%) |
| $12,500 to $14,999 | 16 (1.4%) | 140 (11.0%) |
| $15,000 to $17,499 | 38 (3.3%) | 68 (5.3%) |
| $17,500 to $19,999 | 68 (5.9%) | 25 (2.0%) |
| $20,000 to $22,499 | 43 (3.7%) | 0 (0.0%) |
| $22,500 to $24,999 | 22 (1.9%) | 50 (3.9%) |
| $25,000 to $29,999 | 179 (15.6%) | 91 (7.1%) |
| $30,000 to $34,999 | 94 (8.2%) | 214 (16.8%) |
| $35,000 to $39,999 | 0 (0.0%) | 129 (10.1%) |
| $40,000 to $44,999 | 0 (0.0%) | 18 (1.4%) |
| $45,000 to $49,999 | 50 (4.4%) | 44 (3.5%) |
| $50,000 to $54,999 | 21 (1.8%) | 53 (4.2%) |
| $55,000 to $64,999 | 40 (3.5%) | 83 (6.5%) |
| $65,000 to $74,999 | 41 (3.6%) | 58 (4.5%) |
| $75,000 to $99,999 | 339 (29.6%) | 42 (3.3%) |
| $100,000+ | 68 (5.9%) | 7 (0.5%) |
| Total | 1,147 (100.0%) | 1,277 (100.0%) |
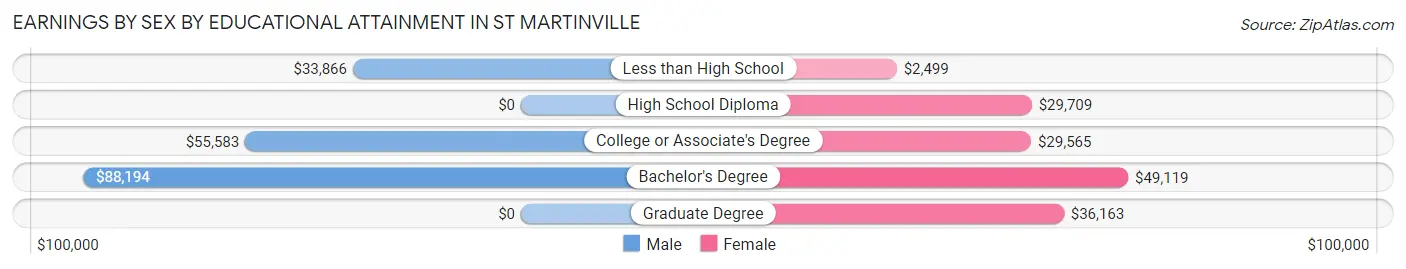
Earnings by Sex by Educational Attainment in St Martinville
Average earnings in St Martinville are $47,238 for men and $32,543 for women, a difference of 31.1%. Men with an educational attainment of bachelor's degree enjoy the highest average annual earnings of $88,194, while those with less than high school education earn the least with $33,866. Women with an educational attainment of bachelor's degree earn the most with the average annual earnings of $49,119, while those with less than high school education have the smallest earnings of $2,499.
| Educational Attainment | Male Income | Female Income |
| Less than High School | $33,866 | $2,499 |
| High School Diploma | - | - |
| College or Associate's Degree | $55,583 | $29,565 |
| Bachelor's Degree | $88,194 | $49,119 |
| Graduate Degree | - | - |
| Total | $47,238 | $32,543 |
Family Income in St Martinville
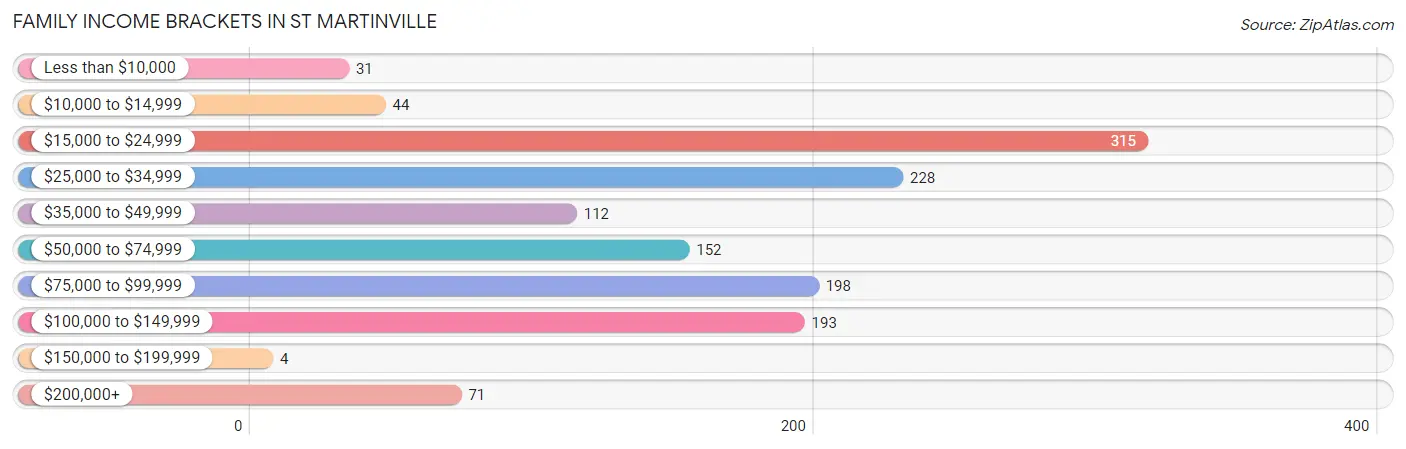
Family Income Brackets in St Martinville
According to the St Martinville family income data, there are 315 families falling into the $15,000 to $24,999 income range, which is the most common income bracket and makes up 23.4% of all families. Conversely, the $150,000 to $199,999 income bracket is the least frequent group with only 4 families (0.3%) belonging to this category.
| Income Bracket | # Families | % Families |
| Less than $10,000 | 31 | 2.3% |
| $10,000 to $14,999 | 44 | 3.3% |
| $15,000 to $24,999 | 315 | 23.4% |
| $25,000 to $34,999 | 228 | 16.9% |
| $35,000 to $49,999 | 112 | 8.3% |
| $50,000 to $74,999 | 152 | 11.3% |
| $75,000 to $99,999 | 198 | 14.7% |
| $100,000 to $149,999 | 193 | 14.3% |
| $150,000 to $199,999 | 4 | 0.3% |
| $200,000+ | 71 | 5.3% |
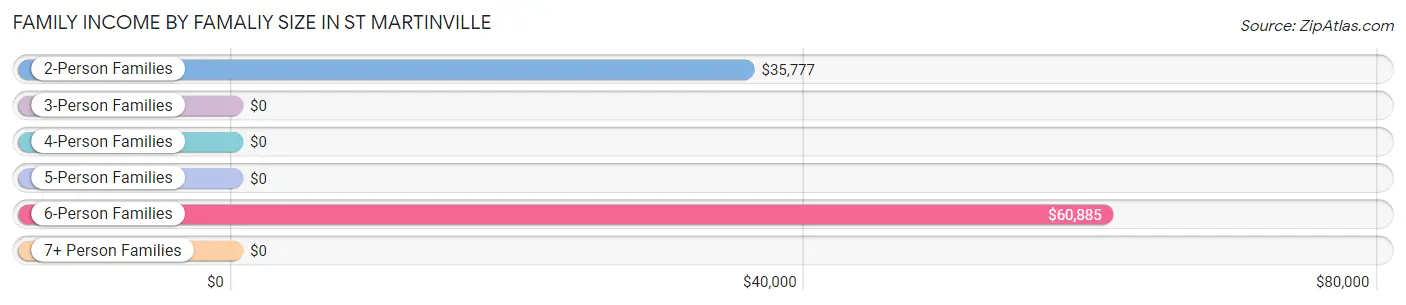
Family Income by Famaliy Size in St Martinville
6-person families (31 | 2.3%) account for the highest median family income in St Martinville with $60,885 per family, while 2-person families (987 | 73.3%) have the highest median income of $17,888 per family member.
| Income Bracket | # Families | Median Income |
| 2-Person Families | 987 (73.3%) | $35,777 |
| 3-Person Families | 207 (15.4%) | $0 |
| 4-Person Families | 34 (2.5%) | $0 |
| 5-Person Families | 50 (3.7%) | $0 |
| 6-Person Families | 31 (2.3%) | $60,885 |
| 7+ Person Families | 38 (2.8%) | $0 |
| Total | 1,347 (100.0%) | $36,692 |
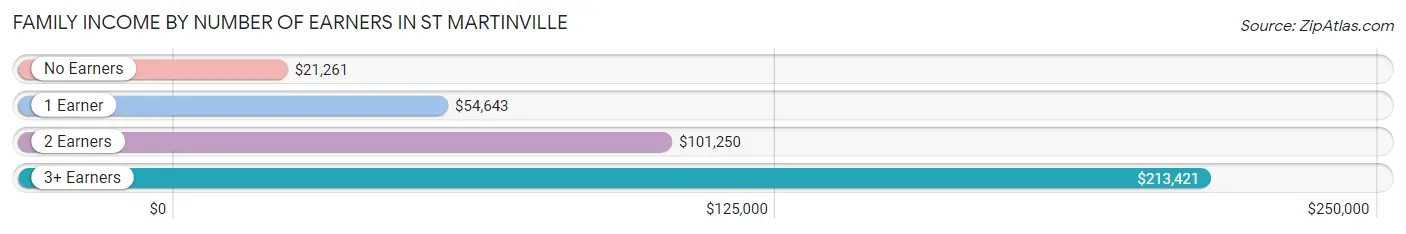
Family Income by Number of Earners in St Martinville
The median family income in St Martinville is $36,692, with families comprising 3+ earners (76) having the highest median family income of $213,421, while families with no earners (549) have the lowest median family income of $21,261, accounting for 5.6% and 40.8% of families, respectively.
| Number of Earners | # Families | Median Income |
| No Earners | 549 (40.8%) | $21,261 |
| 1 Earner | 406 (30.1%) | $54,643 |
| 2 Earners | 316 (23.5%) | $101,250 |
| 3+ Earners | 76 (5.6%) | $213,421 |
| Total | 1,347 (100.0%) | $36,692 |
Household Income in St Martinville
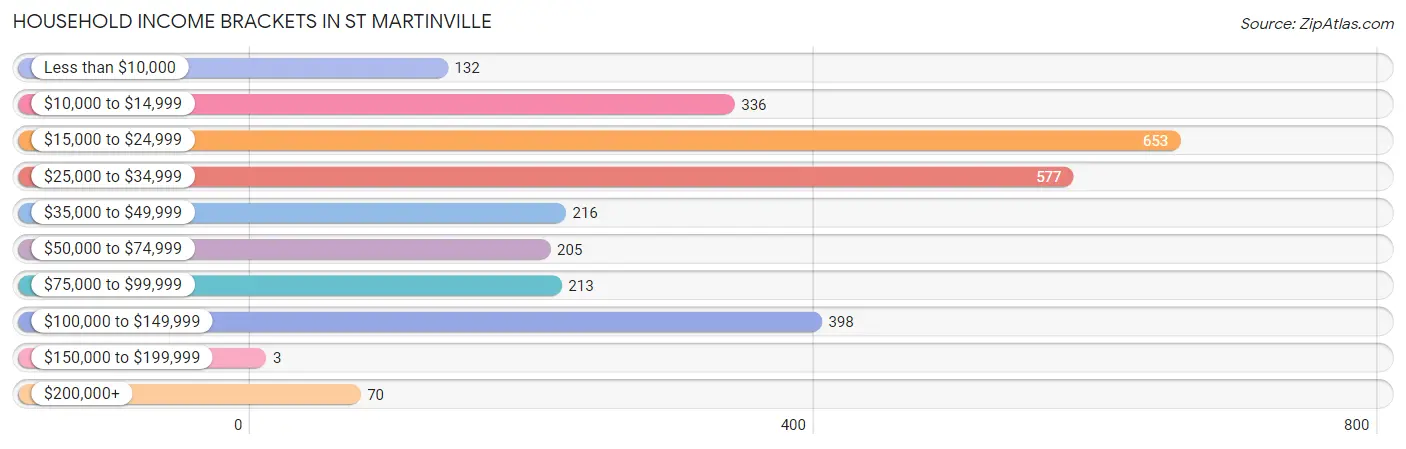
Household Income Brackets in St Martinville
With 653 households falling in the category, the $15,000 to $24,999 income range is the most frequent in St Martinville, accounting for 23.3% of all households. In contrast, only 3 households (0.1%) fall into the $150,000 to $199,999 income bracket, making it the least populous group.
| Income Bracket | # Households | % Households |
| Less than $10,000 | 132 | 4.7% |
| $10,000 to $14,999 | 336 | 12.0% |
| $15,000 to $24,999 | 653 | 23.3% |
| $25,000 to $34,999 | 577 | 20.6% |
| $35,000 to $49,999 | 216 | 7.7% |
| $50,000 to $74,999 | 205 | 7.3% |
| $75,000 to $99,999 | 213 | 7.6% |
| $100,000 to $149,999 | 398 | 14.2% |
| $150,000 to $199,999 | 3 | 0.1% |
| $200,000+ | 70 | 2.5% |
Household Income by Householder Age in St Martinville
The median household income in St Martinville is $32,781, with the highest median household income of $103,373 found in the 15 to 24 years age bracket for the primary householder. A total of 82 households (2.9%) fall into this category. Meanwhile, the 25 to 44 years age bracket for the primary householder has the lowest median household income of $0, with 739 households (26.4%) in this group.
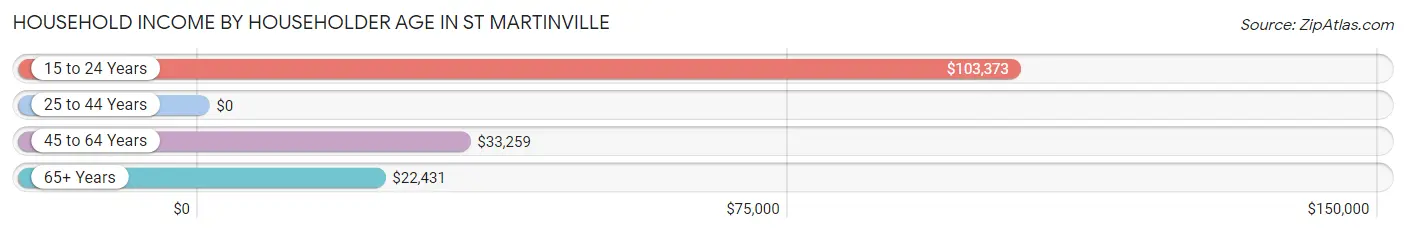
| Income Bracket | # Households | Median Income |
| 15 to 24 Years | 82 (2.9%) | $103,373 |
| 25 to 44 Years | 739 (26.4%) | $0 |
| 45 to 64 Years | 920 (32.8%) | $33,259 |
| 65+ Years | 1,062 (37.9%) | $22,431 |
| Total | 2,803 (100.0%) | $32,781 |
Poverty in St Martinville
Income Below Poverty by Sex and Age in St Martinville
With 17.8% poverty level for males and 30.1% for females among the residents of St Martinville, 6 to 11 year old males and under 5 year old females are the most vulnerable to poverty, with 37 males (46.3%) and 104 females (66.7%) in their respective age groups living below the poverty level.
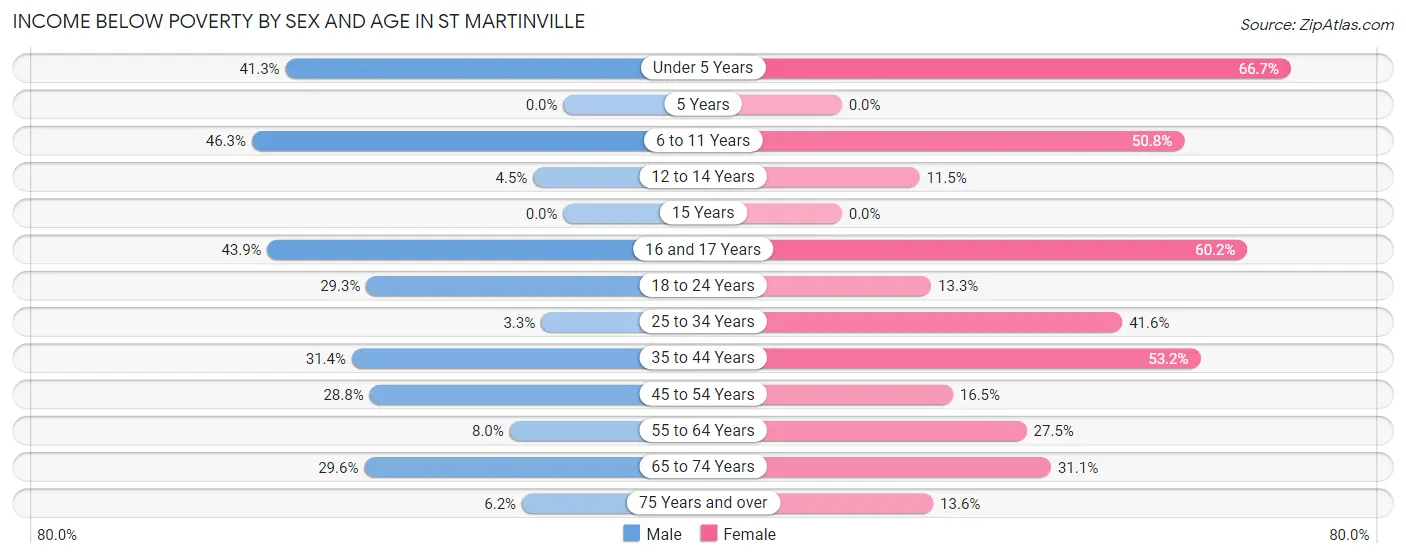
| Age Bracket | Male | Female |
| Under 5 Years | 26 (41.3%) | 104 (66.7%) |
| 5 Years | 0 (0.0%) | 0 (0.0%) |
| 6 to 11 Years | 37 (46.3%) | 31 (50.8%) |
| 12 to 14 Years | 3 (4.5%) | 6 (11.5%) |
| 15 Years | 0 (0.0%) | 0 (0.0%) |
| 16 and 17 Years | 29 (43.9%) | 56 (60.2%) |
| 18 to 24 Years | 36 (29.3%) | 28 (13.3%) |
| 25 to 34 Years | 20 (3.3%) | 152 (41.6%) |
| 35 to 44 Years | 71 (31.4%) | 140 (53.2%) |
| 45 to 54 Years | 74 (28.8%) | 76 (16.5%) |
| 55 to 64 Years | 26 (8.0%) | 112 (27.5%) |
| 65 to 74 Years | 110 (29.6%) | 91 (31.1%) |
| 75 Years and over | 22 (6.1%) | 57 (13.6%) |
| Total | 454 (17.8%) | 853 (30.1%) |
Income Above Poverty by Sex and Age in St Martinville
According to the poverty statistics in St Martinville, males aged 5 years and females aged 5 years are the age groups that are most secure financially, with 100.0% of males and 100.0% of females in these age groups living above the poverty line.
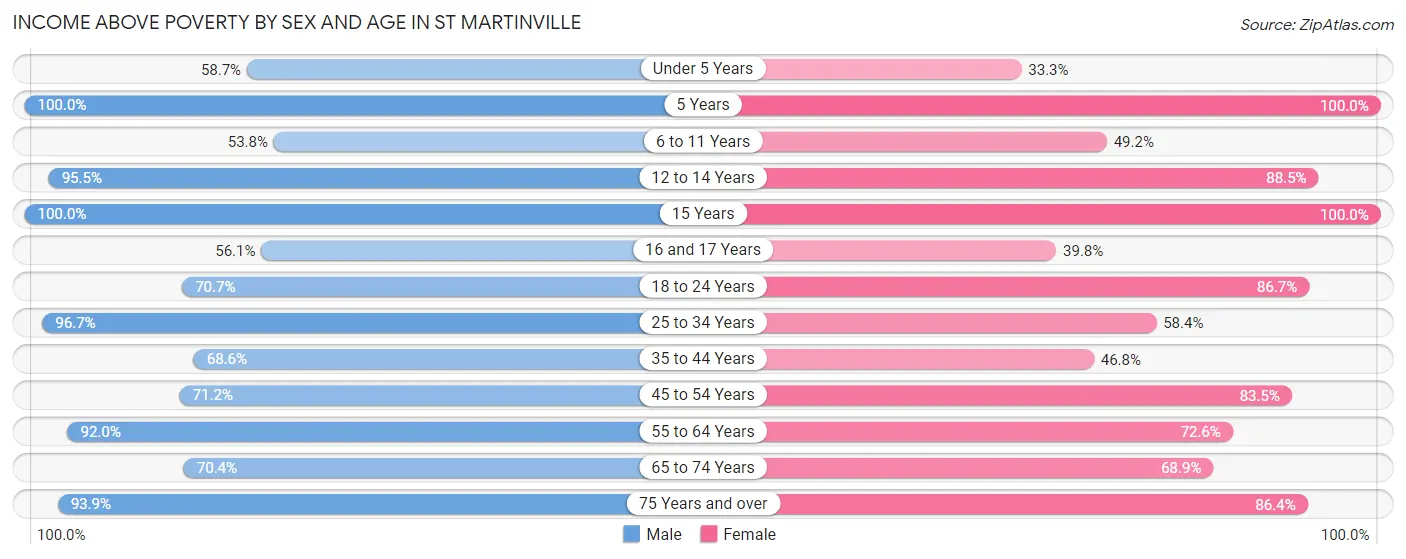
| Age Bracket | Male | Female |
| Under 5 Years | 37 (58.7%) | 52 (33.3%) |
| 5 Years | 10 (100.0%) | 34 (100.0%) |
| 6 to 11 Years | 43 (53.7%) | 30 (49.2%) |
| 12 to 14 Years | 64 (95.5%) | 46 (88.5%) |
| 15 Years | 5 (100.0%) | 13 (100.0%) |
| 16 and 17 Years | 37 (56.1%) | 37 (39.8%) |
| 18 to 24 Years | 87 (70.7%) | 183 (86.7%) |
| 25 to 34 Years | 584 (96.7%) | 213 (58.4%) |
| 35 to 44 Years | 155 (68.6%) | 123 (46.8%) |
| 45 to 54 Years | 183 (71.2%) | 385 (83.5%) |
| 55 to 64 Years | 300 (92.0%) | 296 (72.6%) |
| 65 to 74 Years | 262 (70.4%) | 202 (68.9%) |
| 75 Years and over | 336 (93.9%) | 363 (86.4%) |
| Total | 2,103 (82.2%) | 1,977 (69.9%) |
Income Below Poverty Among Married-Couple Families in St Martinville
The poverty statistics for married-couple families in St Martinville show that 12.0% or 97 of the total 805 families live below the poverty line. Families with 1 or 2 children have the highest poverty rate of 41.7%, comprising of 58 families. On the other hand, families with 3 or 4 children have the lowest poverty rate of 0.0%, which includes 0 families.
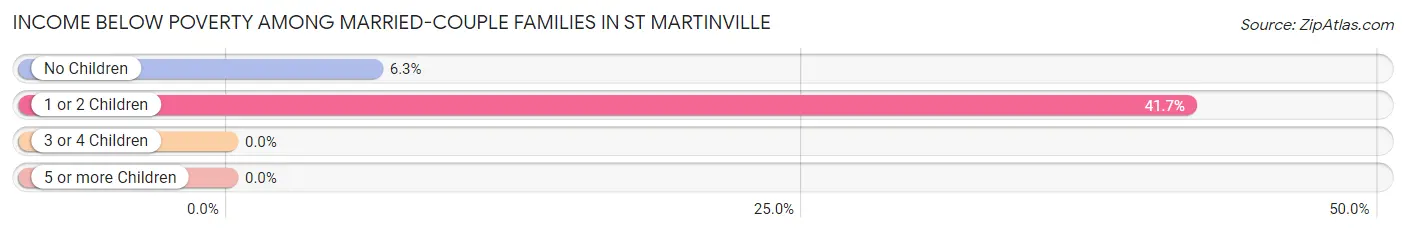
| Children | Above Poverty | Below Poverty |
| No Children | 580 (93.7%) | 39 (6.3%) |
| 1 or 2 Children | 81 (58.3%) | 58 (41.7%) |
| 3 or 4 Children | 47 (100.0%) | 0 (0.0%) |
| 5 or more Children | 0 (0.0%) | 0 (0.0%) |
| Total | 708 (87.9%) | 97 (12.0%) |
Income Below Poverty Among Single-Parent Households in St Martinville
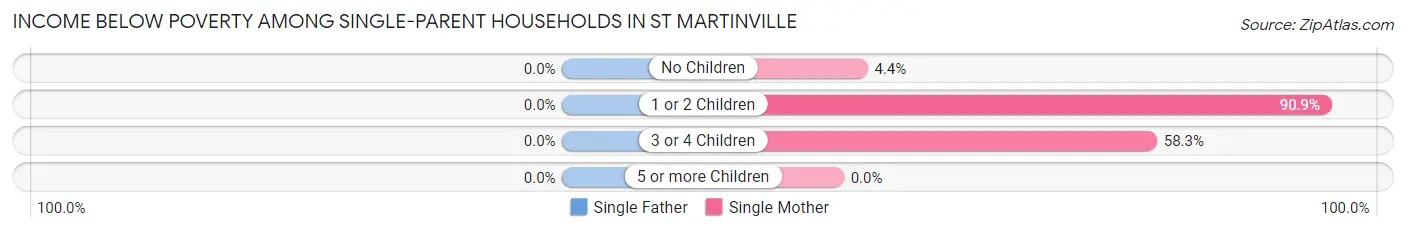
| Children | Single Father | Single Mother |
| No Children | 0 (0.0%) | 11 (4.4%) |
| 1 or 2 Children | 0 (0.0%) | 100 (90.9%) |
| 3 or 4 Children | 0 (0.0%) | 42 (58.3%) |
| 5 or more Children | 0 (0.0%) | 0 (0.0%) |
| Total | 0 (0.0%) | 153 (35.6%) |
Income Below Poverty Among Married-Couple vs Single-Parent Households in St Martinville
The poverty data for St Martinville shows that 97 of the married-couple family households (12.0%) and 153 of the single-parent households (28.2%) are living below the poverty level. Within the married-couple family households, those with 1 or 2 children have the highest poverty rate, with 58 households (41.7%) falling below the poverty line. Among the single-parent households, those with 1 or 2 children have the highest poverty rate, with 100 household (64.1%) living below poverty.
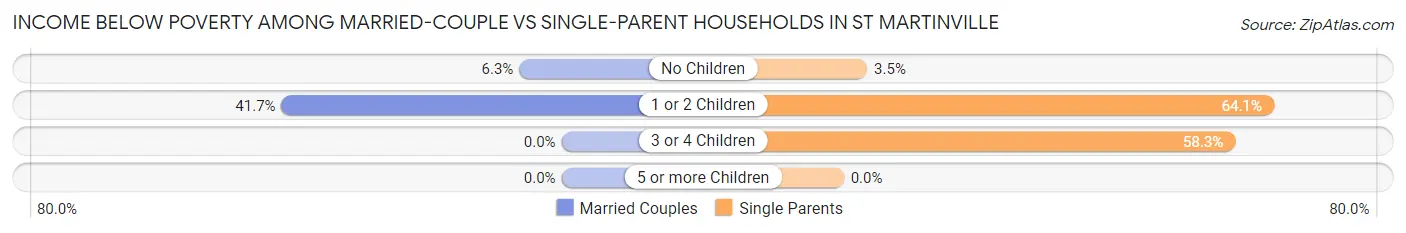
| Children | Married-Couple Families | Single-Parent Households |
| No Children | 39 (6.3%) | 11 (3.5%) |
| 1 or 2 Children | 58 (41.7%) | 100 (64.1%) |
| 3 or 4 Children | 0 (0.0%) | 42 (58.3%) |
| 5 or more Children | 0 (0.0%) | 0 (0.0%) |
| Total | 97 (12.0%) | 153 (28.2%) |
Race in St Martinville
The most populous races in St Martinville are Black / African American (2,975 | 54.6%), White / Caucasian (2,230 | 40.9%), and Two or more Races (170 | 3.1%).
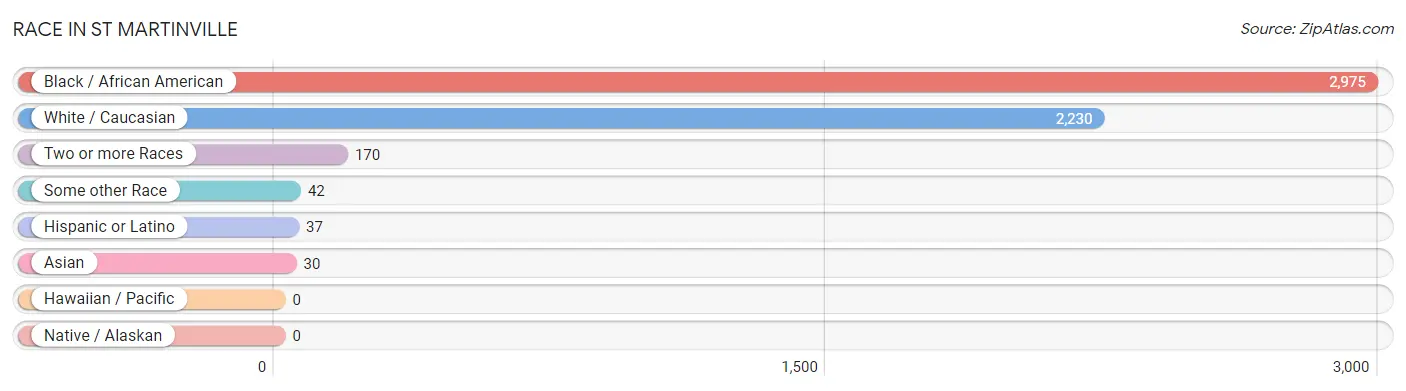
| Race | # Population | % Population |
| Asian | 30 | 0.5% |
| Black / African American | 2,975 | 54.6% |
| Hawaiian / Pacific | 0 | 0.0% |
| Hispanic or Latino | 37 | 0.7% |
| Native / Alaskan | 0 | 0.0% |
| White / Caucasian | 2,230 | 40.9% |
| Two or more Races | 170 | 3.1% |
| Some other Race | 42 | 0.8% |
| Total | 5,447 | 100.0% |
Ancestry in St Martinville
The most populous ancestries reported in St Martinville are French (799 | 14.7%), French Canadian (216 | 4.0%), American (155 | 2.9%), German (111 | 2.0%), and Irish (105 | 1.9%), together accounting for 25.5% of all St Martinville residents.
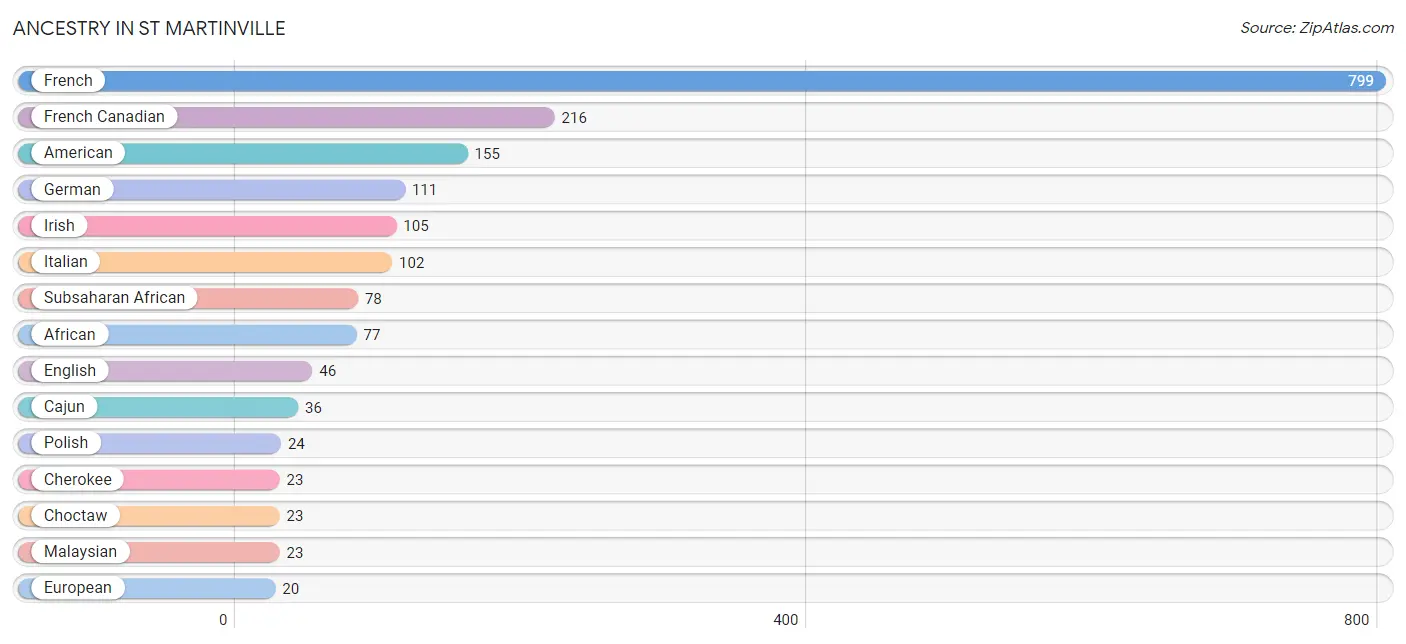
| Ancestry | # Population | % Population |
| African | 77 | 1.4% |
| American | 155 | 2.9% |
| Cajun | 36 | 0.7% |
| Central American | 19 | 0.4% |
| Cherokee | 23 | 0.4% |
| Choctaw | 23 | 0.4% |
| Costa Rican | 9 | 0.2% |
| English | 46 | 0.8% |
| European | 20 | 0.4% |
| French | 799 | 14.7% |
| French Canadian | 216 | 4.0% |
| German | 111 | 2.0% |
| Guatemalan | 1 | 0.0% |
| Irish | 105 | 1.9% |
| Italian | 102 | 1.9% |
| Korean | 7 | 0.1% |
| Malaysian | 23 | 0.4% |
| Mexican | 18 | 0.3% |
| Nigerian | 1 | 0.0% |
| Polish | 24 | 0.4% |
| Salvadoran | 9 | 0.2% |
| Subsaharan African | 78 | 1.4% |
| Swedish | 12 | 0.2% |
| Swiss | 13 | 0.2% | View All 24 Rows |
Immigrants in St Martinville
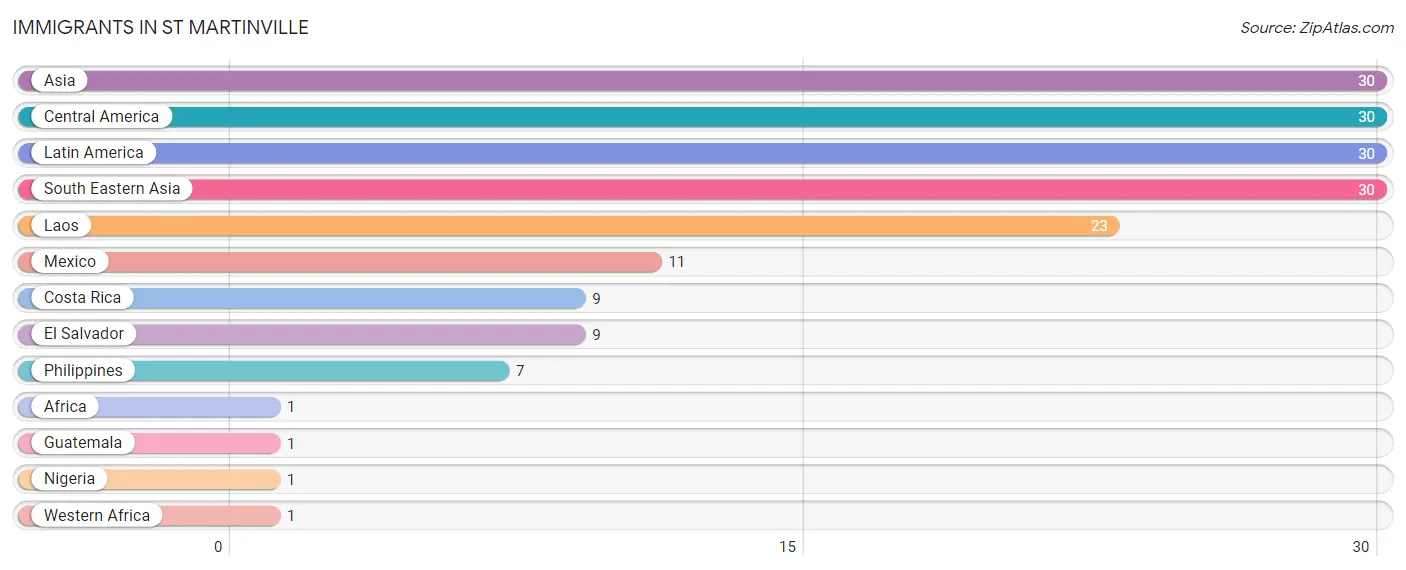
The most numerous immigrant groups reported in St Martinville came from Asia (30 | 0.5%), Central America (30 | 0.5%), Latin America (30 | 0.5%), South Eastern Asia (30 | 0.5%), and Laos (23 | 0.4%), together accounting for 2.6% of all St Martinville residents.
| Immigration Origin | # Population | % Population |
| Africa | 1 | 0.0% |
| Asia | 30 | 0.5% |
| Central America | 30 | 0.5% |
| Costa Rica | 9 | 0.2% |
| El Salvador | 9 | 0.2% |
| Guatemala | 1 | 0.0% |
| Laos | 23 | 0.4% |
| Latin America | 30 | 0.5% |
| Mexico | 11 | 0.2% |
| Nigeria | 1 | 0.0% |
| Philippines | 7 | 0.1% |
| South Eastern Asia | 30 | 0.5% |
| Western Africa | 1 | 0.0% | View All 13 Rows |
Sex and Age in St Martinville
Sex and Age in St Martinville
The most populous age groups in St Martinville are 25 to 29 Years (361 | 13.9%) for men and 75 to 79 Years (252 | 8.8%) for women.
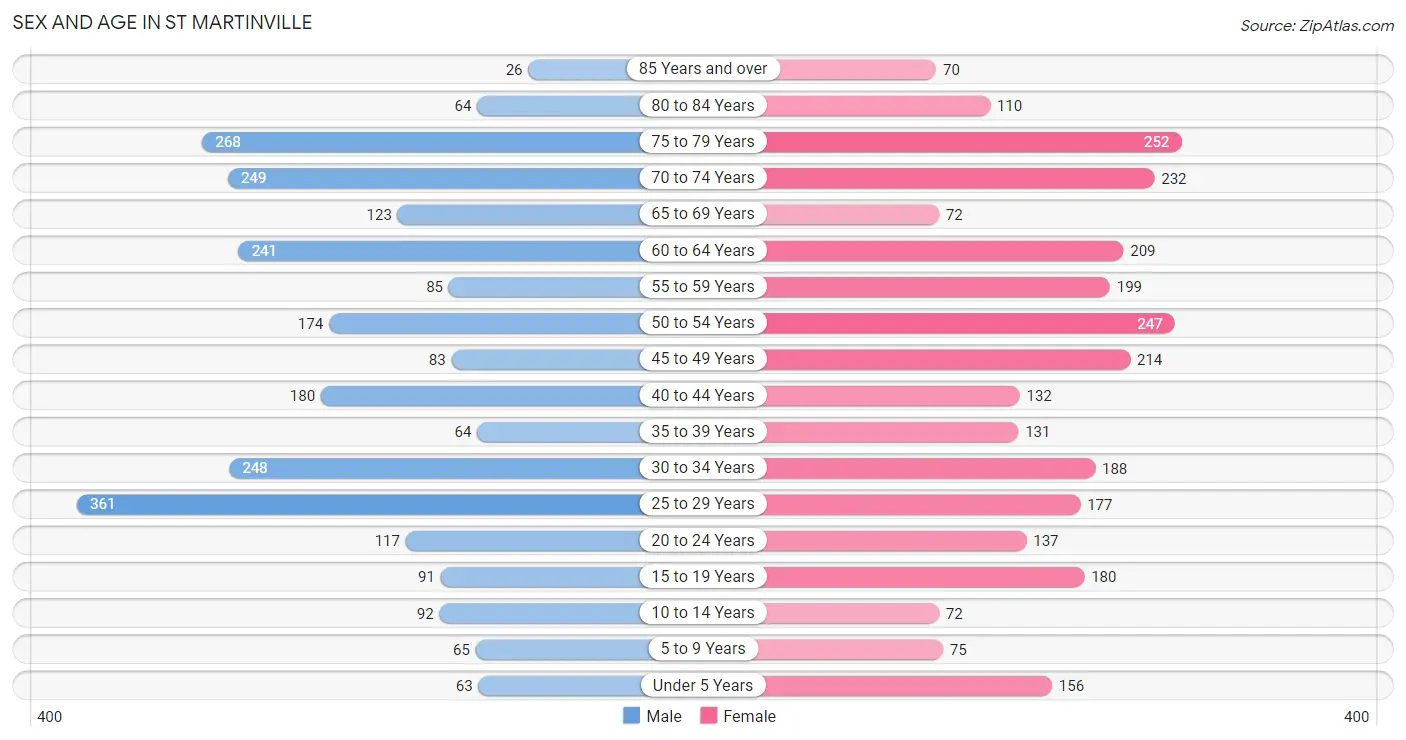
| Age Bracket | Male | Female |
| Under 5 Years | 63 (2.4%) | 156 (5.5%) |
| 5 to 9 Years | 65 (2.5%) | 75 (2.6%) |
| 10 to 14 Years | 92 (3.5%) | 72 (2.5%) |
| 15 to 19 Years | 91 (3.5%) | 180 (6.3%) |
| 20 to 24 Years | 117 (4.5%) | 137 (4.8%) |
| 25 to 29 Years | 361 (13.9%) | 177 (6.2%) |
| 30 to 34 Years | 248 (9.6%) | 188 (6.6%) |
| 35 to 39 Years | 64 (2.5%) | 131 (4.6%) |
| 40 to 44 Years | 180 (6.9%) | 132 (4.6%) |
| 45 to 49 Years | 83 (3.2%) | 214 (7.5%) |
| 50 to 54 Years | 174 (6.7%) | 247 (8.7%) |
| 55 to 59 Years | 85 (3.3%) | 199 (7.0%) |
| 60 to 64 Years | 241 (9.3%) | 209 (7.3%) |
| 65 to 69 Years | 123 (4.7%) | 72 (2.5%) |
| 70 to 74 Years | 249 (9.6%) | 232 (8.1%) |
| 75 to 79 Years | 268 (10.3%) | 252 (8.8%) |
| 80 to 84 Years | 64 (2.5%) | 110 (3.9%) |
| 85 Years and over | 26 (1.0%) | 70 (2.5%) |
| Total | 2,594 (100.0%) | 2,853 (100.0%) |
Families and Households in St Martinville
Median Family Size in St Martinville
The median family size in St Martinville is 2.63 persons per family, with single male/father families (112 | 8.3%) accounting for the largest median family size of 3.08 persons per family. On the other hand, married-couple families (805 | 59.8%) represent the smallest median family size with 2.37 persons per family.
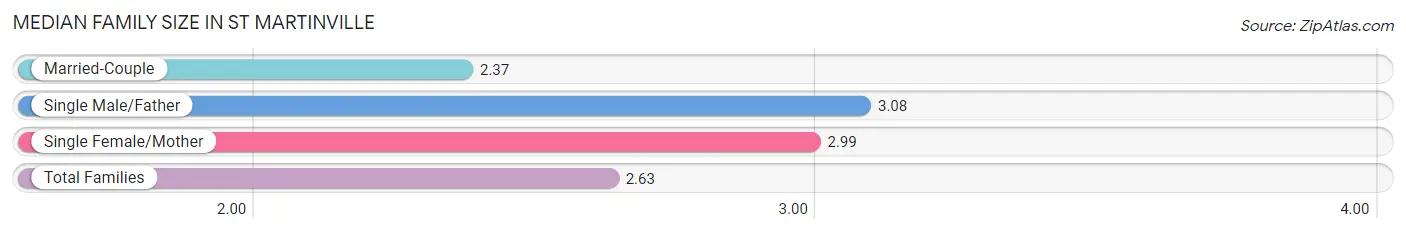
| Family Type | # Families | Family Size |
| Married-Couple | 805 (59.8%) | 2.37 |
| Single Male/Father | 112 (8.3%) | 3.08 |
| Single Female/Mother | 430 (31.9%) | 2.99 |
| Total Families | 1,347 (100.0%) | 2.63 |
Median Household Size in St Martinville
The median household size in St Martinville is 1.92 persons per household, with single male/father households (112 | 4.0%) accounting for the largest median household size of 3.08 persons per household. non-family households (1,456 | 51.9%) represent the smallest median household size with 1.24 persons per household.
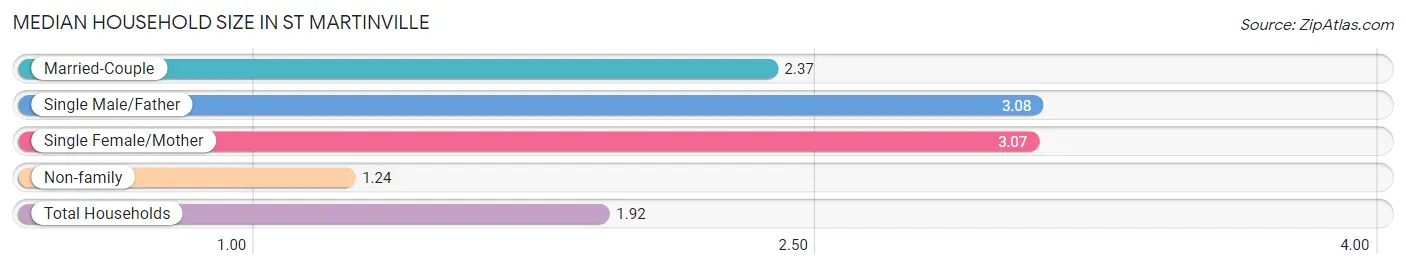
| Household Type | # Households | Household Size |
| Married-Couple | 805 (28.7%) | 2.37 |
| Single Male/Father | 112 (4.0%) | 3.08 |
| Single Female/Mother | 430 (15.3%) | 3.07 |
| Non-family | 1,456 (51.9%) | 1.24 |
| Total Households | 2,803 (100.0%) | 1.92 |
Household Size by Marriage Status in St Martinville
Out of a total of 2,803 households in St Martinville, 1,347 (48.1%) are family households, while 1,456 (51.9%) are nonfamily households. The most numerous type of family households are 2-person households, comprising 900, and the most common type of nonfamily households are 1-person households, comprising 1,099.
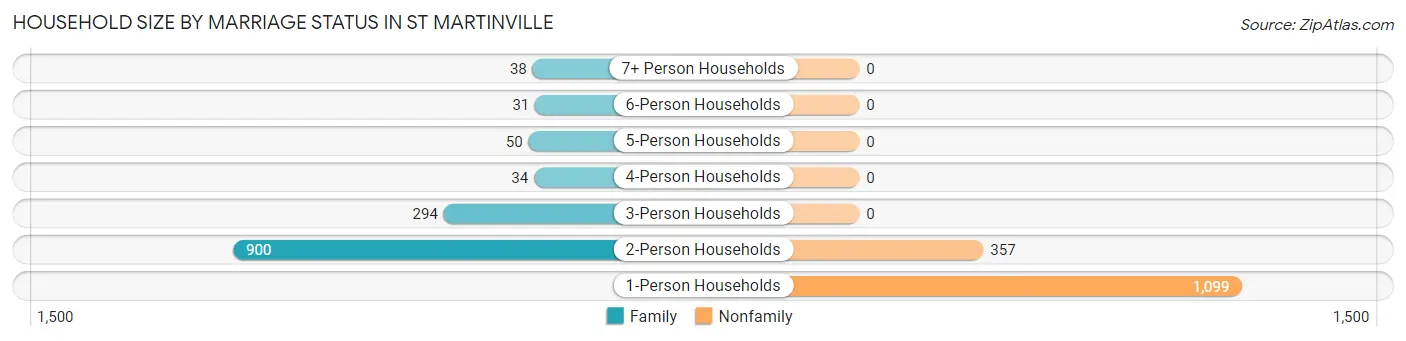
| Household Size | Family Households | Nonfamily Households |
| 1-Person Households | - | 1,099 (39.2%) |
| 2-Person Households | 900 (32.1%) | 357 (12.7%) |
| 3-Person Households | 294 (10.5%) | 0 (0.0%) |
| 4-Person Households | 34 (1.2%) | 0 (0.0%) |
| 5-Person Households | 50 (1.8%) | 0 (0.0%) |
| 6-Person Households | 31 (1.1%) | 0 (0.0%) |
| 7+ Person Households | 38 (1.4%) | 0 (0.0%) |
| Total | 1,347 (48.1%) | 1,456 (51.9%) |
Female Fertility in St Martinville
Fertility by Age in St Martinville
Average fertility rate in St Martinville is 54.0 births per 1,000 women. Women in the age bracket of 20 to 34 years have the highest fertility rate with 139.0 births per 1,000 women. Women in the age bracket of 20 to 34 years acount for 95.9% of all women with births.
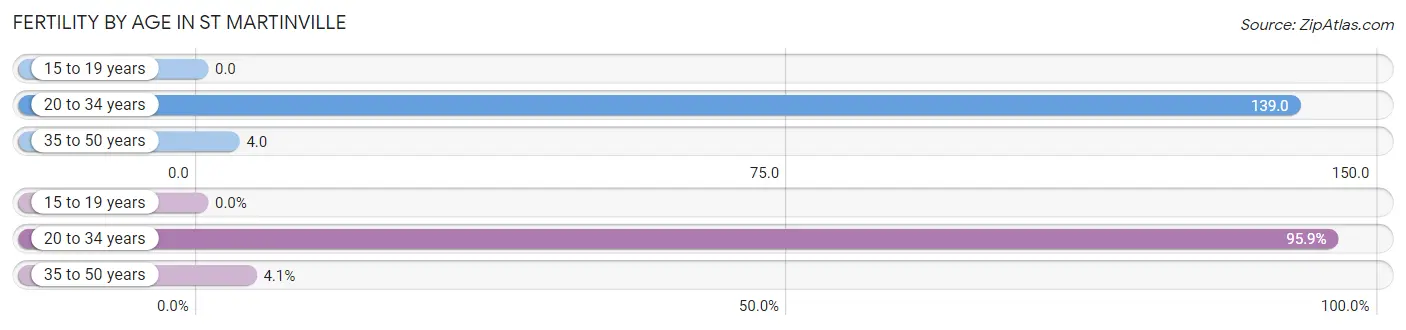
| Age Bracket | Women with Births | Births / 1,000 Women |
| 15 to 19 years | 0 (0.0%) | 0.0 |
| 20 to 34 years | 70 (95.9%) | 139.0 |
| 35 to 50 years | 3 (4.1%) | 4.0 |
| Total | 73 (100.0%) | 54.0 |
Fertility by Age by Marriage Status in St Martinville
35.6% of women with births (73) in St Martinville are married. The highest percentage of unmarried women with births falls into 35 to 50 years age bracket with 66.7% of them unmarried at the time of birth, while the lowest percentage of unmarried women with births belong to 20 to 34 years age bracket with 64.3% of them unmarried.
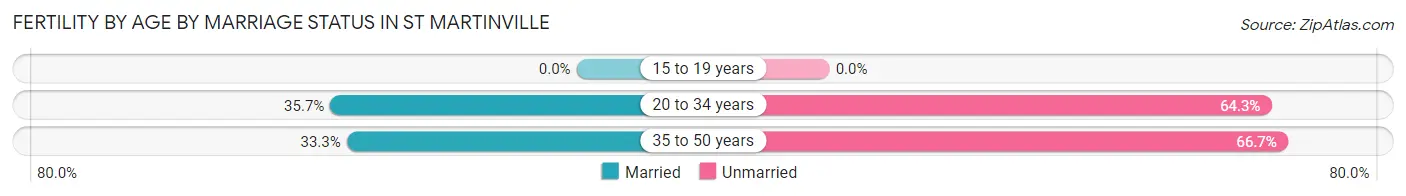
| Age Bracket | Married | Unmarried |
| 15 to 19 years | 0 (0.0%) | 0 (0.0%) |
| 20 to 34 years | 25 (35.7%) | 45 (64.3%) |
| 35 to 50 years | 1 (33.3%) | 2 (66.7%) |
| Total | 26 (35.6%) | 47 (64.4%) |
Fertility by Education in St Martinville
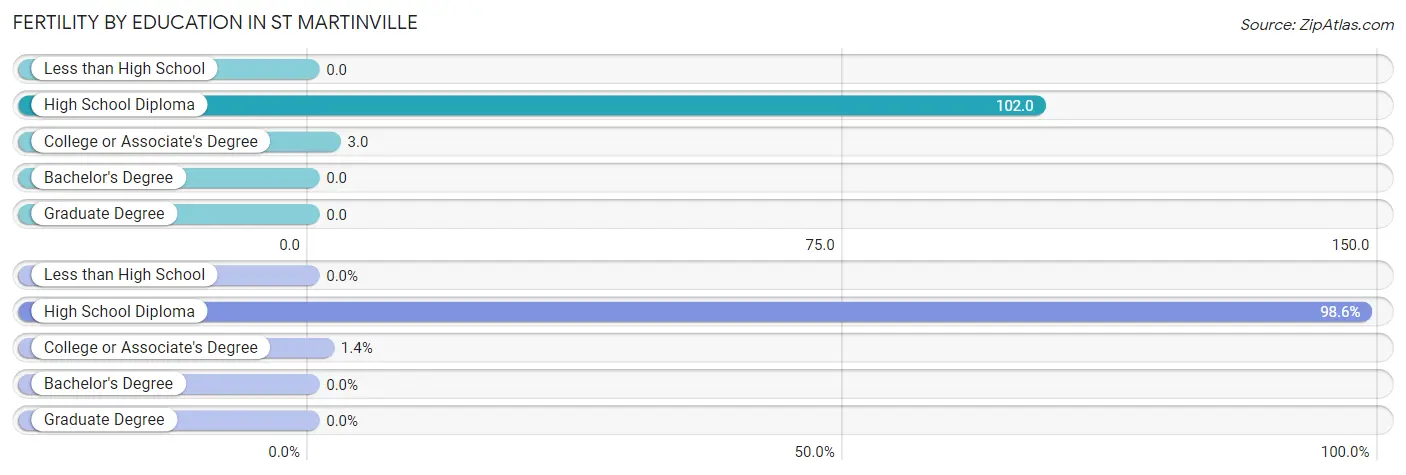
| Educational Attainment | Women with Births | Births / 1,000 Women |
| Less than High School | 0 (0.0%) | 0.0 |
| High School Diploma | 72 (98.6%) | 102.0 |
| College or Associate's Degree | 1 (1.4%) | 3.0 |
| Bachelor's Degree | 0 (0.0%) | 0.0 |
| Graduate Degree | 0 (0.0%) | 0.0 |
| Total | 73 (100.0%) | 54.0 |
Fertility by Education by Marriage Status in St Martinville
64.4% of women with births in St Martinville are unmarried. Women with the educational attainment of college or associate's degree are most likely to be married with 100.0% of them married at childbirth, while women with the educational attainment of high school diploma are least likely to be married with 65.3% of them unmarried at childbirth.
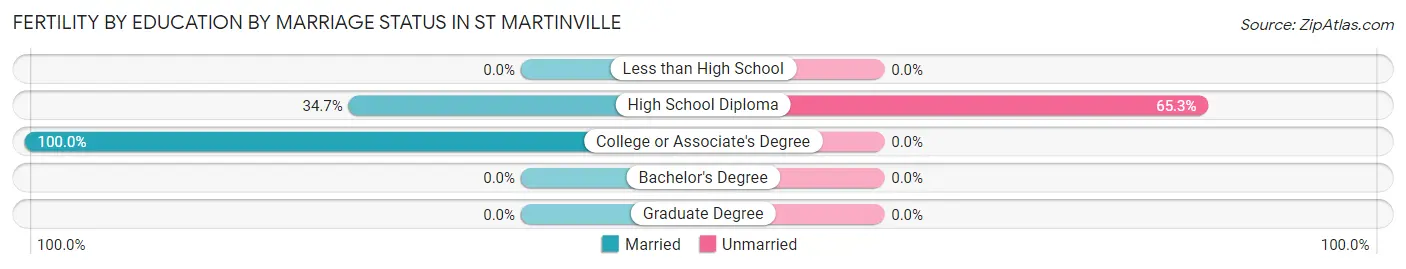
| Educational Attainment | Married | Unmarried |
| Less than High School | 0 (0.0%) | 0 (0.0%) |
| High School Diploma | 25 (34.7%) | 47 (65.3%) |
| College or Associate's Degree | 1 (100.0%) | 0 (0.0%) |
| Bachelor's Degree | 0 (0.0%) | 0 (0.0%) |
| Graduate Degree | 0 (0.0%) | 0 (0.0%) |
| Total | 26 (35.6%) | 47 (64.4%) |
Employment Characteristics in St Martinville
Employment by Class of Employer in St Martinville
Among the 2,187 employed individuals in St Martinville, private company employees (1,668 | 76.3%), state government employees (170 | 7.8%), and local government employees (140 | 6.4%) make up the most common classes of employment.
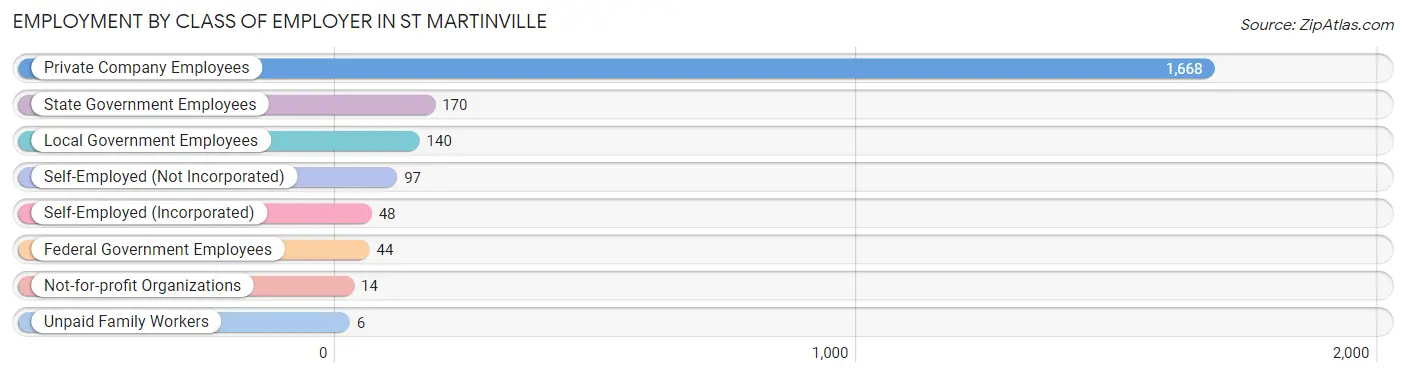
| Employer Class | # Employees | % Employees |
| Private Company Employees | 1,668 | 76.3% |
| Self-Employed (Incorporated) | 48 | 2.2% |
| Self-Employed (Not Incorporated) | 97 | 4.4% |
| Not-for-profit Organizations | 14 | 0.6% |
| Local Government Employees | 140 | 6.4% |
| State Government Employees | 170 | 7.8% |
| Federal Government Employees | 44 | 2.0% |
| Unpaid Family Workers | 6 | 0.3% |
| Total | 2,187 | 100.0% |
Employment Status by Age in St Martinville
According to the labor force statistics for St Martinville, out of the total population over 16 years of age (4,906), 52.9% or 2,595 individuals are in the labor force, with 15.9% or 413 of them unemployed. The age group with the highest labor force participation rate is 45 to 54 years, with 86.1% or 618 individuals in the labor force. Within the labor force, the 16 to 19 years age range has the highest percentage of unemployed individuals, with 51.9% or 65 of them being unemployed.
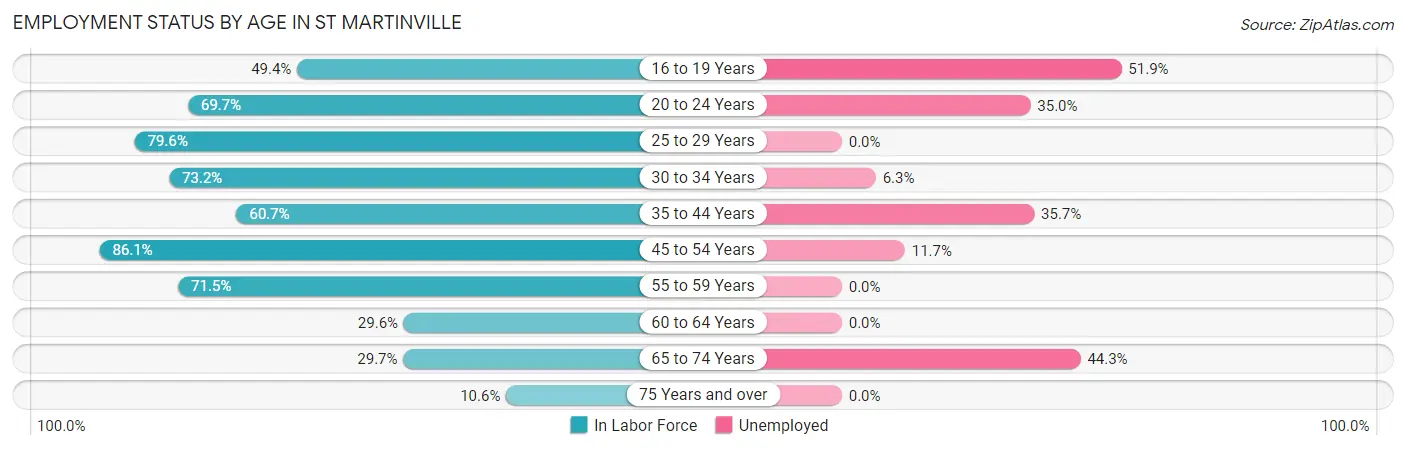
| Age Bracket | In Labor Force | Unemployed |
| 16 to 19 Years | 125 (49.4%) | 65 (51.9%) |
| 20 to 24 Years | 177 (69.7%) | 62 (35.0%) |
| 25 to 29 Years | 428 (79.6%) | 0 (0.0%) |
| 30 to 34 Years | 319 (73.2%) | 20 (6.3%) |
| 35 to 44 Years | 308 (60.7%) | 110 (35.7%) |
| 45 to 54 Years | 618 (86.1%) | 72 (11.7%) |
| 55 to 59 Years | 203 (71.5%) | 0 (0.0%) |
| 60 to 64 Years | 133 (29.6%) | 0 (0.0%) |
| 65 to 74 Years | 201 (29.7%) | 89 (44.3%) |
| 75 Years and over | 84 (10.6%) | 0 (0.0%) |
| Total | 2,595 (52.9%) | 413 (15.9%) |
Employment Status by Educational Attainment in St Martinville
According to labor force statistics for St Martinville, 68.5% of individuals (2,009) out of the total population between 25 and 64 years of age (2,933) are in the labor force, with 10.1% or 203 of them being unemployed. The group with the highest labor force participation rate are those with the educational attainment of bachelor's degree or higher, with 73.6% or 259 individuals in the labor force. Within the labor force, individuals with less than high school education have the highest percentage of unemployment, with 85.5% or 148 of them being unemployed.
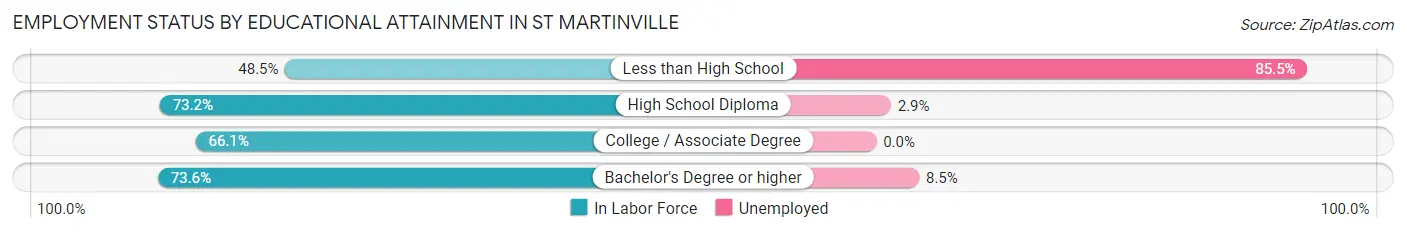
| Educational Attainment | In Labor Force | Unemployed |
| Less than High School | 173 (48.5%) | 305 (85.5%) |
| High School Diploma | 1,103 (73.2%) | 44 (2.9%) |
| College / Associate Degree | 474 (66.1%) | 0 (0.0%) |
| Bachelor's Degree or higher | 259 (73.6%) | 30 (8.5%) |
| Total | 2,009 (68.5%) | 296 (10.1%) |
Employment Occupations by Sex in St Martinville
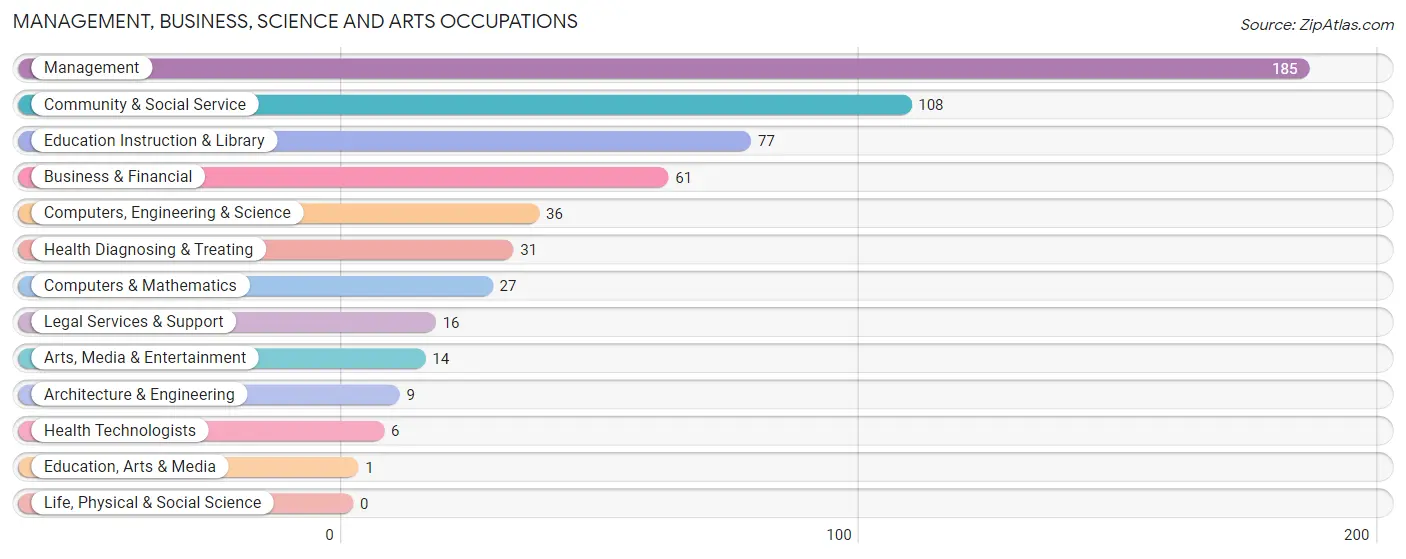
Management, Business, Science and Arts Occupations
The most common Management, Business, Science and Arts occupations in St Martinville are Management (185 | 8.5%), Community & Social Service (108 | 5.0%), Education Instruction & Library (77 | 3.5%), Business & Financial (61 | 2.8%), and Computers, Engineering & Science (36 | 1.7%).
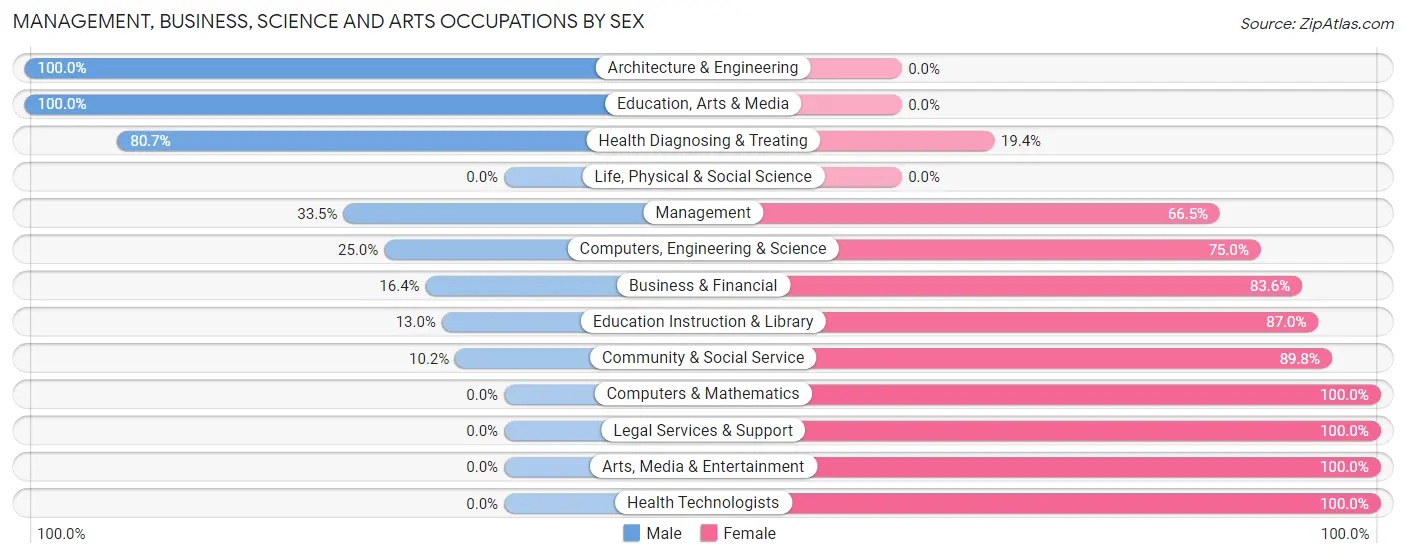
Management, Business, Science and Arts Occupations by Sex
Within the Management, Business, Science and Arts occupations in St Martinville, the most male-oriented occupations are Architecture & Engineering (100.0%), Education, Arts & Media (100.0%), and Health Diagnosing & Treating (80.6%), while the most female-oriented occupations are Computers & Mathematics (100.0%), Legal Services & Support (100.0%), and Arts, Media & Entertainment (100.0%).
| Occupation | Male | Female |
| Management | 62 (33.5%) | 123 (66.5%) |
| Business & Financial | 10 (16.4%) | 51 (83.6%) |
| Computers, Engineering & Science | 9 (25.0%) | 27 (75.0%) |
| Computers & Mathematics | 0 (0.0%) | 27 (100.0%) |
| Architecture & Engineering | 9 (100.0%) | 0 (0.0%) |
| Life, Physical & Social Science | 0 (0.0%) | 0 (0.0%) |
| Community & Social Service | 11 (10.2%) | 97 (89.8%) |
| Education, Arts & Media | 1 (100.0%) | 0 (0.0%) |
| Legal Services & Support | 0 (0.0%) | 16 (100.0%) |
| Education Instruction & Library | 10 (13.0%) | 67 (87.0%) |
| Arts, Media & Entertainment | 0 (0.0%) | 14 (100.0%) |
| Health Diagnosing & Treating | 25 (80.6%) | 6 (19.4%) |
| Health Technologists | 0 (0.0%) | 6 (100.0%) |
| Total (Category) | 117 (27.8%) | 304 (72.2%) |
| Total (Overall) | 1,019 (47.0%) | 1,151 (53.0%) |
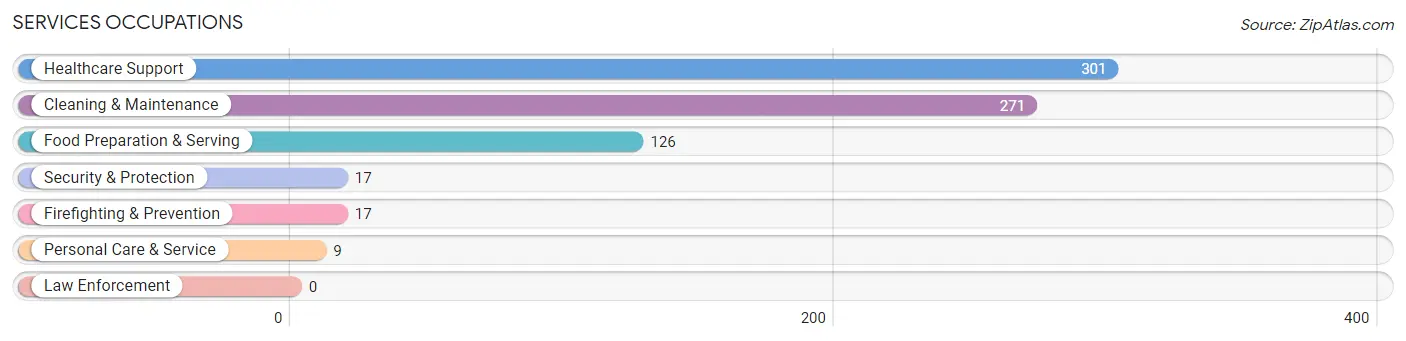
Services Occupations
The most common Services occupations in St Martinville are Healthcare Support (301 | 13.9%), Cleaning & Maintenance (271 | 12.5%), Food Preparation & Serving (126 | 5.8%), Security & Protection (17 | 0.8%), and Firefighting & Prevention (17 | 0.8%).
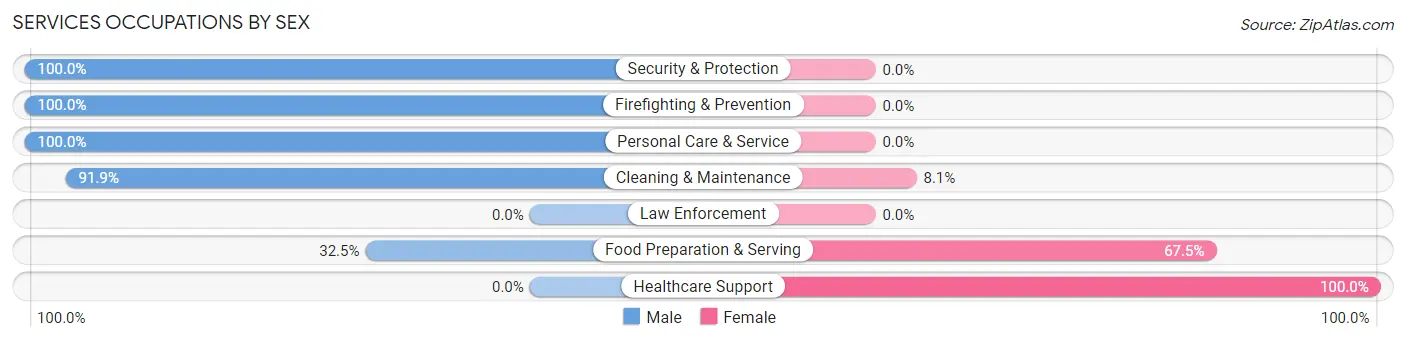
Services Occupations by Sex
Within the Services occupations in St Martinville, the most male-oriented occupations are Security & Protection (100.0%), Firefighting & Prevention (100.0%), and Personal Care & Service (100.0%), while the most female-oriented occupations are Healthcare Support (100.0%), Food Preparation & Serving (67.5%), and Cleaning & Maintenance (8.1%).
| Occupation | Male | Female |
| Healthcare Support | 0 (0.0%) | 301 (100.0%) |
| Security & Protection | 17 (100.0%) | 0 (0.0%) |
| Firefighting & Prevention | 17 (100.0%) | 0 (0.0%) |
| Law Enforcement | 0 (0.0%) | 0 (0.0%) |
| Food Preparation & Serving | 41 (32.5%) | 85 (67.5%) |
| Cleaning & Maintenance | 249 (91.9%) | 22 (8.1%) |
| Personal Care & Service | 9 (100.0%) | 0 (0.0%) |
| Total (Category) | 316 (43.6%) | 408 (56.4%) |
| Total (Overall) | 1,019 (47.0%) | 1,151 (53.0%) |
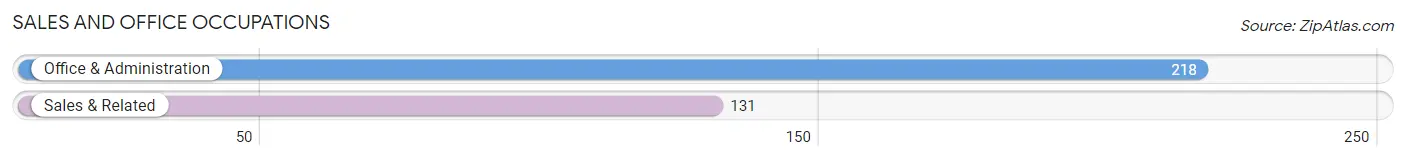
Sales and Office Occupations
The most common Sales and Office occupations in St Martinville are Office & Administration (218 | 10.1%), and Sales & Related (131 | 6.0%).
Sales and Office Occupations by Sex
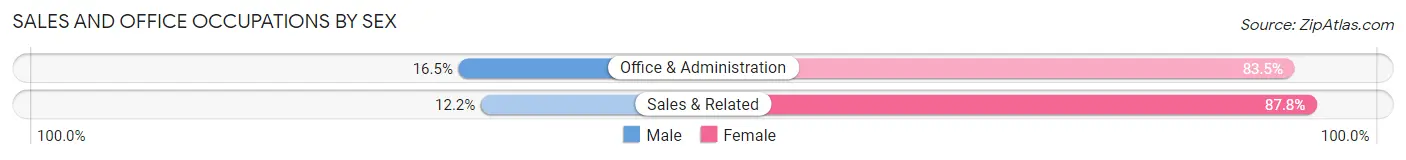
| Occupation | Male | Female |
| Sales & Related | 16 (12.2%) | 115 (87.8%) |
| Office & Administration | 36 (16.5%) | 182 (83.5%) |
| Total (Category) | 52 (14.9%) | 297 (85.1%) |
| Total (Overall) | 1,019 (47.0%) | 1,151 (53.0%) |
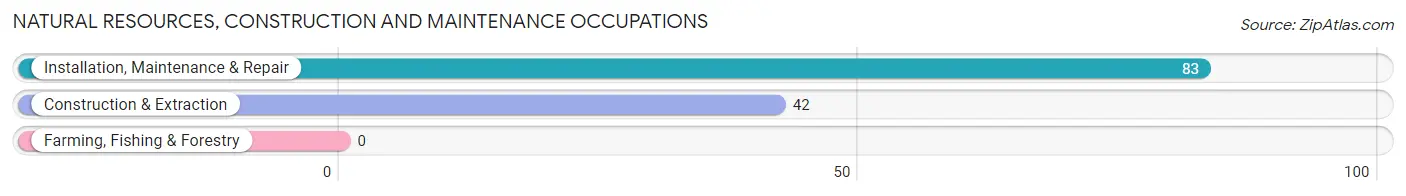
Natural Resources, Construction and Maintenance Occupations
The most common Natural Resources, Construction and Maintenance occupations in St Martinville are Installation, Maintenance & Repair (83 | 3.8%), and Construction & Extraction (42 | 1.9%).
Natural Resources, Construction and Maintenance Occupations by Sex
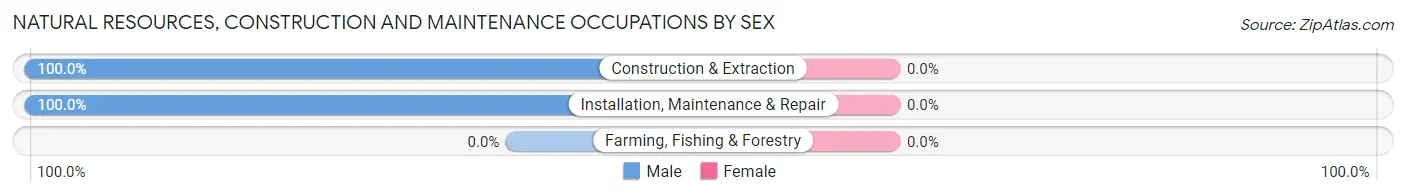
| Occupation | Male | Female |
| Farming, Fishing & Forestry | 0 (0.0%) | 0 (0.0%) |
| Construction & Extraction | 42 (100.0%) | 0 (0.0%) |
| Installation, Maintenance & Repair | 83 (100.0%) | 0 (0.0%) |
| Total (Category) | 125 (100.0%) | 0 (0.0%) |
| Total (Overall) | 1,019 (47.0%) | 1,151 (53.0%) |
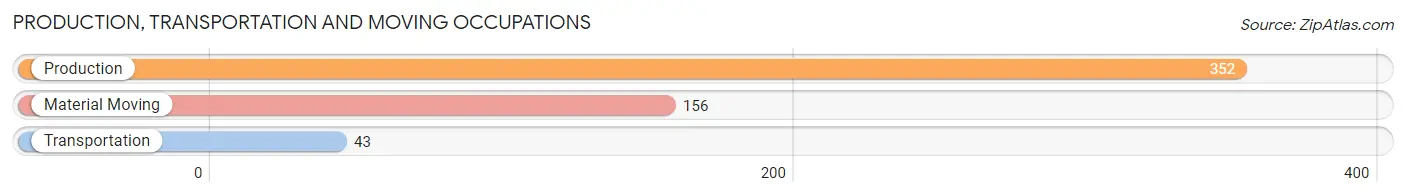
Production, Transportation and Moving Occupations
The most common Production, Transportation and Moving occupations in St Martinville are Production (352 | 16.2%), Material Moving (156 | 7.2%), and Transportation (43 | 2.0%).
Production, Transportation and Moving Occupations by Sex
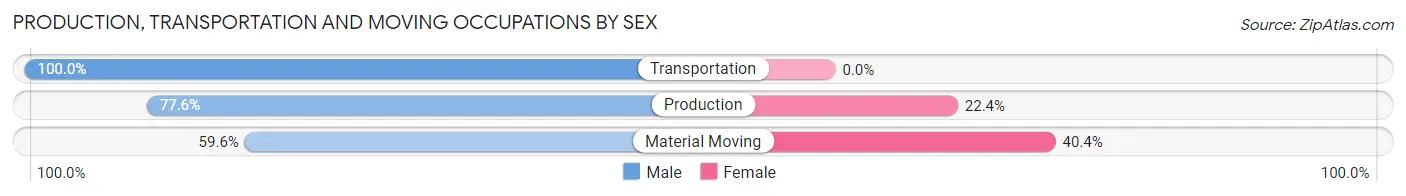
| Occupation | Male | Female |
| Production | 273 (77.6%) | 79 (22.4%) |
| Transportation | 43 (100.0%) | 0 (0.0%) |
| Material Moving | 93 (59.6%) | 63 (40.4%) |
| Total (Category) | 409 (74.2%) | 142 (25.8%) |
| Total (Overall) | 1,019 (47.0%) | 1,151 (53.0%) |
Employment Industries by Sex in St Martinville
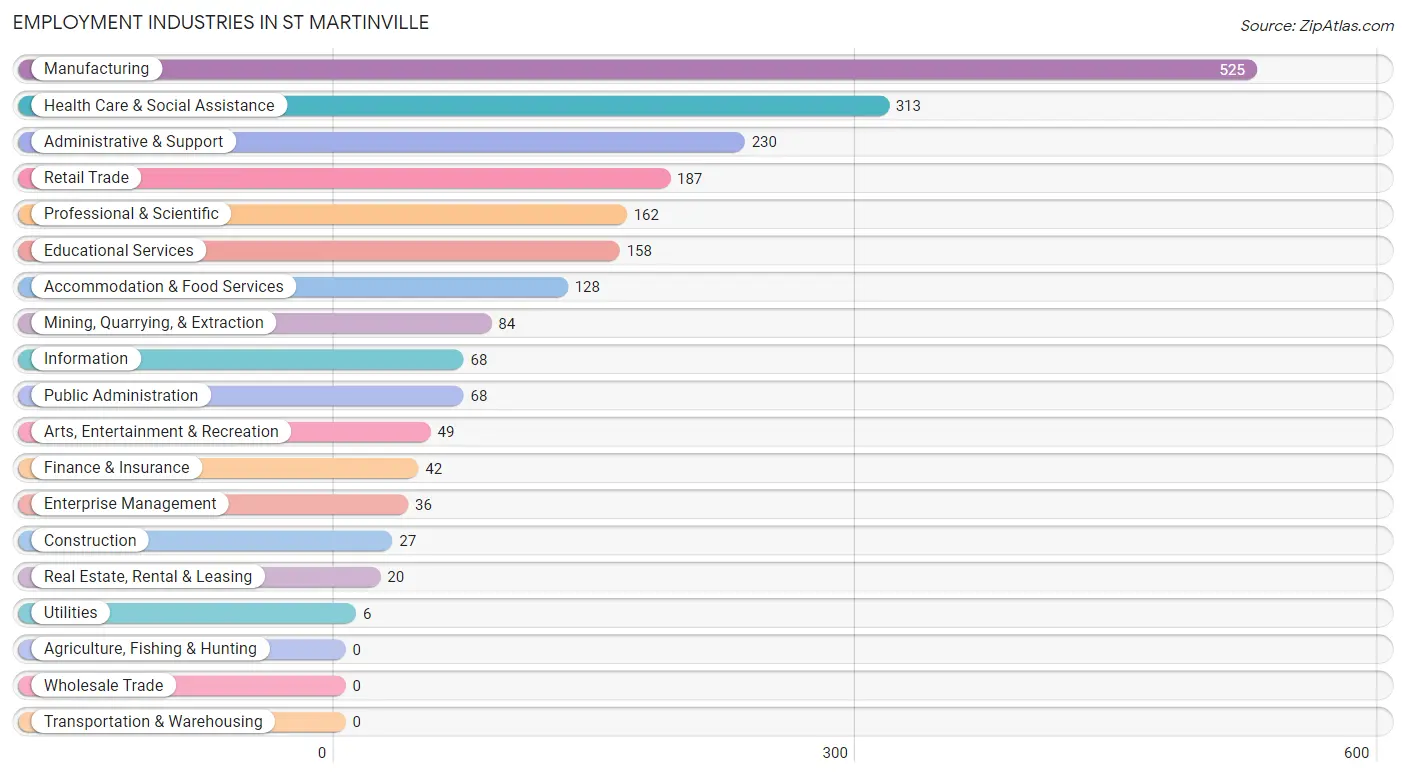
Employment Industries in St Martinville
The major employment industries in St Martinville include Manufacturing (525 | 24.2%), Health Care & Social Assistance (313 | 14.4%), Administrative & Support (230 | 10.6%), Retail Trade (187 | 8.6%), and Professional & Scientific (162 | 7.5%).
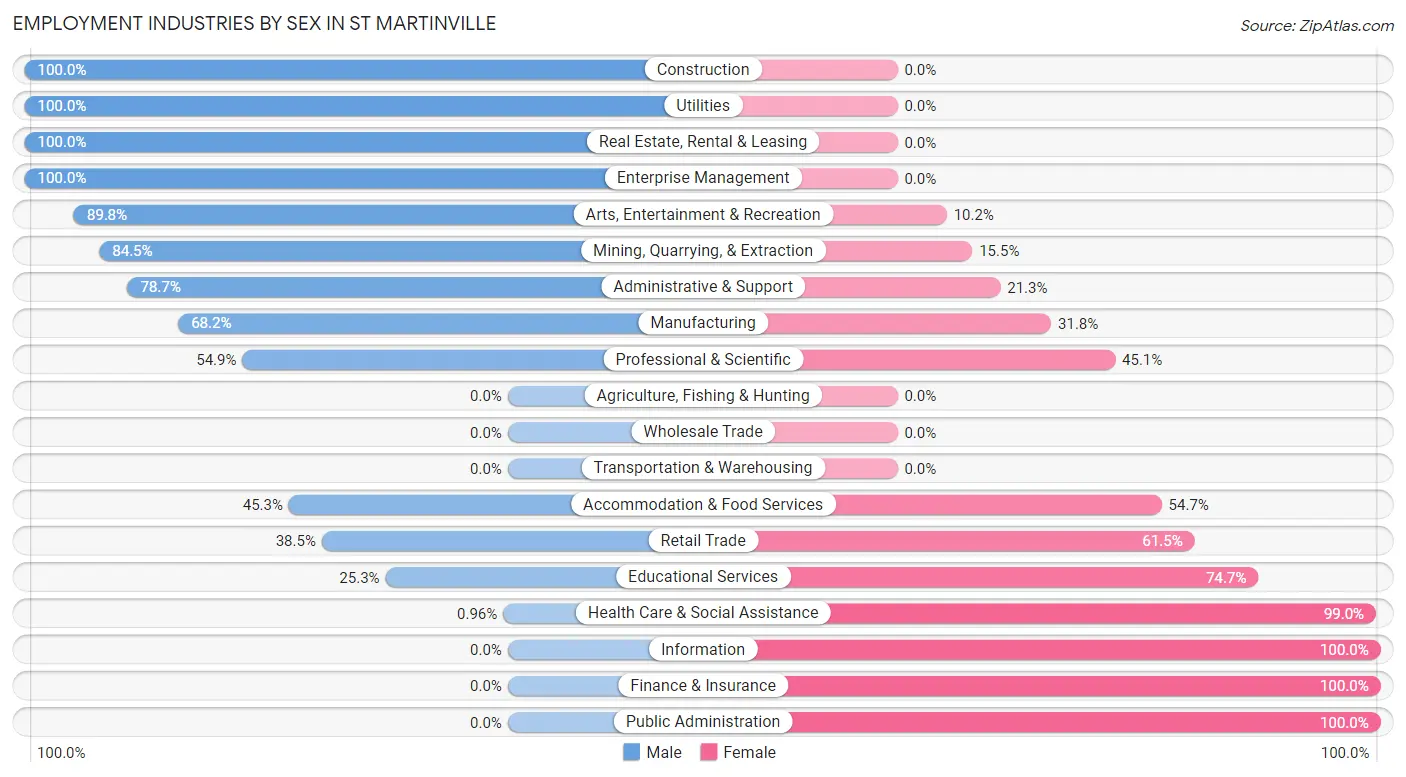
Employment Industries by Sex in St Martinville
The St Martinville industries that see more men than women are Construction (100.0%), Utilities (100.0%), and Real Estate, Rental & Leasing (100.0%), whereas the industries that tend to have a higher number of women are Information (100.0%), Finance & Insurance (100.0%), and Public Administration (100.0%).
| Industry | Male | Female |
| Agriculture, Fishing & Hunting | 0 (0.0%) | 0 (0.0%) |
| Mining, Quarrying, & Extraction | 71 (84.5%) | 13 (15.5%) |
| Construction | 27 (100.0%) | 0 (0.0%) |
| Manufacturing | 358 (68.2%) | 167 (31.8%) |
| Wholesale Trade | 0 (0.0%) | 0 (0.0%) |
| Retail Trade | 72 (38.5%) | 115 (61.5%) |
| Transportation & Warehousing | 0 (0.0%) | 0 (0.0%) |
| Utilities | 6 (100.0%) | 0 (0.0%) |
| Information | 0 (0.0%) | 68 (100.0%) |
| Finance & Insurance | 0 (0.0%) | 42 (100.0%) |
| Real Estate, Rental & Leasing | 20 (100.0%) | 0 (0.0%) |
| Professional & Scientific | 89 (54.9%) | 73 (45.1%) |
| Enterprise Management | 36 (100.0%) | 0 (0.0%) |
| Administrative & Support | 181 (78.7%) | 49 (21.3%) |
| Educational Services | 40 (25.3%) | 118 (74.7%) |
| Health Care & Social Assistance | 3 (1.0%) | 310 (99.0%) |
| Arts, Entertainment & Recreation | 44 (89.8%) | 5 (10.2%) |
| Accommodation & Food Services | 58 (45.3%) | 70 (54.7%) |
| Public Administration | 0 (0.0%) | 68 (100.0%) |
| Total | 1,019 (47.0%) | 1,151 (53.0%) |
Education in St Martinville
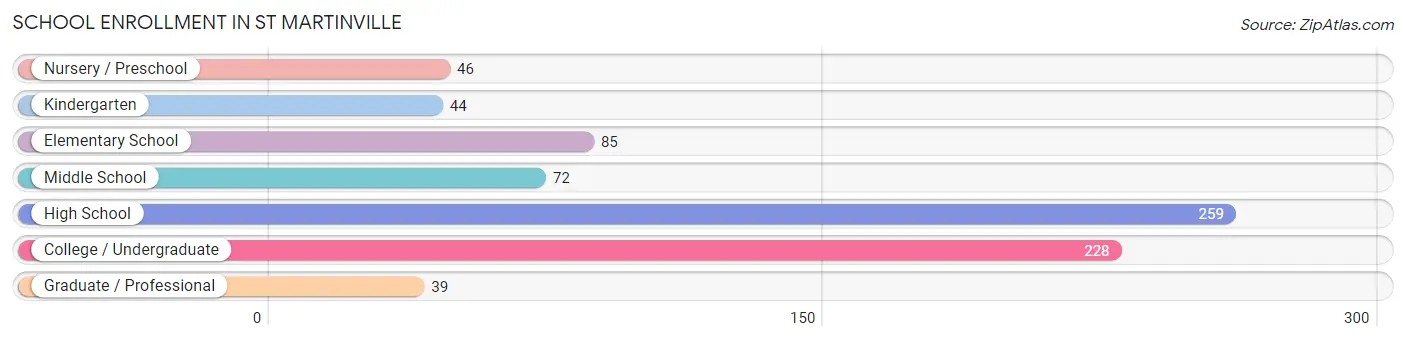
School Enrollment in St Martinville
The most common levels of schooling among the 773 students in St Martinville are high school (259 | 33.5%), college / undergraduate (228 | 29.5%), and elementary school (85 | 11.0%).
| School Level | # Students | % Students |
| Nursery / Preschool | 46 | 5.9% |
| Kindergarten | 44 | 5.7% |
| Elementary School | 85 | 11.0% |
| Middle School | 72 | 9.3% |
| High School | 259 | 33.5% |
| College / Undergraduate | 228 | 29.5% |
| Graduate / Professional | 39 | 5.1% |
| Total | 773 | 100.0% |
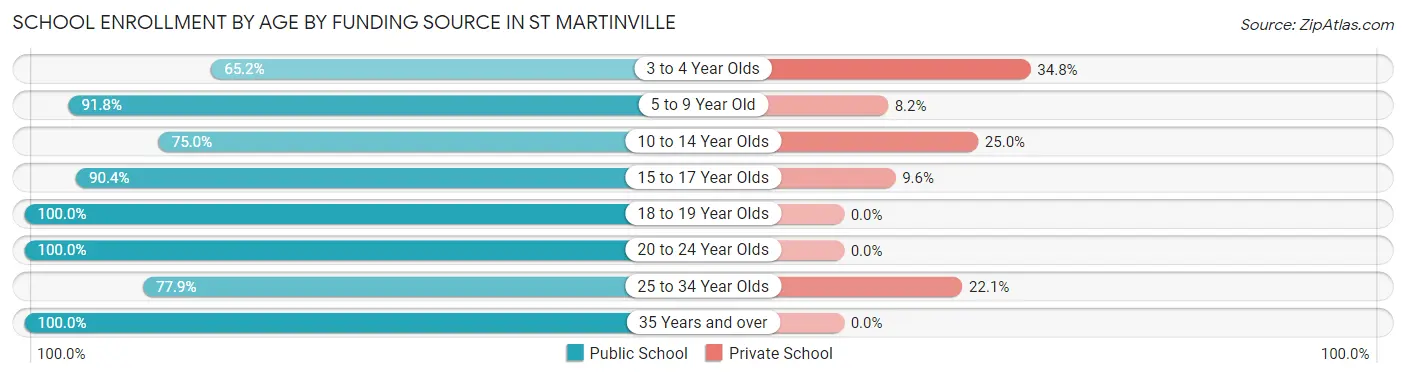
School Enrollment by Age by Funding Source in St Martinville
Out of a total of 773 students who are enrolled in schools in St Martinville, 116 (15.0%) attend a private institution, while the remaining 657 (85.0%) are enrolled in public schools. The age group of 3 to 4 year olds has the highest likelihood of being enrolled in private schools, with 16 (34.8% in the age bracket) enrolled. Conversely, the age group of 18 to 19 year olds has the lowest likelihood of being enrolled in a private school, with 3 (100.0% in the age bracket) attending a public institution.
| Age Bracket | Public School | Private School |
| 3 to 4 Year Olds | 30 (65.2%) | 16 (34.8%) |
| 5 to 9 Year Old | 112 (91.8%) | 10 (8.2%) |
| 10 to 14 Year Olds | 123 (75.0%) | 41 (25.0%) |
| 15 to 17 Year Olds | 160 (90.4%) | 17 (9.6%) |
| 18 to 19 Year Olds | 3 (100.0%) | 0 (0.0%) |
| 20 to 24 Year Olds | 86 (100.0%) | 0 (0.0%) |
| 25 to 34 Year Olds | 113 (77.9%) | 32 (22.1%) |
| 35 Years and over | 30 (100.0%) | 0 (0.0%) |
| Total | 657 (85.0%) | 116 (15.0%) |
Educational Attainment by Field of Study in St Martinville
Education (147 | 25.1%), social sciences (117 | 20.0%), engineering (96 | 16.4%), physical & health sciences (68 | 11.6%), and liberal arts & history (50 | 8.5%) are the most common fields of study among 586 individuals in St Martinville who have obtained a bachelor's degree or higher.
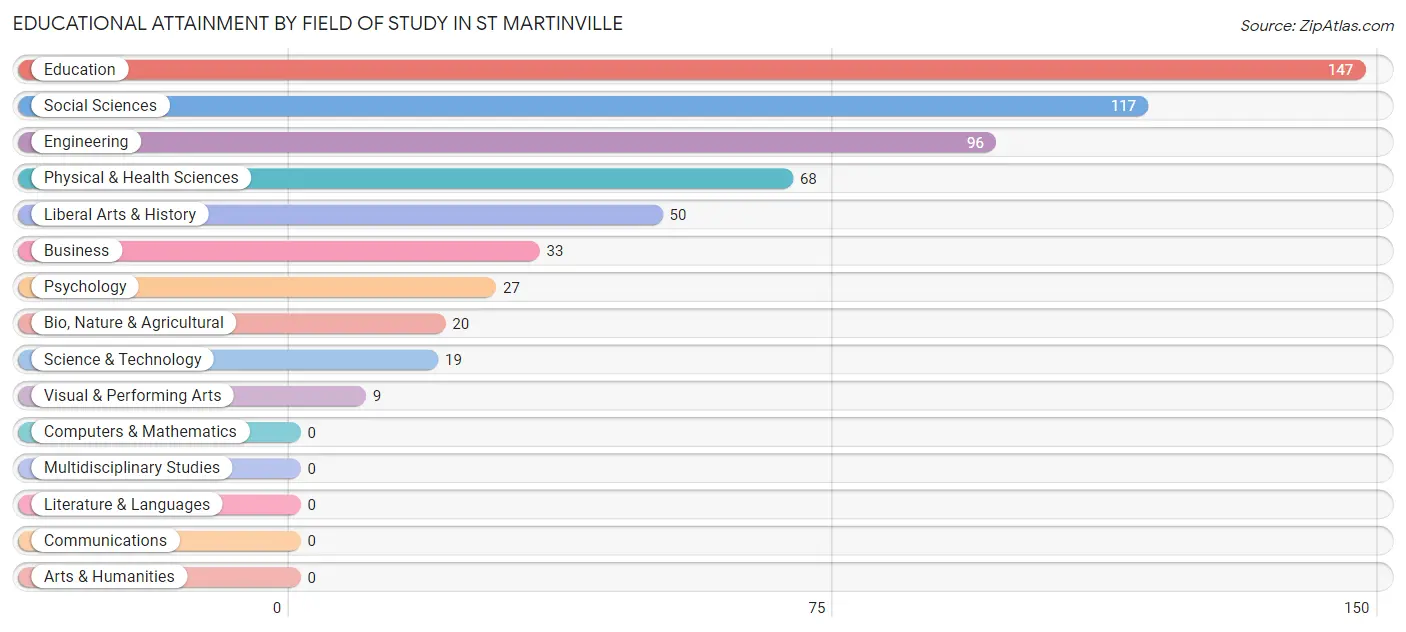
| Field of Study | # Graduates | % Graduates |
| Computers & Mathematics | 0 | 0.0% |
| Bio, Nature & Agricultural | 20 | 3.4% |
| Physical & Health Sciences | 68 | 11.6% |
| Psychology | 27 | 4.6% |
| Social Sciences | 117 | 20.0% |
| Engineering | 96 | 16.4% |
| Multidisciplinary Studies | 0 | 0.0% |
| Science & Technology | 19 | 3.2% |
| Business | 33 | 5.6% |
| Education | 147 | 25.1% |
| Literature & Languages | 0 | 0.0% |
| Liberal Arts & History | 50 | 8.5% |
| Visual & Performing Arts | 9 | 1.5% |
| Communications | 0 | 0.0% |
| Arts & Humanities | 0 | 0.0% |
| Total | 586 | 100.0% |
Transportation & Commute in St Martinville
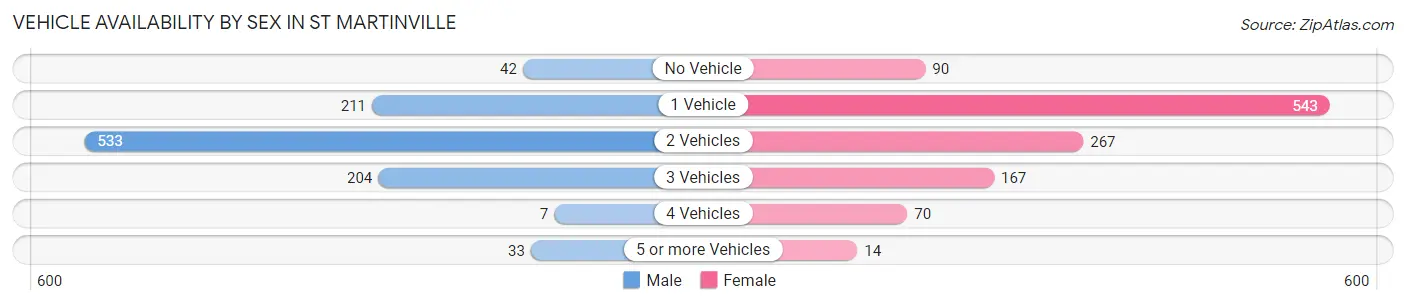
Vehicle Availability by Sex in St Martinville
The most prevalent vehicle ownership categories in St Martinville are males with 2 vehicles (533, accounting for 51.7%) and females with 2 vehicles (267, making up 46.3%).
| Vehicles Available | Male | Female |
| No Vehicle | 42 (4.1%) | 90 (7.8%) |
| 1 Vehicle | 211 (20.5%) | 543 (47.2%) |
| 2 Vehicles | 533 (51.7%) | 267 (23.2%) |
| 3 Vehicles | 204 (19.8%) | 167 (14.5%) |
| 4 Vehicles | 7 (0.7%) | 70 (6.1%) |
| 5 or more Vehicles | 33 (3.2%) | 14 (1.2%) |
| Total | 1,030 (100.0%) | 1,151 (100.0%) |
Commute Time in St Martinville
The most frequently occuring commute durations in St Martinville are 10 to 14 minutes (470 commuters, 22.2%), 30 to 34 minutes (347 commuters, 16.4%), and 5 to 9 minutes (262 commuters, 12.4%).
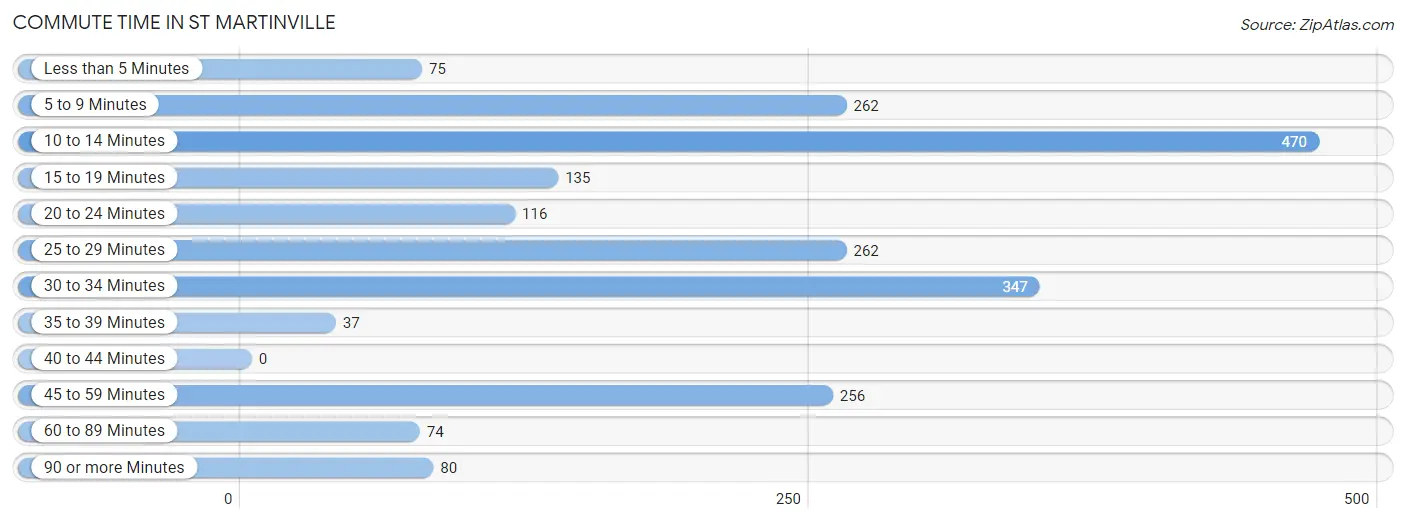
| Commute Time | # Commuters | % Commuters |
| Less than 5 Minutes | 75 | 3.5% |
| 5 to 9 Minutes | 262 | 12.4% |
| 10 to 14 Minutes | 470 | 22.2% |
| 15 to 19 Minutes | 135 | 6.4% |
| 20 to 24 Minutes | 116 | 5.5% |
| 25 to 29 Minutes | 262 | 12.4% |
| 30 to 34 Minutes | 347 | 16.4% |
| 35 to 39 Minutes | 37 | 1.8% |
| 40 to 44 Minutes | 0 | 0.0% |
| 45 to 59 Minutes | 256 | 12.1% |
| 60 to 89 Minutes | 74 | 3.5% |
| 90 or more Minutes | 80 | 3.8% |
Commute Time by Sex in St Martinville
The most common commute times in St Martinville are 10 to 14 minutes (368 commuters, 35.8%) for males and 5 to 9 minutes (226 commuters, 20.8%) for females.
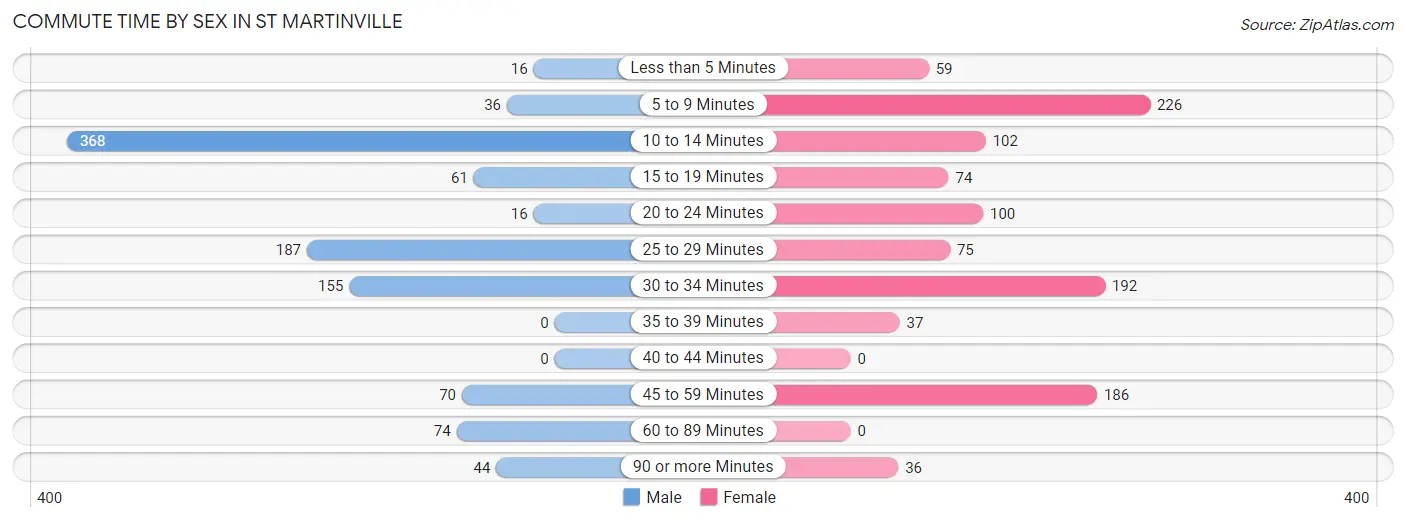
| Commute Time | Male | Female |
| Less than 5 Minutes | 16 (1.6%) | 59 (5.4%) |
| 5 to 9 Minutes | 36 (3.5%) | 226 (20.8%) |
| 10 to 14 Minutes | 368 (35.8%) | 102 (9.4%) |
| 15 to 19 Minutes | 61 (5.9%) | 74 (6.8%) |
| 20 to 24 Minutes | 16 (1.6%) | 100 (9.2%) |
| 25 to 29 Minutes | 187 (18.2%) | 75 (6.9%) |
| 30 to 34 Minutes | 155 (15.1%) | 192 (17.7%) |
| 35 to 39 Minutes | 0 (0.0%) | 37 (3.4%) |
| 40 to 44 Minutes | 0 (0.0%) | 0 (0.0%) |
| 45 to 59 Minutes | 70 (6.8%) | 186 (17.1%) |
| 60 to 89 Minutes | 74 (7.2%) | 0 (0.0%) |
| 90 or more Minutes | 44 (4.3%) | 36 (3.3%) |
Time of Departure to Work by Sex in St Martinville
The most frequent times of departure to work in St Martinville are 7:00 AM to 7:29 AM (369, 35.9%) for males and 7:30 AM to 7:59 AM (259, 23.8%) for females.
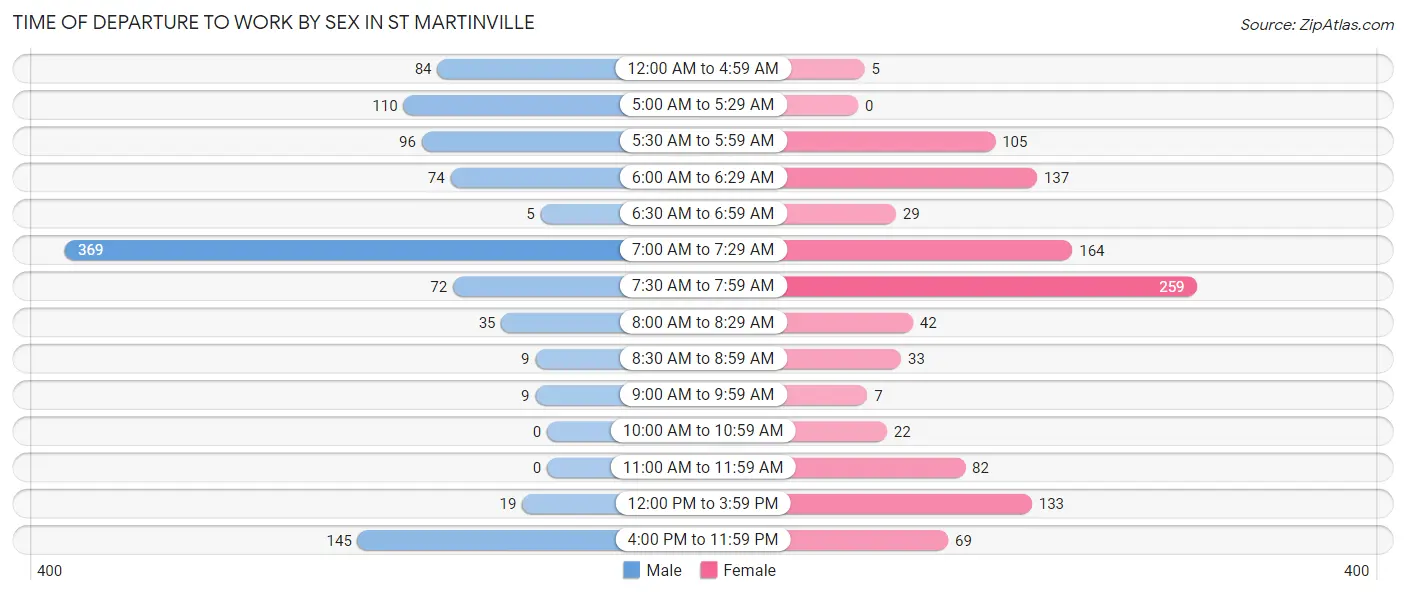
| Time of Departure | Male | Female |
| 12:00 AM to 4:59 AM | 84 (8.2%) | 5 (0.5%) |
| 5:00 AM to 5:29 AM | 110 (10.7%) | 0 (0.0%) |
| 5:30 AM to 5:59 AM | 96 (9.3%) | 105 (9.7%) |
| 6:00 AM to 6:29 AM | 74 (7.2%) | 137 (12.6%) |
| 6:30 AM to 6:59 AM | 5 (0.5%) | 29 (2.7%) |
| 7:00 AM to 7:29 AM | 369 (35.9%) | 164 (15.1%) |
| 7:30 AM to 7:59 AM | 72 (7.0%) | 259 (23.8%) |
| 8:00 AM to 8:29 AM | 35 (3.4%) | 42 (3.9%) |
| 8:30 AM to 8:59 AM | 9 (0.9%) | 33 (3.0%) |
| 9:00 AM to 9:59 AM | 9 (0.9%) | 7 (0.6%) |
| 10:00 AM to 10:59 AM | 0 (0.0%) | 22 (2.0%) |
| 11:00 AM to 11:59 AM | 0 (0.0%) | 82 (7.5%) |
| 12:00 PM to 3:59 PM | 19 (1.8%) | 133 (12.2%) |
| 4:00 PM to 11:59 PM | 145 (14.1%) | 69 (6.4%) |
| Total | 1,027 (100.0%) | 1,087 (100.0%) |
Housing Occupancy in St Martinville
Occupancy by Ownership in St Martinville
Of the total 2,803 dwellings in St Martinville, owner-occupied units account for 1,475 (52.6%), while renter-occupied units make up 1,328 (47.4%).
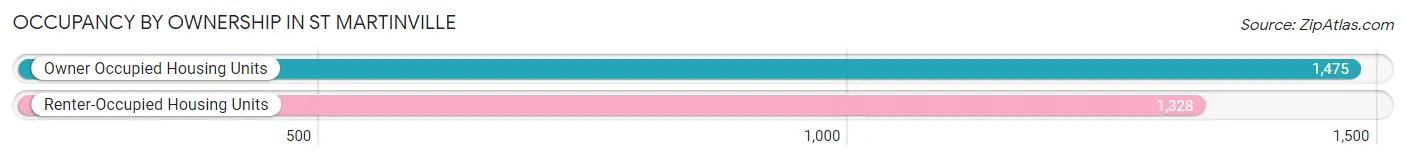
| Occupancy | # Housing Units | % Housing Units |
| Owner Occupied Housing Units | 1,475 | 52.6% |
| Renter-Occupied Housing Units | 1,328 | 47.4% |
| Total Occupied Housing Units | 2,803 | 100.0% |
Occupancy by Household Size in St Martinville
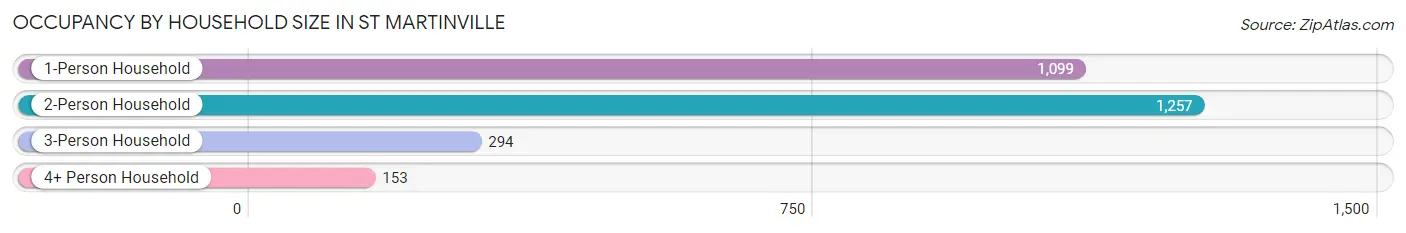
| Household Size | # Housing Units | % Housing Units |
| 1-Person Household | 1,099 | 39.2% |
| 2-Person Household | 1,257 | 44.8% |
| 3-Person Household | 294 | 10.5% |
| 4+ Person Household | 153 | 5.5% |
| Total Housing Units | 2,803 | 100.0% |
Occupancy by Ownership by Household Size in St Martinville
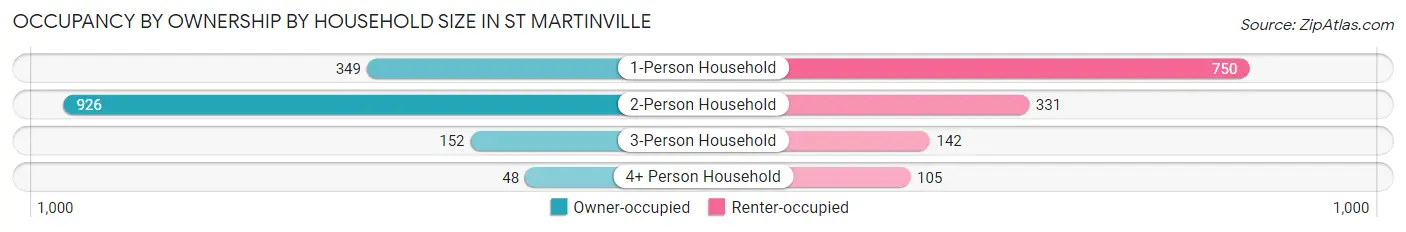
| Household Size | Owner-occupied | Renter-occupied |
| 1-Person Household | 349 (31.8%) | 750 (68.2%) |
| 2-Person Household | 926 (73.7%) | 331 (26.3%) |
| 3-Person Household | 152 (51.7%) | 142 (48.3%) |
| 4+ Person Household | 48 (31.4%) | 105 (68.6%) |
| Total Housing Units | 1,475 (52.6%) | 1,328 (47.4%) |
Occupancy by Educational Attainment in St Martinville
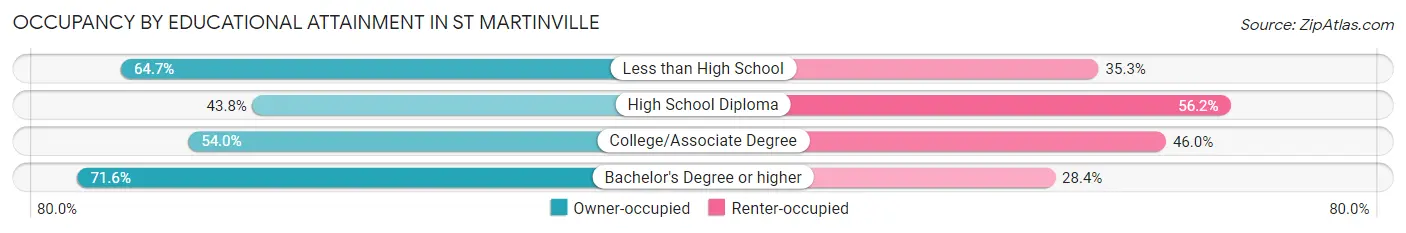
| Household Size | Owner-occupied | Renter-occupied |
| Less than High School | 330 (64.7%) | 180 (35.3%) |
| High School Diploma | 643 (43.8%) | 824 (56.2%) |
| College/Associate Degree | 275 (54.0%) | 234 (46.0%) |
| Bachelor's Degree or higher | 227 (71.6%) | 90 (28.4%) |
Occupancy by Age of Householder in St Martinville
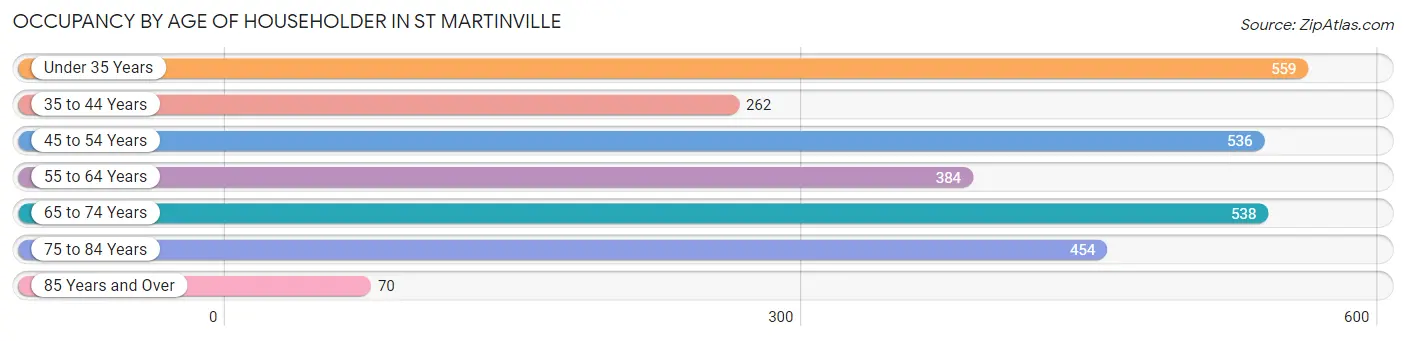
| Age Bracket | # Households | % Households |
| Under 35 Years | 559 | 19.9% |
| 35 to 44 Years | 262 | 9.3% |
| 45 to 54 Years | 536 | 19.1% |
| 55 to 64 Years | 384 | 13.7% |
| 65 to 74 Years | 538 | 19.2% |
| 75 to 84 Years | 454 | 16.2% |
| 85 Years and Over | 70 | 2.5% |
| Total | 2,803 | 100.0% |
Housing Finances in St Martinville
Median Income by Occupancy in St Martinville
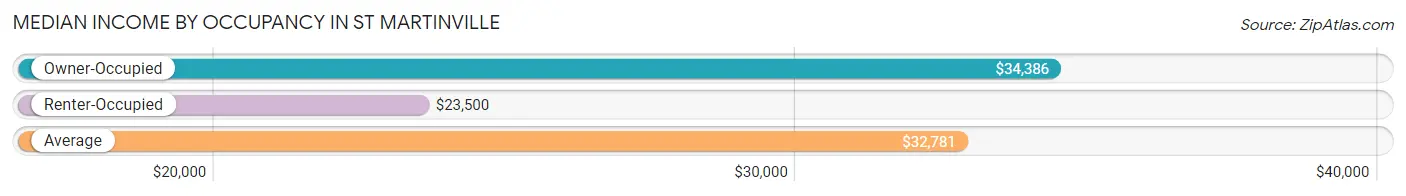
| Occupancy Type | # Households | Median Income |
| Owner-Occupied | 1,475 (52.6%) | $34,386 |
| Renter-Occupied | 1,328 (47.4%) | $23,500 |
| Average | 2,803 (100.0%) | $32,781 |
Occupancy by Householder Income Bracket in St Martinville
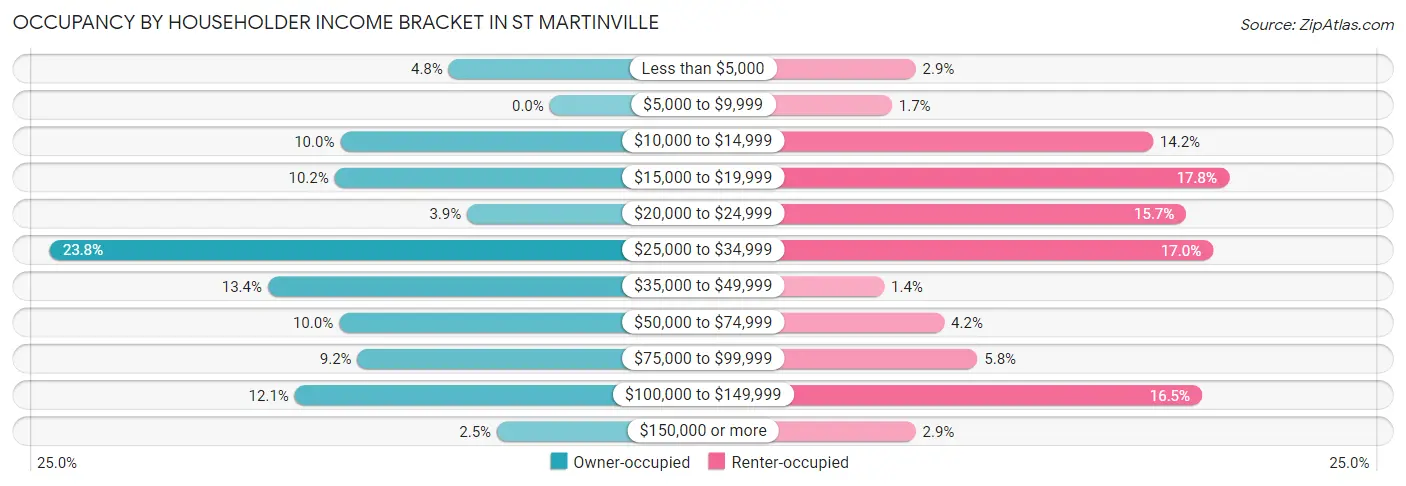
| Income Bracket | Owner-occupied | Renter-occupied |
| Less than $5,000 | 71 (4.8%) | 38 (2.9%) |
| $5,000 to $9,999 | 0 (0.0%) | 23 (1.7%) |
| $10,000 to $14,999 | 147 (10.0%) | 188 (14.2%) |
| $15,000 to $19,999 | 151 (10.2%) | 236 (17.8%) |
| $20,000 to $24,999 | 58 (3.9%) | 209 (15.7%) |
| $25,000 to $34,999 | 351 (23.8%) | 226 (17.0%) |
| $35,000 to $49,999 | 198 (13.4%) | 18 (1.4%) |
| $50,000 to $74,999 | 148 (10.0%) | 56 (4.2%) |
| $75,000 to $99,999 | 135 (9.1%) | 77 (5.8%) |
| $100,000 to $149,999 | 179 (12.1%) | 219 (16.5%) |
| $150,000 or more | 37 (2.5%) | 38 (2.9%) |
| Total | 1,475 (100.0%) | 1,328 (100.0%) |
Monthly Housing Cost Tiers in St Martinville
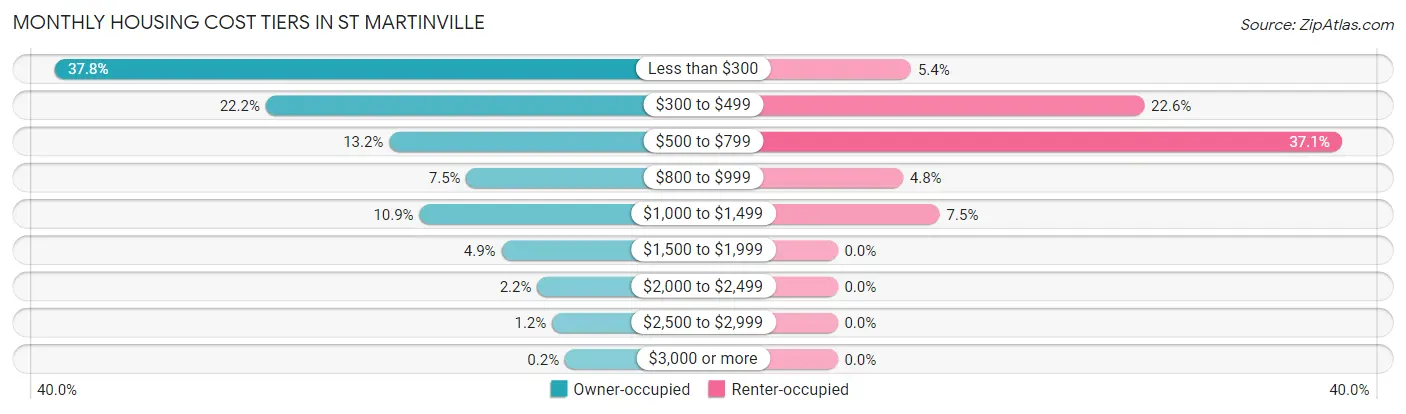
| Monthly Cost | Owner-occupied | Renter-occupied |
| Less than $300 | 557 (37.8%) | 72 (5.4%) |
| $300 to $499 | 328 (22.2%) | 300 (22.6%) |
| $500 to $799 | 194 (13.2%) | 493 (37.1%) |
| $800 to $999 | 110 (7.5%) | 64 (4.8%) |
| $1,000 to $1,499 | 161 (10.9%) | 100 (7.5%) |
| $1,500 to $1,999 | 72 (4.9%) | 0 (0.0%) |
| $2,000 to $2,499 | 33 (2.2%) | 0 (0.0%) |
| $2,500 to $2,999 | 17 (1.1%) | 0 (0.0%) |
| $3,000 or more | 3 (0.2%) | 0 (0.0%) |
| Total | 1,475 (100.0%) | 1,328 (100.0%) |
Physical Housing Characteristics in St Martinville
Housing Structures in St Martinville
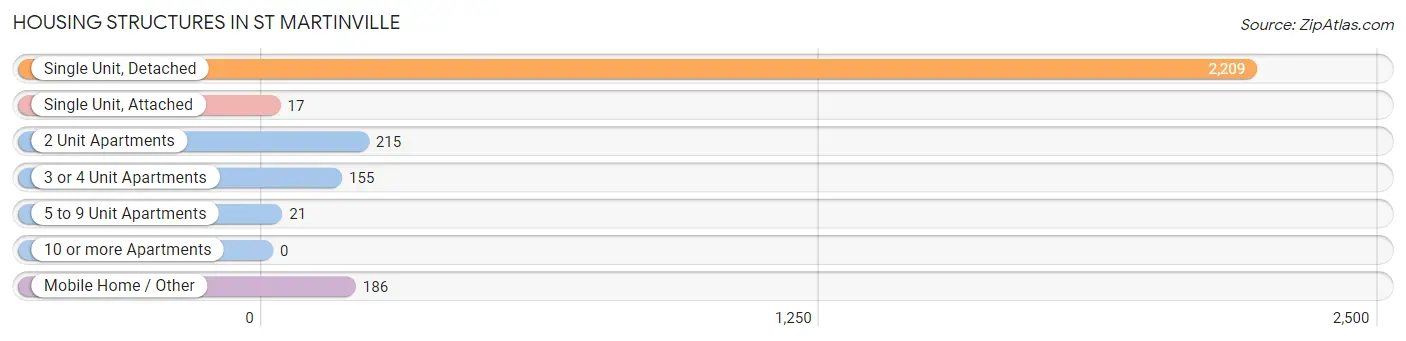
| Structure Type | # Housing Units | % Housing Units |
| Single Unit, Detached | 2,209 | 78.8% |
| Single Unit, Attached | 17 | 0.6% |
| 2 Unit Apartments | 215 | 7.7% |
| 3 or 4 Unit Apartments | 155 | 5.5% |
| 5 to 9 Unit Apartments | 21 | 0.7% |
| 10 or more Apartments | 0 | 0.0% |
| Mobile Home / Other | 186 | 6.6% |
| Total | 2,803 | 100.0% |
Housing Structures by Occupancy in St Martinville
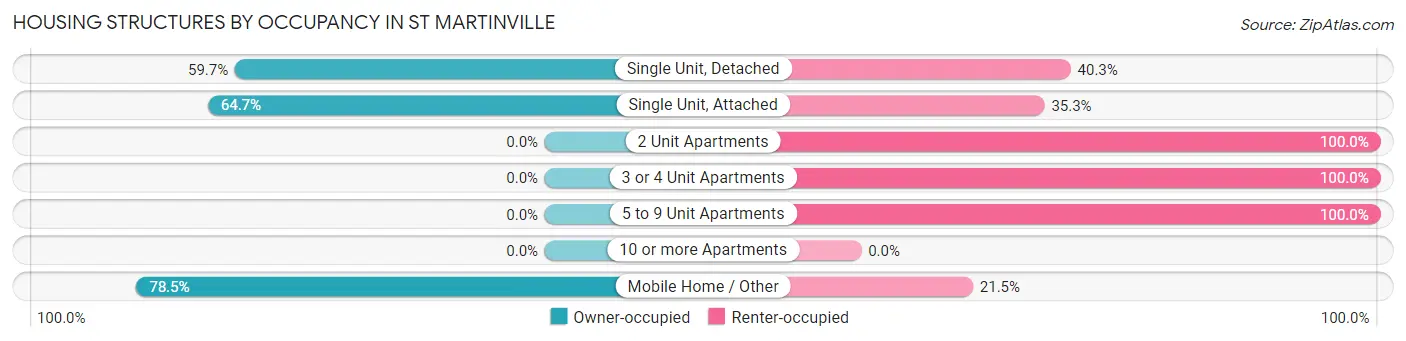
| Structure Type | Owner-occupied | Renter-occupied |
| Single Unit, Detached | 1,318 (59.7%) | 891 (40.3%) |
| Single Unit, Attached | 11 (64.7%) | 6 (35.3%) |
| 2 Unit Apartments | 0 (0.0%) | 215 (100.0%) |
| 3 or 4 Unit Apartments | 0 (0.0%) | 155 (100.0%) |
| 5 to 9 Unit Apartments | 0 (0.0%) | 21 (100.0%) |
| 10 or more Apartments | 0 (0.0%) | 0 (0.0%) |
| Mobile Home / Other | 146 (78.5%) | 40 (21.5%) |
| Total | 1,475 (52.6%) | 1,328 (47.4%) |
Housing Structures by Number of Rooms in St Martinville
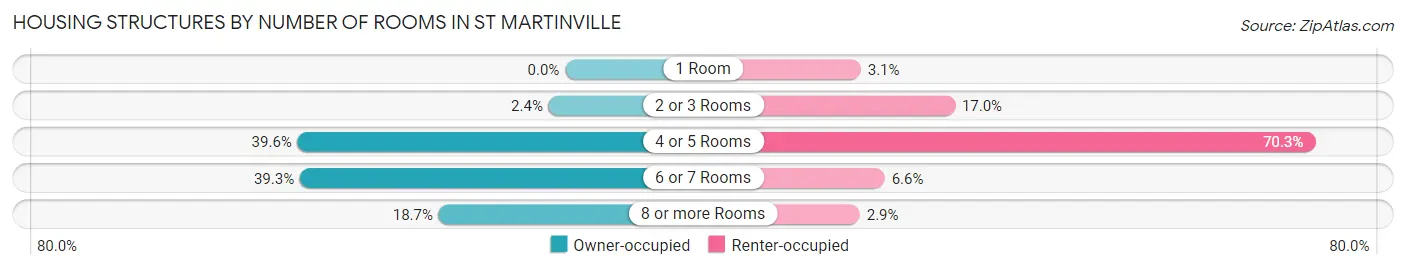
| Number of Rooms | Owner-occupied | Renter-occupied |
| 1 Room | 0 (0.0%) | 41 (3.1%) |
| 2 or 3 Rooms | 36 (2.4%) | 226 (17.0%) |
| 4 or 5 Rooms | 584 (39.6%) | 934 (70.3%) |
| 6 or 7 Rooms | 579 (39.3%) | 88 (6.6%) |
| 8 or more Rooms | 276 (18.7%) | 39 (2.9%) |
| Total | 1,475 (100.0%) | 1,328 (100.0%) |
Housing Structure by Heating Type in St Martinville
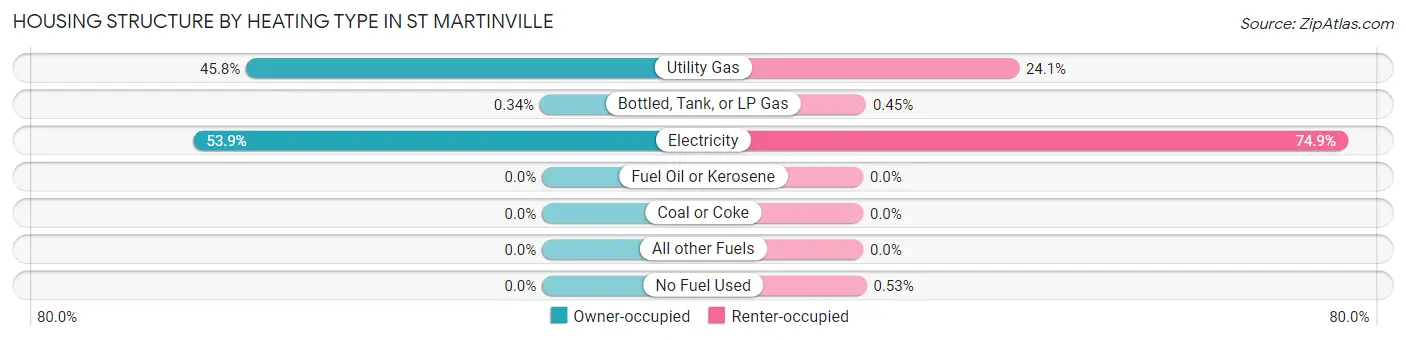
| Heating Type | Owner-occupied | Renter-occupied |
| Utility Gas | 675 (45.8%) | 320 (24.1%) |
| Bottled, Tank, or LP Gas | 5 (0.3%) | 6 (0.4%) |
| Electricity | 795 (53.9%) | 995 (74.9%) |
| Fuel Oil or Kerosene | 0 (0.0%) | 0 (0.0%) |
| Coal or Coke | 0 (0.0%) | 0 (0.0%) |
| All other Fuels | 0 (0.0%) | 0 (0.0%) |
| No Fuel Used | 0 (0.0%) | 7 (0.5%) |
| Total | 1,475 (100.0%) | 1,328 (100.0%) |
Household Vehicle Usage in St Martinville
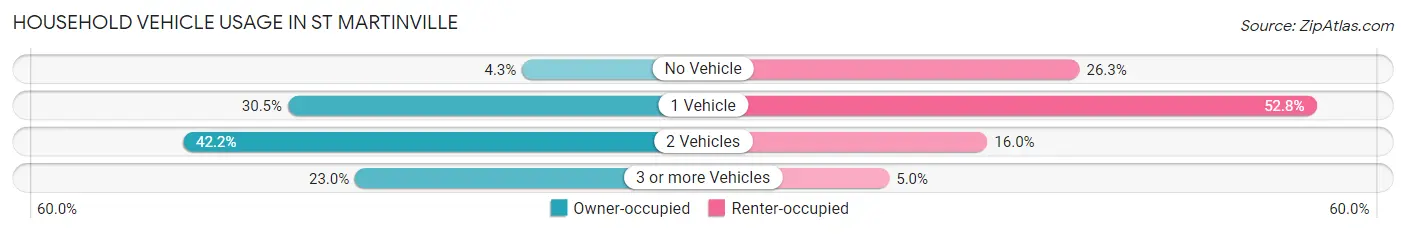
| Vehicles per Household | Owner-occupied | Renter-occupied |
| No Vehicle | 63 (4.3%) | 349 (26.3%) |
| 1 Vehicle | 450 (30.5%) | 701 (52.8%) |
| 2 Vehicles | 623 (42.2%) | 212 (16.0%) |
| 3 or more Vehicles | 339 (23.0%) | 66 (5.0%) |
| Total | 1,475 (100.0%) | 1,328 (100.0%) |
Real Estate & Mortgages in St Martinville
Real Estate and Mortgage Overview in St Martinville
| Characteristic | Without Mortgage | With Mortgage |
| Housing Units | 1,000 | 475 |
| Median Property Value | $94,800 | $159,900 |
| Median Household Income | $33,374 | $25 |
| Monthly Housing Costs | $287 | $3 |
| Real Estate Taxes | $199 | $21 |
Property Value by Mortgage Status in St Martinville
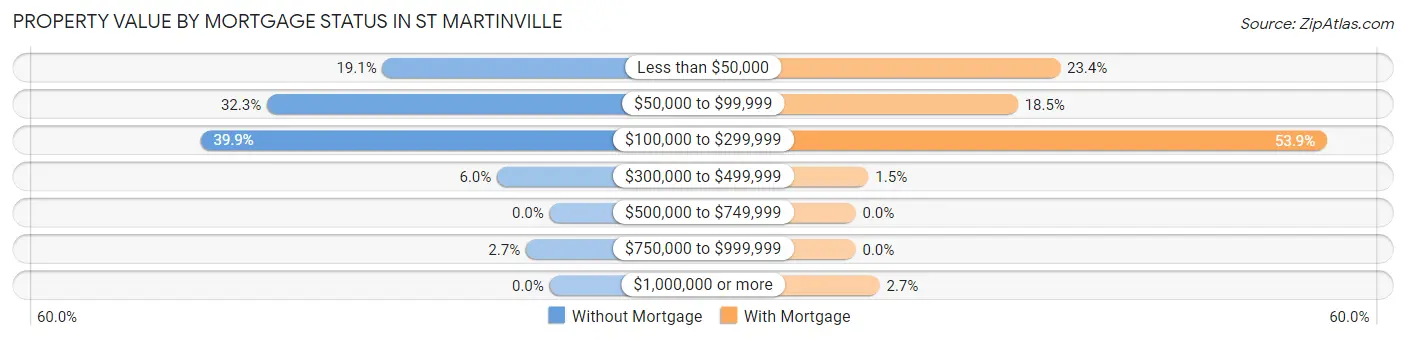
| Property Value | Without Mortgage | With Mortgage |
| Less than $50,000 | 191 (19.1%) | 111 (23.4%) |
| $50,000 to $99,999 | 323 (32.3%) | 88 (18.5%) |
| $100,000 to $299,999 | 399 (39.9%) | 256 (53.9%) |
| $300,000 to $499,999 | 60 (6.0%) | 7 (1.5%) |
| $500,000 to $749,999 | 0 (0.0%) | 0 (0.0%) |
| $750,000 to $999,999 | 27 (2.7%) | 0 (0.0%) |
| $1,000,000 or more | 0 (0.0%) | 13 (2.7%) |
| Total | 1,000 (100.0%) | 475 (100.0%) |
Household Income by Mortgage Status in St Martinville
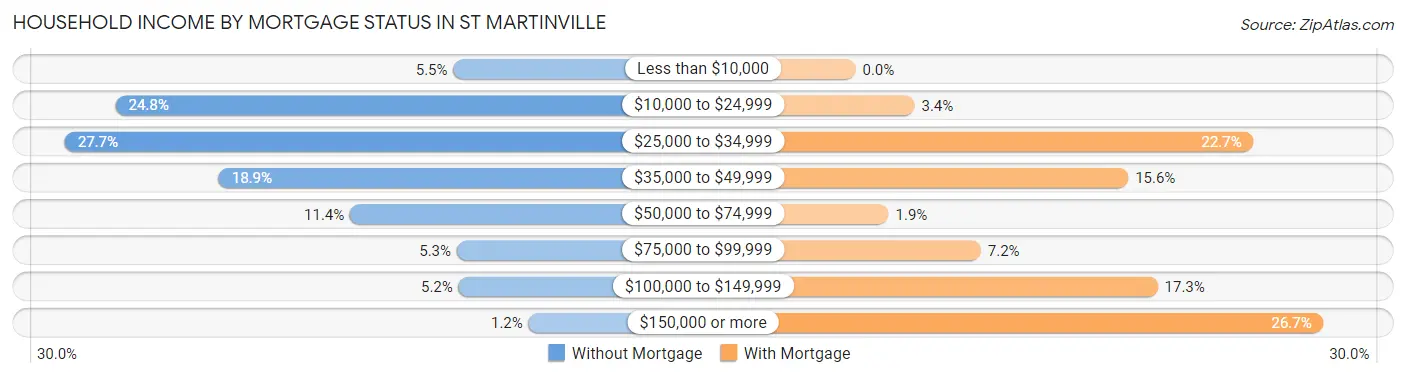
| Household Income | Without Mortgage | With Mortgage |
| Less than $10,000 | 55 (5.5%) | 0 (0.0%) |
| $10,000 to $24,999 | 248 (24.8%) | 16 (3.4%) |
| $25,000 to $34,999 | 277 (27.7%) | 108 (22.7%) |
| $35,000 to $49,999 | 189 (18.9%) | 74 (15.6%) |
| $50,000 to $74,999 | 114 (11.4%) | 9 (1.9%) |
| $75,000 to $99,999 | 53 (5.3%) | 34 (7.2%) |
| $100,000 to $149,999 | 52 (5.2%) | 82 (17.3%) |
| $150,000 or more | 12 (1.2%) | 127 (26.7%) |
| Total | 1,000 (100.0%) | 475 (100.0%) |
Property Value to Household Income Ratio in St Martinville
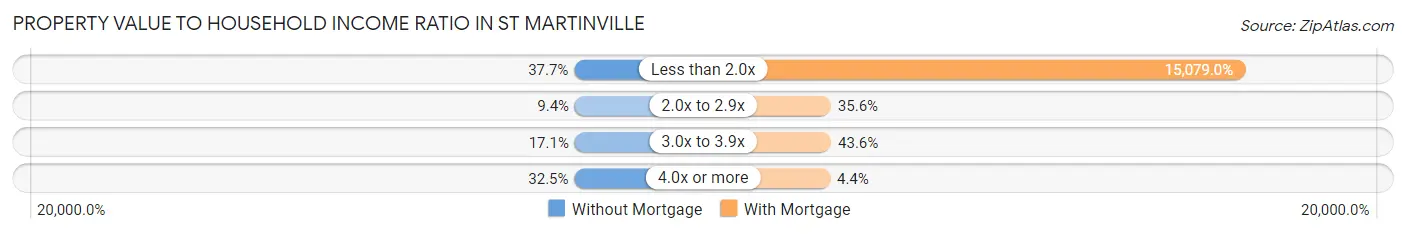
| Value-to-Income Ratio | Without Mortgage | With Mortgage |
| Less than 2.0x | 377 (37.7%) | 71,625 (15,079.0%) |
| 2.0x to 2.9x | 94 (9.4%) | 169 (35.6%) |
| 3.0x to 3.9x | 171 (17.1%) | 207 (43.6%) |
| 4.0x or more | 325 (32.5%) | 21 (4.4%) |
| Total | 1,000 (100.0%) | 475 (100.0%) |
Real Estate Taxes by Mortgage Status in St Martinville
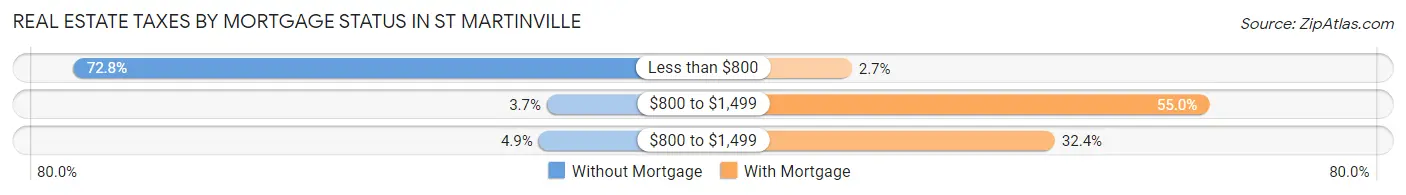
| Property Taxes | Without Mortgage | With Mortgage |
| Less than $800 | 728 (72.8%) | 13 (2.7%) |
| $800 to $1,499 | 37 (3.7%) | 261 (54.9%) |
| $800 to $1,499 | 49 (4.9%) | 154 (32.4%) |
| Total | 1,000 (100.0%) | 475 (100.0%) |
Health & Disability in St Martinville
Health Insurance Coverage by Age in St Martinville
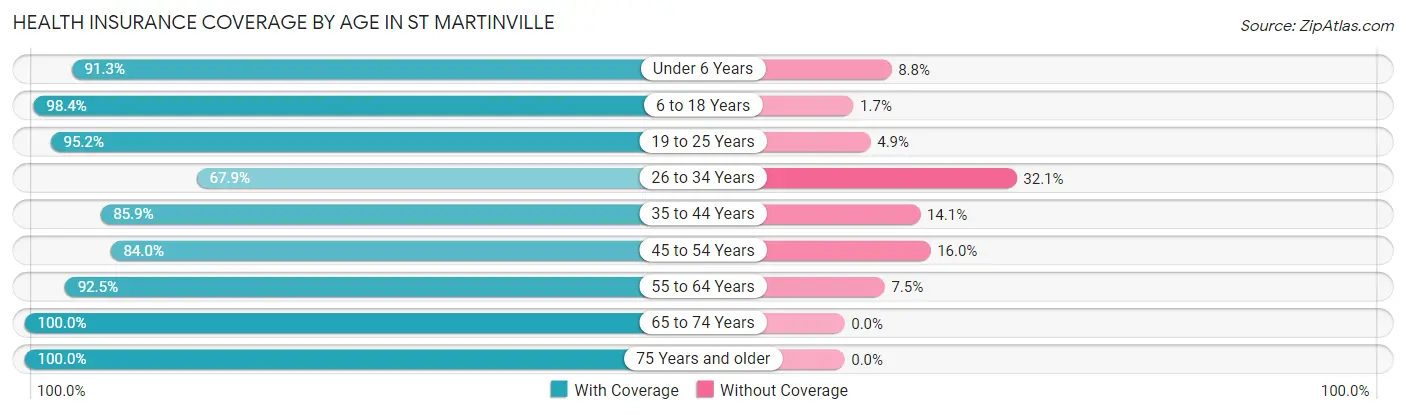
| Age Bracket | With Coverage | Without Coverage |
| Under 6 Years | 240 (91.2%) | 23 (8.7%) |
| 6 to 18 Years | 478 (98.4%) | 8 (1.7%) |
| 19 to 25 Years | 255 (95.2%) | 13 (4.9%) |
| 26 to 34 Years | 658 (67.9%) | 311 (32.1%) |
| 35 to 44 Years | 420 (85.9%) | 69 (14.1%) |
| 45 to 54 Years | 603 (84.0%) | 115 (16.0%) |
| 55 to 64 Years | 679 (92.5%) | 55 (7.5%) |
| 65 to 74 Years | 665 (100.0%) | 0 (0.0%) |
| 75 Years and older | 778 (100.0%) | 0 (0.0%) |
| Total | 4,776 (88.9%) | 594 (11.1%) |
Health Insurance Coverage by Citizenship Status in St Martinville
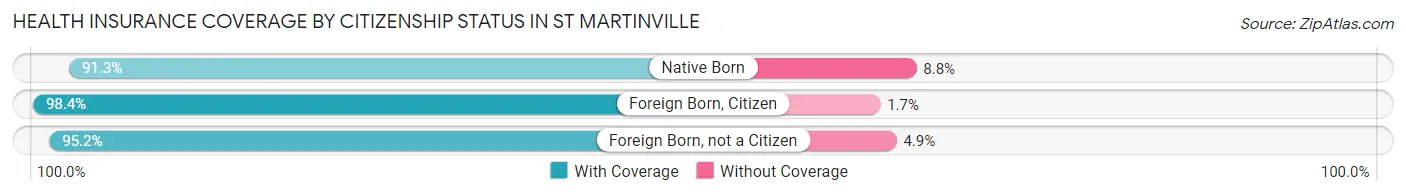
| Citizenship Status | With Coverage | Without Coverage |
| Native Born | 240 (91.2%) | 23 (8.7%) |
| Foreign Born, Citizen | 478 (98.4%) | 8 (1.7%) |
| Foreign Born, not a Citizen | 255 (95.2%) | 13 (4.9%) |
Health Insurance Coverage by Household Income in St Martinville
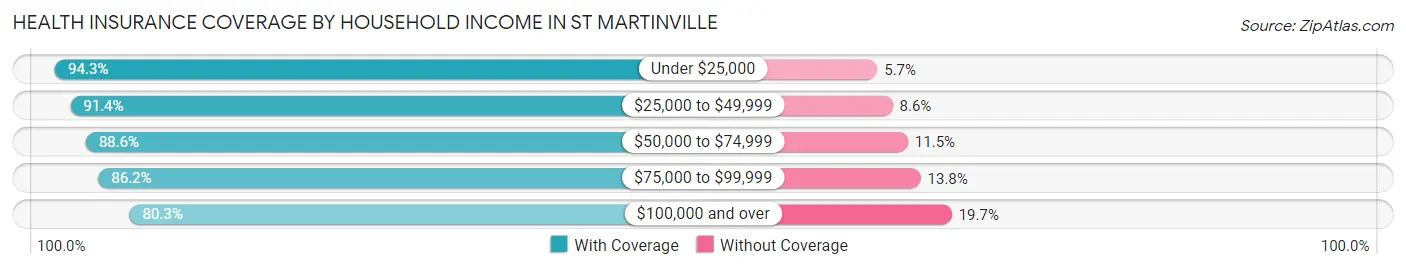
| Household Income | With Coverage | Without Coverage |
| Under $25,000 | 1,683 (94.3%) | 102 (5.7%) |
| $25,000 to $49,999 | 1,130 (91.4%) | 106 (8.6%) |
| $50,000 to $74,999 | 487 (88.5%) | 63 (11.5%) |
| $75,000 to $99,999 | 436 (86.2%) | 70 (13.8%) |
| $100,000 and over | 1,030 (80.3%) | 252 (19.7%) |
Public vs Private Health Insurance Coverage by Age in St Martinville
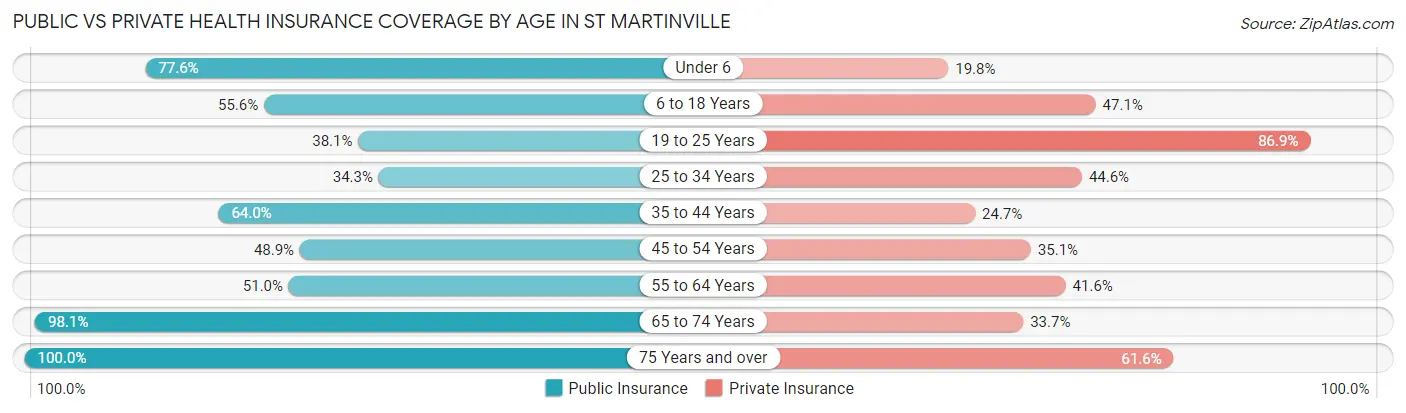
| Age Bracket | Public Insurance | Private Insurance |
| Under 6 | 204 (77.6%) | 52 (19.8%) |
| 6 to 18 Years | 270 (55.6%) | 229 (47.1%) |
| 19 to 25 Years | 102 (38.1%) | 233 (86.9%) |
| 25 to 34 Years | 332 (34.3%) | 432 (44.6%) |
| 35 to 44 Years | 313 (64.0%) | 121 (24.7%) |
| 45 to 54 Years | 351 (48.9%) | 252 (35.1%) |
| 55 to 64 Years | 374 (50.9%) | 305 (41.5%) |
| 65 to 74 Years | 652 (98.1%) | 224 (33.7%) |
| 75 Years and over | 778 (100.0%) | 479 (61.6%) |
| Total | 3,376 (62.9%) | 2,327 (43.3%) |
Disability Status by Sex by Age in St Martinville
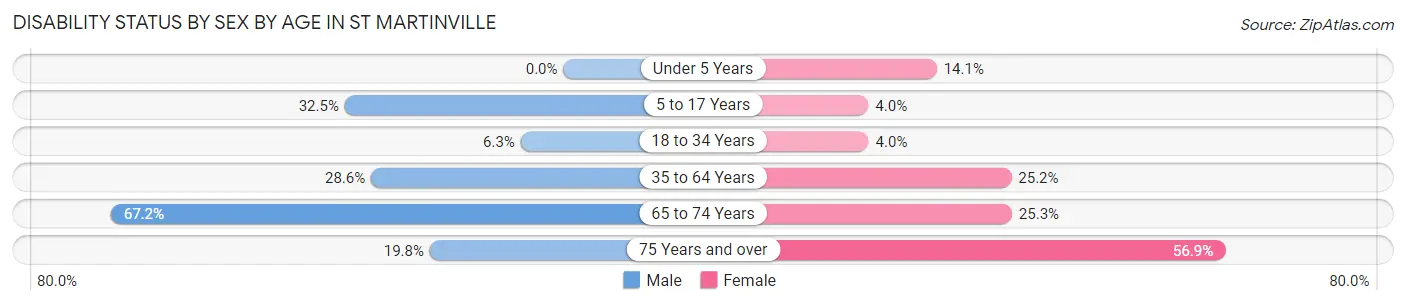
| Age Bracket | Male | Female |
| Under 5 Years | 0 (0.0%) | 22 (14.1%) |
| 5 to 17 Years | 74 (32.5%) | 10 (4.0%) |
| 18 to 34 Years | 45 (6.3%) | 23 (4.0%) |
| 35 to 64 Years | 231 (28.5%) | 285 (25.2%) |
| 65 to 74 Years | 250 (67.2%) | 74 (25.3%) |
| 75 Years and over | 71 (19.8%) | 239 (56.9%) |
Disability Class by Sex by Age in St Martinville
Disability Class: Hearing Difficulty

| Age Bracket | Male | Female |
| Under 5 Years | 0 (0.0%) | 0 (0.0%) |
| 5 to 17 Years | 10 (4.4%) | 0 (0.0%) |
| 18 to 34 Years | 0 (0.0%) | 0 (0.0%) |
| 35 to 64 Years | 30 (3.7%) | 69 (6.1%) |
| 65 to 74 Years | 26 (7.0%) | 3 (1.0%) |
| 75 Years and over | 13 (3.6%) | 30 (7.1%) |
Disability Class: Vision Difficulty
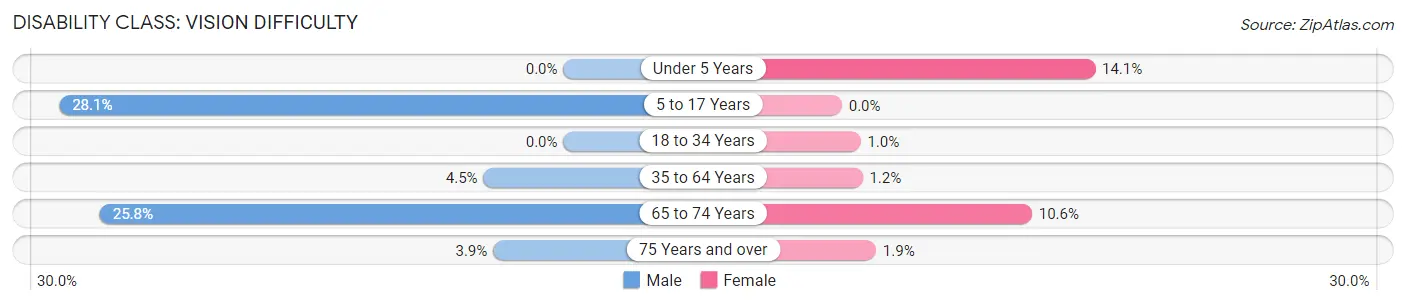
| Age Bracket | Male | Female |
| Under 5 Years | 0 (0.0%) | 22 (14.1%) |
| 5 to 17 Years | 64 (28.1%) | 0 (0.0%) |
| 18 to 34 Years | 0 (0.0%) | 6 (1.0%) |
| 35 to 64 Years | 36 (4.4%) | 13 (1.1%) |
| 65 to 74 Years | 96 (25.8%) | 31 (10.6%) |
| 75 Years and over | 14 (3.9%) | 8 (1.9%) |
Disability Class: Cognitive Difficulty
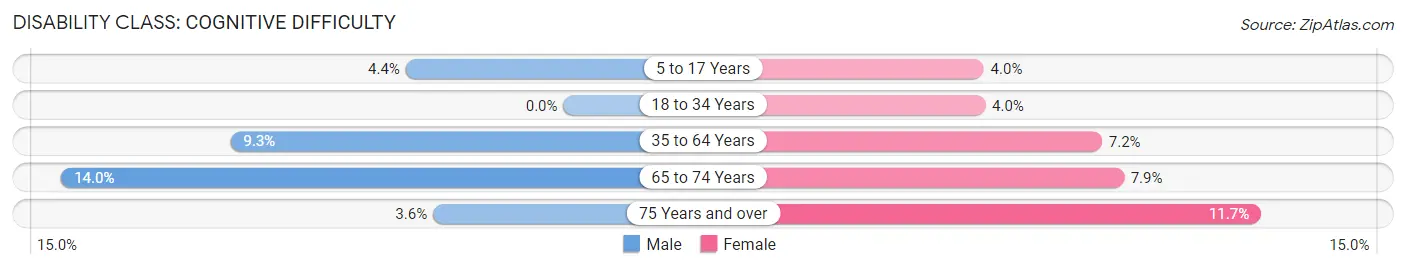
| Age Bracket | Male | Female |
| 5 to 17 Years | 10 (4.4%) | 10 (4.0%) |
| 18 to 34 Years | 0 (0.0%) | 23 (4.0%) |
| 35 to 64 Years | 75 (9.3%) | 82 (7.2%) |
| 65 to 74 Years | 52 (14.0%) | 23 (7.9%) |
| 75 Years and over | 13 (3.6%) | 49 (11.7%) |
Disability Class: Ambulatory Difficulty
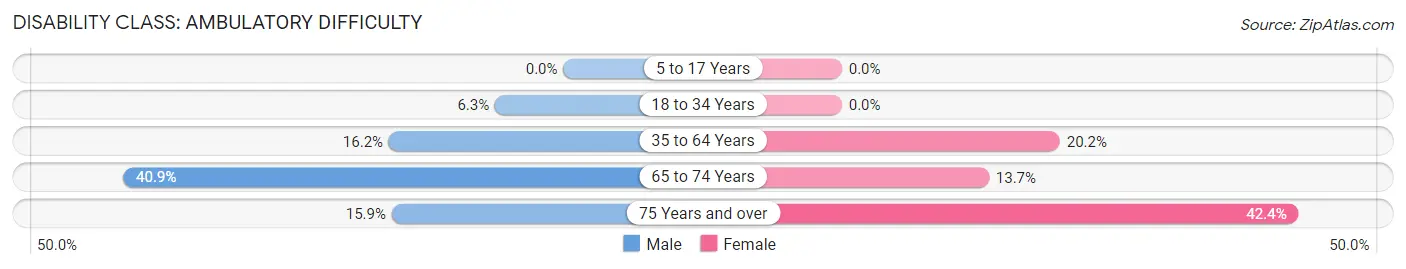
| Age Bracket | Male | Female |
| 5 to 17 Years | 0 (0.0%) | 0 (0.0%) |
| 18 to 34 Years | 45 (6.3%) | 0 (0.0%) |
| 35 to 64 Years | 131 (16.2%) | 229 (20.2%) |
| 65 to 74 Years | 152 (40.9%) | 40 (13.7%) |
| 75 Years and over | 57 (15.9%) | 178 (42.4%) |
Disability Class: Self-Care Difficulty
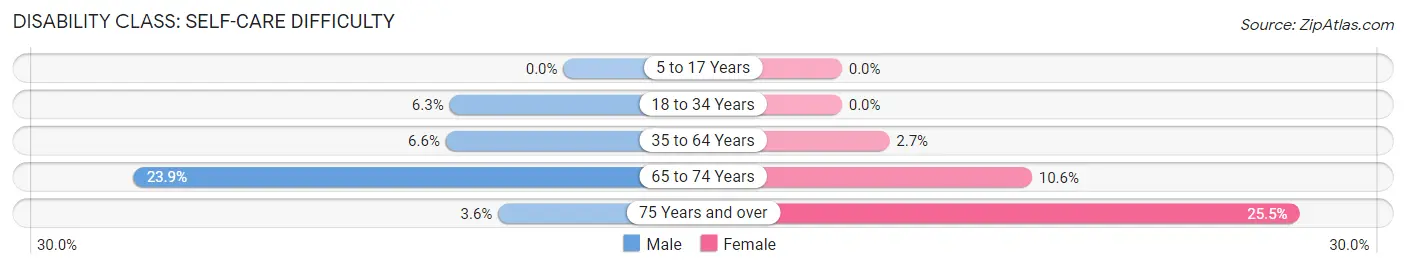
| Age Bracket | Male | Female |
| 5 to 17 Years | 0 (0.0%) | 0 (0.0%) |
| 18 to 34 Years | 45 (6.3%) | 0 (0.0%) |
| 35 to 64 Years | 53 (6.6%) | 30 (2.6%) |
| 65 to 74 Years | 89 (23.9%) | 31 (10.6%) |
| 75 Years and over | 13 (3.6%) | 107 (25.5%) |
Technology Access in St Martinville
Computing Device Access in St Martinville
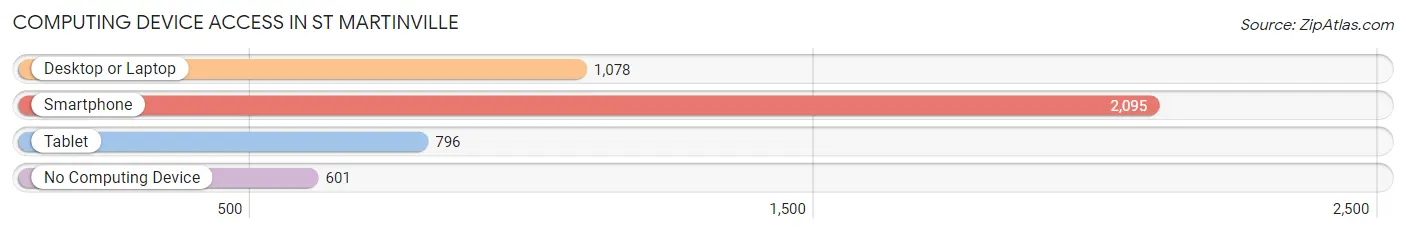
| Device Type | # Households | % Households |
| Desktop or Laptop | 1,078 | 38.5% |
| Smartphone | 2,095 | 74.7% |
| Tablet | 796 | 28.4% |
| No Computing Device | 601 | 21.4% |
| Total | 2,803 | 100.0% |
Internet Access in St Martinville
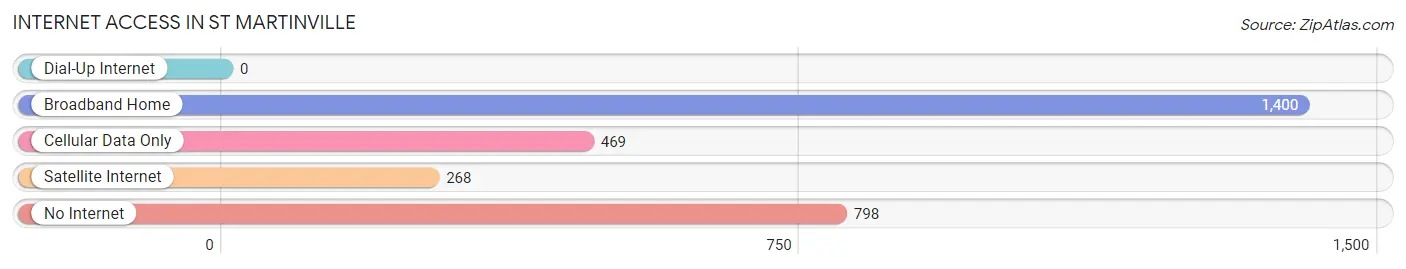
| Internet Type | # Households | % Households |
| Dial-Up Internet | 0 | 0.0% |
| Broadband Home | 1,400 | 49.9% |
| Cellular Data Only | 469 | 16.7% |
| Satellite Internet | 268 | 9.6% |
| No Internet | 798 | 28.5% |
| Total | 2,803 | 100.0% |
St Martinville Summary
Martinville, Louisiana is a small city located in St. Martin Parish, Louisiana. It is situated on the banks of the Bayou Teche, approximately 30 miles west of Baton Rouge. The city is known for its rich history, unique geography, diverse economy, and vibrant demographics.
History
The area that is now Martinville was first inhabited by the Chitimacha Native American tribe. The first European settlers arrived in the area in the late 1700s, and the city was officially founded in 1811. The city was named after Jean-Baptiste Martin, a French-Canadian fur trader who had settled in the area.
Martinville quickly became an important port city, as it was located at the intersection of the Bayou Teche and the Atchafalaya River. The city was a major hub for the cotton and sugar industries, and it was also a popular destination for steamboat travel.
In the late 1800s, Martinville was a major center for the lumber industry. The city was home to several sawmills and lumberyards, and it was also the site of the first paper mill in the state of Louisiana.
In the early 1900s, Martinville was a major center for the oil and gas industry. The city was home to several oil refineries and gas processing plants, and it was also the site of the first offshore oil drilling platform in the Gulf of Mexico.
Geography
Martinville is located in the southeastern part of Louisiana, approximately 30 miles west of Baton Rouge. The city is situated on the banks of the Bayou Teche, and it is surrounded by swamps, marshes, and bayous. The city is located in a humid subtropical climate zone, and it experiences hot, humid summers and mild winters.
The city is divided into several distinct neighborhoods, including the historic downtown area, the industrial district, and the residential neighborhoods. The downtown area is home to several historic buildings, including the St. Martinville Courthouse and the St. Martinville City Hall.
Economy
Martinville’s economy is largely based on the oil and gas industry, as well as the tourism industry. The city is home to several oil refineries and gas processing plants, and it is also a popular destination for tourists. The city is home to several historic sites, including the St. Martinville Courthouse and the St. Martinville City Hall.
The city is also home to several manufacturing plants, including a paper mill, a lumber mill, and a chemical plant. The city is also home to several retail stores, restaurants, and hotels.
Demographics
As of the 2010 census, the population of Martinville was 8,717. The city is predominantly white, with a small African American population. The city is also home to a large Hispanic population, as well as a small Asian population.
The median household income in Martinville is $37,845, and the median home value is $117,400. The city has a poverty rate of 22.3%, and the unemployment rate is 6.2%.
Conclusion
Martinville, Louisiana is a small city located in St. Martin Parish, Louisiana. It is situated on the banks of the Bayou Teche, approximately 30 miles west of Baton Rouge. The city is known for its rich history, unique geography, diverse economy, and vibrant demographics. The city is home to several oil refineries and gas processing plants, and it is also a popular destination for tourists. The city is predominantly white, with a small African American population. The median household income in Martinville is $37,845, and the median home value is $117,400.
Common Questions
What is Per Capita Income in St Martinville?
Per Capita income in St Martinville is $28,470.
What is the Median Family Income in St Martinville?
Median Family Income in St Martinville is $36,692.
What is the Median Household income in St Martinville?
Median Household Income in St Martinville is $32,781.
What is Income or Wage Gap in St Martinville?
Income or Wage Gap in St Martinville is 5.2%.
Women in St Martinville earn 94.8 cents for every dollar earned by a man.
What is Family Income Deficit in St Martinville?
Family Income Deficit in St Martinville is $7,315.
Families that are below poverty line in St Martinville earn $7,315 less on average than the poverty threshold level.
What is Inequality or Gini Index in St Martinville?
Inequality or Gini Index in St Martinville is 0.51.
What is the Total Population of St Martinville?
Total Population of St Martinville is 5,447.
What is the Total Male Population of St Martinville?
Total Male Population of St Martinville is 2,594.
What is the Total Female Population of St Martinville?
Total Female Population of St Martinville is 2,853.
What is the Ratio of Males per 100 Females in St Martinville?
There are 90.92 Males per 100 Females in St Martinville.
What is the Ratio of Females per 100 Males in St Martinville?
There are 109.98 Females per 100 Males in St Martinville.
What is the Median Population Age in St Martinville?
Median Population Age in St Martinville is 48.5 Years.
What is the Average Family Size in St Martinville
Average Family Size in St Martinville is 2.6 People.
What is the Average Household Size in St Martinville
Average Household Size in St Martinville is 1.9 People.
How Large is the Labor Force in St Martinville?
There are 2,595 People in the Labor Forcein in St Martinville.
What is the Percentage of People in the Labor Force in St Martinville?
52.9% of People are in the Labor Force in St Martinville.
What is the Unemployment Rate in St Martinville?
Unemployment Rate in St Martinville is 15.9%.