Minorca, LA Map & Demographics
Minorca Map
Minorca Overview
$19,919
PER CAPITA INCOME
$49,261
AVG FAMILY INCOME
$43,438
AVG HOUSEHOLD INCOME
28.2%
WAGE / INCOME GAP [ % ]
71.8¢/ $1
WAGE / INCOME GAP [ $ ]
0.43
INEQUALITY / GINI INDEX
1,398
TOTAL POPULATION
757
MALE POPULATION
641
FEMALE POPULATION
118.10
MALES / 100 FEMALES
84.68
FEMALES / 100 MALES
40.5
MEDIAN AGE
2.8
AVG FAMILY SIZE
2.5
AVG HOUSEHOLD SIZE
554
LABOR FORCE [ PEOPLE ]
48.9%
PERCENT IN LABOR FORCE
8.9%
UNEMPLOYMENT RATE
Income in Minorca
Income Overview in Minorca
Per Capita Income in Minorca is $19,919, while median incomes of families and households are $49,261 and $43,438 respectively.
| Characteristic | Number | Measure |
| Per Capita Income | 1,398 | $19,919 |
| Median Family Income | 451 | $49,261 |
| Mean Family Income | 451 | $55,683 |
| Median Household Income | 570 | $43,438 |
| Mean Household Income | 570 | $48,361 |
| Income Deficit | 451 | $0 |
| Wage / Income Gap (%) | 1,398 | 28.21% |
| Wage / Income Gap ($) | 1,398 | 71.79¢ per $1 |
| Gini / Inequality Index | 1,398 | 0.43 |
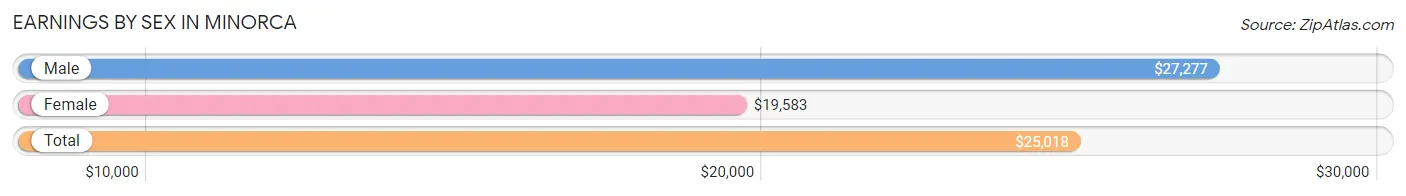
Earnings by Sex in Minorca
Average Earnings in Minorca are $25,018, $27,277 for men and $19,583 for women, a difference of 28.2%.
| Sex | Number | Average Earnings |
| Male | 259 (42.8%) | $27,277 |
| Female | 346 (57.2%) | $19,583 |
| Total | 605 (100.0%) | $25,018 |
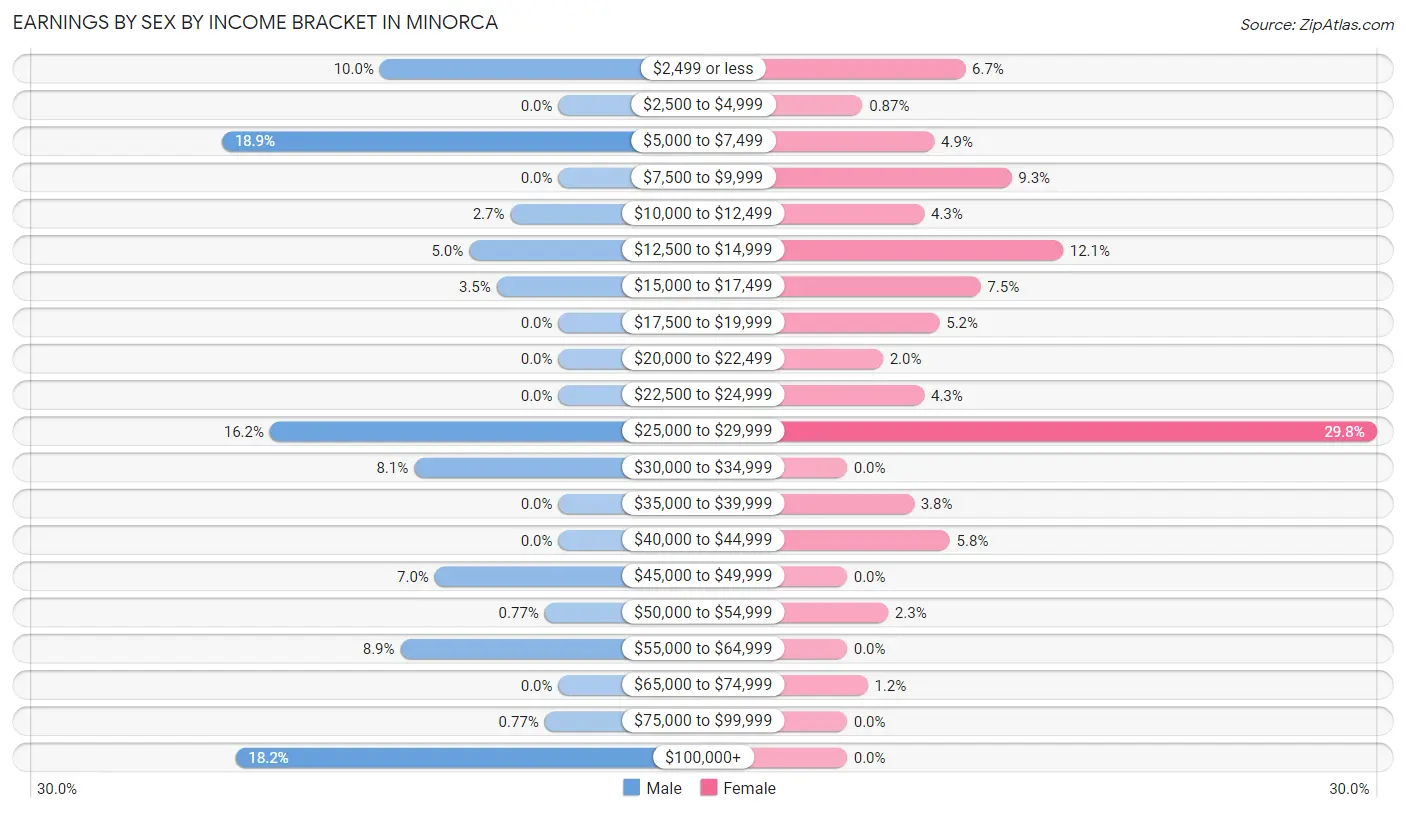
Earnings by Sex by Income Bracket in Minorca
The most common earnings brackets in Minorca are $5,000 to $7,499 for men (49 | 18.9%) and $25,000 to $29,999 for women (103 | 29.8%).
| Income | Male | Female |
| $2,499 or less | 26 (10.0%) | 23 (6.7%) |
| $2,500 to $4,999 | 0 (0.0%) | 3 (0.9%) |
| $5,000 to $7,499 | 49 (18.9%) | 17 (4.9%) |
| $7,500 to $9,999 | 0 (0.0%) | 32 (9.2%) |
| $10,000 to $12,499 | 7 (2.7%) | 15 (4.3%) |
| $12,500 to $14,999 | 13 (5.0%) | 42 (12.1%) |
| $15,000 to $17,499 | 9 (3.5%) | 26 (7.5%) |
| $17,500 to $19,999 | 0 (0.0%) | 18 (5.2%) |
| $20,000 to $22,499 | 0 (0.0%) | 7 (2.0%) |
| $22,500 to $24,999 | 0 (0.0%) | 15 (4.3%) |
| $25,000 to $29,999 | 42 (16.2%) | 103 (29.8%) |
| $30,000 to $34,999 | 21 (8.1%) | 0 (0.0%) |
| $35,000 to $39,999 | 0 (0.0%) | 13 (3.8%) |
| $40,000 to $44,999 | 0 (0.0%) | 20 (5.8%) |
| $45,000 to $49,999 | 18 (7.0%) | 0 (0.0%) |
| $50,000 to $54,999 | 2 (0.8%) | 8 (2.3%) |
| $55,000 to $64,999 | 23 (8.9%) | 0 (0.0%) |
| $65,000 to $74,999 | 0 (0.0%) | 4 (1.2%) |
| $75,000 to $99,999 | 2 (0.8%) | 0 (0.0%) |
| $100,000+ | 47 (18.1%) | 0 (0.0%) |
| Total | 259 (100.0%) | 346 (100.0%) |
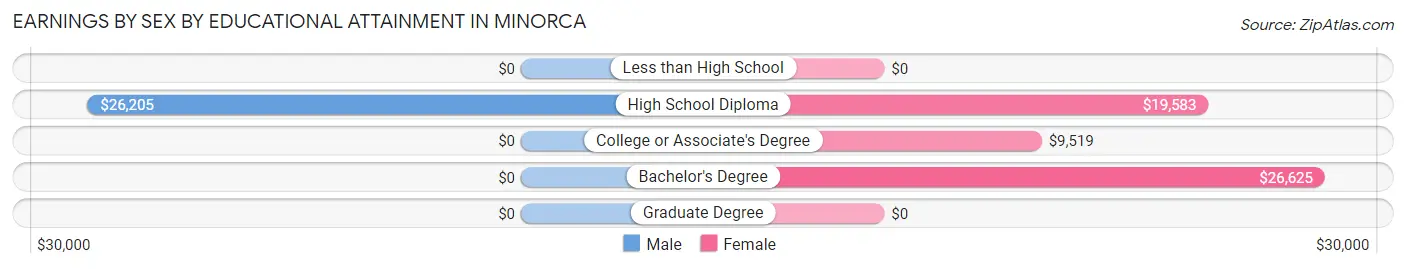
Earnings by Sex by Educational Attainment in Minorca
Average earnings in Minorca are $29,821 for men and $19,583 for women, a difference of 34.3%. Men with an educational attainment of high school diploma enjoy the highest average annual earnings of $26,205, while those with high school diploma education earn the least with $26,205. Women with an educational attainment of bachelor's degree earn the most with the average annual earnings of $26,625, while those with college or associate's degree education have the smallest earnings of $9,519.
| Educational Attainment | Male Income | Female Income |
| Less than High School | - | - |
| High School Diploma | $26,205 | $19,583 |
| College or Associate's Degree | - | - |
| Bachelor's Degree | - | - |
| Graduate Degree | - | - |
| Total | $29,821 | $19,583 |
Family Income in Minorca
Family Income Brackets in Minorca
According to the Minorca family income data, there are 117 families falling into the $50,000 to $74,999 income range, which is the most common income bracket and makes up 25.9% of all families. Conversely, the $100,000 to $149,999 income bracket is the least frequent group with only 4 families (0.9%) belonging to this category.
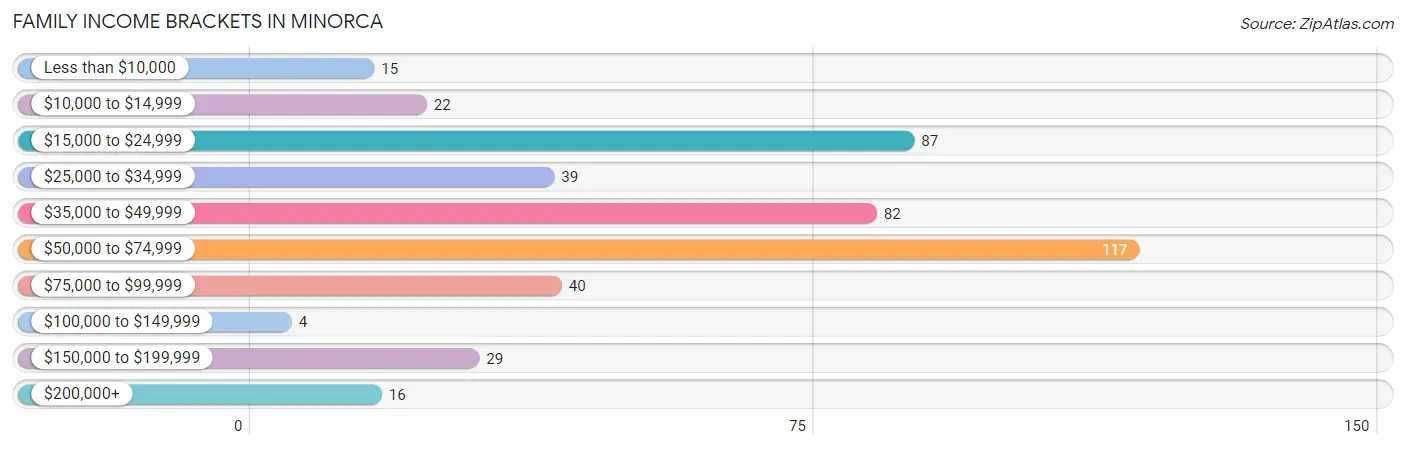
| Income Bracket | # Families | % Families |
| Less than $10,000 | 15 | 3.3% |
| $10,000 to $14,999 | 22 | 4.9% |
| $15,000 to $24,999 | 87 | 19.3% |
| $25,000 to $34,999 | 39 | 8.6% |
| $35,000 to $49,999 | 82 | 18.2% |
| $50,000 to $74,999 | 117 | 25.9% |
| $75,000 to $99,999 | 40 | 8.9% |
| $100,000 to $149,999 | 4 | 0.9% |
| $150,000 to $199,999 | 29 | 6.4% |
| $200,000+ | 16 | 3.5% |
Family Income by Famaliy Size in Minorca
4-person families (27 | 6.0%) account for the highest median family income in Minorca with $57,361 per family, while 2-person families (318 | 70.5%) have the highest median income of $25,834 per family member.
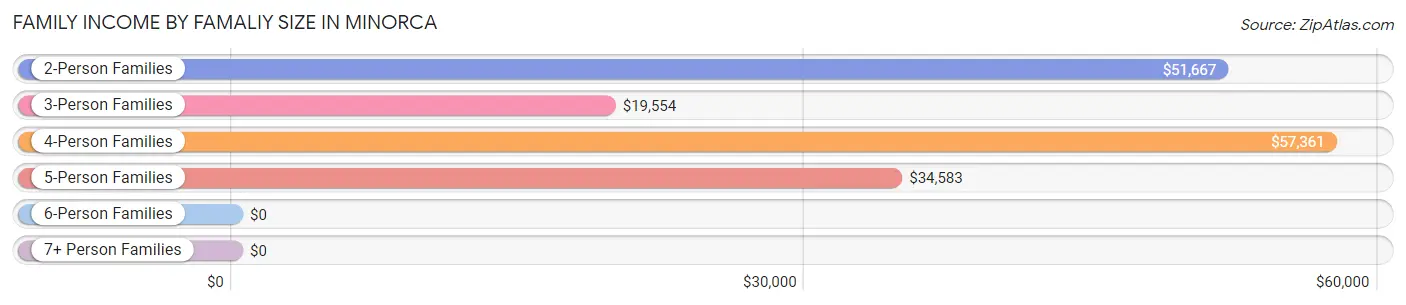
| Income Bracket | # Families | Median Income |
| 2-Person Families | 318 (70.5%) | $51,667 |
| 3-Person Families | 70 (15.5%) | $19,554 |
| 4-Person Families | 27 (6.0%) | $57,361 |
| 5-Person Families | 25 (5.5%) | $34,583 |
| 6-Person Families | 4 (0.9%) | $0 |
| 7+ Person Families | 7 (1.5%) | $0 |
| Total | 451 (100.0%) | $49,261 |
Family Income by Number of Earners in Minorca
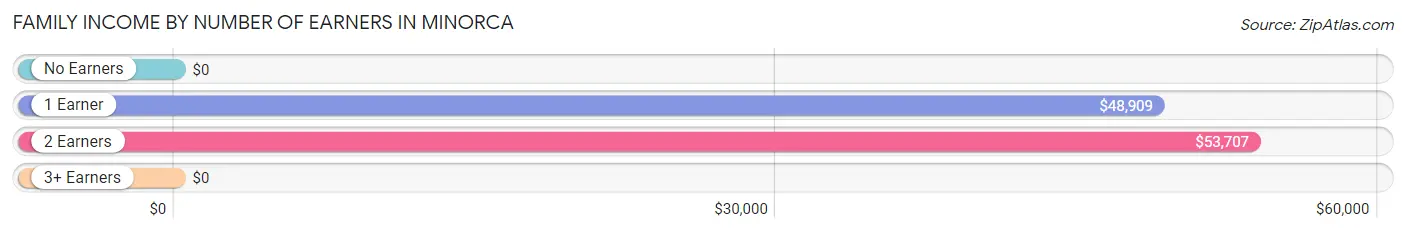
| Number of Earners | # Families | Median Income |
| No Earners | 110 (24.4%) | $0 |
| 1 Earner | 185 (41.0%) | $48,909 |
| 2 Earners | 156 (34.6%) | $53,707 |
| 3+ Earners | 0 (0.0%) | $0 |
| Total | 451 (100.0%) | $49,261 |
Household Income in Minorca
Household Income Brackets in Minorca
With 134 households falling in the category, the $15,000 to $24,999 income range is the most frequent in Minorca, accounting for 23.5% of all households. In contrast, only 4 households (0.7%) fall into the $100,000 to $149,999 income bracket, making it the least populous group.
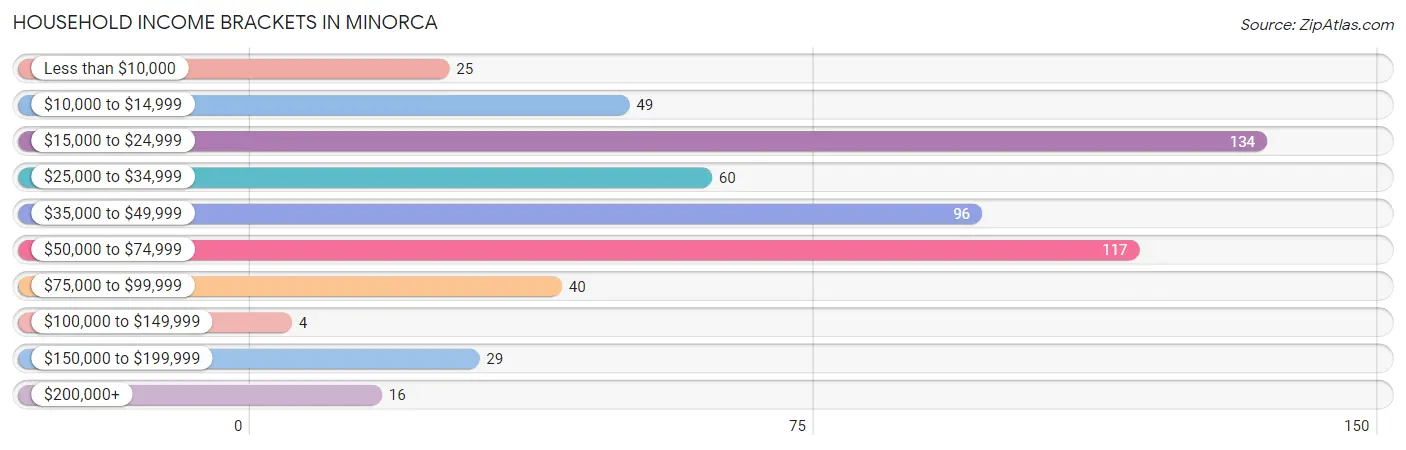
| Income Bracket | # Households | % Households |
| Less than $10,000 | 25 | 4.4% |
| $10,000 to $14,999 | 49 | 8.6% |
| $15,000 to $24,999 | 134 | 23.5% |
| $25,000 to $34,999 | 60 | 10.5% |
| $35,000 to $49,999 | 96 | 16.8% |
| $50,000 to $74,999 | 117 | 20.5% |
| $75,000 to $99,999 | 40 | 7.0% |
| $100,000 to $149,999 | 4 | 0.7% |
| $150,000 to $199,999 | 29 | 5.1% |
| $200,000+ | 16 | 2.8% |
Household Income by Householder Age in Minorca
The median household income in Minorca is $43,438, with the highest median household income of $48,239 found in the 25 to 44 years age bracket for the primary householder. A total of 151 households (26.5%) fall into this category. Meanwhile, the 15 to 24 years age bracket for the primary householder has the lowest median household income of $0, with 17 households (3.0%) in this group.
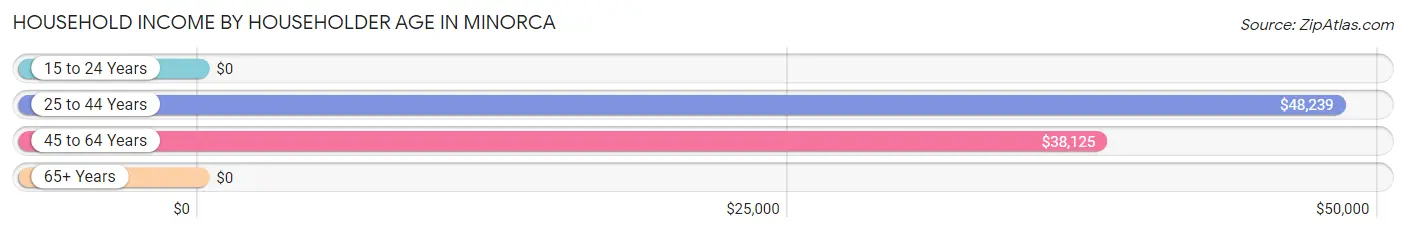
| Income Bracket | # Households | Median Income |
| 15 to 24 Years | 17 (3.0%) | $0 |
| 25 to 44 Years | 151 (26.5%) | $48,239 |
| 45 to 64 Years | 207 (36.3%) | $38,125 |
| 65+ Years | 195 (34.2%) | $0 |
| Total | 570 (100.0%) | $43,438 |
Poverty in Minorca
Income Below Poverty by Sex and Age in Minorca
With 43.2% poverty level for males and 35.6% for females among the residents of Minorca, under 5 year old males and 6 to 11 year old females are the most vulnerable to poverty, with 29 males (100.0%) and 14 females (82.4%) in their respective age groups living below the poverty level.
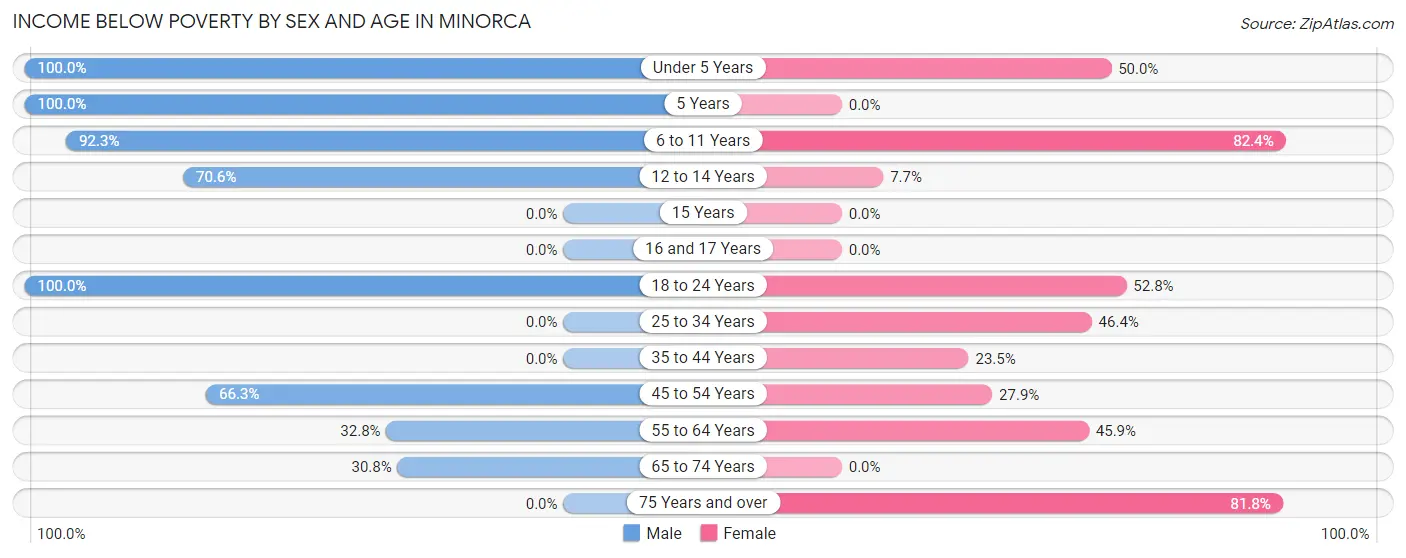
| Age Bracket | Male | Female |
| Under 5 Years | 29 (100.0%) | 5 (50.0%) |
| 5 Years | 12 (100.0%) | 0 (0.0%) |
| 6 to 11 Years | 108 (92.3%) | 14 (82.4%) |
| 12 to 14 Years | 36 (70.6%) | 1 (7.7%) |
| 15 Years | 0 (0.0%) | 0 (0.0%) |
| 16 and 17 Years | 0 (0.0%) | 0 (0.0%) |
| 18 to 24 Years | 43 (100.0%) | 28 (52.8%) |
| 25 to 34 Years | 0 (0.0%) | 32 (46.4%) |
| 35 to 44 Years | 0 (0.0%) | 28 (23.5%) |
| 45 to 54 Years | 61 (66.3%) | 12 (27.9%) |
| 55 to 64 Years | 22 (32.8%) | 72 (45.9%) |
| 65 to 74 Years | 16 (30.8%) | 0 (0.0%) |
| 75 Years and over | 0 (0.0%) | 36 (81.8%) |
| Total | 327 (43.2%) | 228 (35.6%) |
Income Above Poverty by Sex and Age in Minorca
According to the poverty statistics in Minorca, males aged 15 years and females aged 5 years are the age groups that are most secure financially, with 100.0% of males and 100.0% of females in these age groups living above the poverty line.
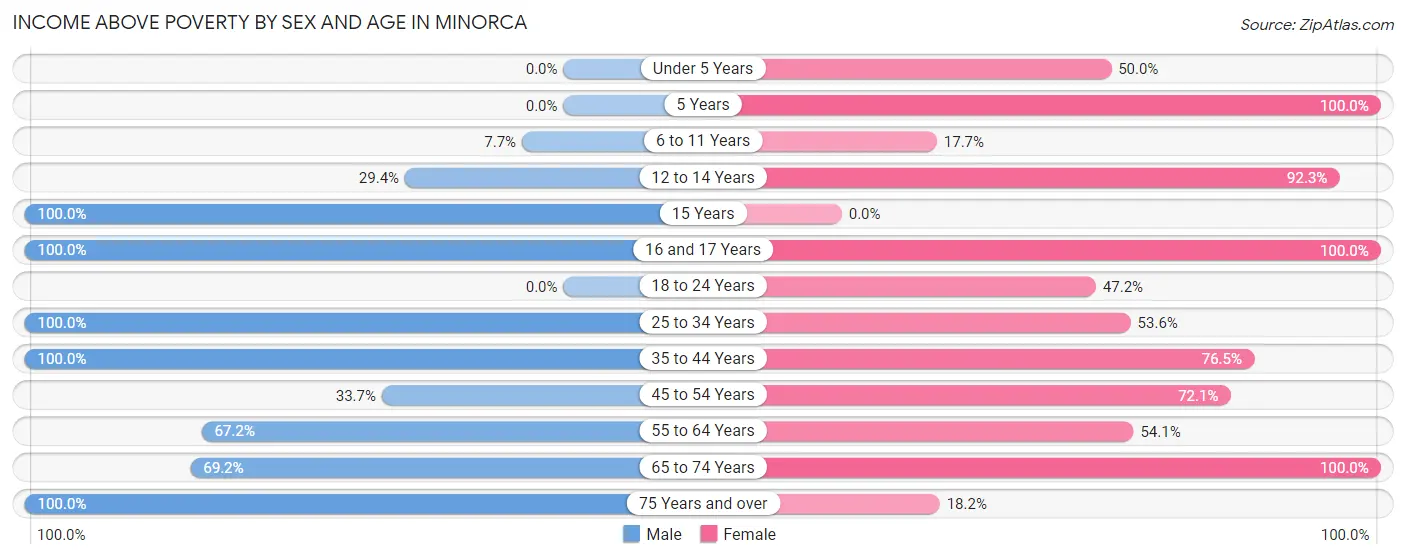
| Age Bracket | Male | Female |
| Under 5 Years | 0 (0.0%) | 5 (50.0%) |
| 5 Years | 0 (0.0%) | 7 (100.0%) |
| 6 to 11 Years | 9 (7.7%) | 3 (17.6%) |
| 12 to 14 Years | 15 (29.4%) | 12 (92.3%) |
| 15 Years | 10 (100.0%) | 0 (0.0%) |
| 16 and 17 Years | 87 (100.0%) | 4 (100.0%) |
| 18 to 24 Years | 0 (0.0%) | 25 (47.2%) |
| 25 to 34 Years | 28 (100.0%) | 37 (53.6%) |
| 35 to 44 Years | 107 (100.0%) | 91 (76.5%) |
| 45 to 54 Years | 31 (33.7%) | 31 (72.1%) |
| 55 to 64 Years | 45 (67.2%) | 85 (54.1%) |
| 65 to 74 Years | 36 (69.2%) | 105 (100.0%) |
| 75 Years and over | 62 (100.0%) | 8 (18.2%) |
| Total | 430 (56.8%) | 413 (64.4%) |
Income Below Poverty Among Married-Couple Families in Minorca
The poverty statistics for married-couple families in Minorca show that 30.9% or 72 of the total 233 families live below the poverty line. Families with 5 or more children have the highest poverty rate of 100.0%, comprising of 7 families. On the other hand, families with 1 or 2 children have the lowest poverty rate of 18.8%, which includes 6 families.
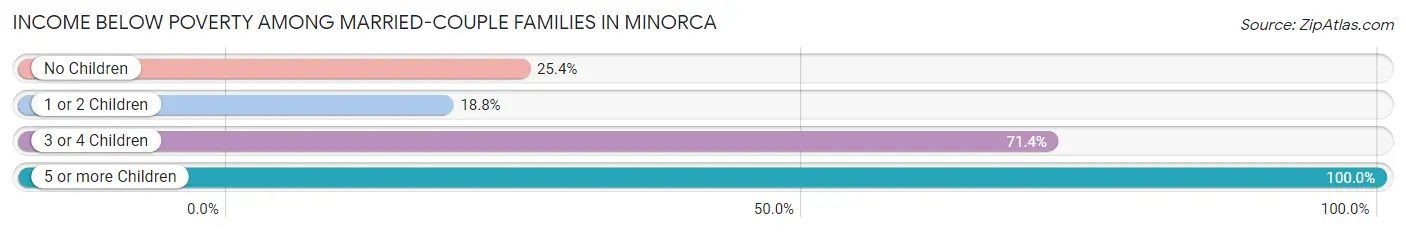
| Children | Above Poverty | Below Poverty |
| No Children | 129 (74.6%) | 44 (25.4%) |
| 1 or 2 Children | 26 (81.2%) | 6 (18.8%) |
| 3 or 4 Children | 6 (28.6%) | 15 (71.4%) |
| 5 or more Children | 0 (0.0%) | 7 (100.0%) |
| Total | 161 (69.1%) | 72 (30.9%) |
Income Below Poverty Among Single-Parent Households in Minorca
According to the poverty data in Minorca, 37.5% or 24 single-father households and 27.9% or 43 single-mother households are living below the poverty line. Among single-father households, those with 1 or 2 children have the highest poverty rate, with 16 households (64.0%) experiencing poverty. Likewise, among single-mother households, those with 1 or 2 children have the highest poverty rate, with 34 households (31.5%) falling below the poverty line.
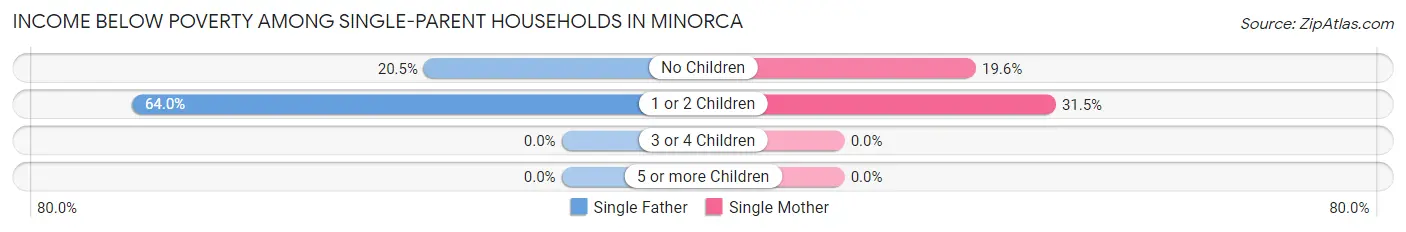
| Children | Single Father | Single Mother |
| No Children | 8 (20.5%) | 9 (19.6%) |
| 1 or 2 Children | 16 (64.0%) | 34 (31.5%) |
| 3 or 4 Children | 0 (0.0%) | 0 (0.0%) |
| 5 or more Children | 0 (0.0%) | 0 (0.0%) |
| Total | 24 (37.5%) | 43 (27.9%) |
Income Below Poverty Among Married-Couple vs Single-Parent Households in Minorca
The poverty data for Minorca shows that 72 of the married-couple family households (30.9%) and 67 of the single-parent households (30.7%) are living below the poverty level. Within the married-couple family households, those with 5 or more children have the highest poverty rate, with 7 households (100.0%) falling below the poverty line. Among the single-parent households, those with 1 or 2 children have the highest poverty rate, with 50 household (37.6%) living below poverty.
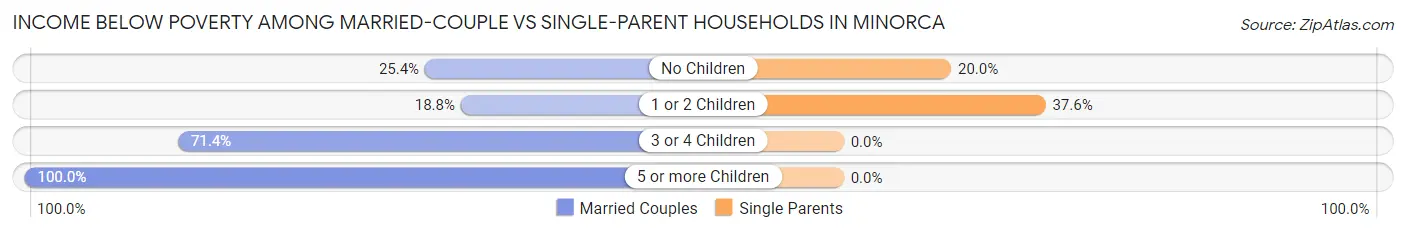
| Children | Married-Couple Families | Single-Parent Households |
| No Children | 44 (25.4%) | 17 (20.0%) |
| 1 or 2 Children | 6 (18.8%) | 50 (37.6%) |
| 3 or 4 Children | 15 (71.4%) | 0 (0.0%) |
| 5 or more Children | 7 (100.0%) | 0 (0.0%) |
| Total | 72 (30.9%) | 67 (30.7%) |
Race in Minorca
The most populous races in Minorca are White / Caucasian (938 | 67.1%), Black / African American (459 | 32.8%), and Two or more Races (1 | 0.1%).
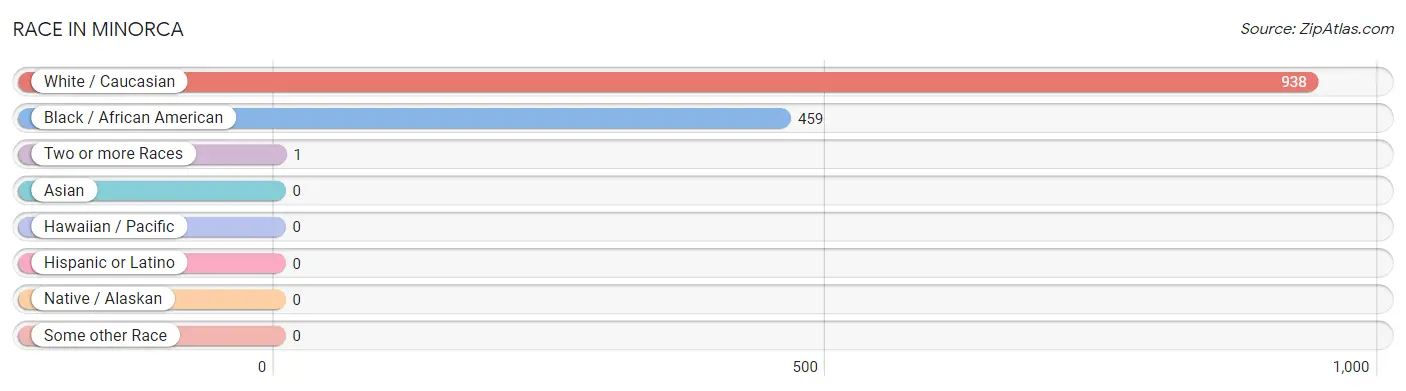
| Race | # Population | % Population |
| Asian | 0 | 0.0% |
| Black / African American | 459 | 32.8% |
| Hawaiian / Pacific | 0 | 0.0% |
| Hispanic or Latino | 0 | 0.0% |
| Native / Alaskan | 0 | 0.0% |
| White / Caucasian | 938 | 67.1% |
| Two or more Races | 1 | 0.1% |
| Some other Race | 0 | 0.0% |
| Total | 1,398 | 100.0% |
Ancestry in Minorca
The most populous ancestries reported in Minorca are American (252 | 18.0%), Irish (211 | 15.1%), English (135 | 9.7%), Italian (64 | 4.6%), and German (34 | 2.4%), together accounting for 49.8% of all Minorca residents.
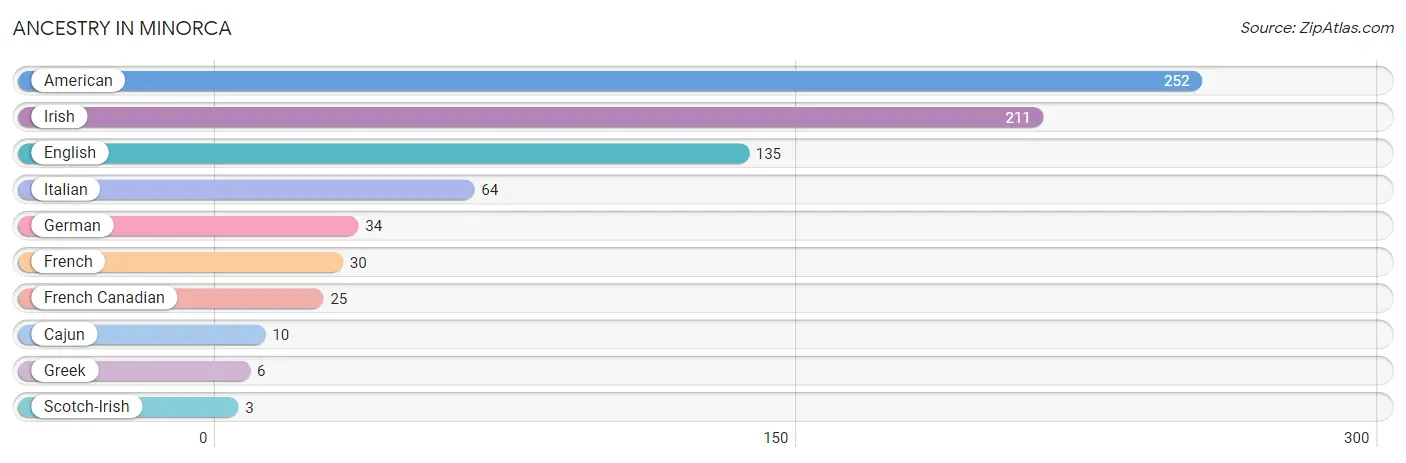
| Ancestry | # Population | % Population |
| American | 252 | 18.0% |
| Cajun | 10 | 0.7% |
| English | 135 | 9.7% |
| French | 30 | 2.1% |
| French Canadian | 25 | 1.8% |
| German | 34 | 2.4% |
| Greek | 6 | 0.4% |
| Irish | 211 | 15.1% |
| Italian | 64 | 4.6% |
| Scotch-Irish | 3 | 0.2% | View All 10 Rows |
Immigrants in Minorca

| Immigration Origin | # Population | % Population | View All 0 Rows |
Sex and Age in Minorca
Sex and Age in Minorca
The most populous age groups in Minorca are 5 to 9 Years (112 | 14.8%) for men and 55 to 59 Years (144 | 22.5%) for women.
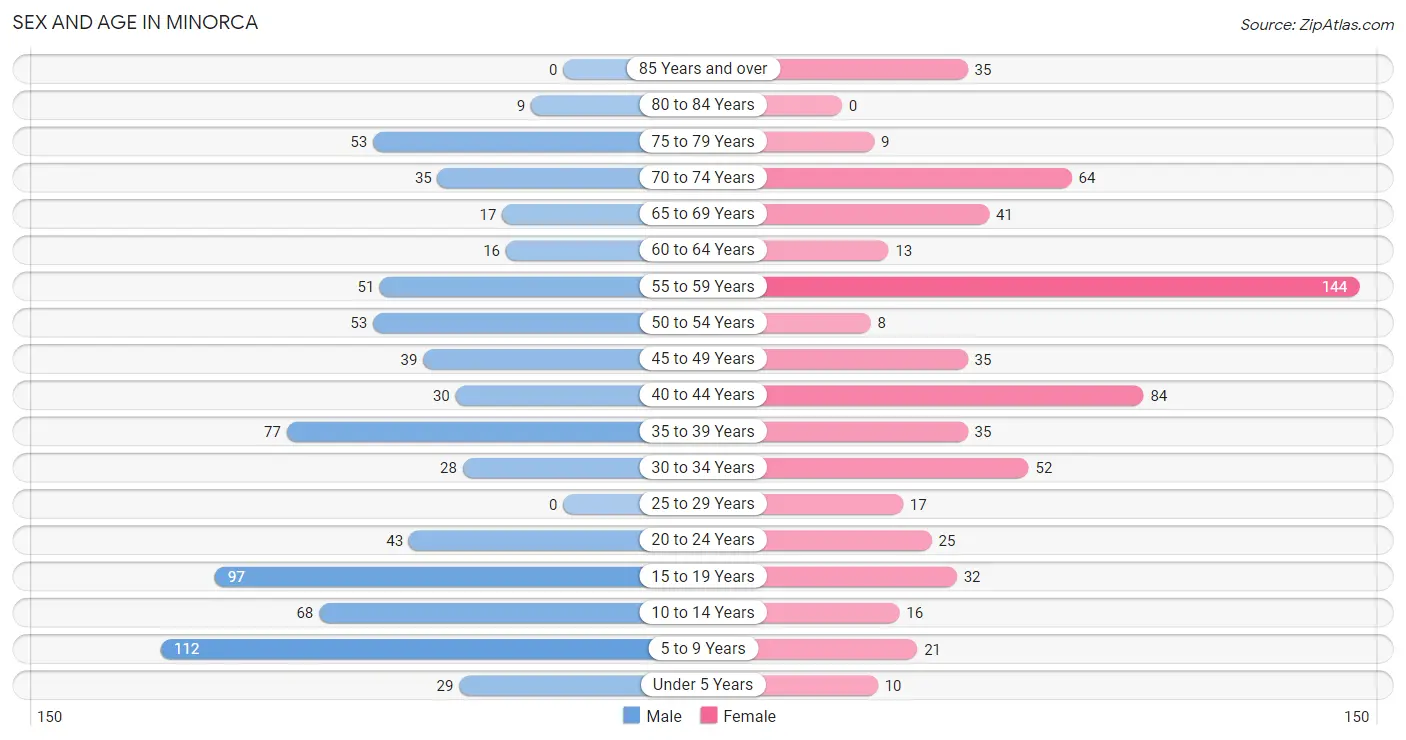
| Age Bracket | Male | Female |
| Under 5 Years | 29 (3.8%) | 10 (1.6%) |
| 5 to 9 Years | 112 (14.8%) | 21 (3.3%) |
| 10 to 14 Years | 68 (9.0%) | 16 (2.5%) |
| 15 to 19 Years | 97 (12.8%) | 32 (5.0%) |
| 20 to 24 Years | 43 (5.7%) | 25 (3.9%) |
| 25 to 29 Years | 0 (0.0%) | 17 (2.6%) |
| 30 to 34 Years | 28 (3.7%) | 52 (8.1%) |
| 35 to 39 Years | 77 (10.2%) | 35 (5.5%) |
| 40 to 44 Years | 30 (4.0%) | 84 (13.1%) |
| 45 to 49 Years | 39 (5.1%) | 35 (5.5%) |
| 50 to 54 Years | 53 (7.0%) | 8 (1.3%) |
| 55 to 59 Years | 51 (6.7%) | 144 (22.5%) |
| 60 to 64 Years | 16 (2.1%) | 13 (2.0%) |
| 65 to 69 Years | 17 (2.2%) | 41 (6.4%) |
| 70 to 74 Years | 35 (4.6%) | 64 (10.0%) |
| 75 to 79 Years | 53 (7.0%) | 9 (1.4%) |
| 80 to 84 Years | 9 (1.2%) | 0 (0.0%) |
| 85 Years and over | 0 (0.0%) | 35 (5.5%) |
| Total | 757 (100.0%) | 641 (100.0%) |
Families and Households in Minorca
Median Family Size in Minorca
The median family size in Minorca is 2.84 persons per family, with married-couple families (233 | 51.7%) accounting for the largest median family size of 3.19 persons per family. On the other hand, single male/father families (64 | 14.2%) represent the smallest median family size with 2.28 persons per family.
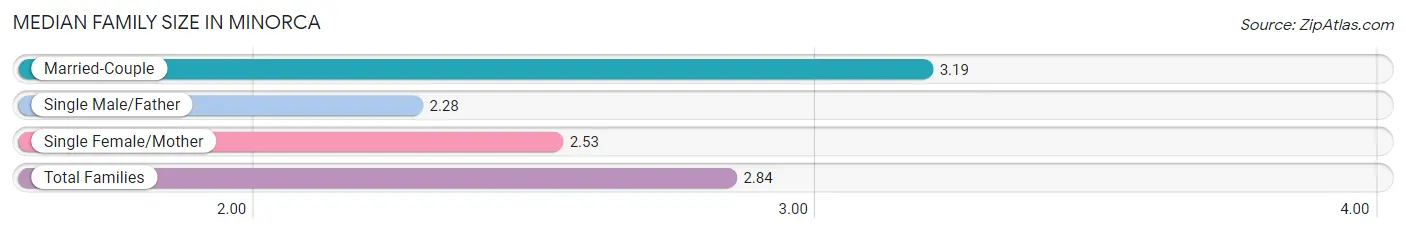
| Family Type | # Families | Family Size |
| Married-Couple | 233 (51.7%) | 3.19 |
| Single Male/Father | 64 (14.2%) | 2.28 |
| Single Female/Mother | 154 (34.2%) | 2.53 |
| Total Families | 451 (100.0%) | 2.84 |
Median Household Size in Minorca
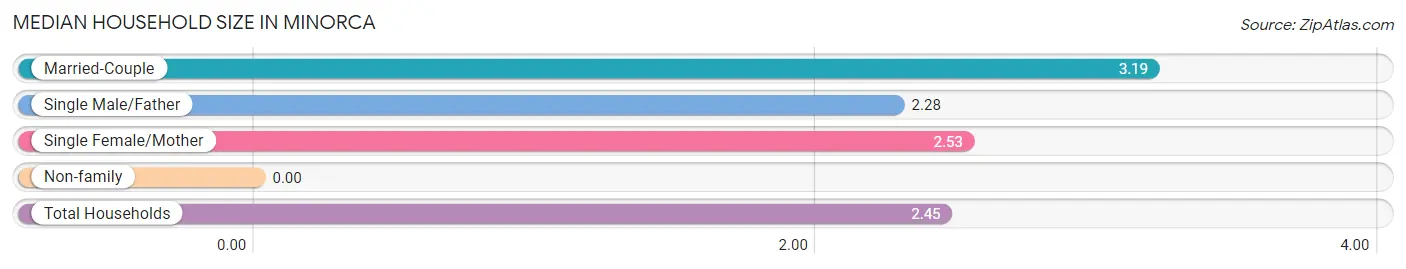
| Household Type | # Households | Household Size |
| Married-Couple | 233 (40.9%) | 3.19 |
| Single Male/Father | 64 (11.2%) | 2.28 |
| Single Female/Mother | 154 (27.0%) | 2.53 |
| Non-family | 119 (20.9%) | - |
| Total Households | 570 (100.0%) | 2.45 |
Household Size by Marriage Status in Minorca
Out of a total of 570 households in Minorca, 451 (79.1%) are family households, while 119 (20.9%) are nonfamily households. The most numerous type of family households are 2-person households, comprising 318, and the most common type of nonfamily households are 1-person households, comprising 119.
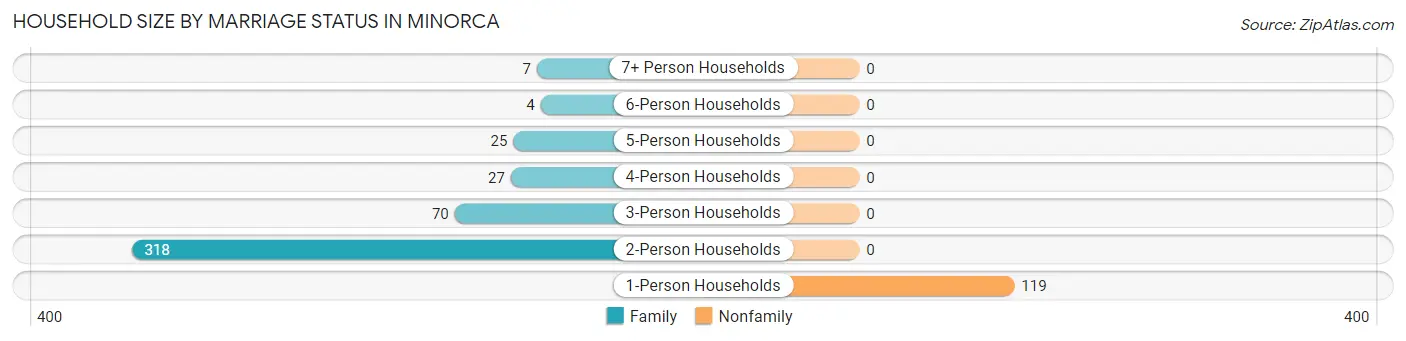
| Household Size | Family Households | Nonfamily Households |
| 1-Person Households | - | 119 (20.9%) |
| 2-Person Households | 318 (55.8%) | 0 (0.0%) |
| 3-Person Households | 70 (12.3%) | 0 (0.0%) |
| 4-Person Households | 27 (4.7%) | 0 (0.0%) |
| 5-Person Households | 25 (4.4%) | 0 (0.0%) |
| 6-Person Households | 4 (0.7%) | 0 (0.0%) |
| 7+ Person Households | 7 (1.2%) | 0 (0.0%) |
| Total | 451 (79.1%) | 119 (20.9%) |
Female Fertility in Minorca
Fertility by Age in Minorca
Average fertility rate in Minorca is 106.0 births per 1,000 women. Women in the age bracket of 20 to 34 years have the highest fertility rate with 266.0 births per 1,000 women. Women in the age bracket of 20 to 34 years acount for 83.3% of all women with births.
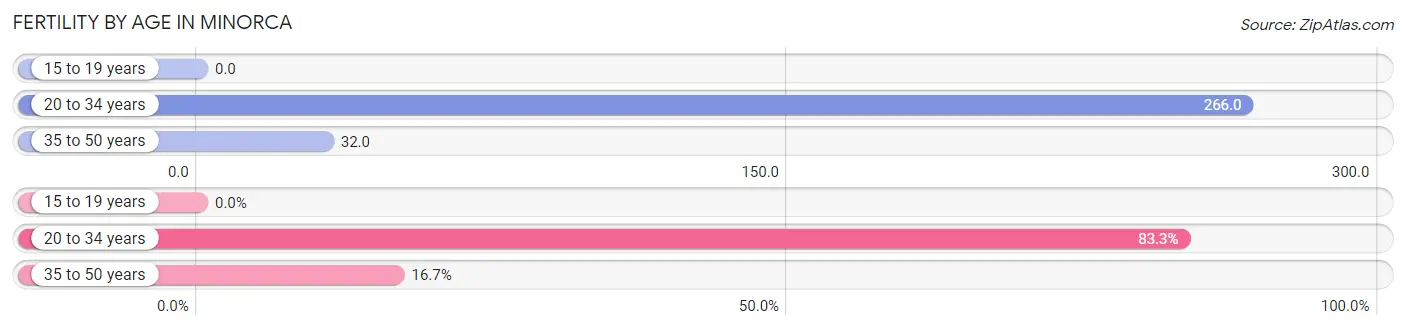
| Age Bracket | Women with Births | Births / 1,000 Women |
| 15 to 19 years | 0 (0.0%) | 0.0 |
| 20 to 34 years | 25 (83.3%) | 266.0 |
| 35 to 50 years | 5 (16.7%) | 32.0 |
| Total | 30 (100.0%) | 106.0 |
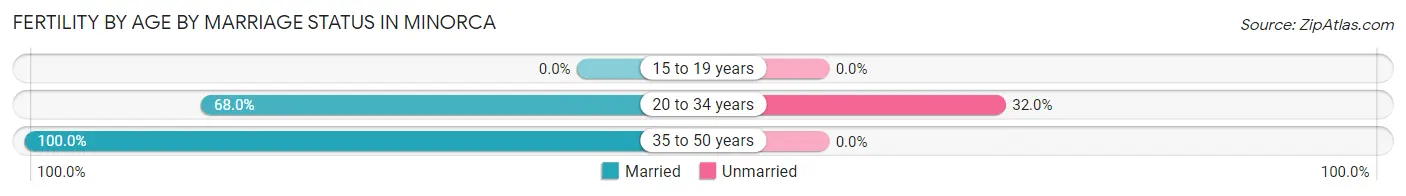
Fertility by Age by Marriage Status in Minorca
73.3% of women with births (30) in Minorca are married. The highest percentage of unmarried women with births falls into 20 to 34 years age bracket with 32.0% of them unmarried at the time of birth, while the lowest percentage of unmarried women with births belong to 35 to 50 years age bracket with 0.0% of them unmarried.
| Age Bracket | Married | Unmarried |
| 15 to 19 years | 0 (0.0%) | 0 (0.0%) |
| 20 to 34 years | 17 (68.0%) | 8 (32.0%) |
| 35 to 50 years | 5 (100.0%) | 0 (0.0%) |
| Total | 22 (73.3%) | 8 (26.7%) |
Fertility by Education in Minorca
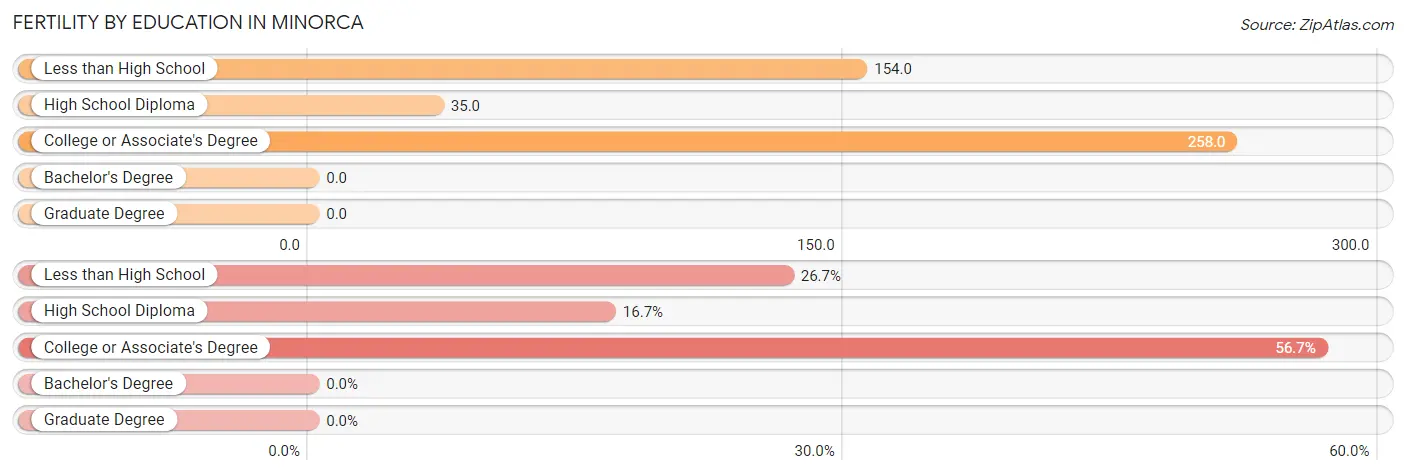
| Educational Attainment | Women with Births | Births / 1,000 Women |
| Less than High School | 8 (26.7%) | 154.0 |
| High School Diploma | 5 (16.7%) | 35.0 |
| College or Associate's Degree | 17 (56.7%) | 258.0 |
| Bachelor's Degree | 0 (0.0%) | 0.0 |
| Graduate Degree | 0 (0.0%) | 0.0 |
| Total | 30 (100.0%) | 106.0 |
Fertility by Education by Marriage Status in Minorca
26.7% of women with births in Minorca are unmarried. Women with the educational attainment of high school diploma are most likely to be married with 100.0% of them married at childbirth, while women with the educational attainment of less than high school are least likely to be married with 100.0% of them unmarried at childbirth.
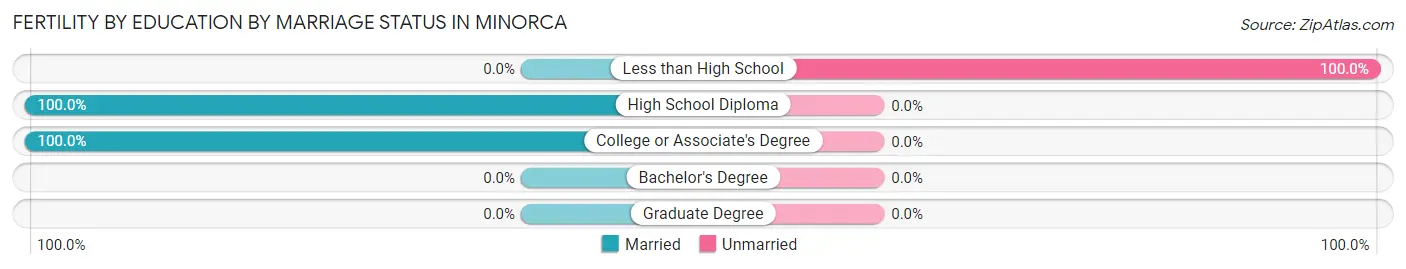
| Educational Attainment | Married | Unmarried |
| Less than High School | 0 (0.0%) | 8 (100.0%) |
| High School Diploma | 5 (100.0%) | 0 (0.0%) |
| College or Associate's Degree | 17 (100.0%) | 0 (0.0%) |
| Bachelor's Degree | 0 (0.0%) | 0 (0.0%) |
| Graduate Degree | 0 (0.0%) | 0 (0.0%) |
| Total | 22 (73.3%) | 8 (26.7%) |
Employment Characteristics in Minorca
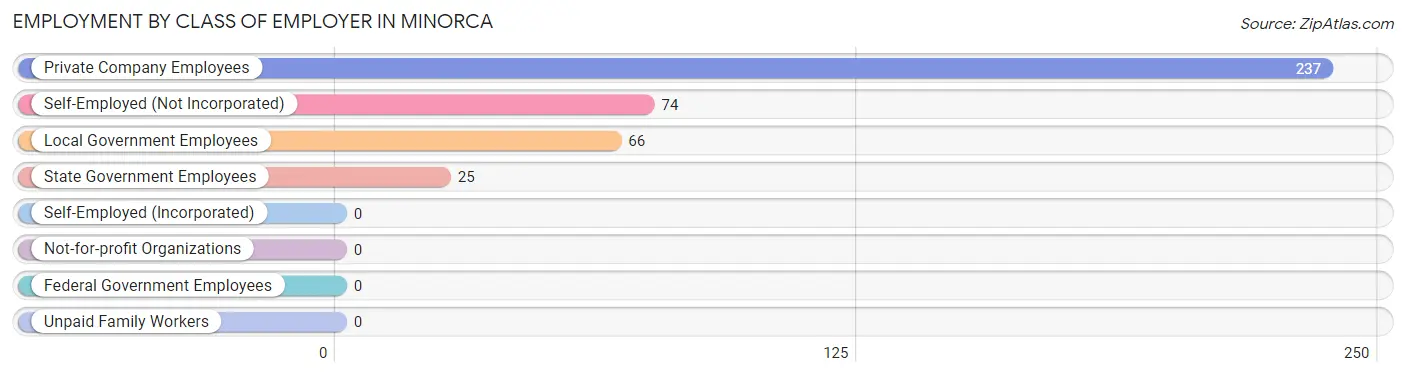
Employment by Class of Employer in Minorca
Among the 402 employed individuals in Minorca, private company employees (237 | 59.0%), self-employed (not incorporated) (74 | 18.4%), and local government employees (66 | 16.4%) make up the most common classes of employment.
| Employer Class | # Employees | % Employees |
| Private Company Employees | 237 | 59.0% |
| Self-Employed (Incorporated) | 0 | 0.0% |
| Self-Employed (Not Incorporated) | 74 | 18.4% |
| Not-for-profit Organizations | 0 | 0.0% |
| Local Government Employees | 66 | 16.4% |
| State Government Employees | 25 | 6.2% |
| Federal Government Employees | 0 | 0.0% |
| Unpaid Family Workers | 0 | 0.0% |
| Total | 402 | 100.0% |
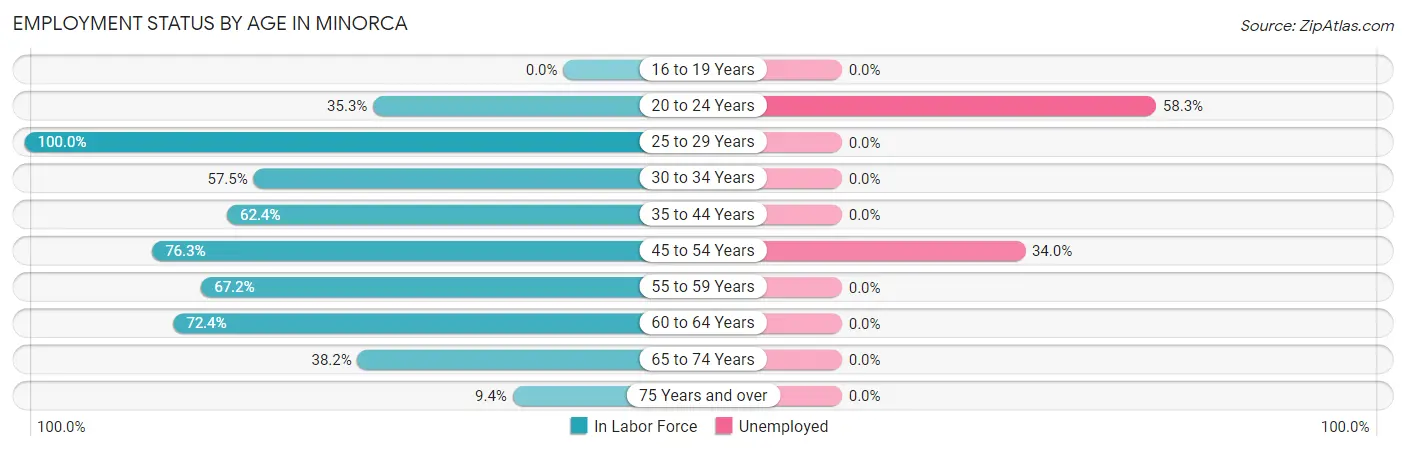
Employment Status by Age in Minorca
According to the labor force statistics for Minorca, out of the total population over 16 years of age (1,132), 48.9% or 554 individuals are in the labor force, with 8.9% or 49 of them unemployed. The age group with the highest labor force participation rate is 25 to 29 years, with 100.0% or 17 individuals in the labor force. Within the labor force, the 20 to 24 years age range has the highest percentage of unemployed individuals, with 58.3% or 14 of them being unemployed.
| Age Bracket | In Labor Force | Unemployed |
| 16 to 19 Years | 0 (0.0%) | 0 (0.0%) |
| 20 to 24 Years | 24 (35.3%) | 14 (58.3%) |
| 25 to 29 Years | 17 (100.0%) | 0 (0.0%) |
| 30 to 34 Years | 46 (57.5%) | 0 (0.0%) |
| 35 to 44 Years | 141 (62.4%) | 0 (0.0%) |
| 45 to 54 Years | 103 (76.3%) | 35 (34.0%) |
| 55 to 59 Years | 131 (67.2%) | 0 (0.0%) |
| 60 to 64 Years | 21 (72.4%) | 0 (0.0%) |
| 65 to 74 Years | 60 (38.2%) | 0 (0.0%) |
| 75 Years and over | 10 (9.4%) | 0 (0.0%) |
| Total | 554 (48.9%) | 49 (8.9%) |
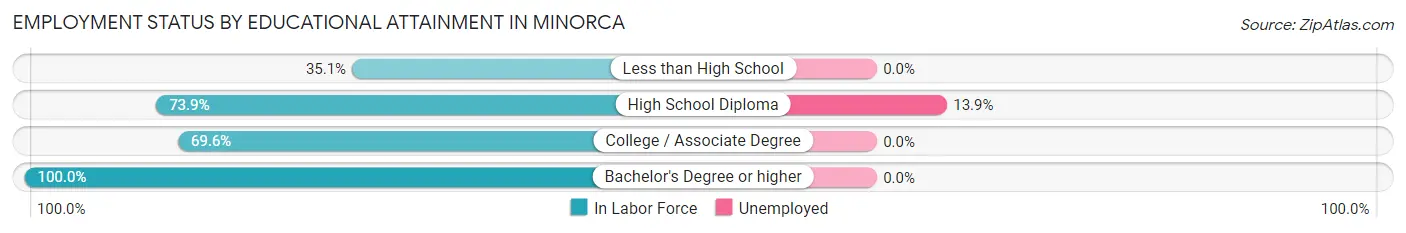
Employment Status by Educational Attainment in Minorca
According to labor force statistics for Minorca, 67.3% of individuals (459) out of the total population between 25 and 64 years of age (682) are in the labor force, with 7.6% or 35 of them being unemployed. The group with the highest labor force participation rate are those with the educational attainment of bachelor's degree or higher, with 100.0% or 68 individuals in the labor force. Within the labor force, individuals with high school diploma education have the highest percentage of unemployment, with 13.9% or 35 of them being unemployed.
| Educational Attainment | In Labor Force | Unemployed |
| Less than High School | 52 (35.1%) | 0 (0.0%) |
| High School Diploma | 252 (73.9%) | 47 (13.9%) |
| College / Associate Degree | 87 (69.6%) | 0 (0.0%) |
| Bachelor's Degree or higher | 68 (100.0%) | 0 (0.0%) |
| Total | 459 (67.3%) | 52 (7.6%) |
Employment Occupations by Sex in Minorca
Management, Business, Science and Arts Occupations
The most common Management, Business, Science and Arts occupations in Minorca are Management (43 | 8.5%), Community & Social Service (29 | 5.8%), Education Instruction & Library (29 | 5.8%), Business & Financial (5 | 1.0%), and Health Diagnosing & Treating (2 | 0.4%).
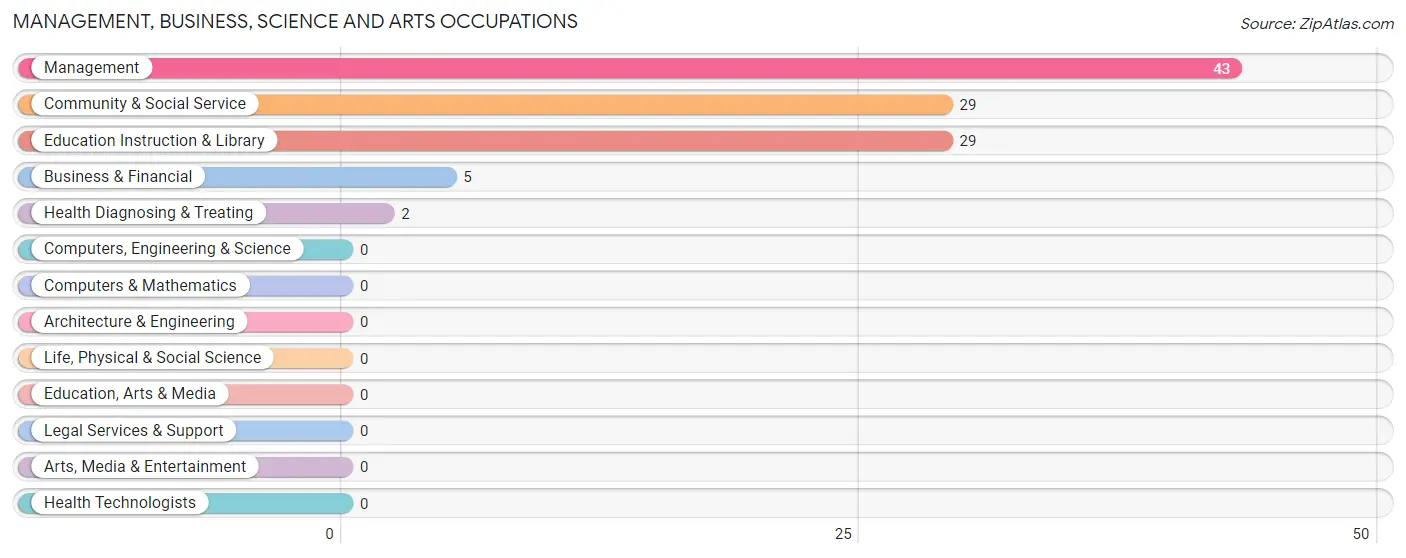
Management, Business, Science and Arts Occupations by Sex
Within the Management, Business, Science and Arts occupations in Minorca, the most male-oriented occupations are Health Diagnosing & Treating (100.0%), and Management (32.6%), while the most female-oriented occupations are Business & Financial (100.0%), Community & Social Service (100.0%), and Education Instruction & Library (100.0%).
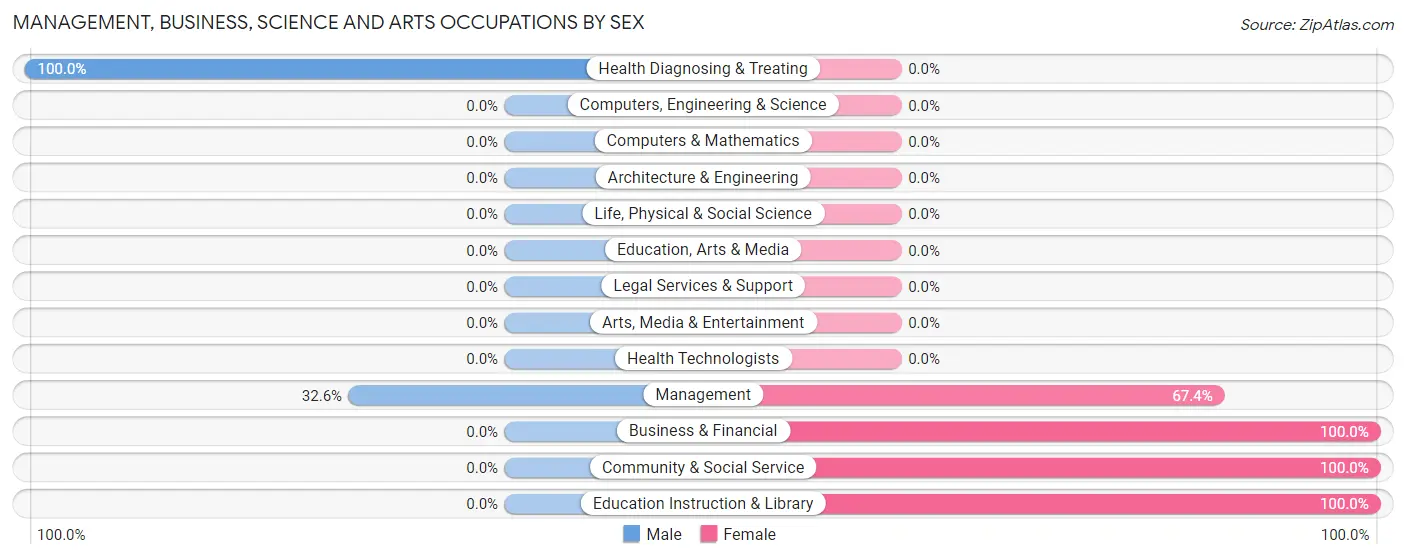
| Occupation | Male | Female |
| Management | 14 (32.6%) | 29 (67.4%) |
| Business & Financial | 0 (0.0%) | 5 (100.0%) |
| Computers, Engineering & Science | 0 (0.0%) | 0 (0.0%) |
| Computers & Mathematics | 0 (0.0%) | 0 (0.0%) |
| Architecture & Engineering | 0 (0.0%) | 0 (0.0%) |
| Life, Physical & Social Science | 0 (0.0%) | 0 (0.0%) |
| Community & Social Service | 0 (0.0%) | 29 (100.0%) |
| Education, Arts & Media | 0 (0.0%) | 0 (0.0%) |
| Legal Services & Support | 0 (0.0%) | 0 (0.0%) |
| Education Instruction & Library | 0 (0.0%) | 29 (100.0%) |
| Arts, Media & Entertainment | 0 (0.0%) | 0 (0.0%) |
| Health Diagnosing & Treating | 2 (100.0%) | 0 (0.0%) |
| Health Technologists | 0 (0.0%) | 0 (0.0%) |
| Total (Category) | 16 (20.3%) | 63 (79.7%) |
| Total (Overall) | 175 (34.7%) | 329 (65.3%) |
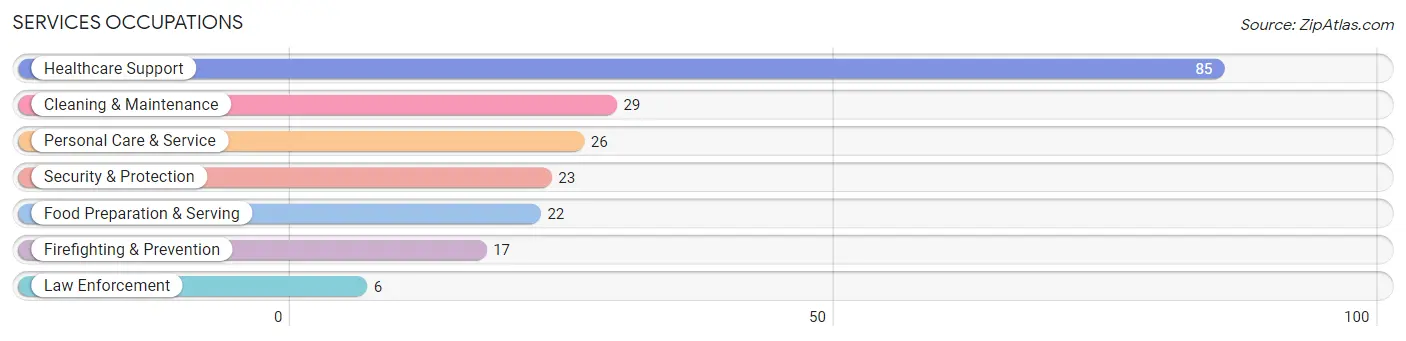
Services Occupations
The most common Services occupations in Minorca are Healthcare Support (85 | 16.9%), Cleaning & Maintenance (29 | 5.8%), Personal Care & Service (26 | 5.2%), Security & Protection (23 | 4.6%), and Food Preparation & Serving (22 | 4.4%).
Services Occupations by Sex
Within the Services occupations in Minorca, the most male-oriented occupations are Firefighting & Prevention (100.0%), Security & Protection (73.9%), and Cleaning & Maintenance (20.7%), while the most female-oriented occupations are Healthcare Support (100.0%), Law Enforcement (100.0%), and Food Preparation & Serving (100.0%).
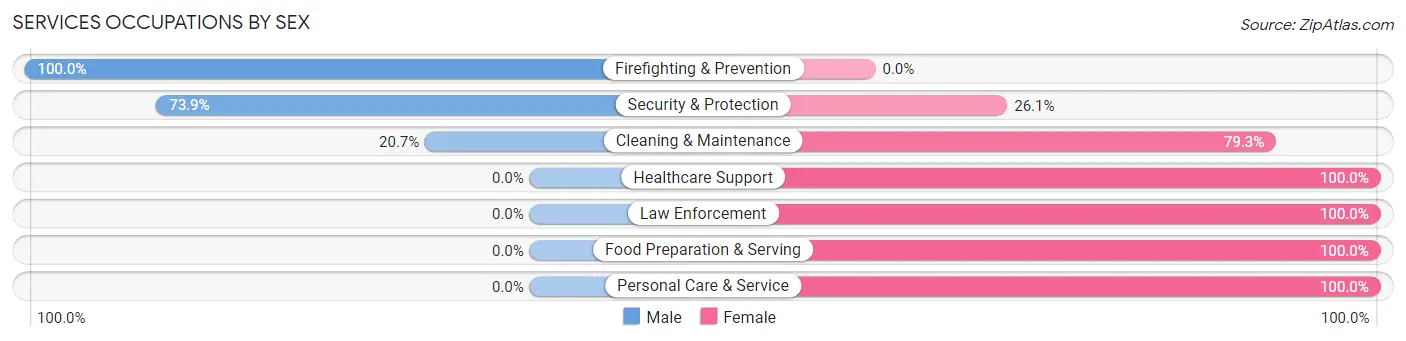
| Occupation | Male | Female |
| Healthcare Support | 0 (0.0%) | 85 (100.0%) |
| Security & Protection | 17 (73.9%) | 6 (26.1%) |
| Firefighting & Prevention | 17 (100.0%) | 0 (0.0%) |
| Law Enforcement | 0 (0.0%) | 6 (100.0%) |
| Food Preparation & Serving | 0 (0.0%) | 22 (100.0%) |
| Cleaning & Maintenance | 6 (20.7%) | 23 (79.3%) |
| Personal Care & Service | 0 (0.0%) | 26 (100.0%) |
| Total (Category) | 23 (12.4%) | 162 (87.6%) |
| Total (Overall) | 175 (34.7%) | 329 (65.3%) |
Sales and Office Occupations
The most common Sales and Office occupations in Minorca are Office & Administration (97 | 19.3%), and Sales & Related (2 | 0.4%).
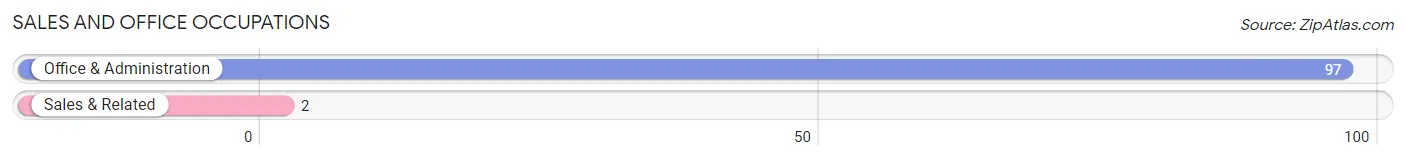
Sales and Office Occupations by Sex
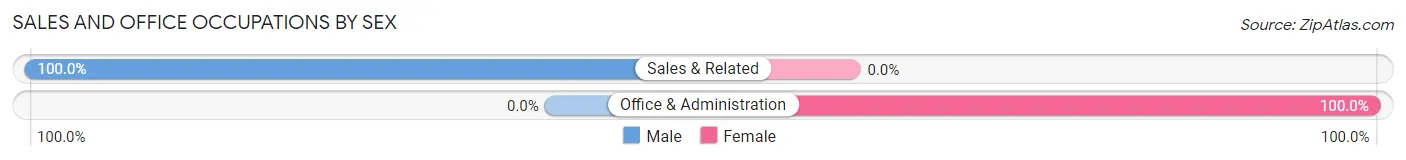
| Occupation | Male | Female |
| Sales & Related | 2 (100.0%) | 0 (0.0%) |
| Office & Administration | 0 (0.0%) | 97 (100.0%) |
| Total (Category) | 2 (2.0%) | 97 (98.0%) |
| Total (Overall) | 175 (34.7%) | 329 (65.3%) |
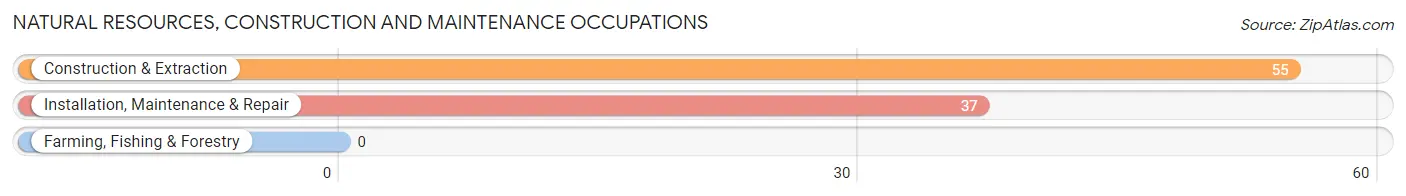
Natural Resources, Construction and Maintenance Occupations
The most common Natural Resources, Construction and Maintenance occupations in Minorca are Construction & Extraction (55 | 10.9%), and Installation, Maintenance & Repair (37 | 7.3%).
Natural Resources, Construction and Maintenance Occupations by Sex
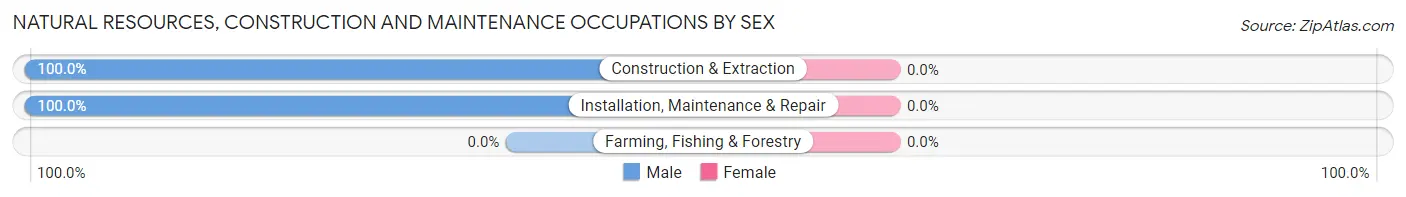
| Occupation | Male | Female |
| Farming, Fishing & Forestry | 0 (0.0%) | 0 (0.0%) |
| Construction & Extraction | 55 (100.0%) | 0 (0.0%) |
| Installation, Maintenance & Repair | 37 (100.0%) | 0 (0.0%) |
| Total (Category) | 92 (100.0%) | 0 (0.0%) |
| Total (Overall) | 175 (34.7%) | 329 (65.3%) |
Production, Transportation and Moving Occupations
The most common Production, Transportation and Moving occupations in Minorca are Transportation (29 | 5.8%), Production (13 | 2.6%), and Material Moving (7 | 1.4%).
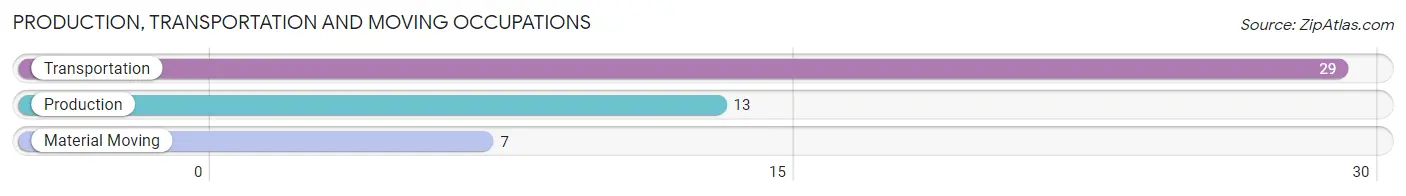
Production, Transportation and Moving Occupations by Sex
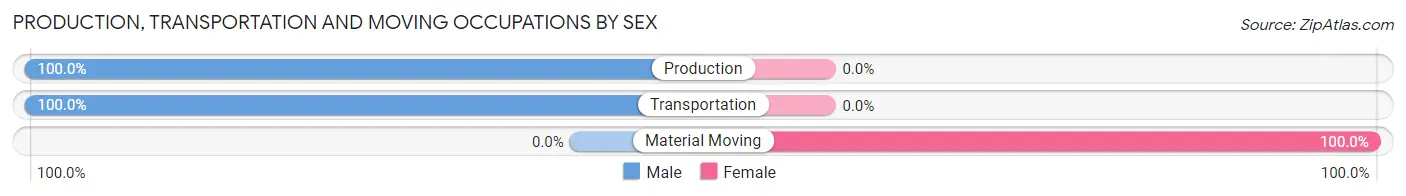
| Occupation | Male | Female |
| Production | 13 (100.0%) | 0 (0.0%) |
| Transportation | 29 (100.0%) | 0 (0.0%) |
| Material Moving | 0 (0.0%) | 7 (100.0%) |
| Total (Category) | 42 (85.7%) | 7 (14.3%) |
| Total (Overall) | 175 (34.7%) | 329 (65.3%) |
Employment Industries by Sex in Minorca
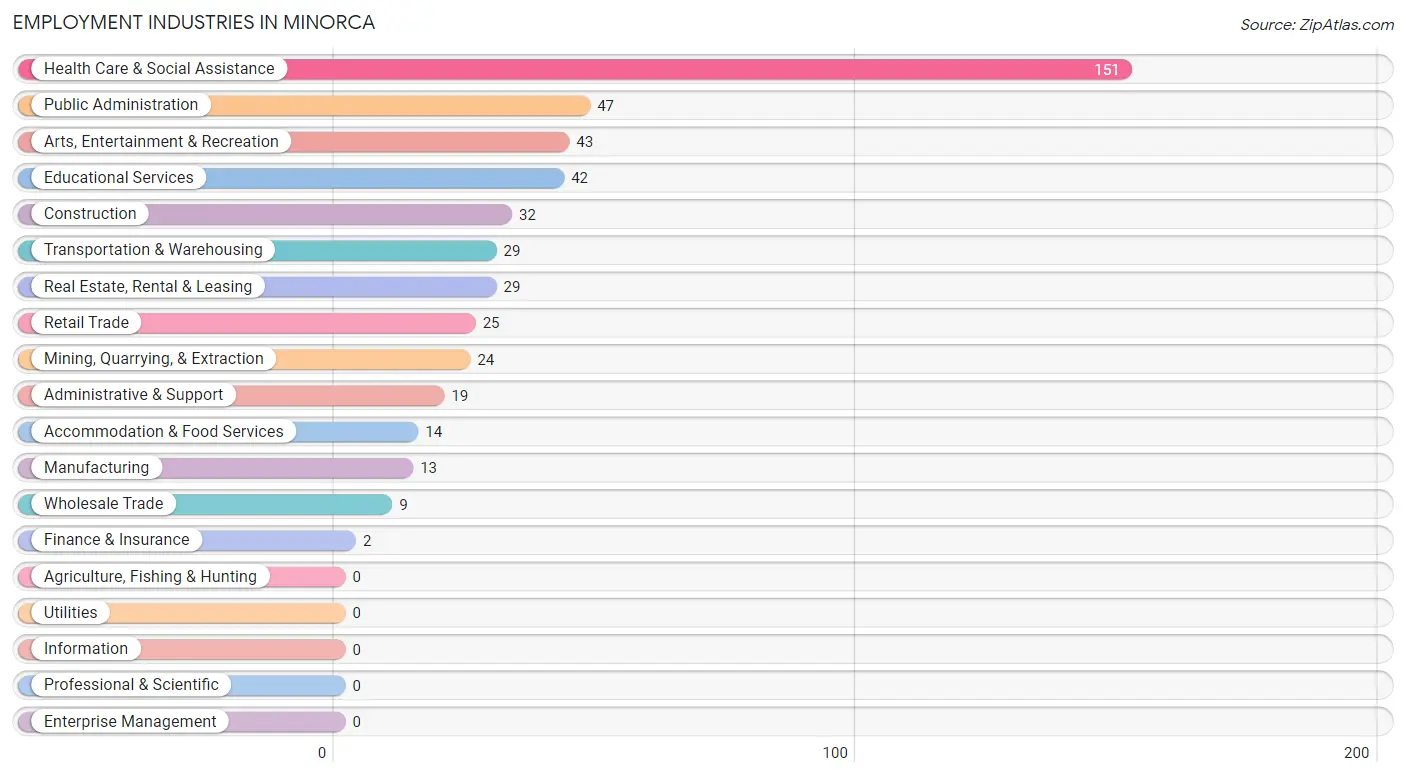
Employment Industries in Minorca
The major employment industries in Minorca include Health Care & Social Assistance (151 | 30.0%), Public Administration (47 | 9.3%), Arts, Entertainment & Recreation (43 | 8.5%), Educational Services (42 | 8.3%), and Construction (32 | 6.4%).
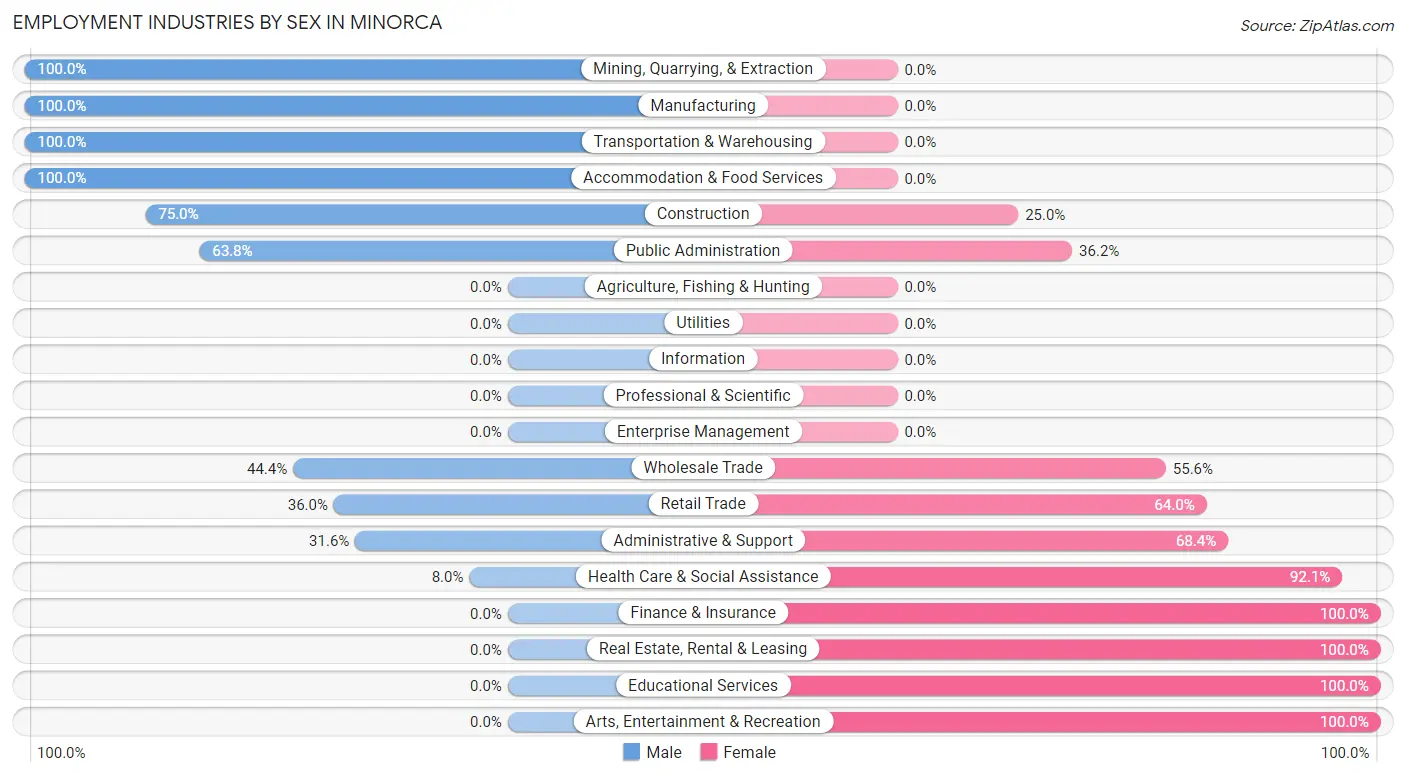
Employment Industries by Sex in Minorca
The Minorca industries that see more men than women are Mining, Quarrying, & Extraction (100.0%), Manufacturing (100.0%), and Transportation & Warehousing (100.0%), whereas the industries that tend to have a higher number of women are Finance & Insurance (100.0%), Real Estate, Rental & Leasing (100.0%), and Educational Services (100.0%).
| Industry | Male | Female |
| Agriculture, Fishing & Hunting | 0 (0.0%) | 0 (0.0%) |
| Mining, Quarrying, & Extraction | 24 (100.0%) | 0 (0.0%) |
| Construction | 24 (75.0%) | 8 (25.0%) |
| Manufacturing | 13 (100.0%) | 0 (0.0%) |
| Wholesale Trade | 4 (44.4%) | 5 (55.6%) |
| Retail Trade | 9 (36.0%) | 16 (64.0%) |
| Transportation & Warehousing | 29 (100.0%) | 0 (0.0%) |
| Utilities | 0 (0.0%) | 0 (0.0%) |
| Information | 0 (0.0%) | 0 (0.0%) |
| Finance & Insurance | 0 (0.0%) | 2 (100.0%) |
| Real Estate, Rental & Leasing | 0 (0.0%) | 29 (100.0%) |
| Professional & Scientific | 0 (0.0%) | 0 (0.0%) |
| Enterprise Management | 0 (0.0%) | 0 (0.0%) |
| Administrative & Support | 6 (31.6%) | 13 (68.4%) |
| Educational Services | 0 (0.0%) | 42 (100.0%) |
| Health Care & Social Assistance | 12 (8.0%) | 139 (92.0%) |
| Arts, Entertainment & Recreation | 0 (0.0%) | 43 (100.0%) |
| Accommodation & Food Services | 14 (100.0%) | 0 (0.0%) |
| Public Administration | 30 (63.8%) | 17 (36.2%) |
| Total | 175 (34.7%) | 329 (65.3%) |
Education in Minorca
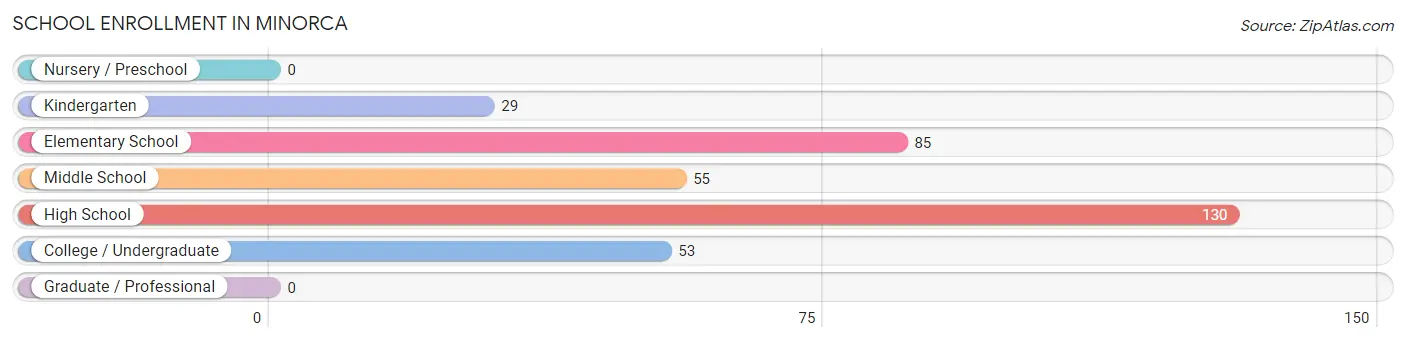
School Enrollment in Minorca
The most common levels of schooling among the 352 students in Minorca are high school (130 | 36.9%), elementary school (85 | 24.1%), and middle school (55 | 15.6%).
| School Level | # Students | % Students |
| Nursery / Preschool | 0 | 0.0% |
| Kindergarten | 29 | 8.2% |
| Elementary School | 85 | 24.1% |
| Middle School | 55 | 15.6% |
| High School | 130 | 36.9% |
| College / Undergraduate | 53 | 15.1% |
| Graduate / Professional | 0 | 0.0% |
| Total | 352 | 100.0% |
School Enrollment by Age by Funding Source in Minorca
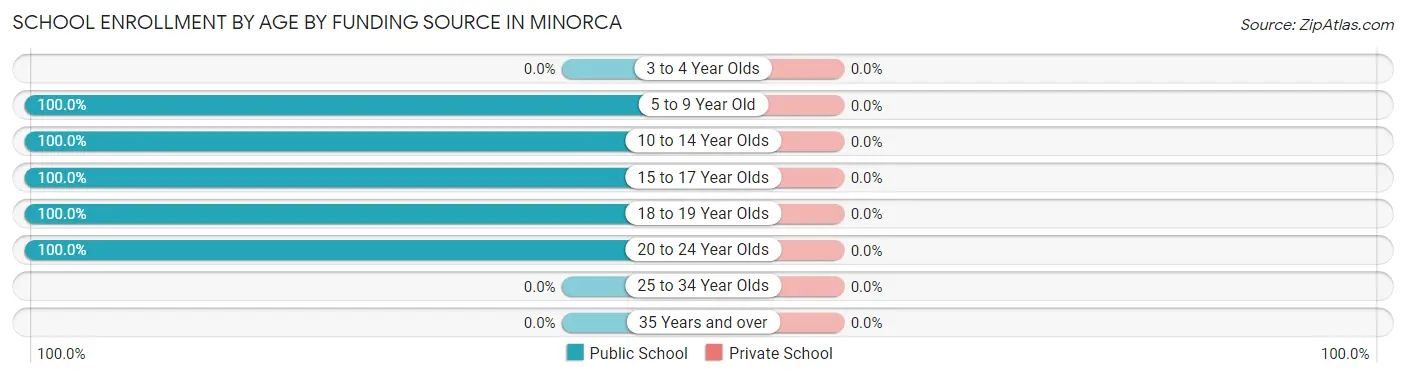
| Age Bracket | Public School | Private School |
| 3 to 4 Year Olds | 0 (0.0%) | 0 (0.0%) |
| 5 to 9 Year Old | 114 (100.0%) | 0 (0.0%) |
| 10 to 14 Year Olds | 84 (100.0%) | 0 (0.0%) |
| 15 to 17 Year Olds | 101 (100.0%) | 0 (0.0%) |
| 18 to 19 Year Olds | 28 (100.0%) | 0 (0.0%) |
| 20 to 24 Year Olds | 25 (100.0%) | 0 (0.0%) |
| 25 to 34 Year Olds | 0 (0.0%) | 0 (0.0%) |
| 35 Years and over | 0 (0.0%) | 0 (0.0%) |
| Total | 352 (100.0%) | 0 (0.0%) |
Educational Attainment by Field of Study in Minorca
Business (54 | 60.7%), engineering (12 | 13.5%), education (12 | 13.5%), visual & performing arts (9 | 10.1%), and arts & humanities (2 | 2.2%) are the most common fields of study among 89 individuals in Minorca who have obtained a bachelor's degree or higher.
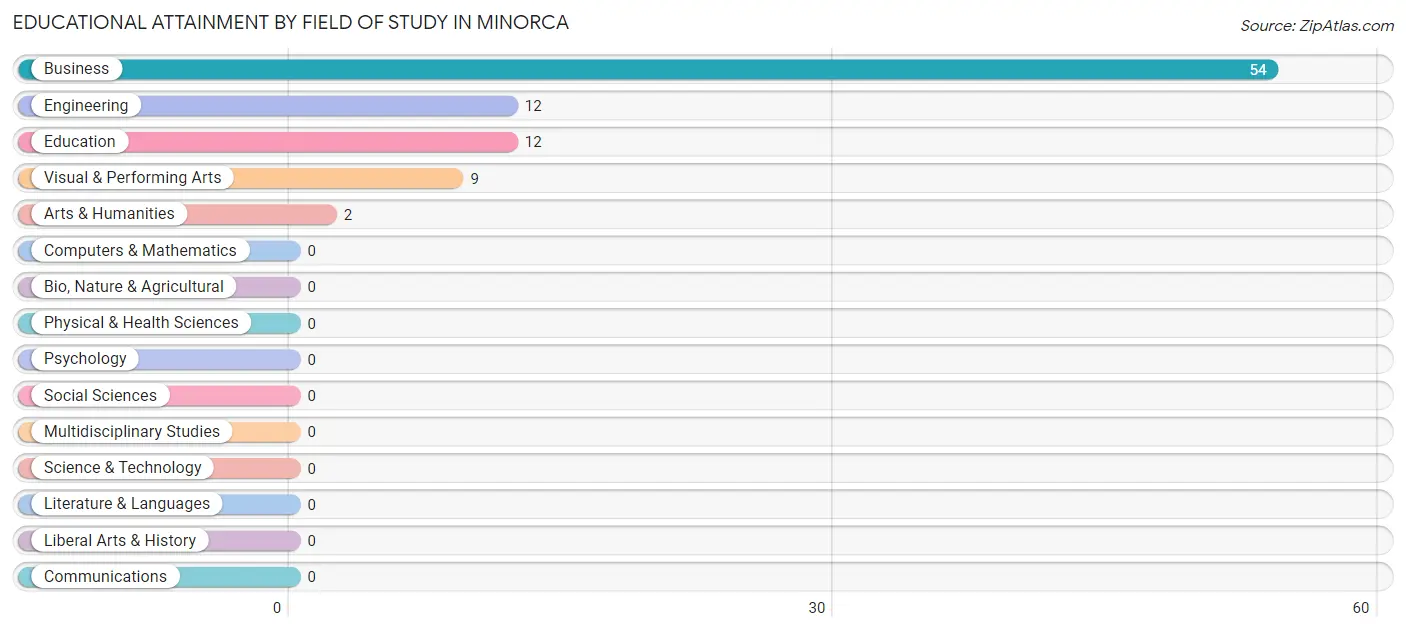
| Field of Study | # Graduates | % Graduates |
| Computers & Mathematics | 0 | 0.0% |
| Bio, Nature & Agricultural | 0 | 0.0% |
| Physical & Health Sciences | 0 | 0.0% |
| Psychology | 0 | 0.0% |
| Social Sciences | 0 | 0.0% |
| Engineering | 12 | 13.5% |
| Multidisciplinary Studies | 0 | 0.0% |
| Science & Technology | 0 | 0.0% |
| Business | 54 | 60.7% |
| Education | 12 | 13.5% |
| Literature & Languages | 0 | 0.0% |
| Liberal Arts & History | 0 | 0.0% |
| Visual & Performing Arts | 9 | 10.1% |
| Communications | 0 | 0.0% |
| Arts & Humanities | 2 | 2.2% |
| Total | 89 | 100.0% |
Transportation & Commute in Minorca
Vehicle Availability by Sex in Minorca
The most prevalent vehicle ownership categories in Minorca are males with 2 vehicles (85, accounting for 48.6%) and females with 2 vehicles (120, making up 37.4%).
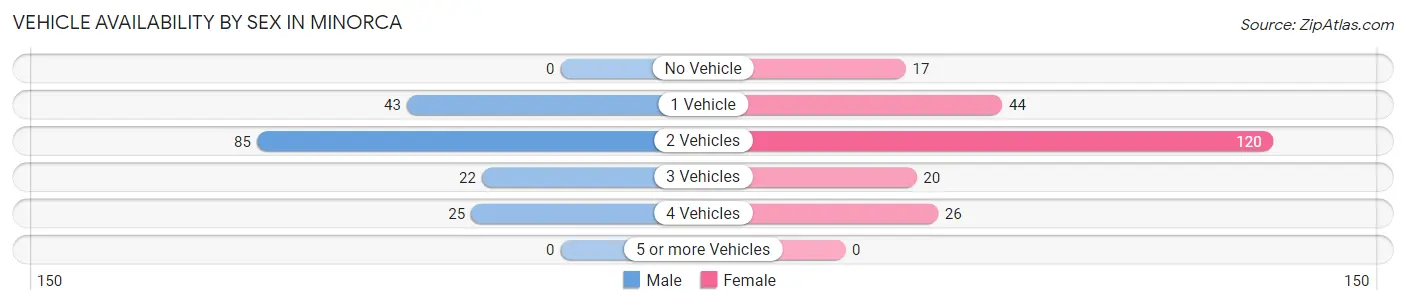
| Vehicles Available | Male | Female |
| No Vehicle | 0 (0.0%) | 17 (7.5%) |
| 1 Vehicle | 43 (24.6%) | 44 (19.4%) |
| 2 Vehicles | 85 (48.6%) | 120 (52.9%) |
| 3 Vehicles | 22 (12.6%) | 20 (8.8%) |
| 4 Vehicles | 25 (14.3%) | 26 (11.5%) |
| 5 or more Vehicles | 0 (0.0%) | 0 (0.0%) |
| Total | 175 (100.0%) | 227 (100.0%) |
Commute Time in Minorca
The most frequently occuring commute durations in Minorca are 15 to 19 minutes (129 commuters, 32.9%), 10 to 14 minutes (125 commuters, 31.9%), and 20 to 24 minutes (75 commuters, 19.1%).
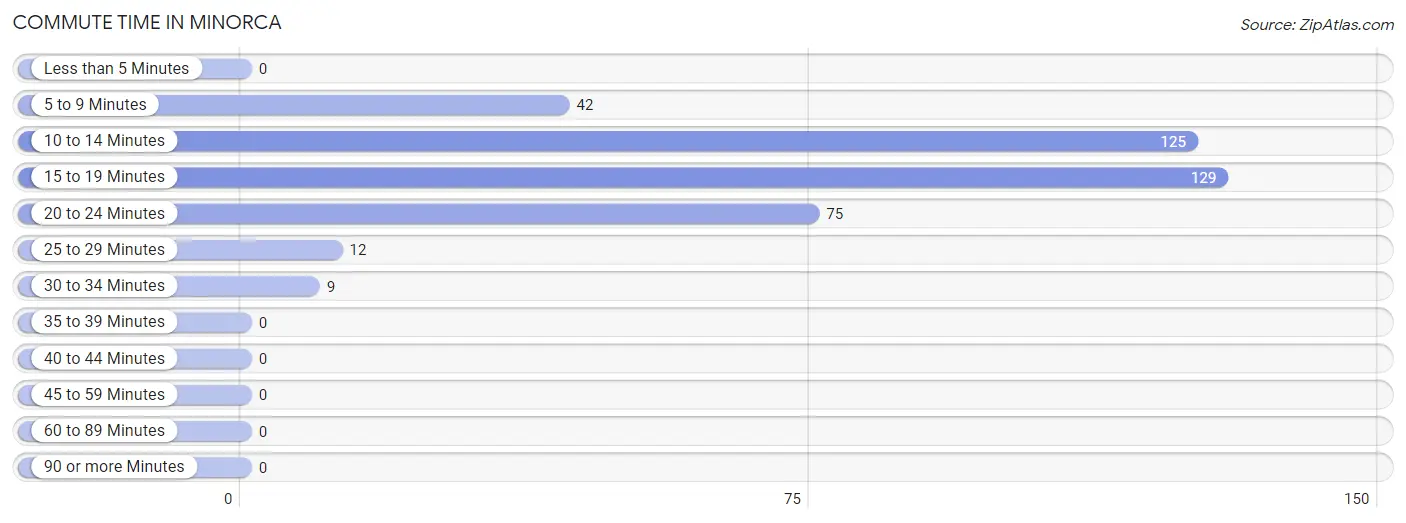
| Commute Time | # Commuters | % Commuters |
| Less than 5 Minutes | 0 | 0.0% |
| 5 to 9 Minutes | 42 | 10.7% |
| 10 to 14 Minutes | 125 | 31.9% |
| 15 to 19 Minutes | 129 | 32.9% |
| 20 to 24 Minutes | 75 | 19.1% |
| 25 to 29 Minutes | 12 | 3.1% |
| 30 to 34 Minutes | 9 | 2.3% |
| 35 to 39 Minutes | 0 | 0.0% |
| 40 to 44 Minutes | 0 | 0.0% |
| 45 to 59 Minutes | 0 | 0.0% |
| 60 to 89 Minutes | 0 | 0.0% |
| 90 or more Minutes | 0 | 0.0% |
Commute Time by Sex in Minorca
The most common commute times in Minorca are 10 to 14 minutes (81 commuters, 49.1%) for males and 15 to 19 minutes (100 commuters, 44.1%) for females.
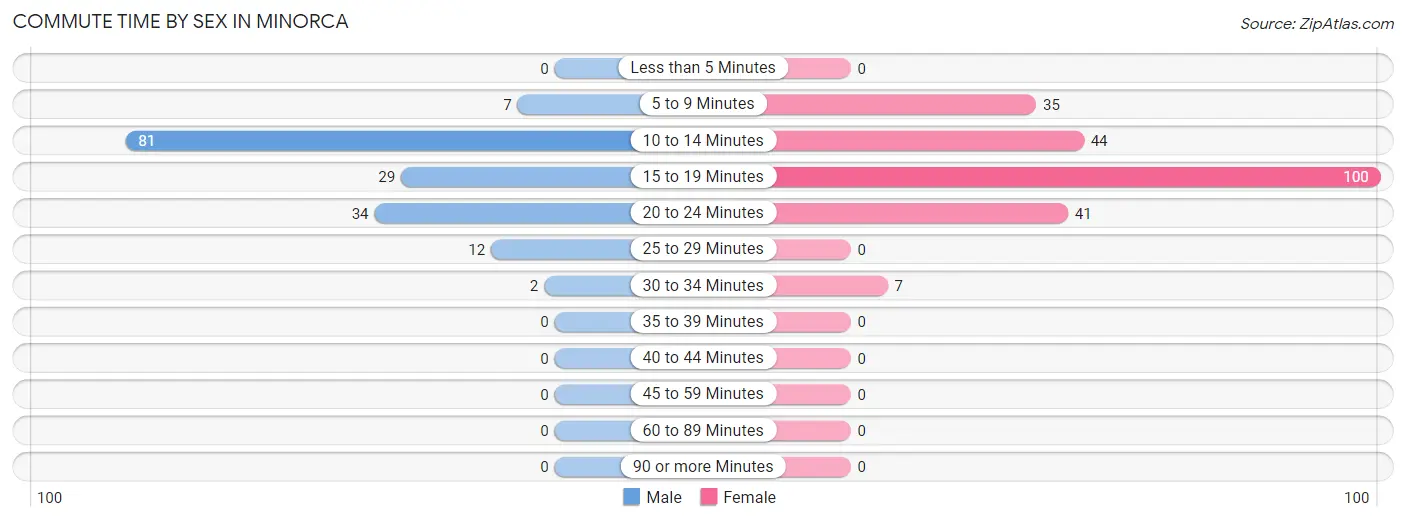
| Commute Time | Male | Female |
| Less than 5 Minutes | 0 (0.0%) | 0 (0.0%) |
| 5 to 9 Minutes | 7 (4.2%) | 35 (15.4%) |
| 10 to 14 Minutes | 81 (49.1%) | 44 (19.4%) |
| 15 to 19 Minutes | 29 (17.6%) | 100 (44.1%) |
| 20 to 24 Minutes | 34 (20.6%) | 41 (18.1%) |
| 25 to 29 Minutes | 12 (7.3%) | 0 (0.0%) |
| 30 to 34 Minutes | 2 (1.2%) | 7 (3.1%) |
| 35 to 39 Minutes | 0 (0.0%) | 0 (0.0%) |
| 40 to 44 Minutes | 0 (0.0%) | 0 (0.0%) |
| 45 to 59 Minutes | 0 (0.0%) | 0 (0.0%) |
| 60 to 89 Minutes | 0 (0.0%) | 0 (0.0%) |
| 90 or more Minutes | 0 (0.0%) | 0 (0.0%) |
Time of Departure to Work by Sex in Minorca
The most frequent times of departure to work in Minorca are 6:30 AM to 6:59 AM (48, 29.1%) for males and 7:00 AM to 7:29 AM (92, 40.5%) for females.
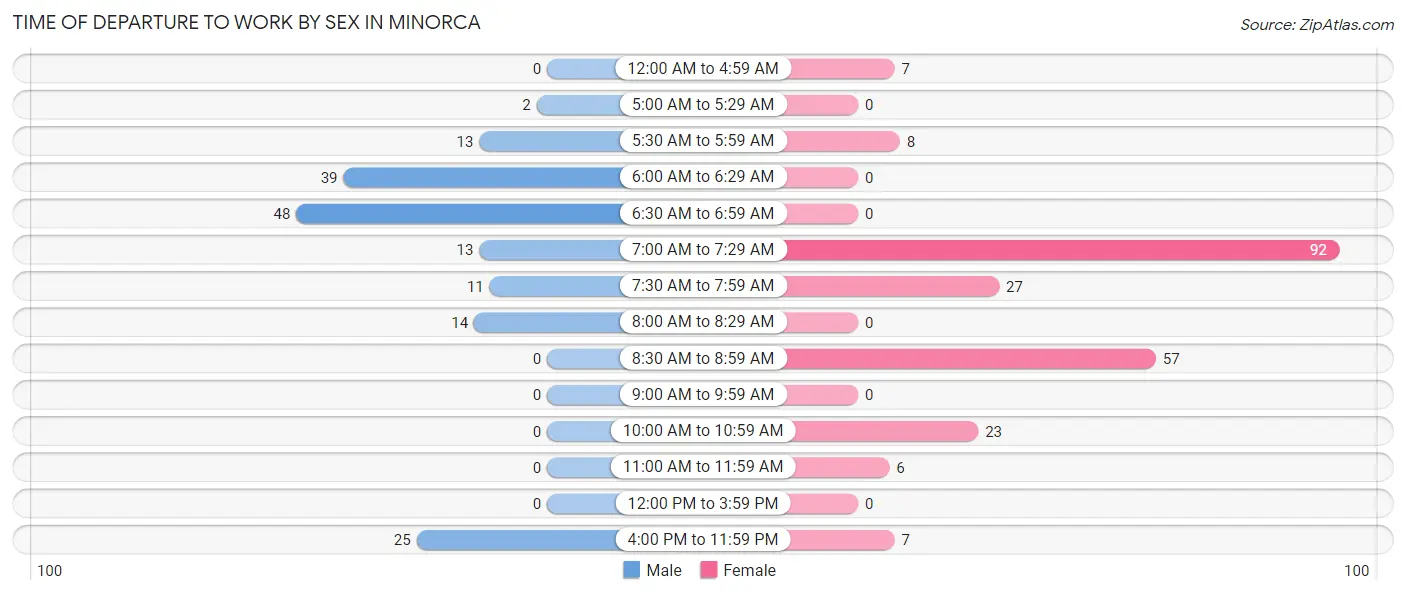
| Time of Departure | Male | Female |
| 12:00 AM to 4:59 AM | 0 (0.0%) | 7 (3.1%) |
| 5:00 AM to 5:29 AM | 2 (1.2%) | 0 (0.0%) |
| 5:30 AM to 5:59 AM | 13 (7.9%) | 8 (3.5%) |
| 6:00 AM to 6:29 AM | 39 (23.6%) | 0 (0.0%) |
| 6:30 AM to 6:59 AM | 48 (29.1%) | 0 (0.0%) |
| 7:00 AM to 7:29 AM | 13 (7.9%) | 92 (40.5%) |
| 7:30 AM to 7:59 AM | 11 (6.7%) | 27 (11.9%) |
| 8:00 AM to 8:29 AM | 14 (8.5%) | 0 (0.0%) |
| 8:30 AM to 8:59 AM | 0 (0.0%) | 57 (25.1%) |
| 9:00 AM to 9:59 AM | 0 (0.0%) | 0 (0.0%) |
| 10:00 AM to 10:59 AM | 0 (0.0%) | 23 (10.1%) |
| 11:00 AM to 11:59 AM | 0 (0.0%) | 6 (2.6%) |
| 12:00 PM to 3:59 PM | 0 (0.0%) | 0 (0.0%) |
| 4:00 PM to 11:59 PM | 25 (15.1%) | 7 (3.1%) |
| Total | 165 (100.0%) | 227 (100.0%) |
Housing Occupancy in Minorca
Occupancy by Ownership in Minorca
Of the total 570 dwellings in Minorca, owner-occupied units account for 404 (70.9%), while renter-occupied units make up 166 (29.1%).
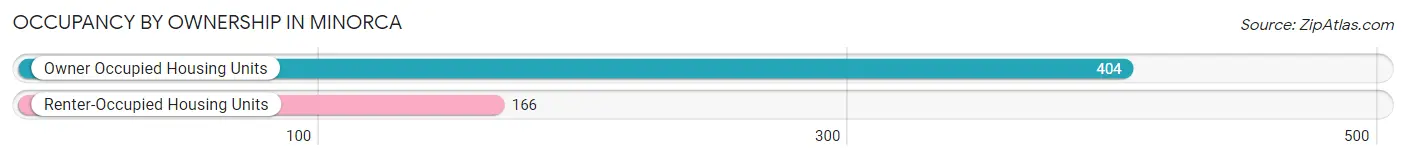
| Occupancy | # Housing Units | % Housing Units |
| Owner Occupied Housing Units | 404 | 70.9% |
| Renter-Occupied Housing Units | 166 | 29.1% |
| Total Occupied Housing Units | 570 | 100.0% |
Occupancy by Household Size in Minorca
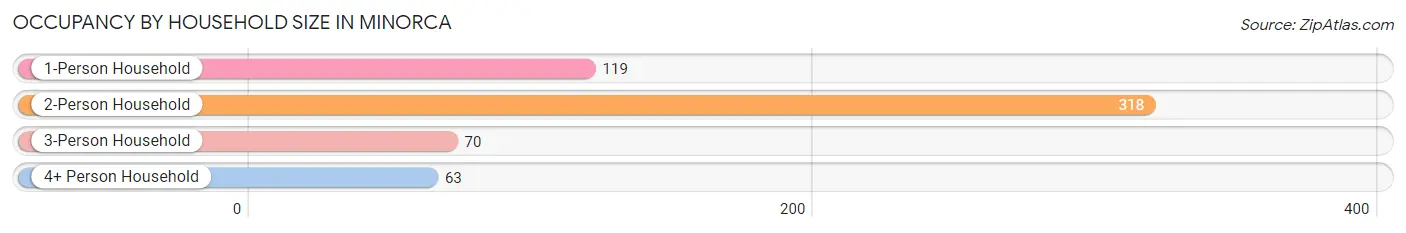
| Household Size | # Housing Units | % Housing Units |
| 1-Person Household | 119 | 20.9% |
| 2-Person Household | 318 | 55.8% |
| 3-Person Household | 70 | 12.3% |
| 4+ Person Household | 63 | 11.1% |
| Total Housing Units | 570 | 100.0% |
Occupancy by Ownership by Household Size in Minorca
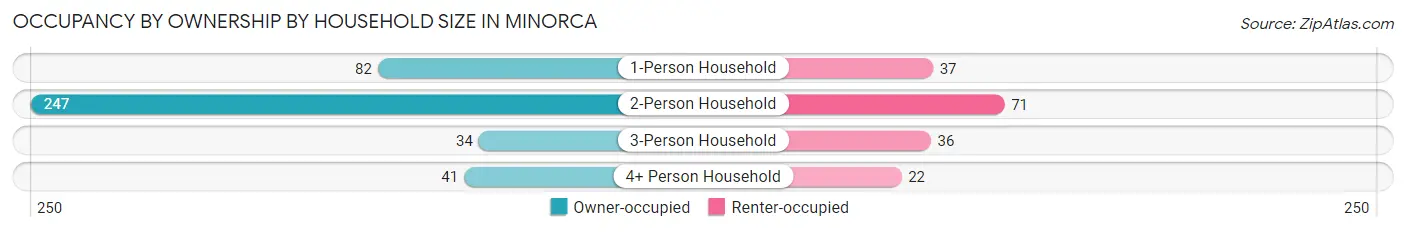
| Household Size | Owner-occupied | Renter-occupied |
| 1-Person Household | 82 (68.9%) | 37 (31.1%) |
| 2-Person Household | 247 (77.7%) | 71 (22.3%) |
| 3-Person Household | 34 (48.6%) | 36 (51.4%) |
| 4+ Person Household | 41 (65.1%) | 22 (34.9%) |
| Total Housing Units | 404 (70.9%) | 166 (29.1%) |
Occupancy by Educational Attainment in Minorca
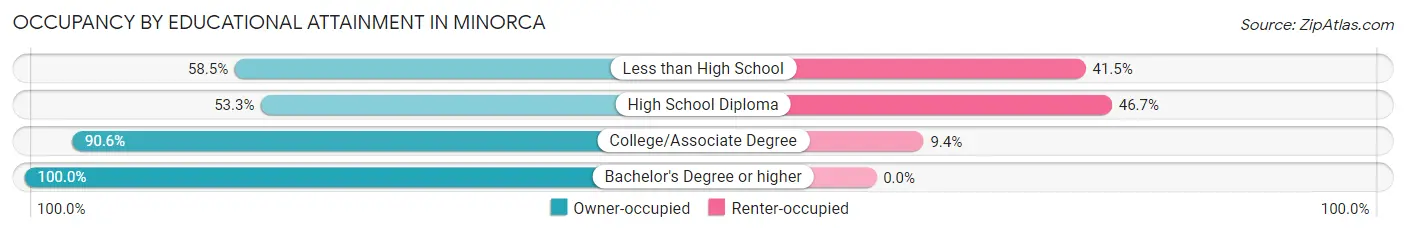
| Household Size | Owner-occupied | Renter-occupied |
| Less than High School | 62 (58.5%) | 44 (41.5%) |
| High School Diploma | 122 (53.3%) | 107 (46.7%) |
| College/Associate Degree | 145 (90.6%) | 15 (9.4%) |
| Bachelor's Degree or higher | 75 (100.0%) | 0 (0.0%) |
Occupancy by Age of Householder in Minorca
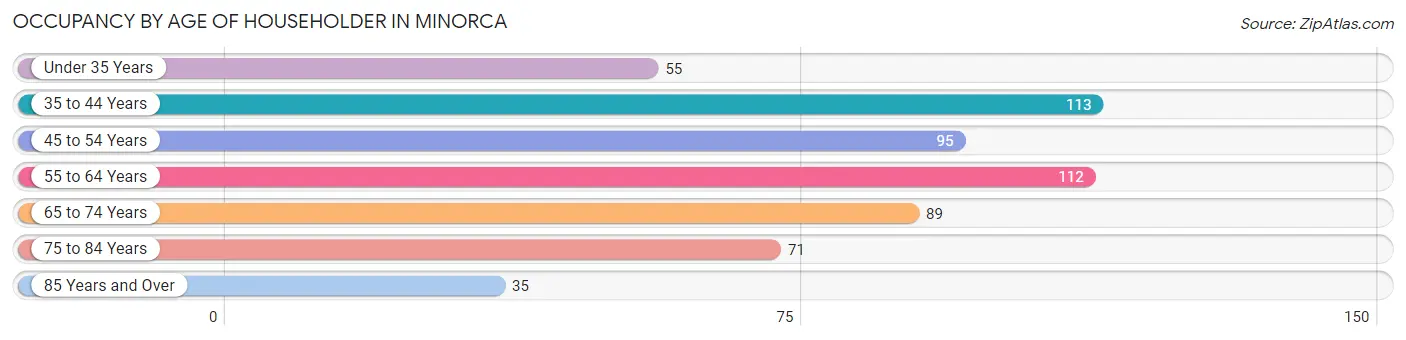
| Age Bracket | # Households | % Households |
| Under 35 Years | 55 | 9.7% |
| 35 to 44 Years | 113 | 19.8% |
| 45 to 54 Years | 95 | 16.7% |
| 55 to 64 Years | 112 | 19.7% |
| 65 to 74 Years | 89 | 15.6% |
| 75 to 84 Years | 71 | 12.5% |
| 85 Years and Over | 35 | 6.1% |
| Total | 570 | 100.0% |
Housing Finances in Minorca
Median Income by Occupancy in Minorca
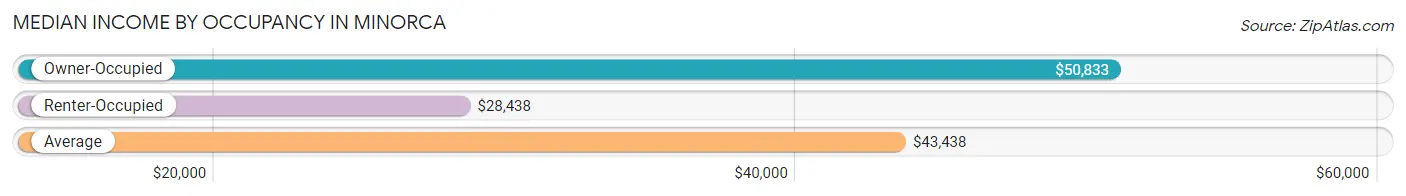
| Occupancy Type | # Households | Median Income |
| Owner-Occupied | 404 (70.9%) | $50,833 |
| Renter-Occupied | 166 (29.1%) | $28,438 |
| Average | 570 (100.0%) | $43,438 |
Occupancy by Householder Income Bracket in Minorca
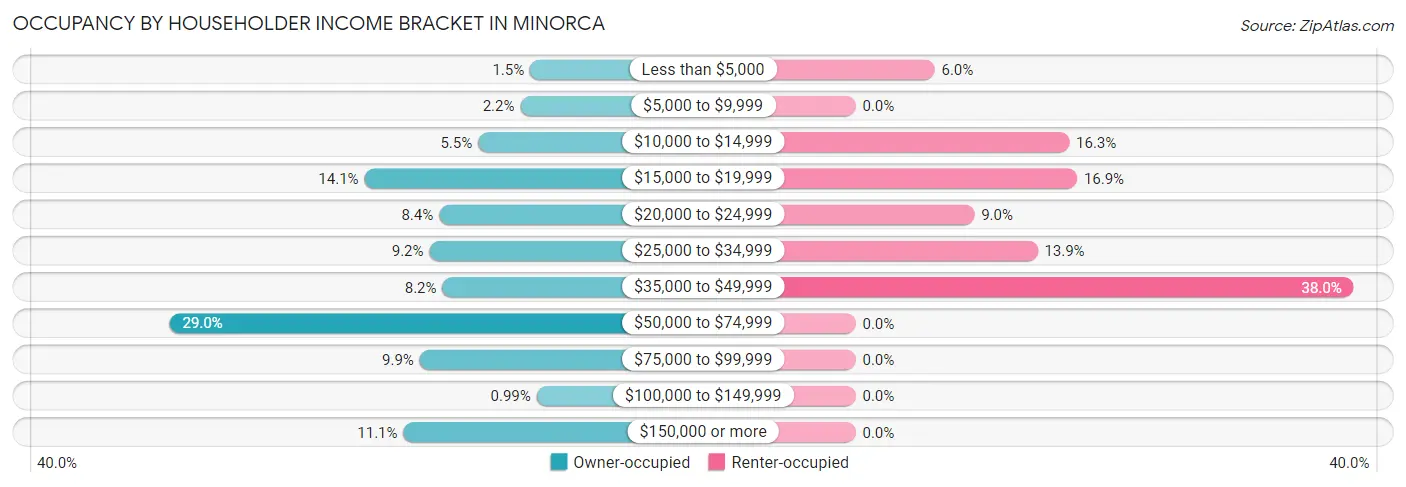
| Income Bracket | Owner-occupied | Renter-occupied |
| Less than $5,000 | 6 (1.5%) | 10 (6.0%) |
| $5,000 to $9,999 | 9 (2.2%) | 0 (0.0%) |
| $10,000 to $14,999 | 22 (5.4%) | 27 (16.3%) |
| $15,000 to $19,999 | 57 (14.1%) | 28 (16.9%) |
| $20,000 to $24,999 | 34 (8.4%) | 15 (9.0%) |
| $25,000 to $34,999 | 37 (9.2%) | 23 (13.9%) |
| $35,000 to $49,999 | 33 (8.2%) | 63 (38.0%) |
| $50,000 to $74,999 | 117 (29.0%) | 0 (0.0%) |
| $75,000 to $99,999 | 40 (9.9%) | 0 (0.0%) |
| $100,000 to $149,999 | 4 (1.0%) | 0 (0.0%) |
| $150,000 or more | 45 (11.1%) | 0 (0.0%) |
| Total | 404 (100.0%) | 166 (100.0%) |
Monthly Housing Cost Tiers in Minorca
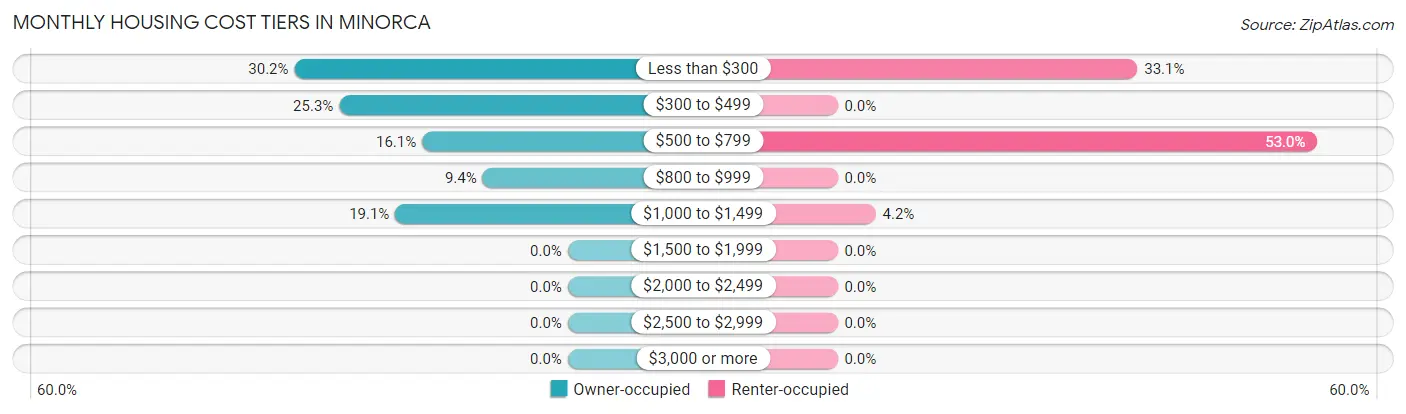
| Monthly Cost | Owner-occupied | Renter-occupied |
| Less than $300 | 122 (30.2%) | 55 (33.1%) |
| $300 to $499 | 102 (25.3%) | 0 (0.0%) |
| $500 to $799 | 65 (16.1%) | 88 (53.0%) |
| $800 to $999 | 38 (9.4%) | 0 (0.0%) |
| $1,000 to $1,499 | 77 (19.1%) | 7 (4.2%) |
| $1,500 to $1,999 | 0 (0.0%) | 0 (0.0%) |
| $2,000 to $2,499 | 0 (0.0%) | 0 (0.0%) |
| $2,500 to $2,999 | 0 (0.0%) | 0 (0.0%) |
| $3,000 or more | 0 (0.0%) | 0 (0.0%) |
| Total | 404 (100.0%) | 166 (100.0%) |
Physical Housing Characteristics in Minorca
Housing Structures in Minorca
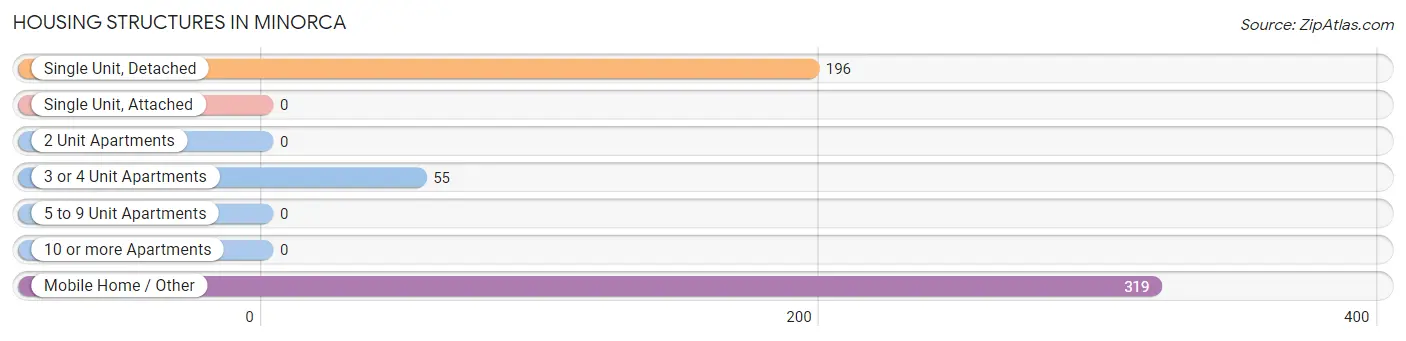
| Structure Type | # Housing Units | % Housing Units |
| Single Unit, Detached | 196 | 34.4% |
| Single Unit, Attached | 0 | 0.0% |
| 2 Unit Apartments | 0 | 0.0% |
| 3 or 4 Unit Apartments | 55 | 9.7% |
| 5 to 9 Unit Apartments | 0 | 0.0% |
| 10 or more Apartments | 0 | 0.0% |
| Mobile Home / Other | 319 | 56.0% |
| Total | 570 | 100.0% |
Housing Structures by Occupancy in Minorca
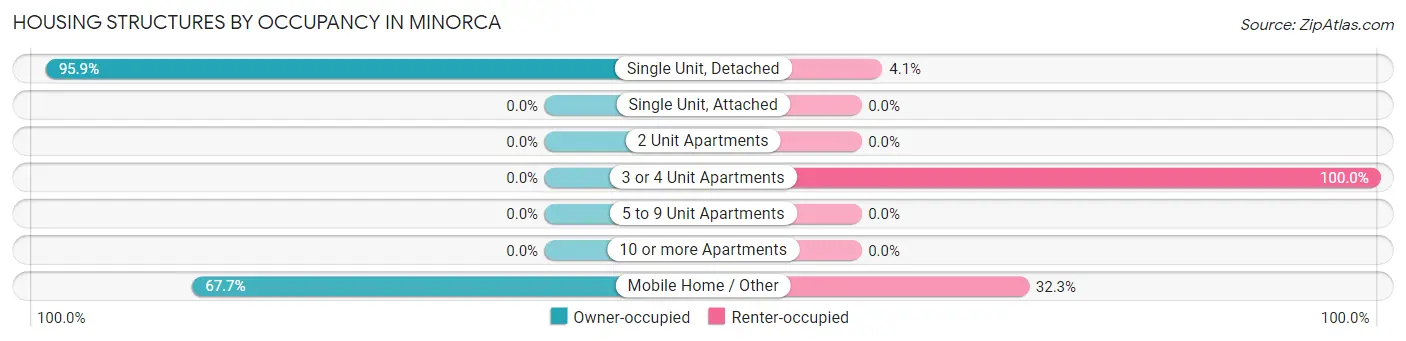
| Structure Type | Owner-occupied | Renter-occupied |
| Single Unit, Detached | 188 (95.9%) | 8 (4.1%) |
| Single Unit, Attached | 0 (0.0%) | 0 (0.0%) |
| 2 Unit Apartments | 0 (0.0%) | 0 (0.0%) |
| 3 or 4 Unit Apartments | 0 (0.0%) | 55 (100.0%) |
| 5 to 9 Unit Apartments | 0 (0.0%) | 0 (0.0%) |
| 10 or more Apartments | 0 (0.0%) | 0 (0.0%) |
| Mobile Home / Other | 216 (67.7%) | 103 (32.3%) |
| Total | 404 (70.9%) | 166 (29.1%) |
Housing Structures by Number of Rooms in Minorca
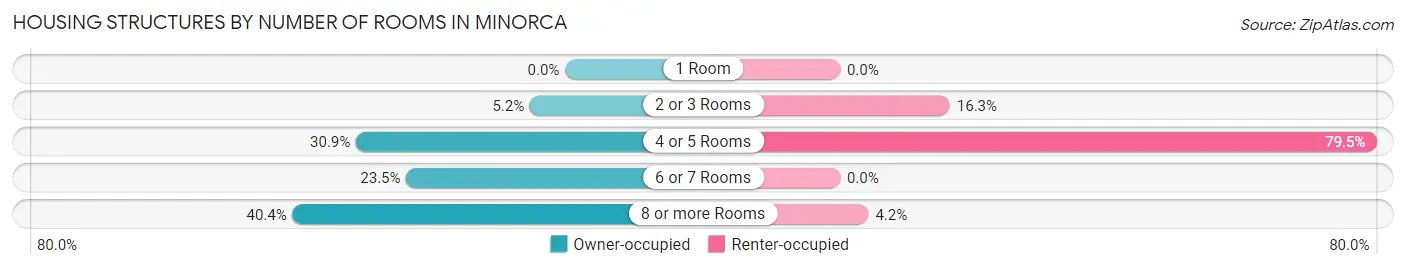
| Number of Rooms | Owner-occupied | Renter-occupied |
| 1 Room | 0 (0.0%) | 0 (0.0%) |
| 2 or 3 Rooms | 21 (5.2%) | 27 (16.3%) |
| 4 or 5 Rooms | 125 (30.9%) | 132 (79.5%) |
| 6 or 7 Rooms | 95 (23.5%) | 0 (0.0%) |
| 8 or more Rooms | 163 (40.4%) | 7 (4.2%) |
| Total | 404 (100.0%) | 166 (100.0%) |
Housing Structure by Heating Type in Minorca
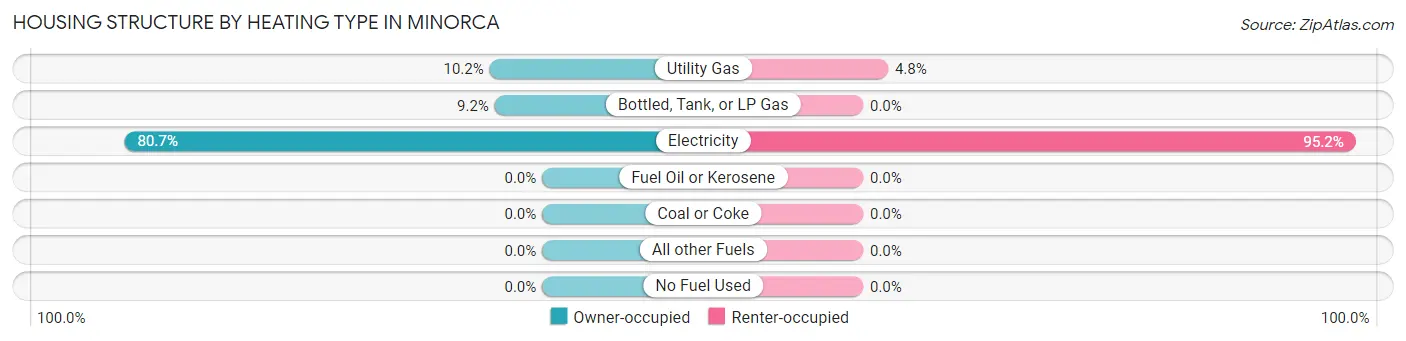
| Heating Type | Owner-occupied | Renter-occupied |
| Utility Gas | 41 (10.2%) | 8 (4.8%) |
| Bottled, Tank, or LP Gas | 37 (9.2%) | 0 (0.0%) |
| Electricity | 326 (80.7%) | 158 (95.2%) |
| Fuel Oil or Kerosene | 0 (0.0%) | 0 (0.0%) |
| Coal or Coke | 0 (0.0%) | 0 (0.0%) |
| All other Fuels | 0 (0.0%) | 0 (0.0%) |
| No Fuel Used | 0 (0.0%) | 0 (0.0%) |
| Total | 404 (100.0%) | 166 (100.0%) |
Household Vehicle Usage in Minorca
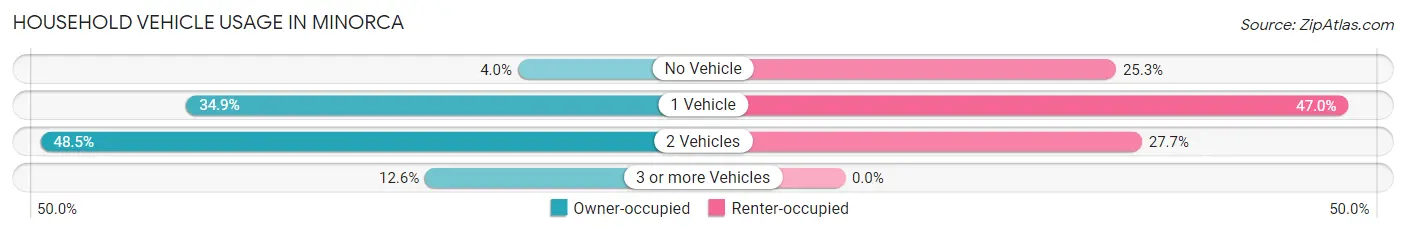
| Vehicles per Household | Owner-occupied | Renter-occupied |
| No Vehicle | 16 (4.0%) | 42 (25.3%) |
| 1 Vehicle | 141 (34.9%) | 78 (47.0%) |
| 2 Vehicles | 196 (48.5%) | 46 (27.7%) |
| 3 or more Vehicles | 51 (12.6%) | 0 (0.0%) |
| Total | 404 (100.0%) | 166 (100.0%) |
Real Estate & Mortgages in Minorca
Real Estate and Mortgage Overview in Minorca
| Characteristic | Without Mortgage | With Mortgage |
| Housing Units | 241 | 163 |
| Median Property Value | - | - |
| Median Household Income | - | - |
| Monthly Housing Costs | $299 | $0 |
| Real Estate Taxes | $199 | $35 |
Property Value by Mortgage Status in Minorca
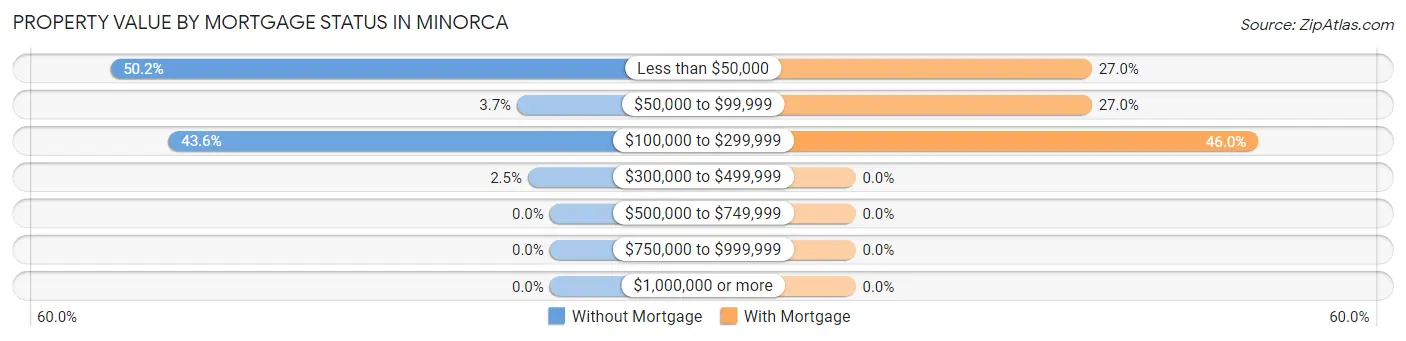
| Property Value | Without Mortgage | With Mortgage |
| Less than $50,000 | 121 (50.2%) | 44 (27.0%) |
| $50,000 to $99,999 | 9 (3.7%) | 44 (27.0%) |
| $100,000 to $299,999 | 105 (43.6%) | 75 (46.0%) |
| $300,000 to $499,999 | 6 (2.5%) | 0 (0.0%) |
| $500,000 to $749,999 | 0 (0.0%) | 0 (0.0%) |
| $750,000 to $999,999 | 0 (0.0%) | 0 (0.0%) |
| $1,000,000 or more | 0 (0.0%) | 0 (0.0%) |
| Total | 241 (100.0%) | 163 (100.0%) |
Household Income by Mortgage Status in Minorca
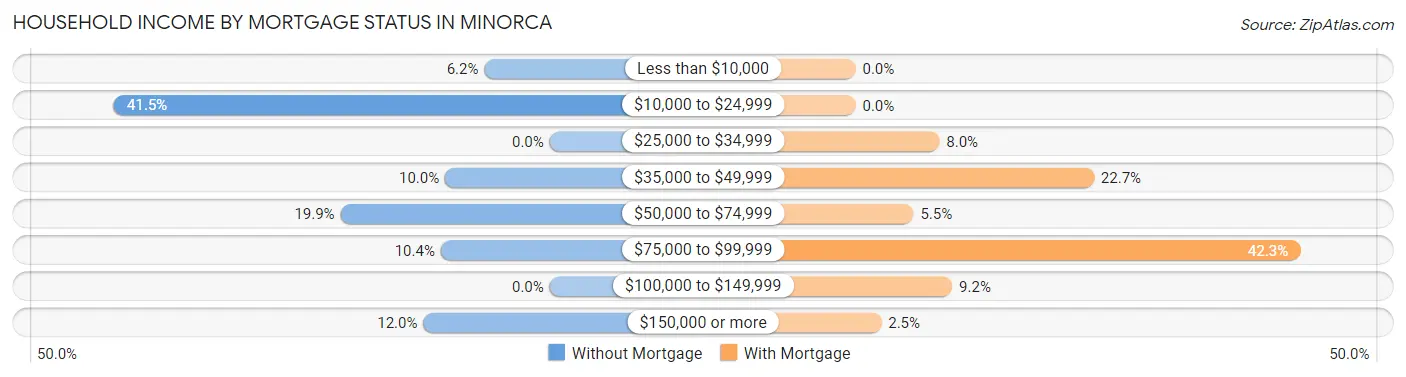
| Household Income | Without Mortgage | With Mortgage |
| Less than $10,000 | 15 (6.2%) | 0 (0.0%) |
| $10,000 to $24,999 | 100 (41.5%) | 0 (0.0%) |
| $25,000 to $34,999 | 0 (0.0%) | 13 (8.0%) |
| $35,000 to $49,999 | 24 (10.0%) | 37 (22.7%) |
| $50,000 to $74,999 | 48 (19.9%) | 9 (5.5%) |
| $75,000 to $99,999 | 25 (10.4%) | 69 (42.3%) |
| $100,000 to $149,999 | 0 (0.0%) | 15 (9.2%) |
| $150,000 or more | 29 (12.0%) | 4 (2.5%) |
| Total | 241 (100.0%) | 163 (100.0%) |
Property Value to Household Income Ratio in Minorca
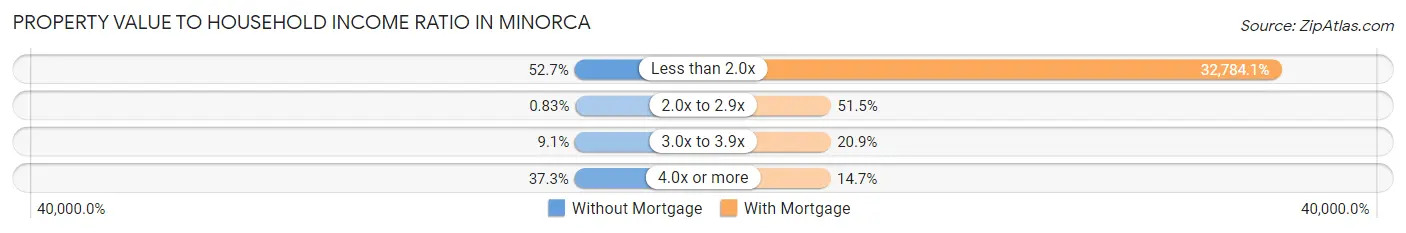
| Value-to-Income Ratio | Without Mortgage | With Mortgage |
| Less than 2.0x | 127 (52.7%) | 53,438 (32,784.1%) |
| 2.0x to 2.9x | 2 (0.8%) | 84 (51.5%) |
| 3.0x to 3.9x | 22 (9.1%) | 34 (20.9%) |
| 4.0x or more | 90 (37.3%) | 24 (14.7%) |
| Total | 241 (100.0%) | 163 (100.0%) |
Real Estate Taxes by Mortgage Status in Minorca
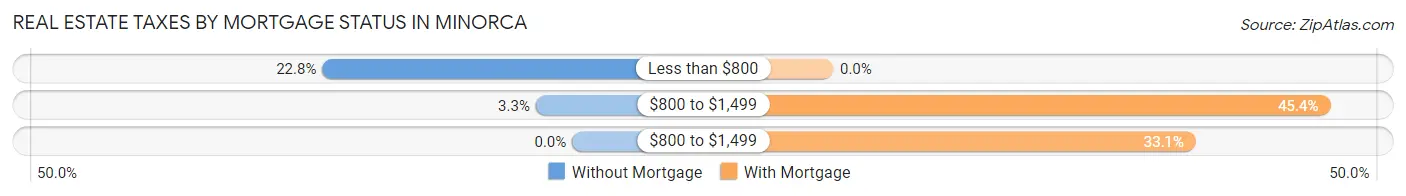
| Property Taxes | Without Mortgage | With Mortgage |
| Less than $800 | 55 (22.8%) | 0 (0.0%) |
| $800 to $1,499 | 8 (3.3%) | 74 (45.4%) |
| $800 to $1,499 | 0 (0.0%) | 54 (33.1%) |
| Total | 241 (100.0%) | 163 (100.0%) |
Health & Disability in Minorca
Health Insurance Coverage by Age in Minorca
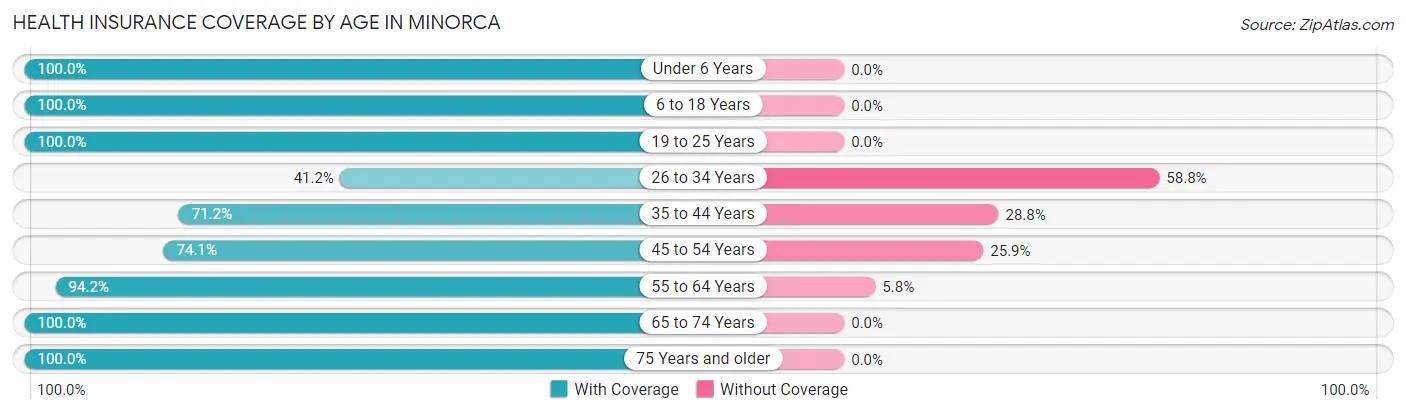
| Age Bracket | With Coverage | Without Coverage |
| Under 6 Years | 58 (100.0%) | 0 (0.0%) |
| 6 to 18 Years | 299 (100.0%) | 0 (0.0%) |
| 19 to 25 Years | 96 (100.0%) | 0 (0.0%) |
| 26 to 34 Years | 40 (41.2%) | 57 (58.8%) |
| 35 to 44 Years | 161 (71.2%) | 65 (28.8%) |
| 45 to 54 Years | 100 (74.1%) | 35 (25.9%) |
| 55 to 64 Years | 211 (94.2%) | 13 (5.8%) |
| 65 to 74 Years | 157 (100.0%) | 0 (0.0%) |
| 75 Years and older | 106 (100.0%) | 0 (0.0%) |
| Total | 1,228 (87.8%) | 170 (12.2%) |
Health Insurance Coverage by Citizenship Status in Minorca
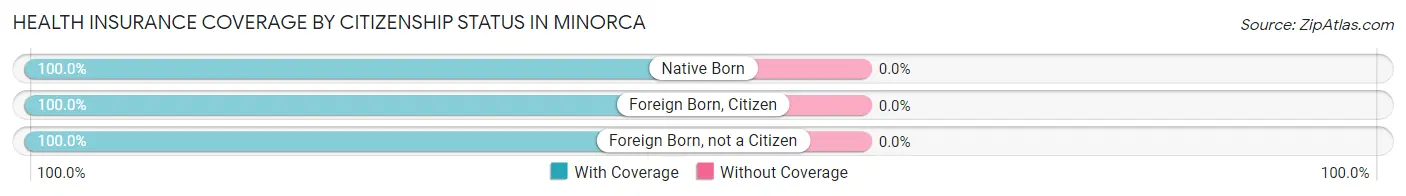
| Citizenship Status | With Coverage | Without Coverage |
| Native Born | 58 (100.0%) | 0 (0.0%) |
| Foreign Born, Citizen | 299 (100.0%) | 0 (0.0%) |
| Foreign Born, not a Citizen | 96 (100.0%) | 0 (0.0%) |
Health Insurance Coverage by Household Income in Minorca
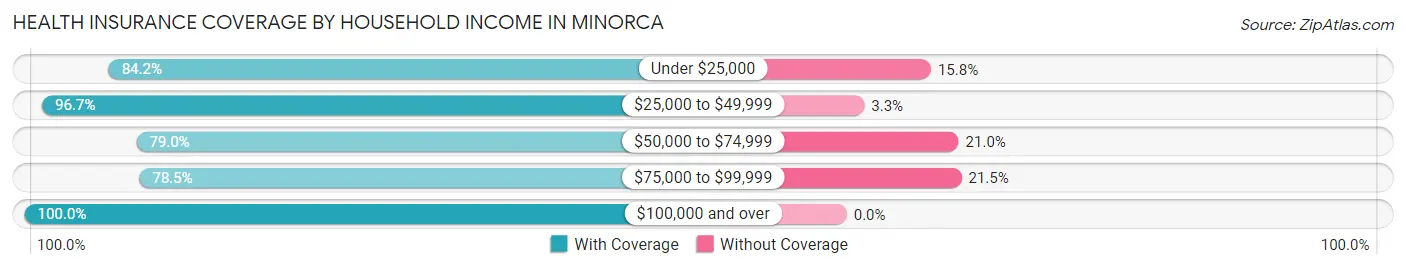
| Household Income | With Coverage | Without Coverage |
| Under $25,000 | 406 (84.2%) | 76 (15.8%) |
| $25,000 to $49,999 | 412 (96.7%) | 14 (3.3%) |
| $50,000 to $74,999 | 215 (79.0%) | 57 (21.0%) |
| $75,000 to $99,999 | 84 (78.5%) | 23 (21.5%) |
| $100,000 and over | 111 (100.0%) | 0 (0.0%) |
Public vs Private Health Insurance Coverage by Age in Minorca
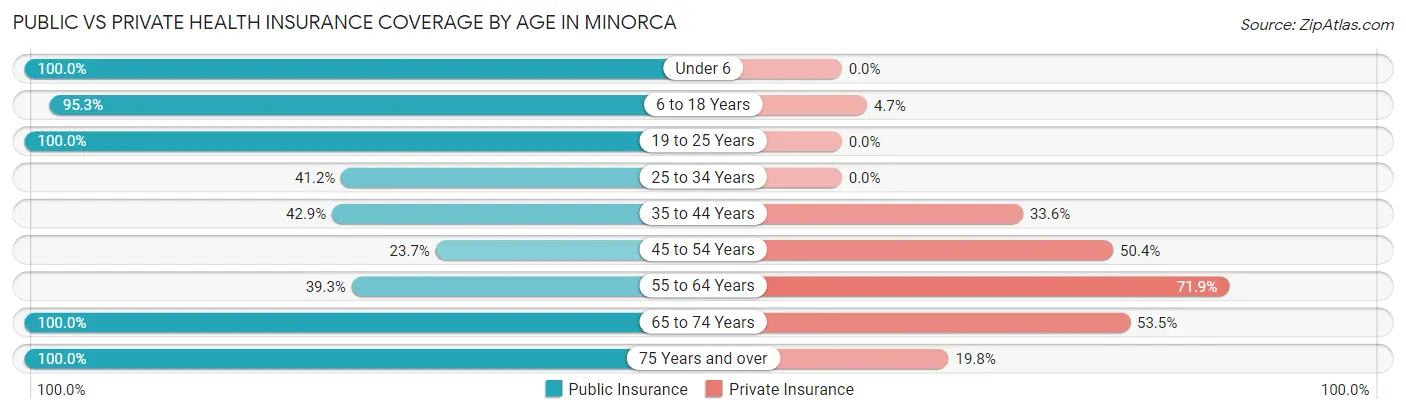
| Age Bracket | Public Insurance | Private Insurance |
| Under 6 | 58 (100.0%) | 0 (0.0%) |
| 6 to 18 Years | 285 (95.3%) | 14 (4.7%) |
| 19 to 25 Years | 96 (100.0%) | 0 (0.0%) |
| 25 to 34 Years | 40 (41.2%) | 0 (0.0%) |
| 35 to 44 Years | 97 (42.9%) | 76 (33.6%) |
| 45 to 54 Years | 32 (23.7%) | 68 (50.4%) |
| 55 to 64 Years | 88 (39.3%) | 161 (71.9%) |
| 65 to 74 Years | 157 (100.0%) | 84 (53.5%) |
| 75 Years and over | 106 (100.0%) | 21 (19.8%) |
| Total | 959 (68.6%) | 424 (30.3%) |
Disability Status by Sex by Age in Minorca
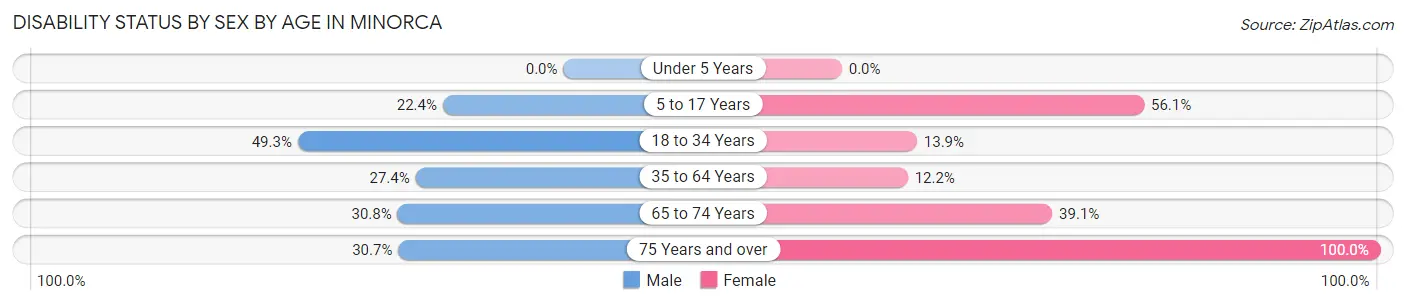
| Age Bracket | Male | Female |
| Under 5 Years | 0 (0.0%) | 0 (0.0%) |
| 5 to 17 Years | 62 (22.4%) | 23 (56.1%) |
| 18 to 34 Years | 35 (49.3%) | 17 (13.9%) |
| 35 to 64 Years | 73 (27.4%) | 39 (12.2%) |
| 65 to 74 Years | 16 (30.8%) | 41 (39.1%) |
| 75 Years and over | 19 (30.6%) | 44 (100.0%) |
Disability Class by Sex by Age in Minorca
Disability Class: Hearing Difficulty
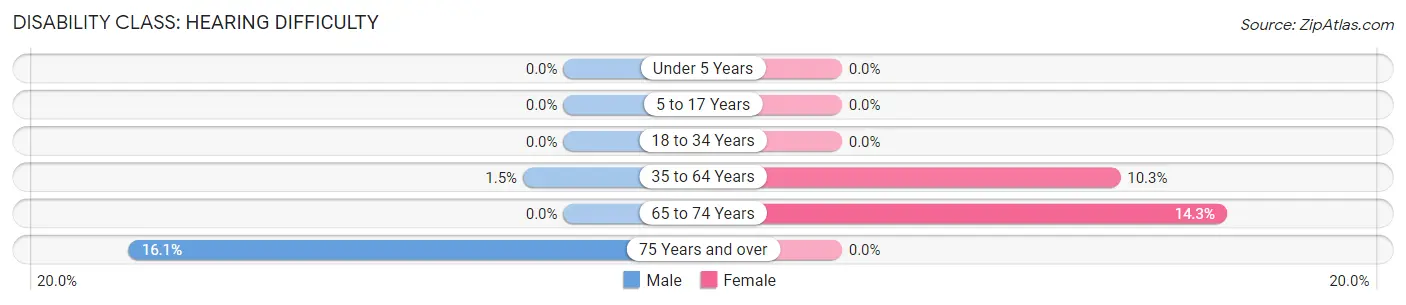
| Age Bracket | Male | Female |
| Under 5 Years | 0 (0.0%) | 0 (0.0%) |
| 5 to 17 Years | 0 (0.0%) | 0 (0.0%) |
| 18 to 34 Years | 0 (0.0%) | 0 (0.0%) |
| 35 to 64 Years | 4 (1.5%) | 33 (10.3%) |
| 65 to 74 Years | 0 (0.0%) | 15 (14.3%) |
| 75 Years and over | 10 (16.1%) | 0 (0.0%) |
Disability Class: Vision Difficulty
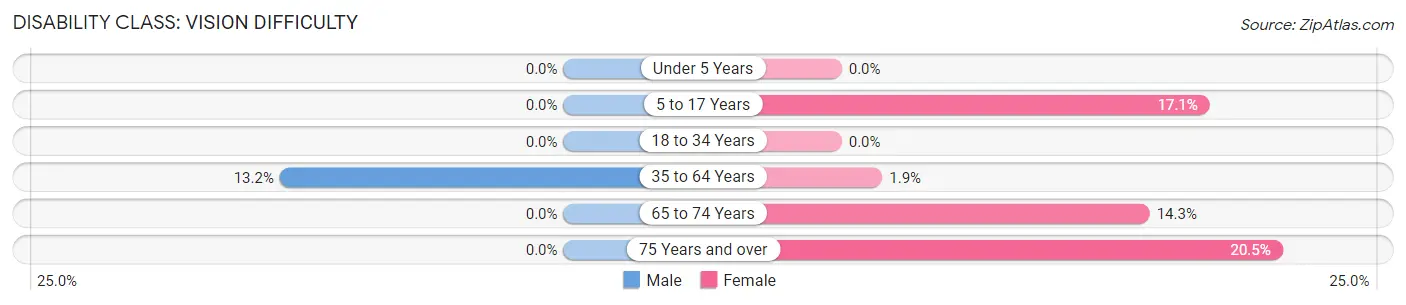
| Age Bracket | Male | Female |
| Under 5 Years | 0 (0.0%) | 0 (0.0%) |
| 5 to 17 Years | 0 (0.0%) | 7 (17.1%) |
| 18 to 34 Years | 0 (0.0%) | 0 (0.0%) |
| 35 to 64 Years | 35 (13.2%) | 6 (1.9%) |
| 65 to 74 Years | 0 (0.0%) | 15 (14.3%) |
| 75 Years and over | 0 (0.0%) | 9 (20.4%) |
Disability Class: Cognitive Difficulty
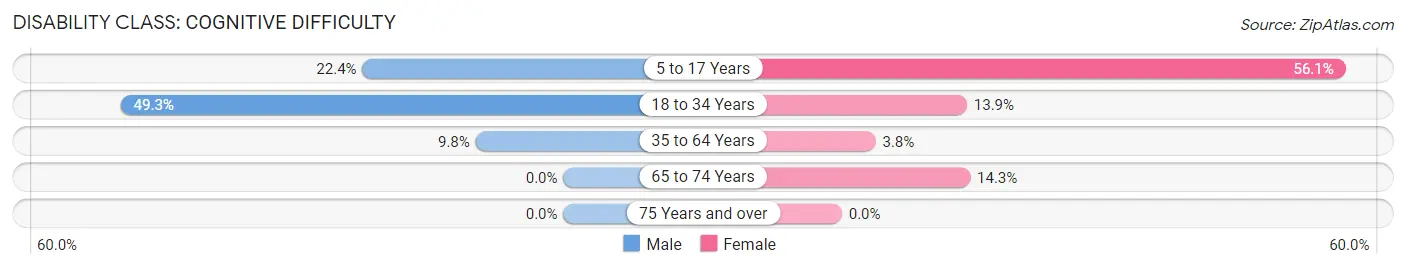
| Age Bracket | Male | Female |
| 5 to 17 Years | 62 (22.4%) | 23 (56.1%) |
| 18 to 34 Years | 35 (49.3%) | 17 (13.9%) |
| 35 to 64 Years | 26 (9.8%) | 12 (3.8%) |
| 65 to 74 Years | 0 (0.0%) | 15 (14.3%) |
| 75 Years and over | 0 (0.0%) | 0 (0.0%) |
Disability Class: Ambulatory Difficulty
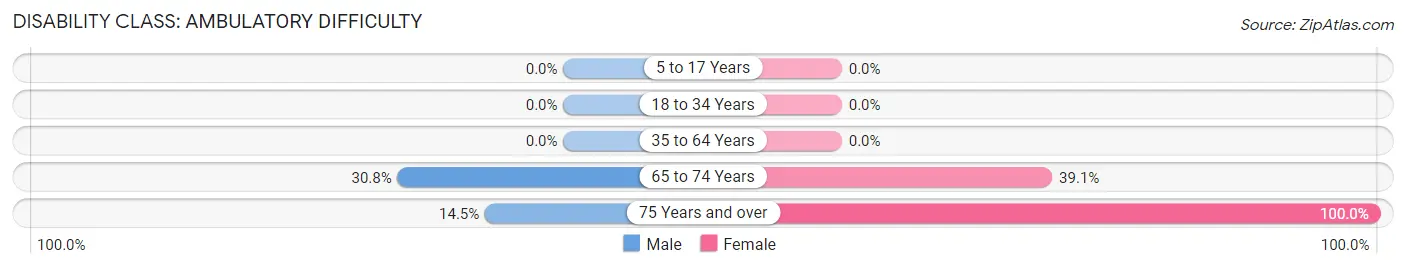
| Age Bracket | Male | Female |
| 5 to 17 Years | 0 (0.0%) | 0 (0.0%) |
| 18 to 34 Years | 0 (0.0%) | 0 (0.0%) |
| 35 to 64 Years | 0 (0.0%) | 0 (0.0%) |
| 65 to 74 Years | 16 (30.8%) | 41 (39.1%) |
| 75 Years and over | 9 (14.5%) | 44 (100.0%) |
Disability Class: Self-Care Difficulty
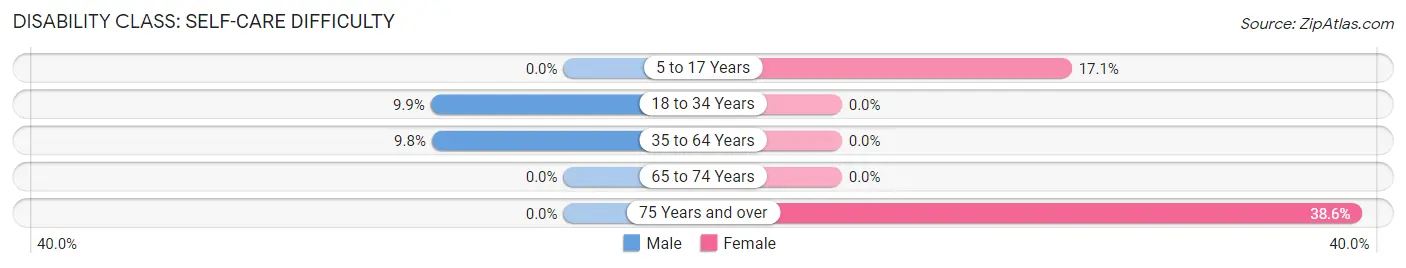
| Age Bracket | Male | Female |
| 5 to 17 Years | 0 (0.0%) | 7 (17.1%) |
| 18 to 34 Years | 7 (9.9%) | 0 (0.0%) |
| 35 to 64 Years | 26 (9.8%) | 0 (0.0%) |
| 65 to 74 Years | 0 (0.0%) | 0 (0.0%) |
| 75 Years and over | 0 (0.0%) | 17 (38.6%) |
Technology Access in Minorca
Computing Device Access in Minorca
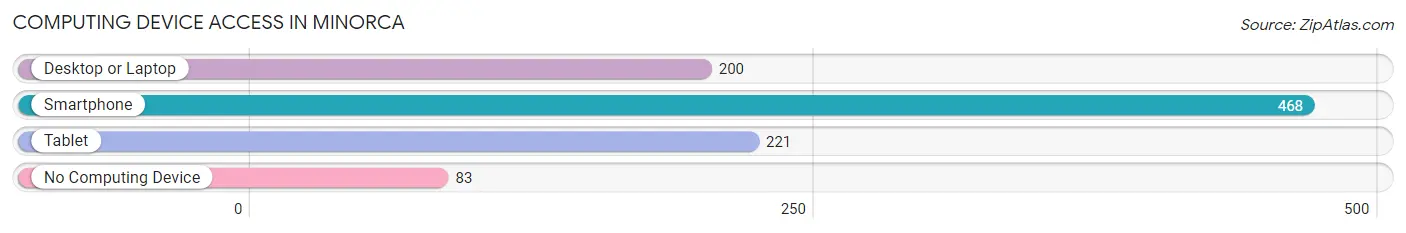
| Device Type | # Households | % Households |
| Desktop or Laptop | 200 | 35.1% |
| Smartphone | 468 | 82.1% |
| Tablet | 221 | 38.8% |
| No Computing Device | 83 | 14.6% |
| Total | 570 | 100.0% |
Internet Access in Minorca
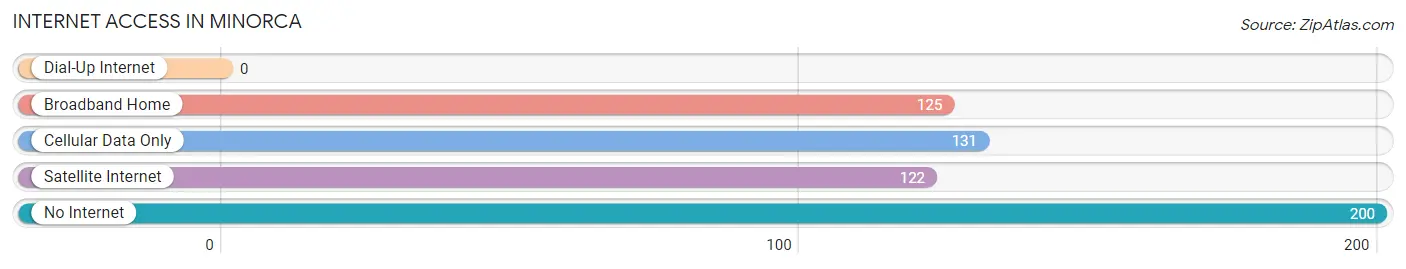
| Internet Type | # Households | % Households |
| Dial-Up Internet | 0 | 0.0% |
| Broadband Home | 125 | 21.9% |
| Cellular Data Only | 131 | 23.0% |
| Satellite Internet | 122 | 21.4% |
| No Internet | 200 | 35.1% |
| Total | 570 | 100.0% |
Minorca Summary
History
Minorca is a small unincorporated community located in the parish of St. James, Louisiana. It is situated on the banks of the Mississippi River, approximately 25 miles south of New Orleans. The area was first settled in the early 1800s by French and Spanish settlers, who named the area Minorca after the Spanish island of the same name. The area was primarily used for farming and fishing, and the population remained small until the early 1900s when the area began to experience a population boom.
The population of Minorca grew rapidly in the early 1900s due to the construction of the Mississippi River levee system. This allowed for the development of the area as a port town, and the population grew to over 1,000 by the 1920s. The town was incorporated in 1925, and the population continued to grow until the 1950s when the population began to decline.
Geography
Minorca is located in the parish of St. James, Louisiana, approximately 25 miles south of New Orleans. The town is situated on the banks of the Mississippi River, and is surrounded by marshland and swampland. The area is known for its lush vegetation and wildlife, and is home to a variety of birds, fish, and other animals. The town is also home to a number of historic sites, including the Minorca Plantation House, which was built in the early 1800s.
Economy
The economy of Minorca is largely based on agriculture and fishing. The area is known for its production of sugar cane, rice, and other crops, and the town is home to a number of small farms. Fishing is also an important part of the local economy, and the town is home to a number of seafood processing plants. In addition, the town is home to a number of small businesses, including restaurants, shops, and other services.
Demographics
As of the 2010 census, the population of Minorca was 1,093. The population is primarily African American, with a small percentage of White and Hispanic residents. The median household income is $31,250, and the median age is 37. The town is served by the St. James Parish School District, and is home to a number of churches.
Conclusion
Minorca is a small unincorporated community located in the parish of St. James, Louisiana. The area was first settled in the early 1800s by French and Spanish settlers, and the population grew rapidly in the early 1900s due to the construction of the Mississippi River levee system. The economy of Minorca is largely based on agriculture and fishing, and the population is primarily African American. The town is home to a number of historic sites, and is served by the St. James Parish School District.
Common Questions
What is Per Capita Income in Minorca?
Per Capita income in Minorca is $19,919.
What is the Median Family Income in Minorca?
Median Family Income in Minorca is $49,261.
What is the Median Household income in Minorca?
Median Household Income in Minorca is $43,438.
What is Income or Wage Gap in Minorca?
Income or Wage Gap in Minorca is 28.2%.
Women in Minorca earn 71.8 cents for every dollar earned by a man.
What is Inequality or Gini Index in Minorca?
Inequality or Gini Index in Minorca is 0.43.
What is the Total Population of Minorca?
Total Population of Minorca is 1,398.
What is the Total Male Population of Minorca?
Total Male Population of Minorca is 757.
What is the Total Female Population of Minorca?
Total Female Population of Minorca is 641.
What is the Ratio of Males per 100 Females in Minorca?
There are 118.10 Males per 100 Females in Minorca.
What is the Ratio of Females per 100 Males in Minorca?
There are 84.68 Females per 100 Males in Minorca.
What is the Median Population Age in Minorca?
Median Population Age in Minorca is 40.5 Years.
What is the Average Family Size in Minorca
Average Family Size in Minorca is 2.8 People.
What is the Average Household Size in Minorca
Average Household Size in Minorca is 2.5 People.
How Large is the Labor Force in Minorca?
There are 554 People in the Labor Forcein in Minorca.
What is the Percentage of People in the Labor Force in Minorca?
48.9% of People are in the Labor Force in Minorca.
What is the Unemployment Rate in Minorca?
Unemployment Rate in Minorca is 8.9%.