Plaquemine, LA Map & Demographics
Plaquemine Map
Plaquemine Overview
$31,192
PER CAPITA INCOME
$88,388
AVG FAMILY INCOME
$69,183
AVG HOUSEHOLD INCOME
8.4%
WAGE / INCOME GAP [ % ]
91.6¢/ $1
WAGE / INCOME GAP [ $ ]
0.44
INEQUALITY / GINI INDEX
6,218
TOTAL POPULATION
3,003
MALE POPULATION
3,215
FEMALE POPULATION
93.41
MALES / 100 FEMALES
107.06
FEMALES / 100 MALES
43.4
MEDIAN AGE
3.2
AVG FAMILY SIZE
2.4
AVG HOUSEHOLD SIZE
2,865
LABOR FORCE [ PEOPLE ]
61.0%
PERCENT IN LABOR FORCE
6.2%
UNEMPLOYMENT RATE
Plaquemine Zip Codes
Plaquemine Area Codes
Income in Plaquemine
Income Overview in Plaquemine
Per Capita Income in Plaquemine is $31,192, while median incomes of families and households are $88,388 and $69,183 respectively.
| Characteristic | Number | Measure |
| Per Capita Income | 6,218 | $31,192 |
| Median Family Income | 1,569 | $88,388 |
| Mean Family Income | 1,569 | $98,809 |
| Median Household Income | 2,538 | $69,183 |
| Mean Household Income | 2,538 | $79,542 |
| Income Deficit | 1,569 | $0 |
| Wage / Income Gap (%) | 6,218 | 8.37% |
| Wage / Income Gap ($) | 6,218 | 91.63¢ per $1 |
| Gini / Inequality Index | 6,218 | 0.44 |
Earnings by Sex in Plaquemine
Average Earnings in Plaquemine are $41,641, $42,394 for men and $38,846 for women, a difference of 8.4%.
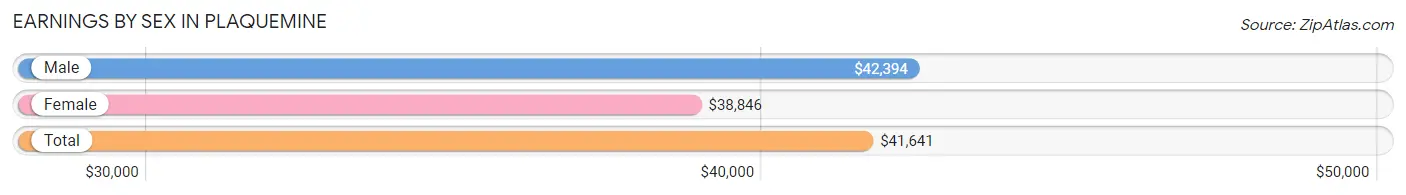
| Sex | Number | Average Earnings |
| Male | 1,425 (49.5%) | $42,394 |
| Female | 1,452 (50.5%) | $38,846 |
| Total | 2,877 (100.0%) | $41,641 |
Earnings by Sex by Income Bracket in Plaquemine
The most common earnings brackets in Plaquemine are $100,000+ for men (328 | 23.0%) and $75,000 to $99,999 for women (315 | 21.7%).
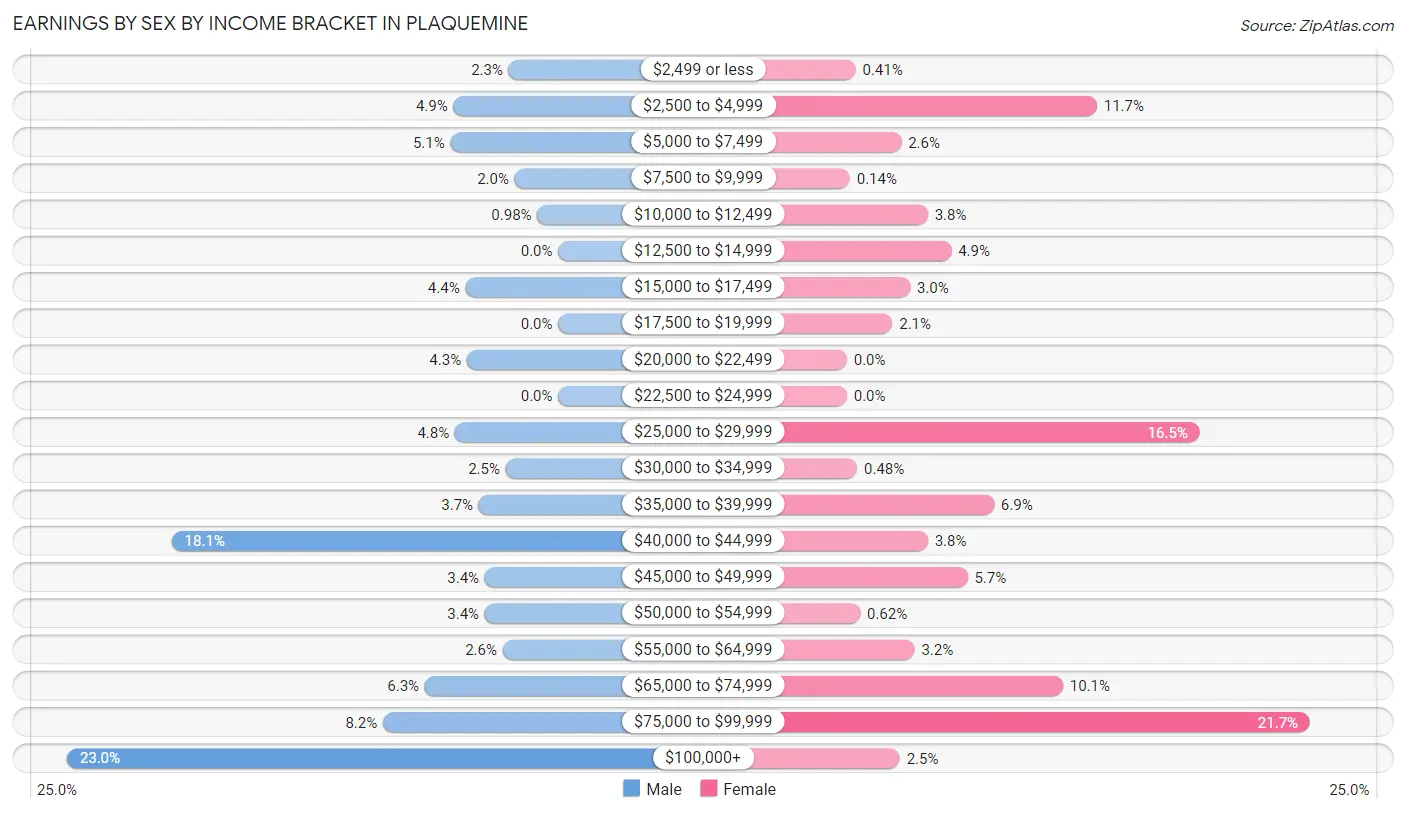
| Income | Male | Female |
| $2,499 or less | 33 (2.3%) | 6 (0.4%) |
| $2,500 to $4,999 | 70 (4.9%) | 170 (11.7%) |
| $5,000 to $7,499 | 72 (5.1%) | 37 (2.5%) |
| $7,500 to $9,999 | 29 (2.0%) | 2 (0.1%) |
| $10,000 to $12,499 | 14 (1.0%) | 55 (3.8%) |
| $12,500 to $14,999 | 0 (0.0%) | 71 (4.9%) |
| $15,000 to $17,499 | 62 (4.3%) | 43 (3.0%) |
| $17,500 to $19,999 | 0 (0.0%) | 31 (2.1%) |
| $20,000 to $22,499 | 61 (4.3%) | 0 (0.0%) |
| $22,500 to $24,999 | 0 (0.0%) | 0 (0.0%) |
| $25,000 to $29,999 | 69 (4.8%) | 240 (16.5%) |
| $30,000 to $34,999 | 35 (2.5%) | 7 (0.5%) |
| $35,000 to $39,999 | 53 (3.7%) | 100 (6.9%) |
| $40,000 to $44,999 | 258 (18.1%) | 55 (3.8%) |
| $45,000 to $49,999 | 49 (3.4%) | 82 (5.7%) |
| $50,000 to $54,999 | 49 (3.4%) | 9 (0.6%) |
| $55,000 to $64,999 | 37 (2.6%) | 46 (3.2%) |
| $65,000 to $74,999 | 89 (6.2%) | 147 (10.1%) |
| $75,000 to $99,999 | 117 (8.2%) | 315 (21.7%) |
| $100,000+ | 328 (23.0%) | 36 (2.5%) |
| Total | 1,425 (100.0%) | 1,452 (100.0%) |
Earnings by Sex by Educational Attainment in Plaquemine
Average earnings in Plaquemine are $42,610 for men and $40,885 for women, a difference of 4.1%. Men with an educational attainment of graduate degree enjoy the highest average annual earnings of $185,230, while those with high school diploma education earn the least with $27,099. Women with an educational attainment of graduate degree earn the most with the average annual earnings of $70,392, while those with bachelor's degree education have the smallest earnings of $46,538.
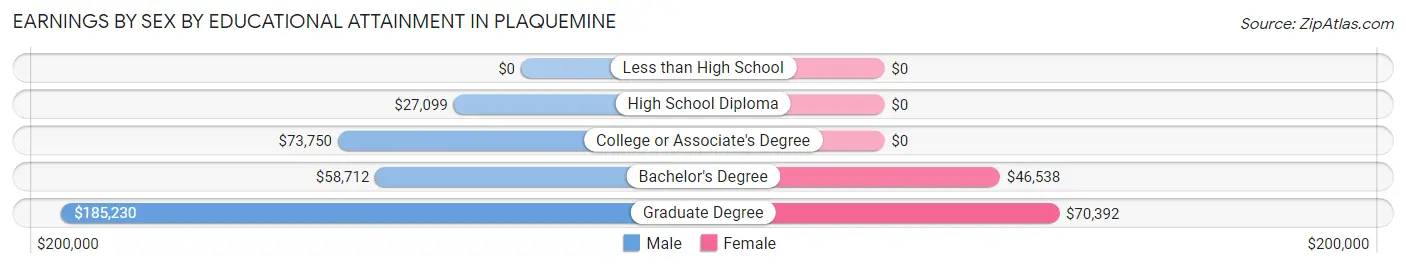
| Educational Attainment | Male Income | Female Income |
| Less than High School | - | - |
| High School Diploma | $27,099 | $0 |
| College or Associate's Degree | $73,750 | $0 |
| Bachelor's Degree | $58,712 | $46,538 |
| Graduate Degree | $185,230 | $70,392 |
| Total | $42,610 | $40,885 |
Family Income in Plaquemine
Family Income Brackets in Plaquemine
According to the Plaquemine family income data, there are 391 families falling into the $100,000 to $149,999 income range, which is the most common income bracket and makes up 24.9% of all families.
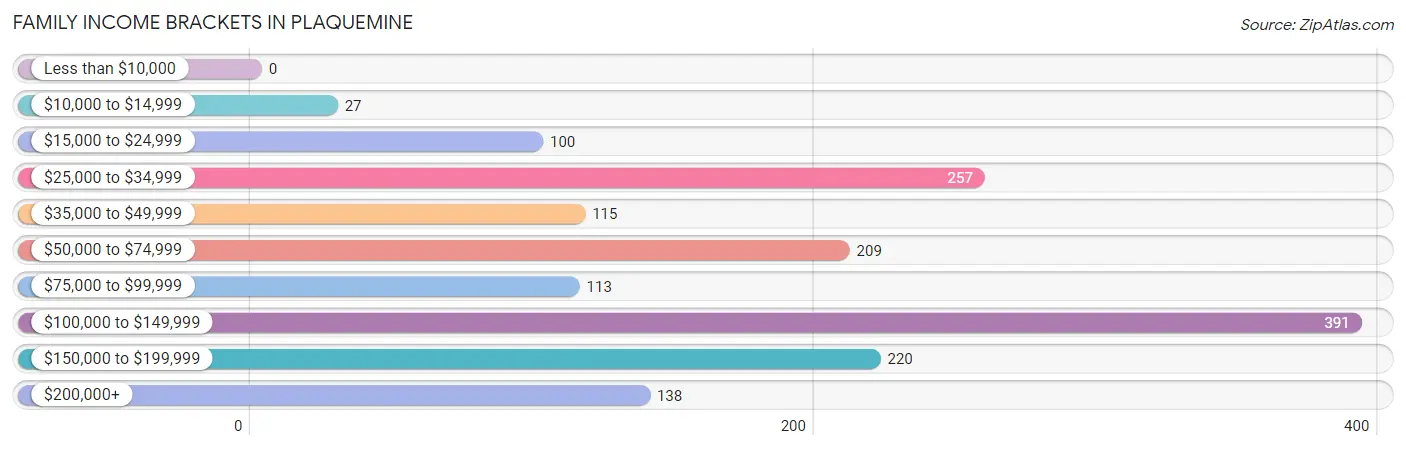
| Income Bracket | # Families | % Families |
| Less than $10,000 | 0 | 0.0% |
| $10,000 to $14,999 | 27 | 1.7% |
| $15,000 to $24,999 | 100 | 6.4% |
| $25,000 to $34,999 | 257 | 16.4% |
| $35,000 to $49,999 | 115 | 7.3% |
| $50,000 to $74,999 | 209 | 13.3% |
| $75,000 to $99,999 | 113 | 7.2% |
| $100,000 to $149,999 | 391 | 24.9% |
| $150,000 to $199,999 | 220 | 14.0% |
| $200,000+ | 138 | 8.8% |
Family Income by Famaliy Size in Plaquemine
5-person families (89 | 5.7%) account for the highest median family income in Plaquemine with $110,275 per family, while 2-person families (677 | 43.1%) have the highest median income of $50,966 per family member.
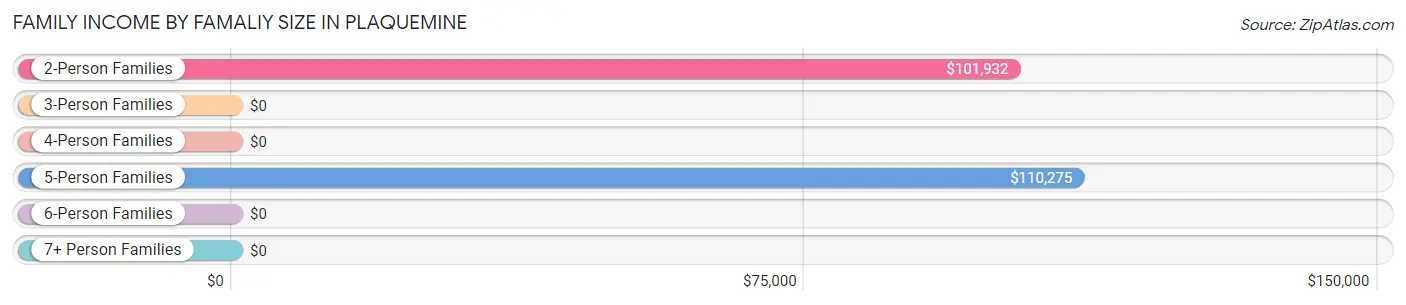
| Income Bracket | # Families | Median Income |
| 2-Person Families | 677 (43.1%) | $101,932 |
| 3-Person Families | 399 (25.4%) | $0 |
| 4-Person Families | 306 (19.5%) | $0 |
| 5-Person Families | 89 (5.7%) | $110,275 |
| 6-Person Families | 78 (5.0%) | $0 |
| 7+ Person Families | 20 (1.3%) | $0 |
| Total | 1,569 (100.0%) | $88,388 |
Family Income by Number of Earners in Plaquemine
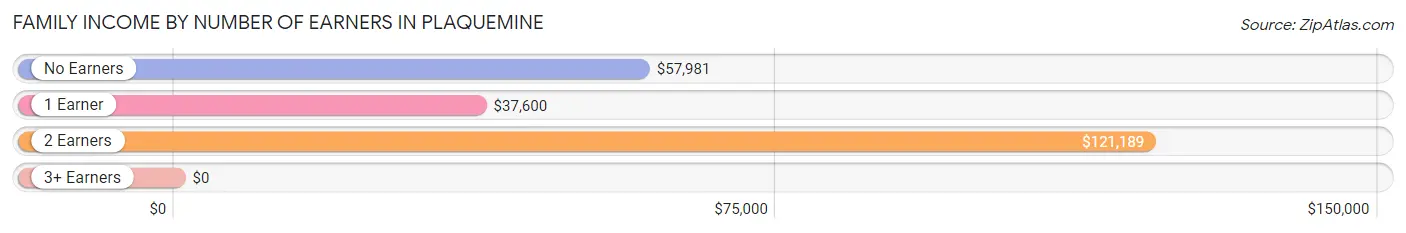
| Number of Earners | # Families | Median Income |
| No Earners | 205 (13.1%) | $57,981 |
| 1 Earner | 474 (30.2%) | $37,600 |
| 2 Earners | 804 (51.2%) | $121,189 |
| 3+ Earners | 86 (5.5%) | $0 |
| Total | 1,569 (100.0%) | $88,388 |
Household Income in Plaquemine
Household Income Brackets in Plaquemine
With 449 households falling in the category, the $100,000 to $149,999 income range is the most frequent in Plaquemine, accounting for 17.7% of all households. In contrast, only 137 households (5.4%) fall into the $200,000+ income bracket, making it the least populous group.
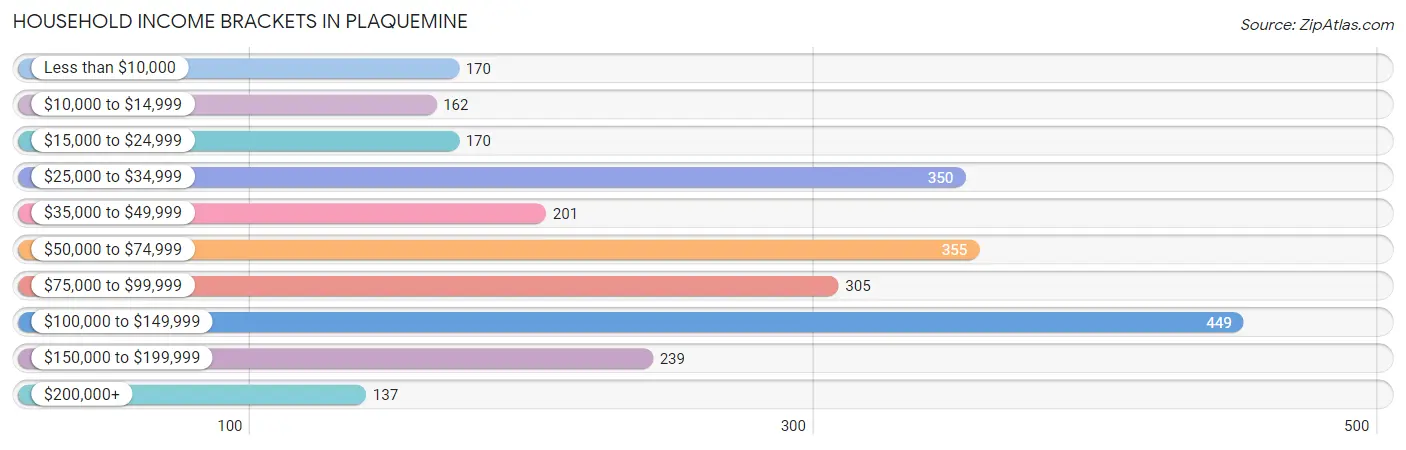
| Income Bracket | # Households | % Households |
| Less than $10,000 | 170 | 6.7% |
| $10,000 to $14,999 | 162 | 6.4% |
| $15,000 to $24,999 | 170 | 6.7% |
| $25,000 to $34,999 | 350 | 13.8% |
| $35,000 to $49,999 | 201 | 7.9% |
| $50,000 to $74,999 | 355 | 14.0% |
| $75,000 to $99,999 | 305 | 12.0% |
| $100,000 to $149,999 | 449 | 17.7% |
| $150,000 to $199,999 | 239 | 9.4% |
| $200,000+ | 137 | 5.4% |
Household Income by Householder Age in Plaquemine
The median household income in Plaquemine is $69,183, with the highest median household income of $106,765 found in the 25 to 44 years age bracket for the primary householder. A total of 674 households (26.6%) fall into this category. Meanwhile, the 15 to 24 years age bracket for the primary householder has the lowest median household income of $0, with 45 households (1.8%) in this group.
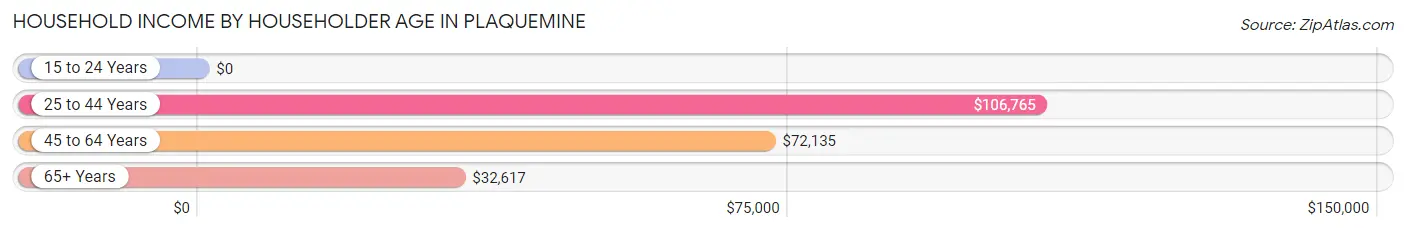
| Income Bracket | # Households | Median Income |
| 15 to 24 Years | 45 (1.8%) | $0 |
| 25 to 44 Years | 674 (26.6%) | $106,765 |
| 45 to 64 Years | 1,068 (42.1%) | $72,135 |
| 65+ Years | 751 (29.6%) | $32,617 |
| Total | 2,538 (100.0%) | $69,183 |
Poverty in Plaquemine
Income Below Poverty by Sex and Age in Plaquemine
With 11.7% poverty level for males and 17.2% for females among the residents of Plaquemine, 18 to 24 year old males and 5 year old females are the most vulnerable to poverty, with 29 males (24.8%) and 8 females (100.0%) in their respective age groups living below the poverty level.
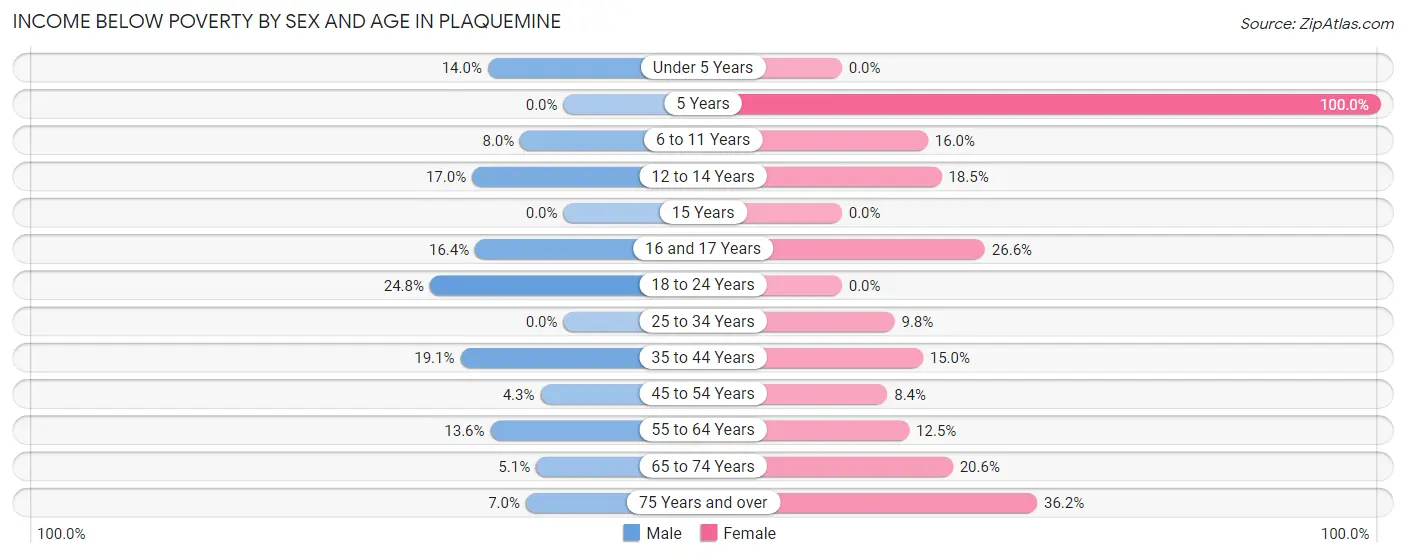
| Age Bracket | Male | Female |
| Under 5 Years | 50 (14.0%) | 0 (0.0%) |
| 5 Years | 0 (0.0%) | 8 (100.0%) |
| 6 to 11 Years | 15 (8.0%) | 58 (16.0%) |
| 12 to 14 Years | 39 (17.0%) | 42 (18.5%) |
| 15 Years | 0 (0.0%) | 0 (0.0%) |
| 16 and 17 Years | 20 (16.4%) | 34 (26.6%) |
| 18 to 24 Years | 29 (24.8%) | 0 (0.0%) |
| 25 to 34 Years | 0 (0.0%) | 14 (9.8%) |
| 35 to 44 Years | 100 (19.1%) | 78 (15.0%) |
| 45 to 54 Years | 13 (4.3%) | 41 (8.4%) |
| 55 to 64 Years | 58 (13.6%) | 53 (12.5%) |
| 65 to 74 Years | 10 (5.1%) | 63 (20.6%) |
| 75 Years and over | 14 (7.0%) | 154 (36.2%) |
| Total | 348 (11.7%) | 545 (17.2%) |
Income Above Poverty by Sex and Age in Plaquemine
According to the poverty statistics in Plaquemine, males aged 5 years and females aged under 5 years are the age groups that are most secure financially, with 100.0% of males and 100.0% of females in these age groups living above the poverty line.
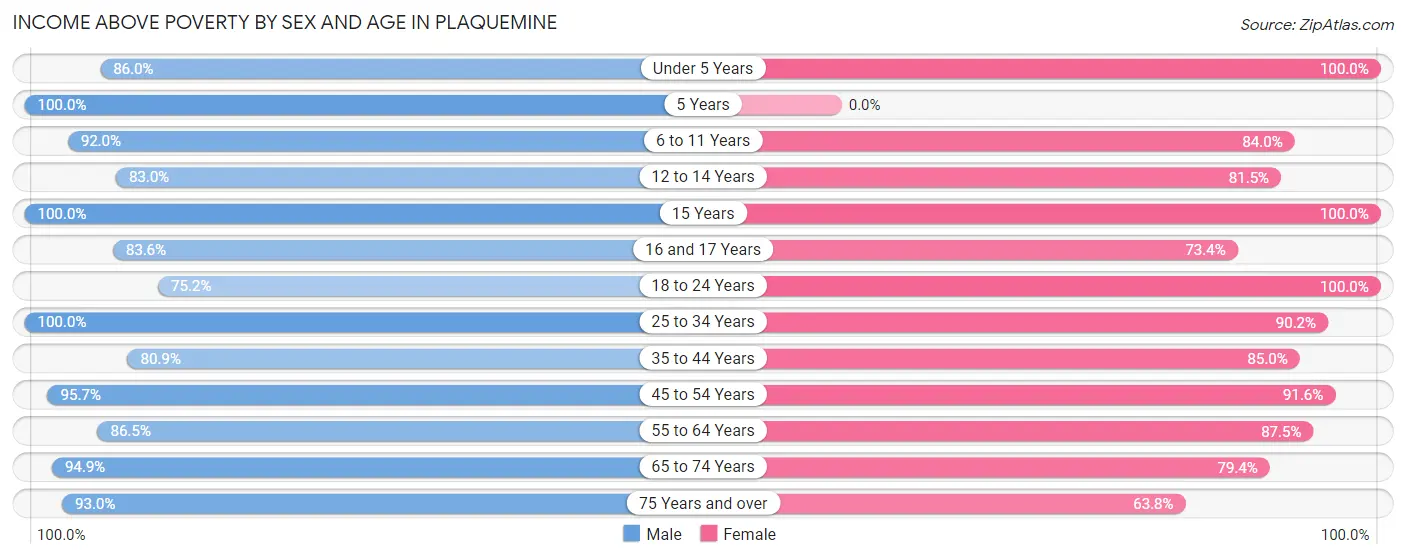
| Age Bracket | Male | Female |
| Under 5 Years | 306 (86.0%) | 21 (100.0%) |
| 5 Years | 19 (100.0%) | 0 (0.0%) |
| 6 to 11 Years | 172 (92.0%) | 305 (84.0%) |
| 12 to 14 Years | 191 (83.0%) | 185 (81.5%) |
| 15 Years | 92 (100.0%) | 19 (100.0%) |
| 16 and 17 Years | 102 (83.6%) | 94 (73.4%) |
| 18 to 24 Years | 88 (75.2%) | 104 (100.0%) |
| 25 to 34 Years | 190 (100.0%) | 129 (90.2%) |
| 35 to 44 Years | 423 (80.9%) | 441 (85.0%) |
| 45 to 54 Years | 291 (95.7%) | 445 (91.6%) |
| 55 to 64 Years | 370 (86.5%) | 371 (87.5%) |
| 65 to 74 Years | 187 (94.9%) | 243 (79.4%) |
| 75 Years and over | 187 (93.0%) | 271 (63.8%) |
| Total | 2,618 (88.3%) | 2,628 (82.8%) |
Income Below Poverty Among Married-Couple Families in Plaquemine
The poverty statistics for married-couple families in Plaquemine show that 4.1% or 48 of the total 1,179 families live below the poverty line. Families with 1 or 2 children have the highest poverty rate of 8.1%, comprising of 38 families. On the other hand, families with 3 or 4 children have the lowest poverty rate of 0.0%, which includes 0 families.
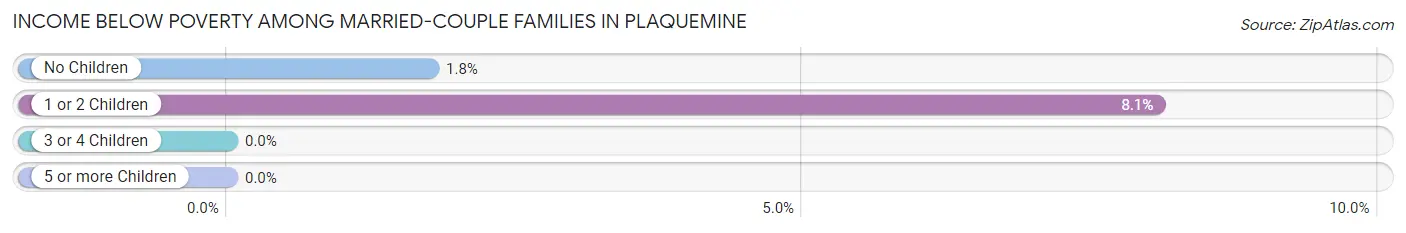
| Children | Above Poverty | Below Poverty |
| No Children | 560 (98.3%) | 10 (1.8%) |
| 1 or 2 Children | 433 (91.9%) | 38 (8.1%) |
| 3 or 4 Children | 138 (100.0%) | 0 (0.0%) |
| 5 or more Children | 0 (0.0%) | 0 (0.0%) |
| Total | 1,131 (95.9%) | 48 (4.1%) |
Income Below Poverty Among Single-Parent Households in Plaquemine
According to the poverty data in Plaquemine, 33.6% or 39 single-father households and 26.6% or 73 single-mother households are living below the poverty line. Among single-father households, those with no children have the highest poverty rate, with 39 households (100.0%) experiencing poverty. Likewise, among single-mother households, those with 5 or more children have the highest poverty rate, with 8 households (100.0%) falling below the poverty line.
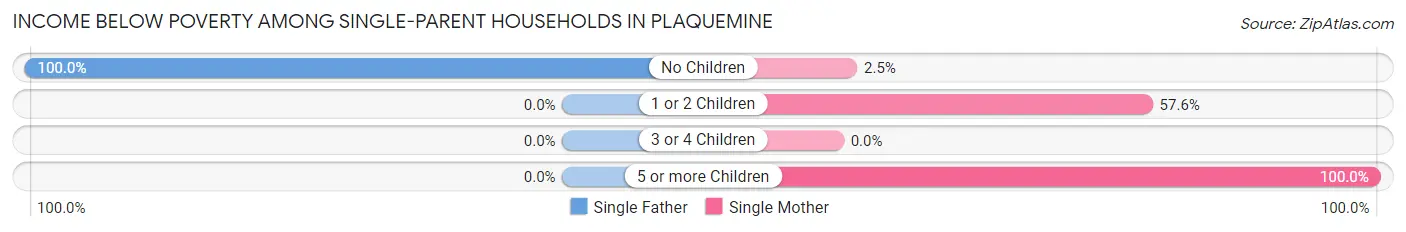
| Children | Single Father | Single Mother |
| No Children | 39 (100.0%) | 4 (2.5%) |
| 1 or 2 Children | 0 (0.0%) | 61 (57.6%) |
| 3 or 4 Children | 0 (0.0%) | 0 (0.0%) |
| 5 or more Children | 0 (0.0%) | 8 (100.0%) |
| Total | 39 (33.6%) | 73 (26.6%) |
Income Below Poverty Among Married-Couple vs Single-Parent Households in Plaquemine
The poverty data for Plaquemine shows that 48 of the married-couple family households (4.1%) and 112 of the single-parent households (28.7%) are living below the poverty level. Within the married-couple family households, those with 1 or 2 children have the highest poverty rate, with 38 households (8.1%) falling below the poverty line. Among the single-parent households, those with 5 or more children have the highest poverty rate, with 8 household (100.0%) living below poverty.
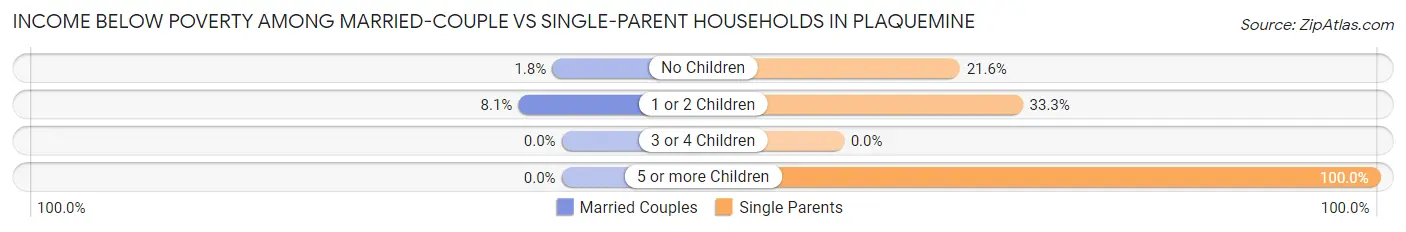
| Children | Married-Couple Families | Single-Parent Households |
| No Children | 10 (1.8%) | 43 (21.6%) |
| 1 or 2 Children | 38 (8.1%) | 61 (33.3%) |
| 3 or 4 Children | 0 (0.0%) | 0 (0.0%) |
| 5 or more Children | 0 (0.0%) | 8 (100.0%) |
| Total | 48 (4.1%) | 112 (28.7%) |
Race in Plaquemine
The most populous races in Plaquemine are Black / African American (3,180 | 51.1%), White / Caucasian (2,500 | 40.2%), and Two or more Races (349 | 5.6%).
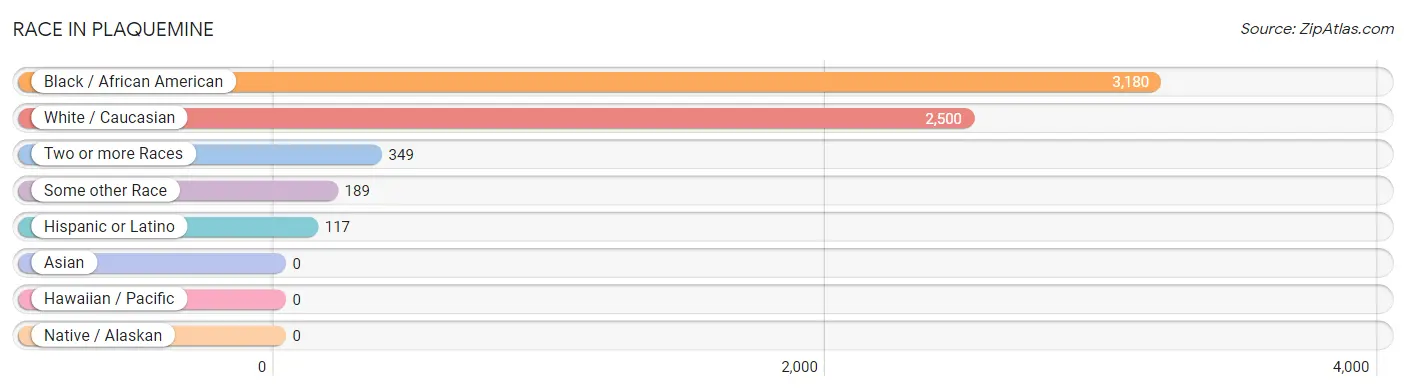
| Race | # Population | % Population |
| Asian | 0 | 0.0% |
| Black / African American | 3,180 | 51.1% |
| Hawaiian / Pacific | 0 | 0.0% |
| Hispanic or Latino | 117 | 1.9% |
| Native / Alaskan | 0 | 0.0% |
| White / Caucasian | 2,500 | 40.2% |
| Two or more Races | 349 | 5.6% |
| Some other Race | 189 | 3.0% |
| Total | 6,218 | 100.0% |
Ancestry in Plaquemine
The most populous ancestries reported in Plaquemine are French (1,015 | 16.3%), Irish (632 | 10.2%), German (514 | 8.3%), African (393 | 6.3%), and Subsaharan African (393 | 6.3%), together accounting for 47.4% of all Plaquemine residents.
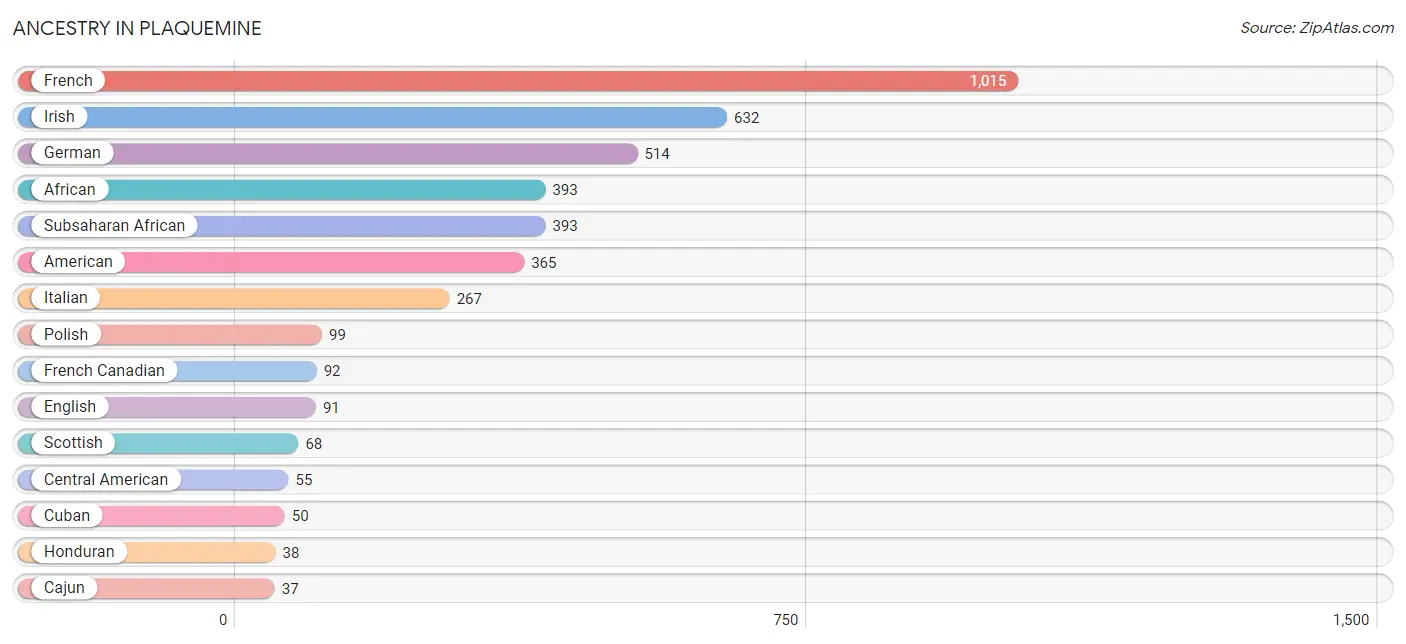
| Ancestry | # Population | % Population |
| African | 393 | 6.3% |
| American | 365 | 5.9% |
| Arab | 8 | 0.1% |
| British | 33 | 0.5% |
| Cajun | 37 | 0.6% |
| Central American | 55 | 0.9% |
| Cuban | 50 | 0.8% |
| English | 91 | 1.5% |
| European | 5 | 0.1% |
| French | 1,015 | 16.3% |
| French Canadian | 92 | 1.5% |
| German | 514 | 8.3% |
| Guatemalan | 17 | 0.3% |
| Honduran | 38 | 0.6% |
| Irish | 632 | 10.2% |
| Iroquois | 33 | 0.5% |
| Italian | 267 | 4.3% |
| Lebanese | 3 | 0.1% |
| Mexican | 8 | 0.1% |
| Polish | 99 | 1.6% |
| Scottish | 68 | 1.1% |
| Spanish | 1 | 0.0% |
| Subsaharan African | 393 | 6.3% | View All 23 Rows |
Immigrants in Plaquemine
The most numerous immigrant groups reported in Plaquemine came from Central America (81 | 1.3%), Latin America (81 | 1.3%), Honduras (63 | 1.0%), England (24 | 0.4%), and Europe (24 | 0.4%), together accounting for 4.4% of all Plaquemine residents.
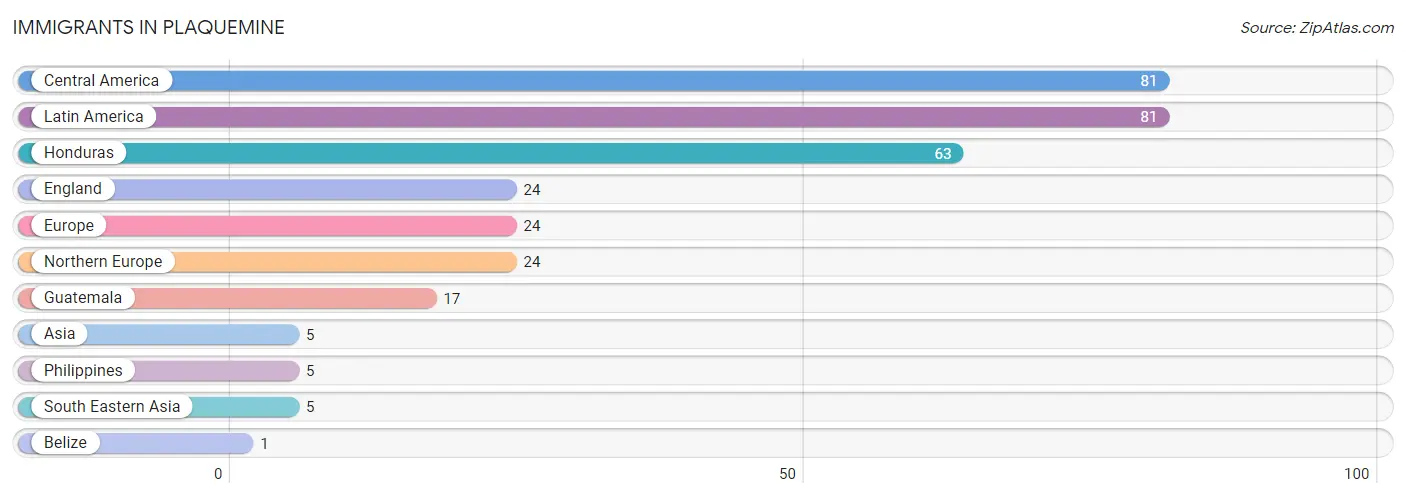
| Immigration Origin | # Population | % Population |
| Asia | 5 | 0.1% |
| Belize | 1 | 0.0% |
| Central America | 81 | 1.3% |
| England | 24 | 0.4% |
| Europe | 24 | 0.4% |
| Guatemala | 17 | 0.3% |
| Honduras | 63 | 1.0% |
| Latin America | 81 | 1.3% |
| Northern Europe | 24 | 0.4% |
| Philippines | 5 | 0.1% |
| South Eastern Asia | 5 | 0.1% | View All 11 Rows |
Sex and Age in Plaquemine
Sex and Age in Plaquemine
The most populous age groups in Plaquemine are Under 5 Years (356 | 11.8%) for men and 10 to 14 Years (320 | 10.0%) for women.
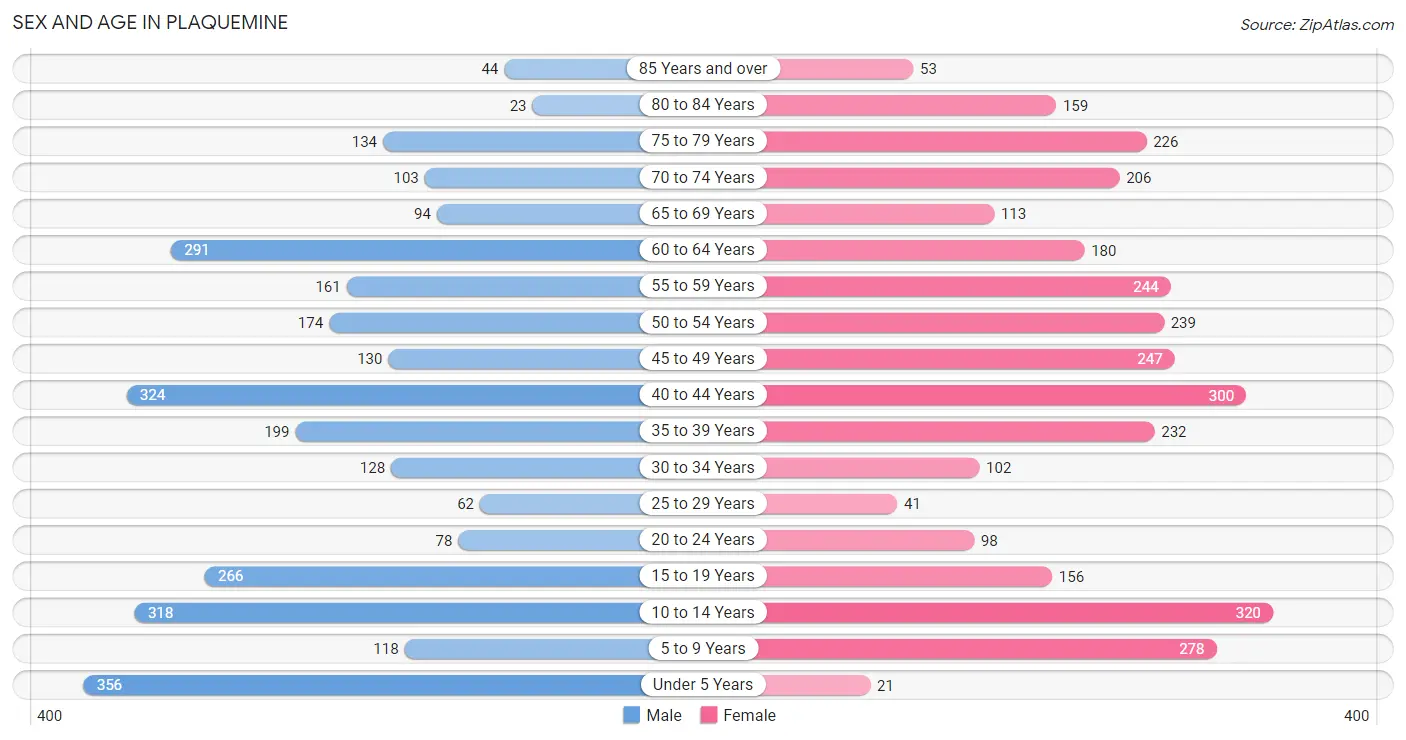
| Age Bracket | Male | Female |
| Under 5 Years | 356 (11.8%) | 21 (0.6%) |
| 5 to 9 Years | 118 (3.9%) | 278 (8.6%) |
| 10 to 14 Years | 318 (10.6%) | 320 (10.0%) |
| 15 to 19 Years | 266 (8.9%) | 156 (4.9%) |
| 20 to 24 Years | 78 (2.6%) | 98 (3.0%) |
| 25 to 29 Years | 62 (2.1%) | 41 (1.3%) |
| 30 to 34 Years | 128 (4.3%) | 102 (3.2%) |
| 35 to 39 Years | 199 (6.6%) | 232 (7.2%) |
| 40 to 44 Years | 324 (10.8%) | 300 (9.3%) |
| 45 to 49 Years | 130 (4.3%) | 247 (7.7%) |
| 50 to 54 Years | 174 (5.8%) | 239 (7.4%) |
| 55 to 59 Years | 161 (5.4%) | 244 (7.6%) |
| 60 to 64 Years | 291 (9.7%) | 180 (5.6%) |
| 65 to 69 Years | 94 (3.1%) | 113 (3.5%) |
| 70 to 74 Years | 103 (3.4%) | 206 (6.4%) |
| 75 to 79 Years | 134 (4.5%) | 226 (7.0%) |
| 80 to 84 Years | 23 (0.8%) | 159 (5.0%) |
| 85 Years and over | 44 (1.5%) | 53 (1.7%) |
| Total | 3,003 (100.0%) | 3,215 (100.0%) |
Families and Households in Plaquemine
Median Family Size in Plaquemine
The median family size in Plaquemine is 3.24 persons per family, with single female/mother families (274 | 17.5%) accounting for the largest median family size of 3.48 persons per family. On the other hand, single male/father families (116 | 7.4%) represent the smallest median family size with 2.93 persons per family.
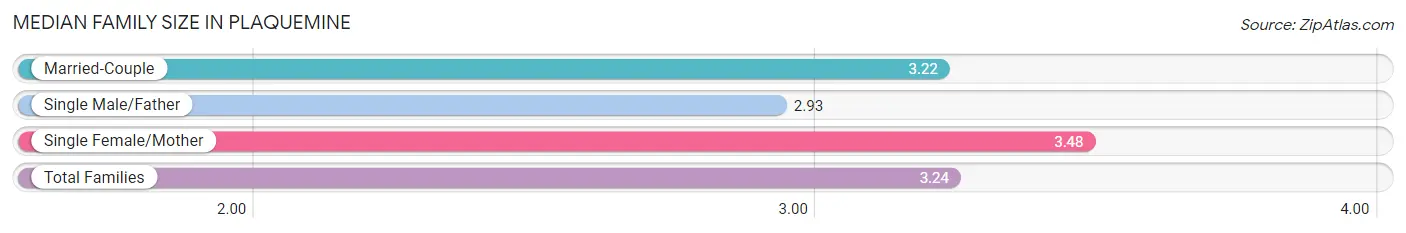
| Family Type | # Families | Family Size |
| Married-Couple | 1,179 (75.1%) | 3.22 |
| Single Male/Father | 116 (7.4%) | 2.93 |
| Single Female/Mother | 274 (17.5%) | 3.48 |
| Total Families | 1,569 (100.0%) | 3.24 |
Median Household Size in Plaquemine
The median household size in Plaquemine is 2.42 persons per household, with single female/mother households (274 | 10.8%) accounting for the largest median household size of 3.48 persons per household. non-family households (969 | 38.2%) represent the smallest median household size with 1.05 persons per household.
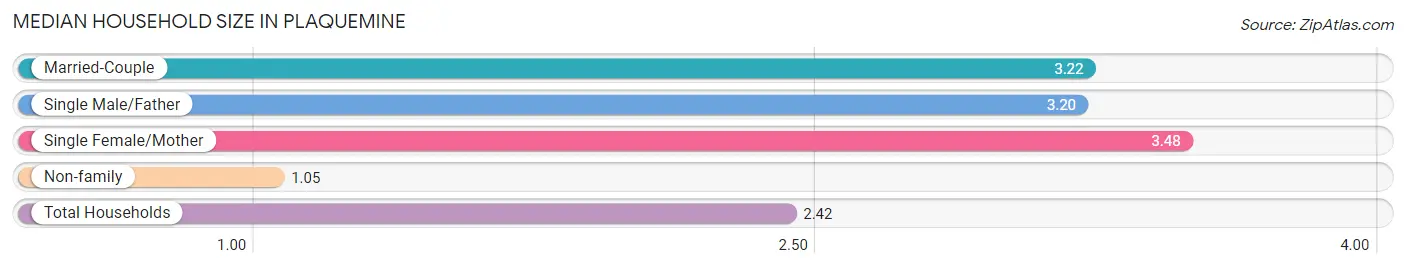
| Household Type | # Households | Household Size |
| Married-Couple | 1,179 (46.5%) | 3.22 |
| Single Male/Father | 116 (4.6%) | 3.20 |
| Single Female/Mother | 274 (10.8%) | 3.48 |
| Non-family | 969 (38.2%) | 1.05 |
| Total Households | 2,538 (100.0%) | 2.42 |
Household Size by Marriage Status in Plaquemine
Out of a total of 2,538 households in Plaquemine, 1,569 (61.8%) are family households, while 969 (38.2%) are nonfamily households. The most numerous type of family households are 2-person households, comprising 659, and the most common type of nonfamily households are 1-person households, comprising 899.
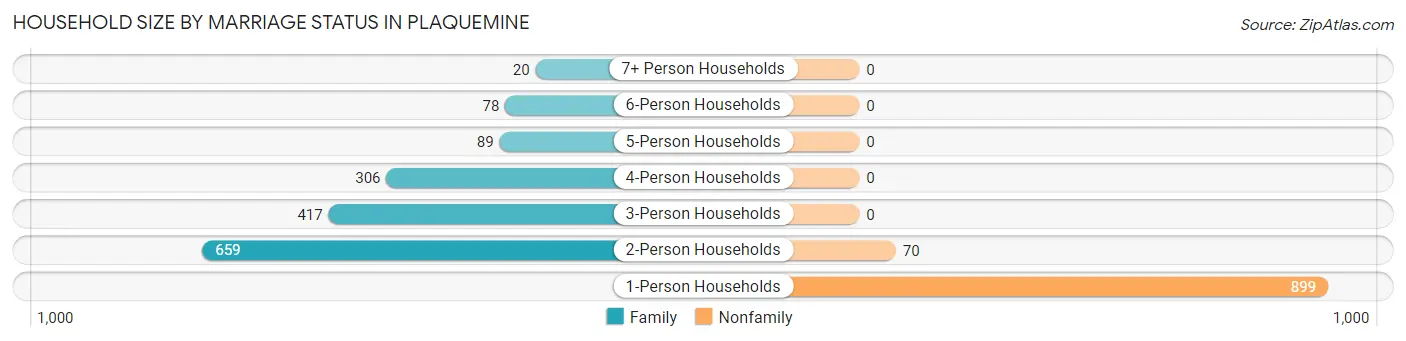
| Household Size | Family Households | Nonfamily Households |
| 1-Person Households | - | 899 (35.4%) |
| 2-Person Households | 659 (26.0%) | 70 (2.8%) |
| 3-Person Households | 417 (16.4%) | 0 (0.0%) |
| 4-Person Households | 306 (12.1%) | 0 (0.0%) |
| 5-Person Households | 89 (3.5%) | 0 (0.0%) |
| 6-Person Households | 78 (3.1%) | 0 (0.0%) |
| 7+ Person Households | 20 (0.8%) | 0 (0.0%) |
| Total | 1,569 (61.8%) | 969 (38.2%) |
Female Fertility in Plaquemine
Fertility by Age in Plaquemine
Average fertility rate in Plaquemine is 45.0 births per 1,000 women. Women in the age bracket of 35 to 50 years have the highest fertility rate with 60.0 births per 1,000 women. Women in the age bracket of 35 to 50 years acount for 89.1% of all women with births.
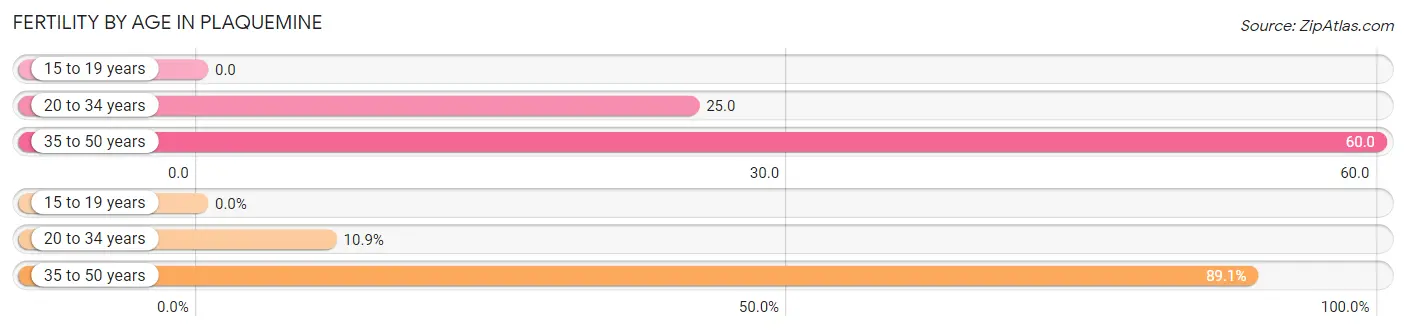
| Age Bracket | Women with Births | Births / 1,000 Women |
| 15 to 19 years | 0 (0.0%) | 0.0 |
| 20 to 34 years | 6 (10.9%) | 25.0 |
| 35 to 50 years | 49 (89.1%) | 60.0 |
| Total | 55 (100.0%) | 45.0 |
Fertility by Age by Marriage Status in Plaquemine
74.5% of women with births (55) in Plaquemine are married. The highest percentage of unmarried women with births falls into 35 to 50 years age bracket with 28.6% of them unmarried at the time of birth, while the lowest percentage of unmarried women with births belong to 20 to 34 years age bracket with 0.0% of them unmarried.
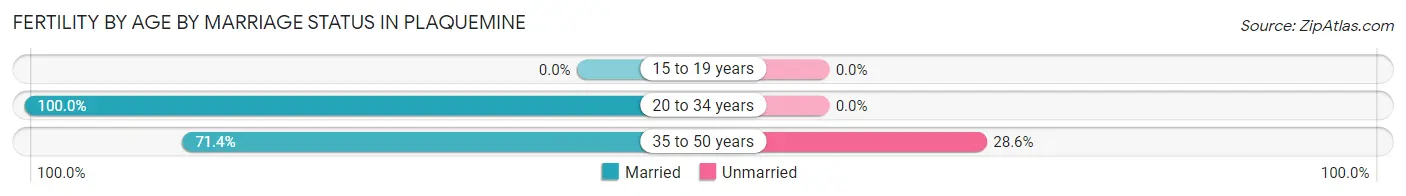
| Age Bracket | Married | Unmarried |
| 15 to 19 years | 0 (0.0%) | 0 (0.0%) |
| 20 to 34 years | 6 (100.0%) | 0 (0.0%) |
| 35 to 50 years | 35 (71.4%) | 14 (28.6%) |
| Total | 41 (74.6%) | 14 (25.5%) |
Fertility by Education in Plaquemine
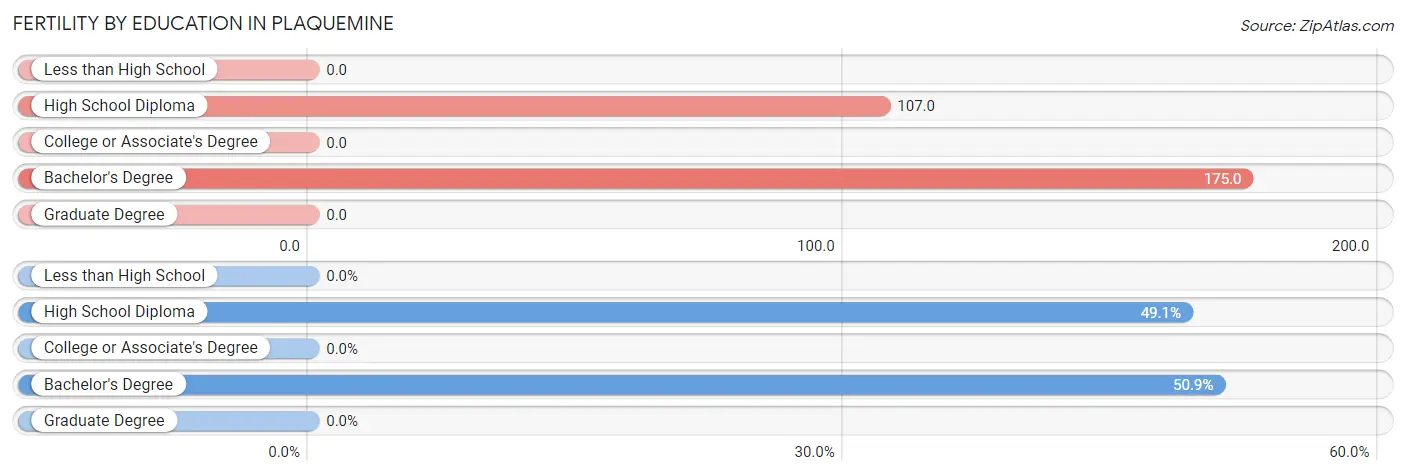
| Educational Attainment | Women with Births | Births / 1,000 Women |
| Less than High School | 0 (0.0%) | 0.0 |
| High School Diploma | 27 (49.1%) | 107.0 |
| College or Associate's Degree | 0 (0.0%) | 0.0 |
| Bachelor's Degree | 28 (50.9%) | 175.0 |
| Graduate Degree | 0 (0.0%) | 0.0 |
| Total | 55 (100.0%) | 45.0 |
Fertility by Education by Marriage Status in Plaquemine
25.5% of women with births in Plaquemine are unmarried. Women with the educational attainment of high school diploma are most likely to be married with 100.0% of them married at childbirth, while women with the educational attainment of bachelor's degree are least likely to be married with 50.0% of them unmarried at childbirth.
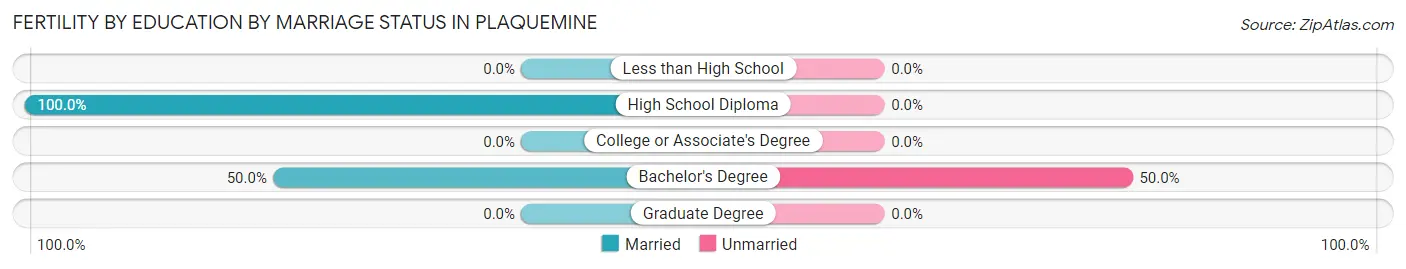
| Educational Attainment | Married | Unmarried |
| Less than High School | 0 (0.0%) | 0 (0.0%) |
| High School Diploma | 27 (100.0%) | 0 (0.0%) |
| College or Associate's Degree | 0 (0.0%) | 0 (0.0%) |
| Bachelor's Degree | 14 (50.0%) | 14 (50.0%) |
| Graduate Degree | 0 (0.0%) | 0 (0.0%) |
| Total | 41 (74.6%) | 14 (25.5%) |
Employment Characteristics in Plaquemine
Employment by Class of Employer in Plaquemine
Among the 2,560 employed individuals in Plaquemine, private company employees (1,528 | 59.7%), local government employees (286 | 11.2%), and state government employees (191 | 7.5%) make up the most common classes of employment.
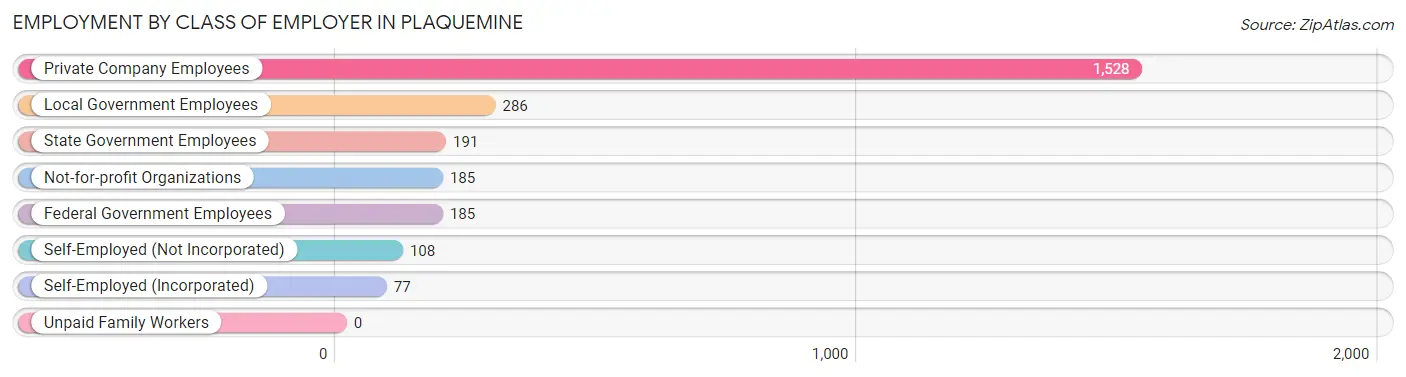
| Employer Class | # Employees | % Employees |
| Private Company Employees | 1,528 | 59.7% |
| Self-Employed (Incorporated) | 77 | 3.0% |
| Self-Employed (Not Incorporated) | 108 | 4.2% |
| Not-for-profit Organizations | 185 | 7.2% |
| Local Government Employees | 286 | 11.2% |
| State Government Employees | 191 | 7.5% |
| Federal Government Employees | 185 | 7.2% |
| Unpaid Family Workers | 0 | 0.0% |
| Total | 2,560 | 100.0% |
Employment Status by Age in Plaquemine
According to the labor force statistics for Plaquemine, out of the total population over 16 years of age (4,696), 61.0% or 2,865 individuals are in the labor force, with 6.2% or 178 of them unemployed. The age group with the highest labor force participation rate is 35 to 44 years, with 95.1% or 1,003 individuals in the labor force. Within the labor force, the 16 to 19 years age range has the highest percentage of unemployed individuals, with 33.0% or 34 of them being unemployed.
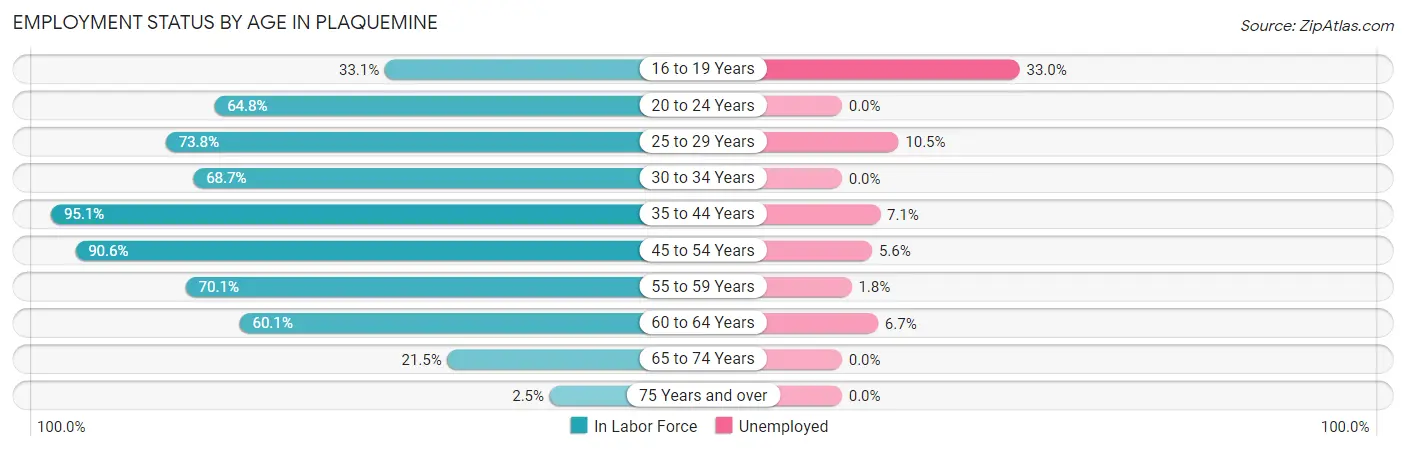
| Age Bracket | In Labor Force | Unemployed |
| 16 to 19 Years | 103 (33.1%) | 34 (33.0%) |
| 20 to 24 Years | 114 (64.8%) | 0 (0.0%) |
| 25 to 29 Years | 76 (73.8%) | 8 (10.5%) |
| 30 to 34 Years | 158 (68.7%) | 0 (0.0%) |
| 35 to 44 Years | 1,003 (95.1%) | 71 (7.1%) |
| 45 to 54 Years | 716 (90.6%) | 40 (5.6%) |
| 55 to 59 Years | 284 (70.1%) | 5 (1.8%) |
| 60 to 64 Years | 283 (60.1%) | 19 (6.7%) |
| 65 to 74 Years | 111 (21.5%) | 0 (0.0%) |
| 75 Years and over | 16 (2.5%) | 0 (0.0%) |
| Total | 2,865 (61.0%) | 178 (6.2%) |
Employment Status by Educational Attainment in Plaquemine
According to labor force statistics for Plaquemine, 82.5% of individuals (2,520) out of the total population between 25 and 64 years of age (3,054) are in the labor force, with 5.7% or 144 of them being unemployed. The group with the highest labor force participation rate are those with the educational attainment of college / associate degree, with 91.5% or 966 individuals in the labor force. Within the labor force, individuals with college / associate degree education have the highest percentage of unemployment, with 10.0% or 97 of them being unemployed.
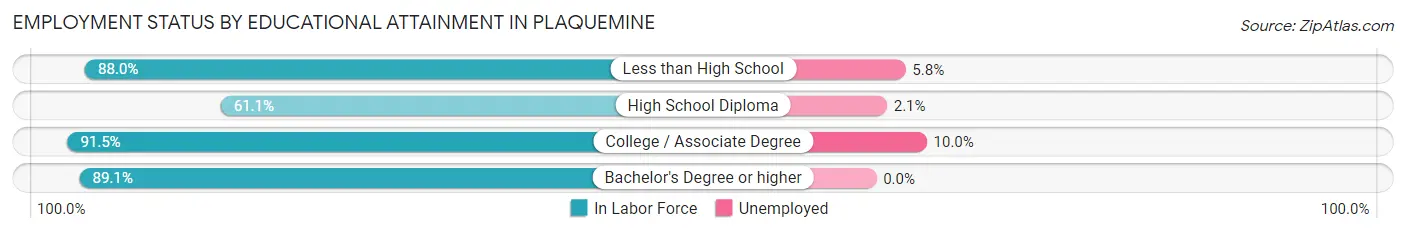
| Educational Attainment | In Labor Force | Unemployed |
| Less than High School | 618 (88.0%) | 41 (5.8%) |
| High School Diploma | 478 (61.1%) | 16 (2.1%) |
| College / Associate Degree | 966 (91.5%) | 106 (10.0%) |
| Bachelor's Degree or higher | 458 (89.1%) | 0 (0.0%) |
| Total | 2,520 (82.5%) | 174 (5.7%) |
Employment Occupations by Sex in Plaquemine
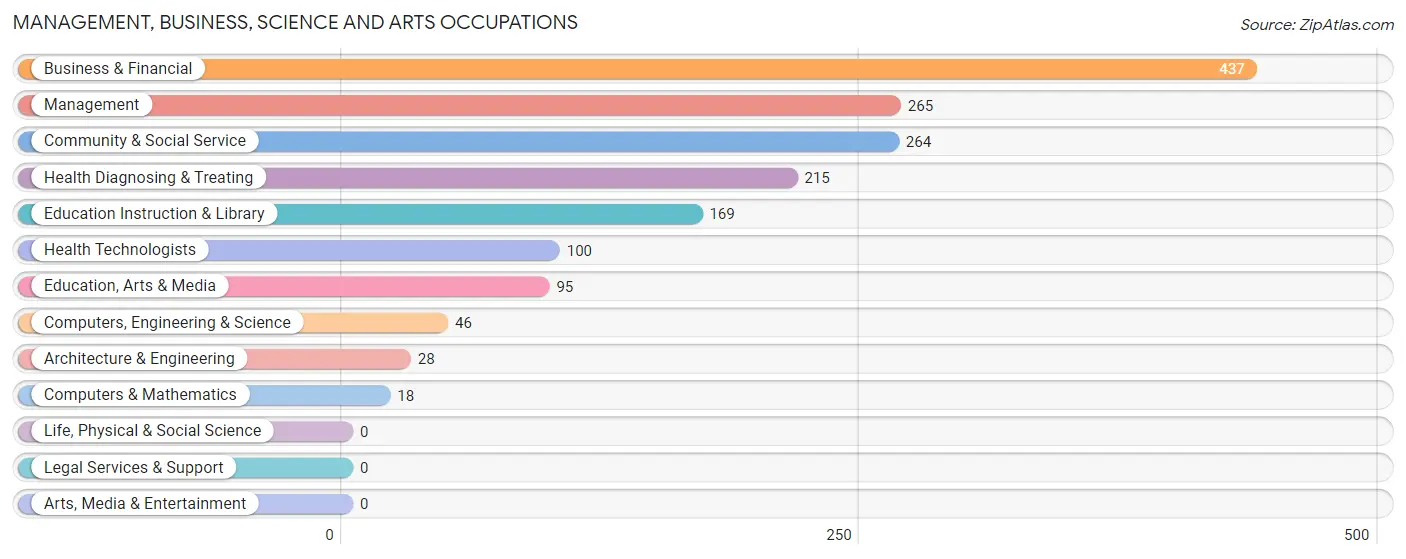
Management, Business, Science and Arts Occupations
The most common Management, Business, Science and Arts occupations in Plaquemine are Business & Financial (437 | 16.3%), Management (265 | 9.9%), Community & Social Service (264 | 9.8%), Health Diagnosing & Treating (215 | 8.0%), and Education Instruction & Library (169 | 6.3%).
Management, Business, Science and Arts Occupations by Sex
Within the Management, Business, Science and Arts occupations in Plaquemine, the most male-oriented occupations are Computers, Engineering & Science (100.0%), Computers & Mathematics (100.0%), and Architecture & Engineering (100.0%), while the most female-oriented occupations are Health Diagnosing & Treating (100.0%), Health Technologists (100.0%), and Education Instruction & Library (91.1%).
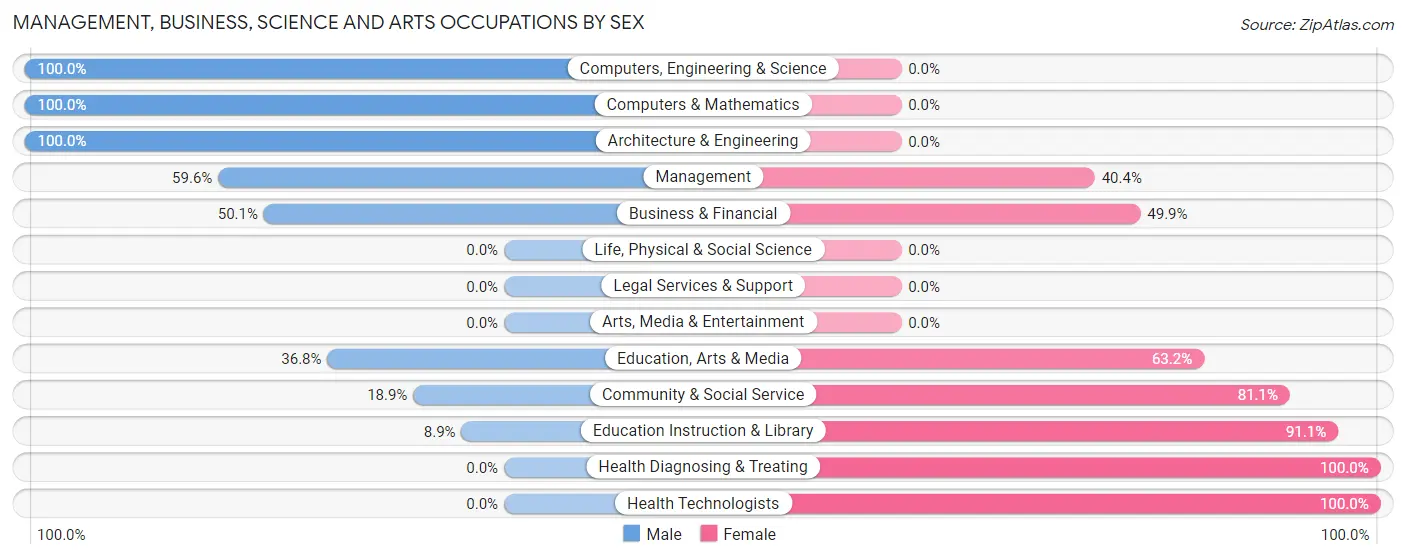
| Occupation | Male | Female |
| Management | 158 (59.6%) | 107 (40.4%) |
| Business & Financial | 219 (50.1%) | 218 (49.9%) |
| Computers, Engineering & Science | 46 (100.0%) | 0 (0.0%) |
| Computers & Mathematics | 18 (100.0%) | 0 (0.0%) |
| Architecture & Engineering | 28 (100.0%) | 0 (0.0%) |
| Life, Physical & Social Science | 0 (0.0%) | 0 (0.0%) |
| Community & Social Service | 50 (18.9%) | 214 (81.1%) |
| Education, Arts & Media | 35 (36.8%) | 60 (63.2%) |
| Legal Services & Support | 0 (0.0%) | 0 (0.0%) |
| Education Instruction & Library | 15 (8.9%) | 154 (91.1%) |
| Arts, Media & Entertainment | 0 (0.0%) | 0 (0.0%) |
| Health Diagnosing & Treating | 0 (0.0%) | 215 (100.0%) |
| Health Technologists | 0 (0.0%) | 100 (100.0%) |
| Total (Category) | 473 (38.6%) | 754 (61.5%) |
| Total (Overall) | 1,333 (49.6%) | 1,354 (50.4%) |
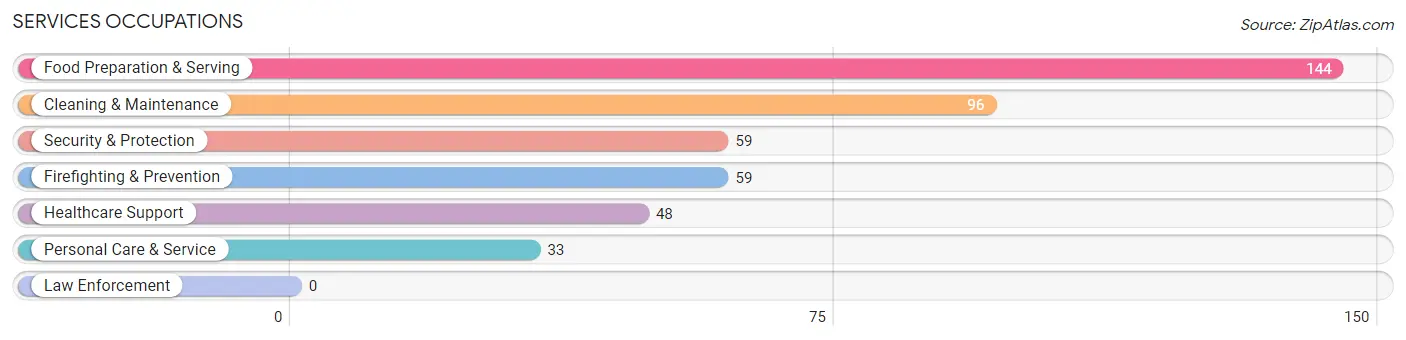
Services Occupations
The most common Services occupations in Plaquemine are Food Preparation & Serving (144 | 5.4%), Cleaning & Maintenance (96 | 3.6%), Security & Protection (59 | 2.2%), Firefighting & Prevention (59 | 2.2%), and Healthcare Support (48 | 1.8%).
Services Occupations by Sex
Within the Services occupations in Plaquemine, the most male-oriented occupations are Security & Protection (100.0%), Firefighting & Prevention (100.0%), and Cleaning & Maintenance (100.0%), while the most female-oriented occupations are Healthcare Support (100.0%), and Food Preparation & Serving (73.6%).
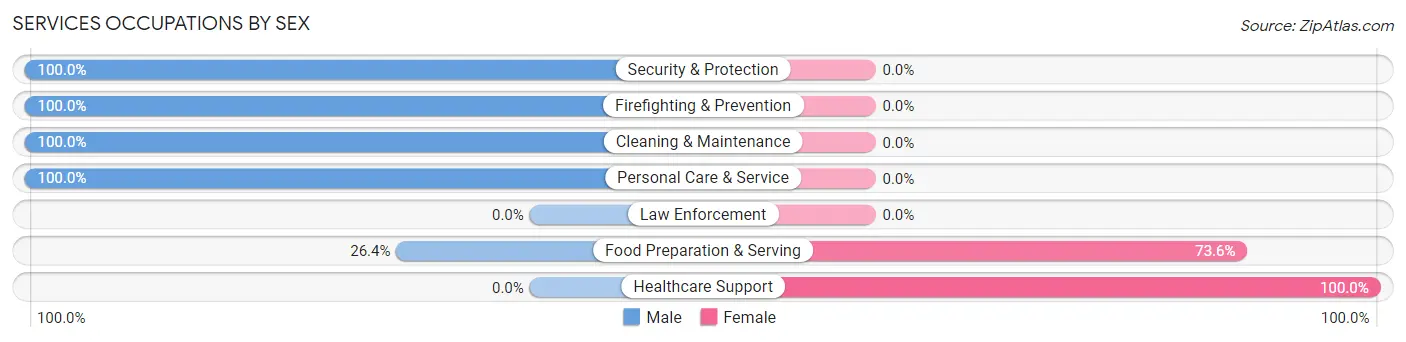
| Occupation | Male | Female |
| Healthcare Support | 0 (0.0%) | 48 (100.0%) |
| Security & Protection | 59 (100.0%) | 0 (0.0%) |
| Firefighting & Prevention | 59 (100.0%) | 0 (0.0%) |
| Law Enforcement | 0 (0.0%) | 0 (0.0%) |
| Food Preparation & Serving | 38 (26.4%) | 106 (73.6%) |
| Cleaning & Maintenance | 96 (100.0%) | 0 (0.0%) |
| Personal Care & Service | 33 (100.0%) | 0 (0.0%) |
| Total (Category) | 226 (59.5%) | 154 (40.5%) |
| Total (Overall) | 1,333 (49.6%) | 1,354 (50.4%) |
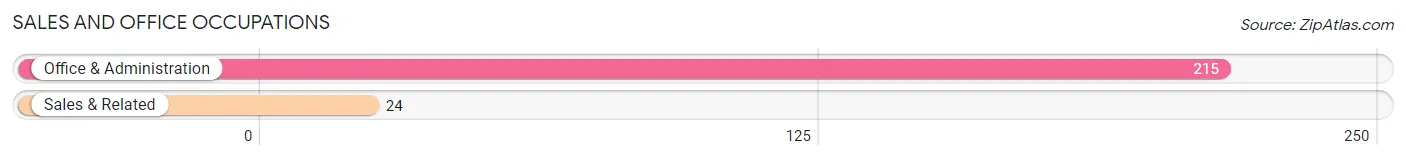
Sales and Office Occupations
The most common Sales and Office occupations in Plaquemine are Office & Administration (215 | 8.0%), and Sales & Related (24 | 0.9%).
Sales and Office Occupations by Sex

| Occupation | Male | Female |
| Sales & Related | 24 (100.0%) | 0 (0.0%) |
| Office & Administration | 10 (4.6%) | 205 (95.4%) |
| Total (Category) | 34 (14.2%) | 205 (85.8%) |
| Total (Overall) | 1,333 (49.6%) | 1,354 (50.4%) |
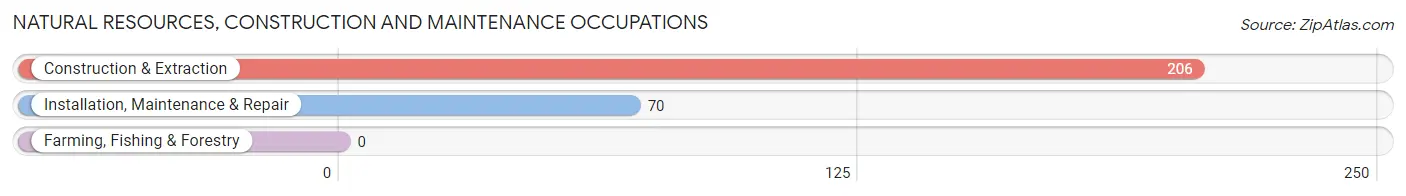
Natural Resources, Construction and Maintenance Occupations
The most common Natural Resources, Construction and Maintenance occupations in Plaquemine are Construction & Extraction (206 | 7.7%), and Installation, Maintenance & Repair (70 | 2.6%).
Natural Resources, Construction and Maintenance Occupations by Sex
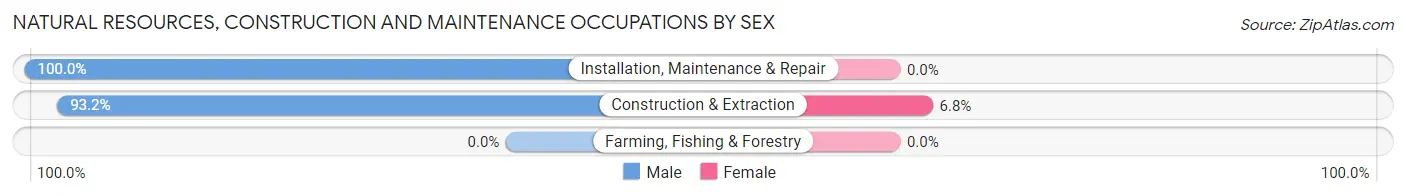
| Occupation | Male | Female |
| Farming, Fishing & Forestry | 0 (0.0%) | 0 (0.0%) |
| Construction & Extraction | 192 (93.2%) | 14 (6.8%) |
| Installation, Maintenance & Repair | 70 (100.0%) | 0 (0.0%) |
| Total (Category) | 262 (94.9%) | 14 (5.1%) |
| Total (Overall) | 1,333 (49.6%) | 1,354 (50.4%) |
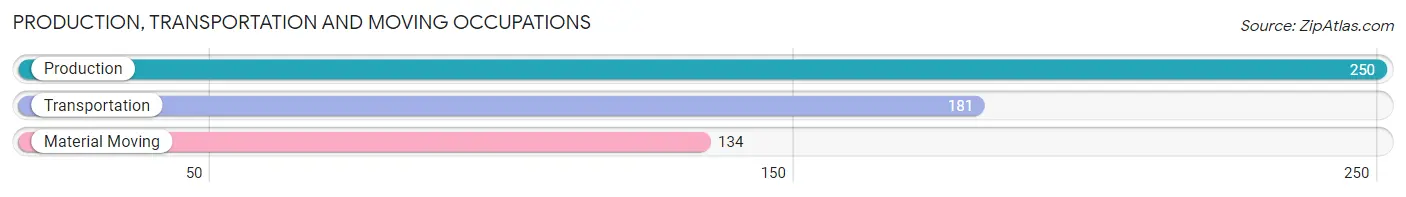
Production, Transportation and Moving Occupations
The most common Production, Transportation and Moving occupations in Plaquemine are Production (250 | 9.3%), Transportation (181 | 6.7%), and Material Moving (134 | 5.0%).
Production, Transportation and Moving Occupations by Sex
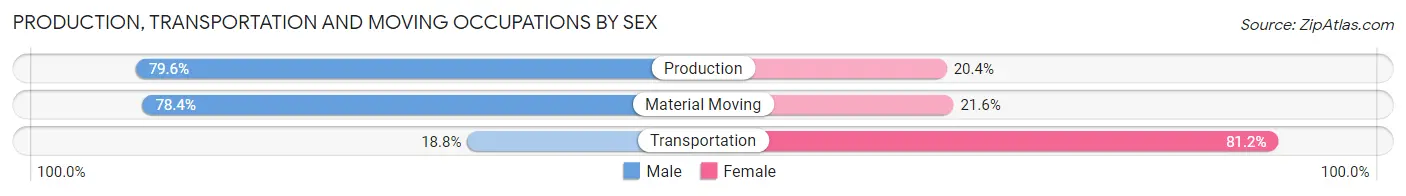
| Occupation | Male | Female |
| Production | 199 (79.6%) | 51 (20.4%) |
| Transportation | 34 (18.8%) | 147 (81.2%) |
| Material Moving | 105 (78.4%) | 29 (21.6%) |
| Total (Category) | 338 (59.8%) | 227 (40.2%) |
| Total (Overall) | 1,333 (49.6%) | 1,354 (50.4%) |
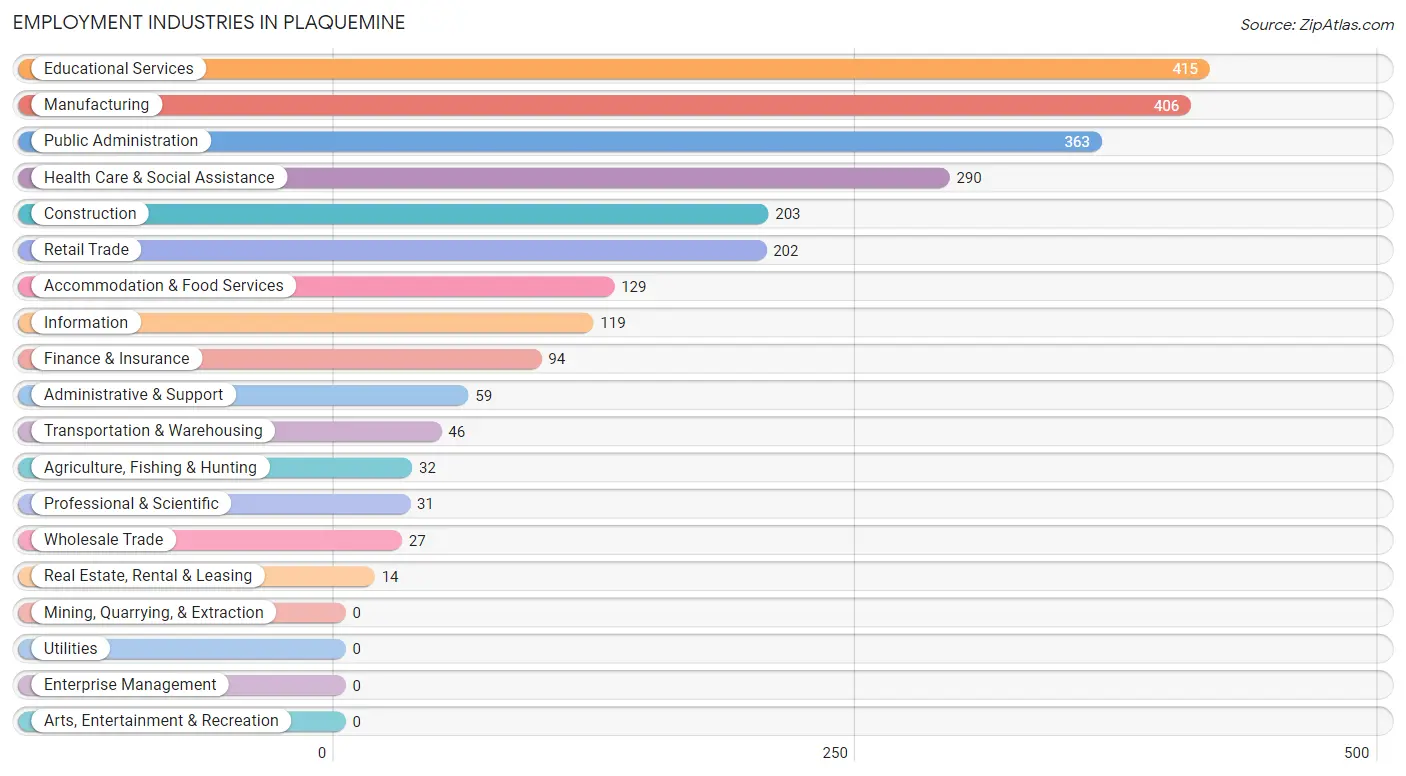
Employment Industries by Sex in Plaquemine
Employment Industries in Plaquemine
The major employment industries in Plaquemine include Educational Services (415 | 15.4%), Manufacturing (406 | 15.1%), Public Administration (363 | 13.5%), Health Care & Social Assistance (290 | 10.8%), and Construction (203 | 7.5%).
Employment Industries by Sex in Plaquemine
The Plaquemine industries that see more men than women are Agriculture, Fishing & Hunting (100.0%), Construction (100.0%), and Administrative & Support (100.0%), whereas the industries that tend to have a higher number of women are Information (100.0%), Finance & Insurance (100.0%), and Real Estate, Rental & Leasing (100.0%).
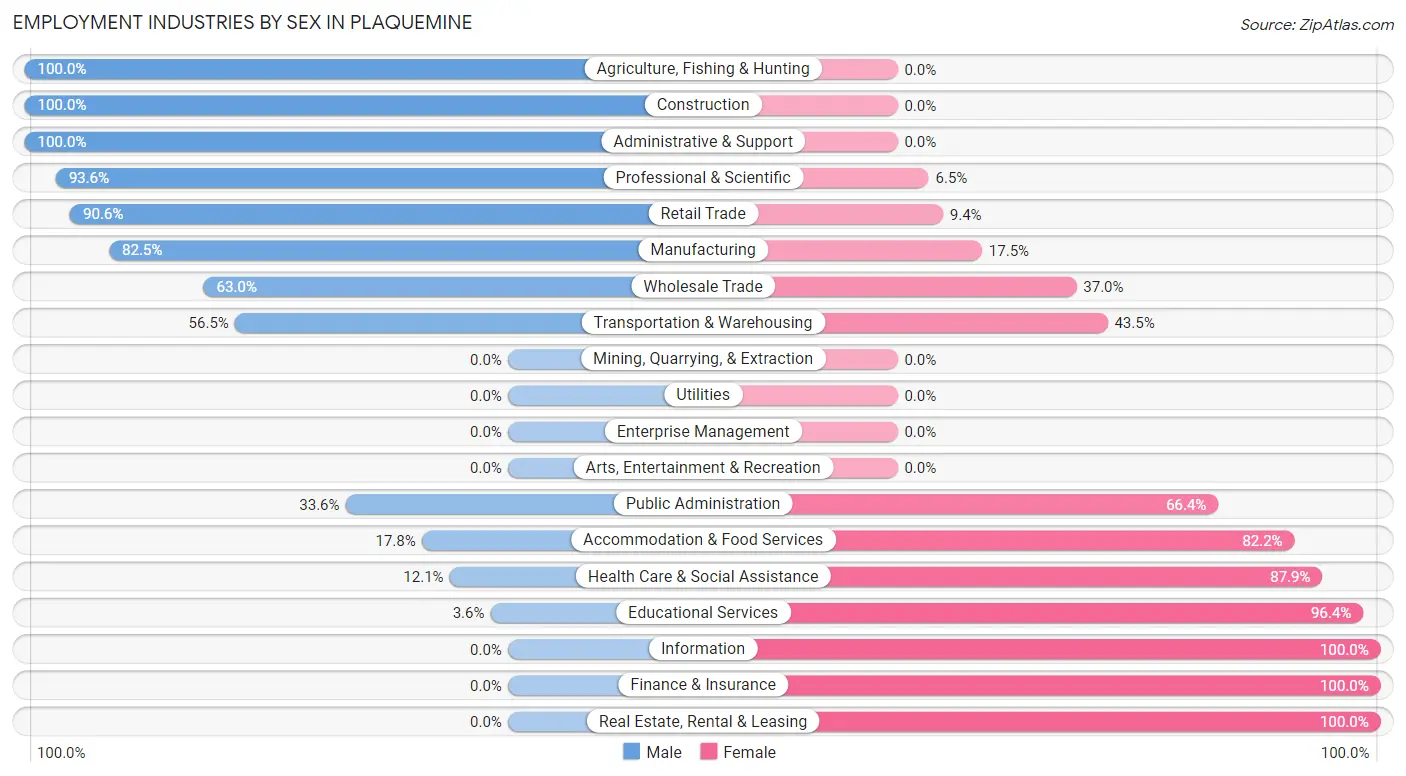
| Industry | Male | Female |
| Agriculture, Fishing & Hunting | 32 (100.0%) | 0 (0.0%) |
| Mining, Quarrying, & Extraction | 0 (0.0%) | 0 (0.0%) |
| Construction | 203 (100.0%) | 0 (0.0%) |
| Manufacturing | 335 (82.5%) | 71 (17.5%) |
| Wholesale Trade | 17 (63.0%) | 10 (37.0%) |
| Retail Trade | 183 (90.6%) | 19 (9.4%) |
| Transportation & Warehousing | 26 (56.5%) | 20 (43.5%) |
| Utilities | 0 (0.0%) | 0 (0.0%) |
| Information | 0 (0.0%) | 119 (100.0%) |
| Finance & Insurance | 0 (0.0%) | 94 (100.0%) |
| Real Estate, Rental & Leasing | 0 (0.0%) | 14 (100.0%) |
| Professional & Scientific | 29 (93.5%) | 2 (6.5%) |
| Enterprise Management | 0 (0.0%) | 0 (0.0%) |
| Administrative & Support | 59 (100.0%) | 0 (0.0%) |
| Educational Services | 15 (3.6%) | 400 (96.4%) |
| Health Care & Social Assistance | 35 (12.1%) | 255 (87.9%) |
| Arts, Entertainment & Recreation | 0 (0.0%) | 0 (0.0%) |
| Accommodation & Food Services | 23 (17.8%) | 106 (82.2%) |
| Public Administration | 122 (33.6%) | 241 (66.4%) |
| Total | 1,333 (49.6%) | 1,354 (50.4%) |
Education in Plaquemine
School Enrollment in Plaquemine
The most common levels of schooling among the 1,676 students in Plaquemine are middle school (531 | 31.7%), high school (499 | 29.8%), and elementary school (309 | 18.4%).
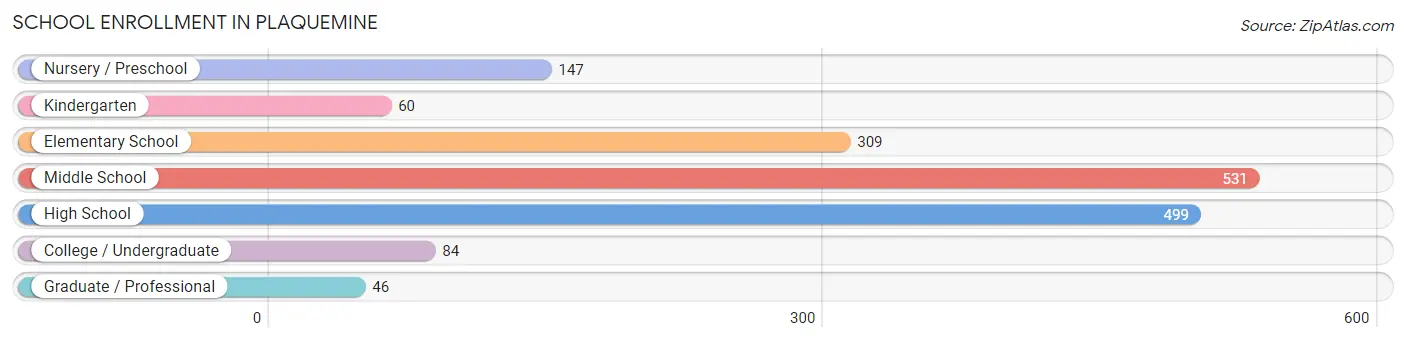
| School Level | # Students | % Students |
| Nursery / Preschool | 147 | 8.8% |
| Kindergarten | 60 | 3.6% |
| Elementary School | 309 | 18.4% |
| Middle School | 531 | 31.7% |
| High School | 499 | 29.8% |
| College / Undergraduate | 84 | 5.0% |
| Graduate / Professional | 46 | 2.7% |
| Total | 1,676 | 100.0% |
School Enrollment by Age by Funding Source in Plaquemine
Out of a total of 1,676 students who are enrolled in schools in Plaquemine, 245 (14.6%) attend a private institution, while the remaining 1,431 (85.4%) are enrolled in public schools. The age group of 35 years and over has the highest likelihood of being enrolled in private schools, with 38 (92.7% in the age bracket) enrolled. Conversely, the age group of 3 to 4 year olds has the lowest likelihood of being enrolled in a private school, with 120 (100.0% in the age bracket) attending a public institution.
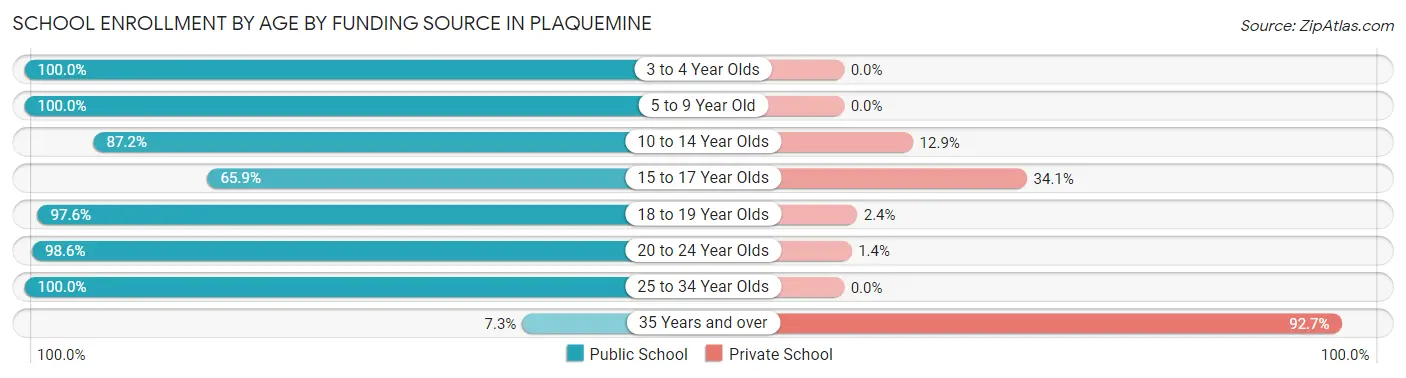
| Age Bracket | Public School | Private School |
| 3 to 4 Year Olds | 120 (100.0%) | 0 (0.0%) |
| 5 to 9 Year Old | 396 (100.0%) | 0 (0.0%) |
| 10 to 14 Year Olds | 556 (87.2%) | 82 (12.9%) |
| 15 to 17 Year Olds | 238 (65.9%) | 123 (34.1%) |
| 18 to 19 Year Olds | 40 (97.6%) | 1 (2.4%) |
| 20 to 24 Year Olds | 70 (98.6%) | 1 (1.4%) |
| 25 to 34 Year Olds | 8 (100.0%) | 0 (0.0%) |
| 35 Years and over | 3 (7.3%) | 38 (92.7%) |
| Total | 1,431 (85.4%) | 245 (14.6%) |
Educational Attainment by Field of Study in Plaquemine
Business (166 | 24.2%), arts & humanities (98 | 14.3%), science & technology (78 | 11.4%), education (76 | 11.1%), and engineering (61 | 8.9%) are the most common fields of study among 686 individuals in Plaquemine who have obtained a bachelor's degree or higher.
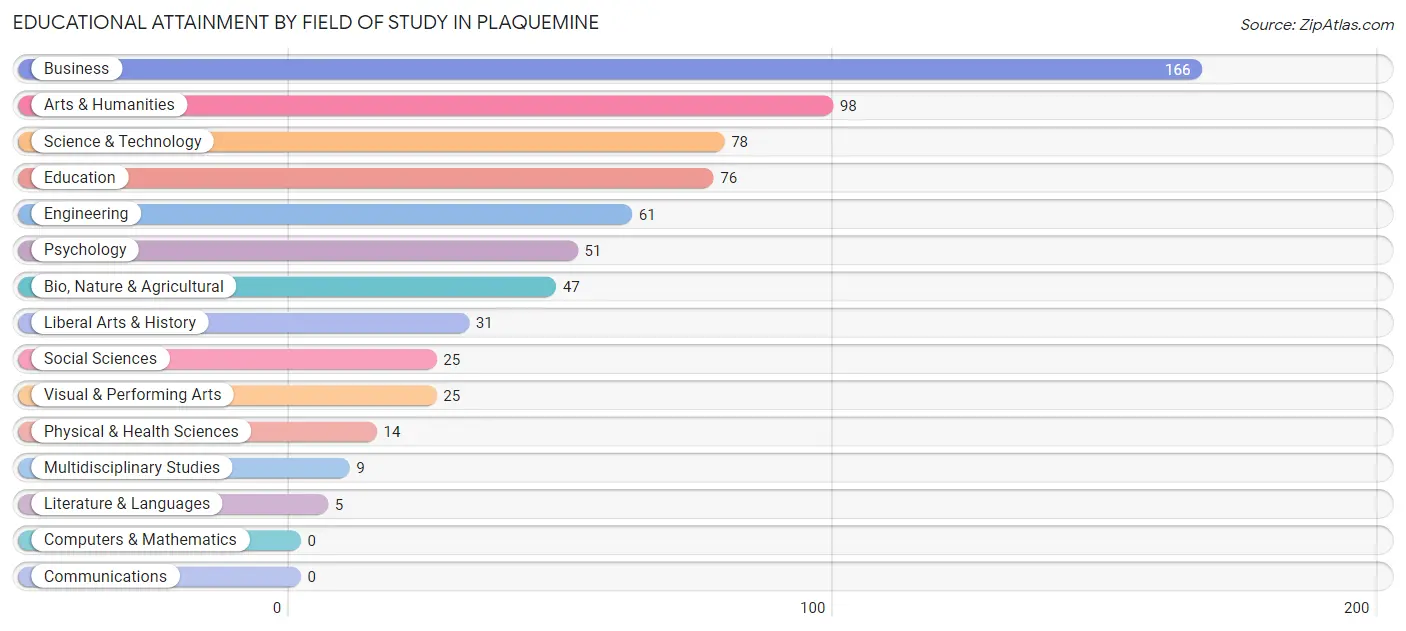
| Field of Study | # Graduates | % Graduates |
| Computers & Mathematics | 0 | 0.0% |
| Bio, Nature & Agricultural | 47 | 6.9% |
| Physical & Health Sciences | 14 | 2.0% |
| Psychology | 51 | 7.4% |
| Social Sciences | 25 | 3.6% |
| Engineering | 61 | 8.9% |
| Multidisciplinary Studies | 9 | 1.3% |
| Science & Technology | 78 | 11.4% |
| Business | 166 | 24.2% |
| Education | 76 | 11.1% |
| Literature & Languages | 5 | 0.7% |
| Liberal Arts & History | 31 | 4.5% |
| Visual & Performing Arts | 25 | 3.6% |
| Communications | 0 | 0.0% |
| Arts & Humanities | 98 | 14.3% |
| Total | 686 | 100.0% |
Transportation & Commute in Plaquemine
Vehicle Availability by Sex in Plaquemine
The most prevalent vehicle ownership categories in Plaquemine are males with 2 vehicles (594, accounting for 44.6%) and females with 2 vehicles (579, making up 48.6%).
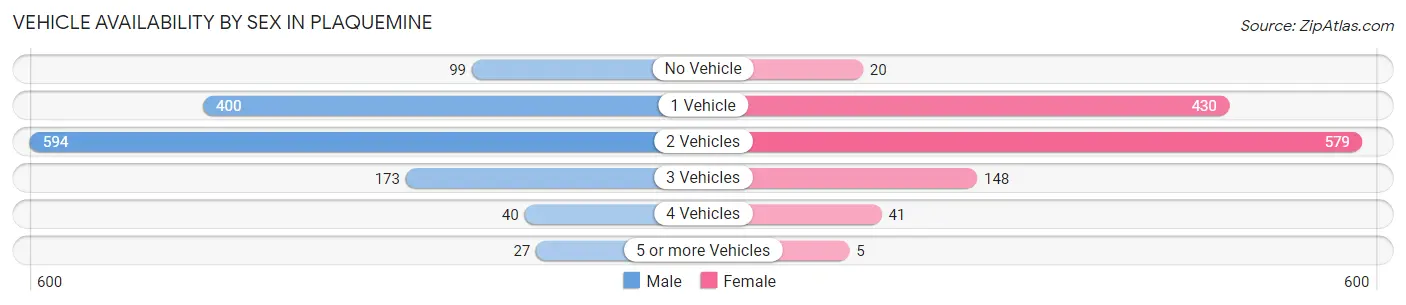
| Vehicles Available | Male | Female |
| No Vehicle | 99 (7.4%) | 20 (1.6%) |
| 1 Vehicle | 400 (30.0%) | 430 (35.2%) |
| 2 Vehicles | 594 (44.6%) | 579 (47.3%) |
| 3 Vehicles | 173 (13.0%) | 148 (12.1%) |
| 4 Vehicles | 40 (3.0%) | 41 (3.4%) |
| 5 or more Vehicles | 27 (2.0%) | 5 (0.4%) |
| Total | 1,333 (100.0%) | 1,223 (100.0%) |
Commute Time in Plaquemine
The most frequently occuring commute durations in Plaquemine are 5 to 9 minutes (705 commuters, 30.4%), 10 to 14 minutes (357 commuters, 15.4%), and less than 5 minutes (271 commuters, 11.7%).
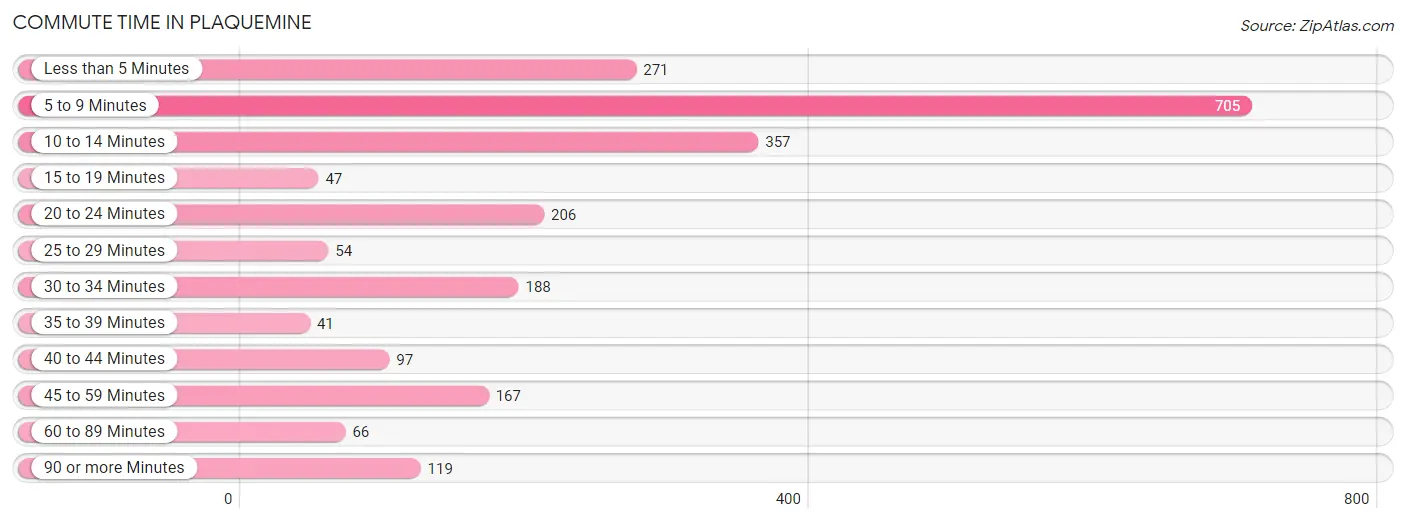
| Commute Time | # Commuters | % Commuters |
| Less than 5 Minutes | 271 | 11.7% |
| 5 to 9 Minutes | 705 | 30.4% |
| 10 to 14 Minutes | 357 | 15.4% |
| 15 to 19 Minutes | 47 | 2.0% |
| 20 to 24 Minutes | 206 | 8.9% |
| 25 to 29 Minutes | 54 | 2.3% |
| 30 to 34 Minutes | 188 | 8.1% |
| 35 to 39 Minutes | 41 | 1.8% |
| 40 to 44 Minutes | 97 | 4.2% |
| 45 to 59 Minutes | 167 | 7.2% |
| 60 to 89 Minutes | 66 | 2.9% |
| 90 or more Minutes | 119 | 5.1% |
Commute Time by Sex in Plaquemine
The most common commute times in Plaquemine are 5 to 9 minutes (344 commuters, 26.1%) for males and 5 to 9 minutes (361 commuters, 36.1%) for females.
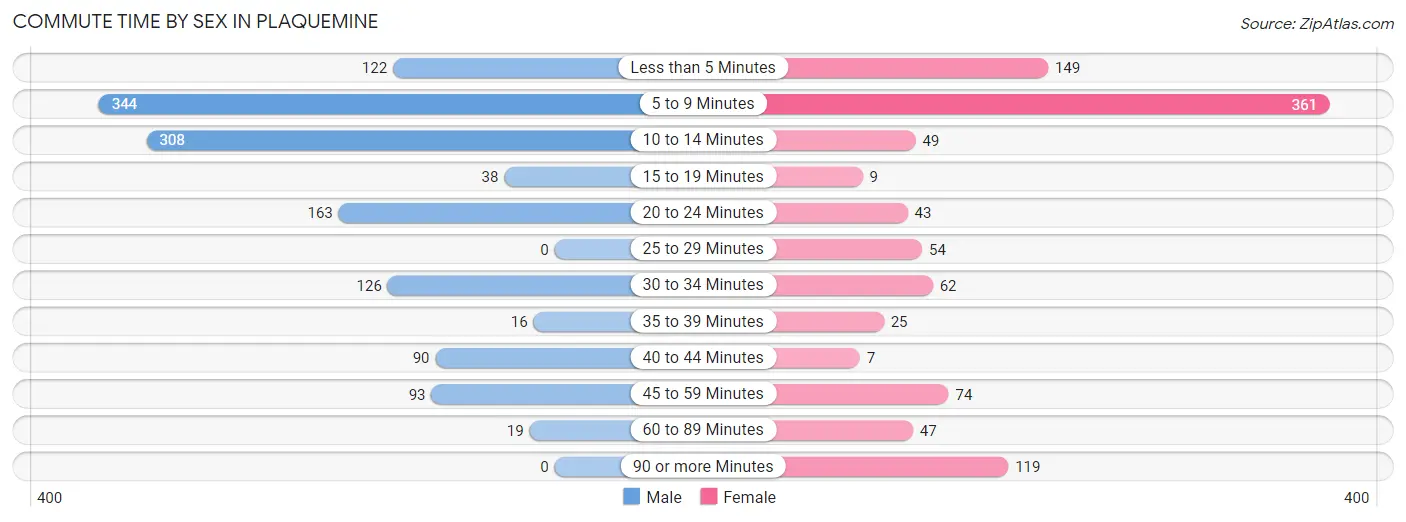
| Commute Time | Male | Female |
| Less than 5 Minutes | 122 (9.2%) | 149 (14.9%) |
| 5 to 9 Minutes | 344 (26.1%) | 361 (36.1%) |
| 10 to 14 Minutes | 308 (23.4%) | 49 (4.9%) |
| 15 to 19 Minutes | 38 (2.9%) | 9 (0.9%) |
| 20 to 24 Minutes | 163 (12.4%) | 43 (4.3%) |
| 25 to 29 Minutes | 0 (0.0%) | 54 (5.4%) |
| 30 to 34 Minutes | 126 (9.6%) | 62 (6.2%) |
| 35 to 39 Minutes | 16 (1.2%) | 25 (2.5%) |
| 40 to 44 Minutes | 90 (6.8%) | 7 (0.7%) |
| 45 to 59 Minutes | 93 (7.0%) | 74 (7.4%) |
| 60 to 89 Minutes | 19 (1.4%) | 47 (4.7%) |
| 90 or more Minutes | 0 (0.0%) | 119 (11.9%) |
Time of Departure to Work by Sex in Plaquemine
The most frequent times of departure to work in Plaquemine are 7:30 AM to 7:59 AM (228, 17.3%) for males and 7:30 AM to 7:59 AM (223, 22.3%) for females.
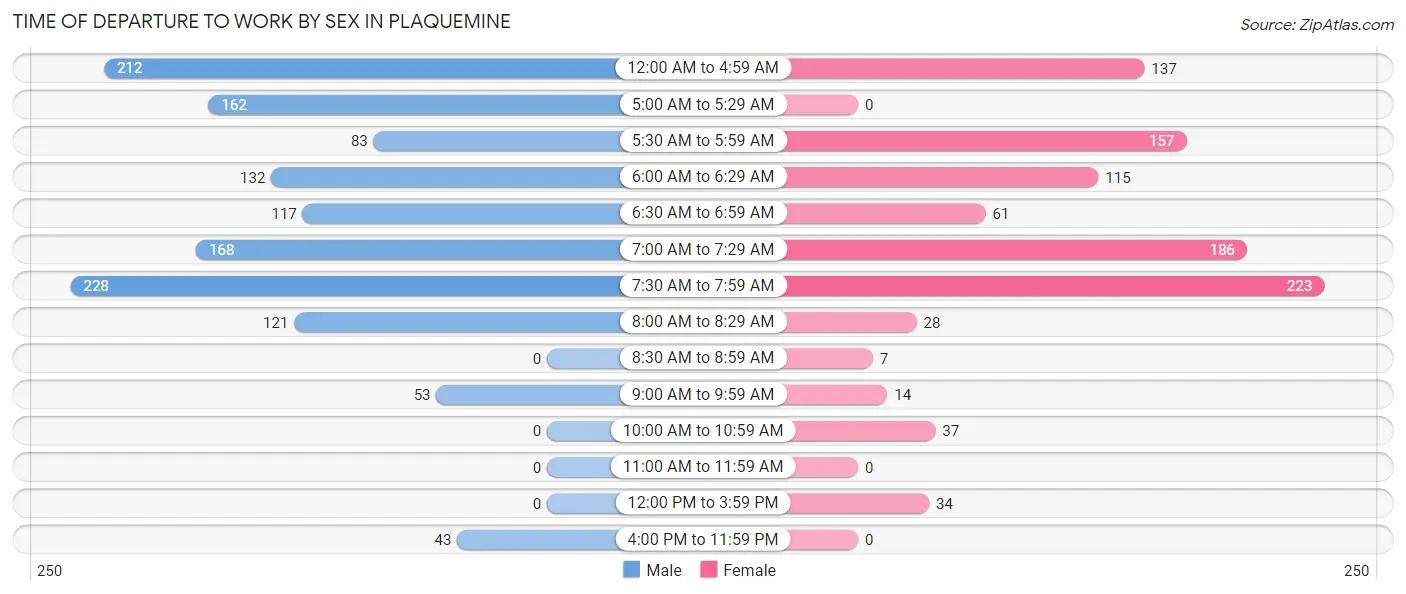
| Time of Departure | Male | Female |
| 12:00 AM to 4:59 AM | 212 (16.1%) | 137 (13.7%) |
| 5:00 AM to 5:29 AM | 162 (12.3%) | 0 (0.0%) |
| 5:30 AM to 5:59 AM | 83 (6.3%) | 157 (15.7%) |
| 6:00 AM to 6:29 AM | 132 (10.0%) | 115 (11.5%) |
| 6:30 AM to 6:59 AM | 117 (8.9%) | 61 (6.1%) |
| 7:00 AM to 7:29 AM | 168 (12.7%) | 186 (18.6%) |
| 7:30 AM to 7:59 AM | 228 (17.3%) | 223 (22.3%) |
| 8:00 AM to 8:29 AM | 121 (9.2%) | 28 (2.8%) |
| 8:30 AM to 8:59 AM | 0 (0.0%) | 7 (0.7%) |
| 9:00 AM to 9:59 AM | 53 (4.0%) | 14 (1.4%) |
| 10:00 AM to 10:59 AM | 0 (0.0%) | 37 (3.7%) |
| 11:00 AM to 11:59 AM | 0 (0.0%) | 0 (0.0%) |
| 12:00 PM to 3:59 PM | 0 (0.0%) | 34 (3.4%) |
| 4:00 PM to 11:59 PM | 43 (3.3%) | 0 (0.0%) |
| Total | 1,319 (100.0%) | 999 (100.0%) |
Housing Occupancy in Plaquemine
Occupancy by Ownership in Plaquemine
Of the total 2,538 dwellings in Plaquemine, owner-occupied units account for 1,911 (75.3%), while renter-occupied units make up 627 (24.7%).
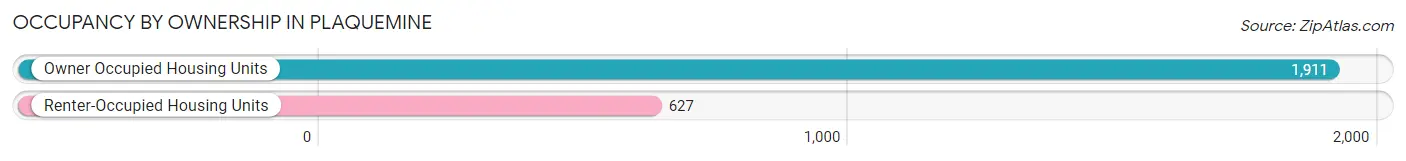
| Occupancy | # Housing Units | % Housing Units |
| Owner Occupied Housing Units | 1,911 | 75.3% |
| Renter-Occupied Housing Units | 627 | 24.7% |
| Total Occupied Housing Units | 2,538 | 100.0% |
Occupancy by Household Size in Plaquemine
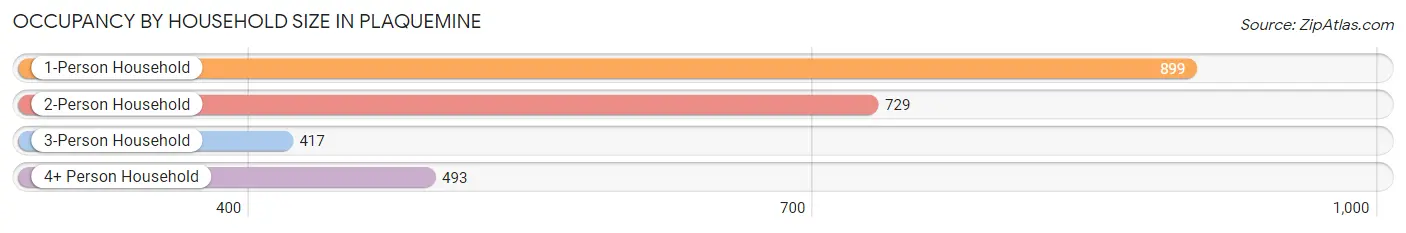
| Household Size | # Housing Units | % Housing Units |
| 1-Person Household | 899 | 35.4% |
| 2-Person Household | 729 | 28.7% |
| 3-Person Household | 417 | 16.4% |
| 4+ Person Household | 493 | 19.4% |
| Total Housing Units | 2,538 | 100.0% |
Occupancy by Ownership by Household Size in Plaquemine
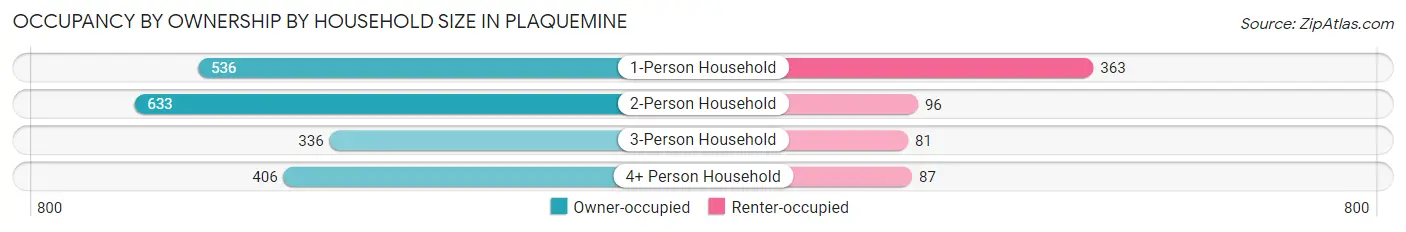
| Household Size | Owner-occupied | Renter-occupied |
| 1-Person Household | 536 (59.6%) | 363 (40.4%) |
| 2-Person Household | 633 (86.8%) | 96 (13.2%) |
| 3-Person Household | 336 (80.6%) | 81 (19.4%) |
| 4+ Person Household | 406 (82.4%) | 87 (17.6%) |
| Total Housing Units | 1,911 (75.3%) | 627 (24.7%) |
Occupancy by Educational Attainment in Plaquemine
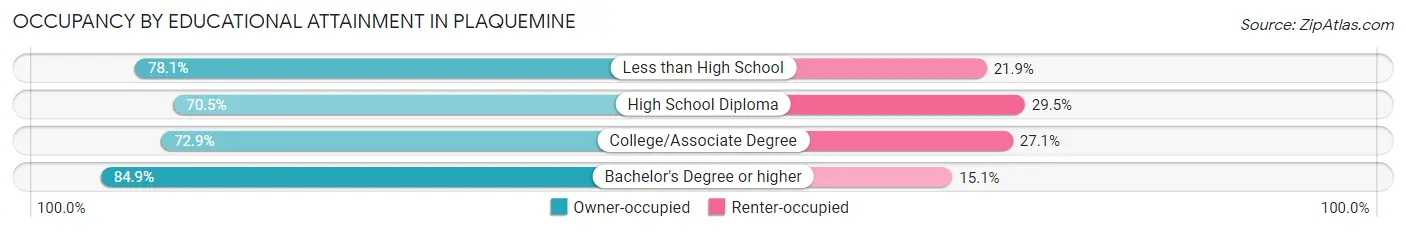
| Household Size | Owner-occupied | Renter-occupied |
| Less than High School | 392 (78.1%) | 110 (21.9%) |
| High School Diploma | 452 (70.5%) | 189 (29.5%) |
| College/Associate Degree | 713 (72.9%) | 265 (27.1%) |
| Bachelor's Degree or higher | 354 (84.9%) | 63 (15.1%) |
Occupancy by Age of Householder in Plaquemine
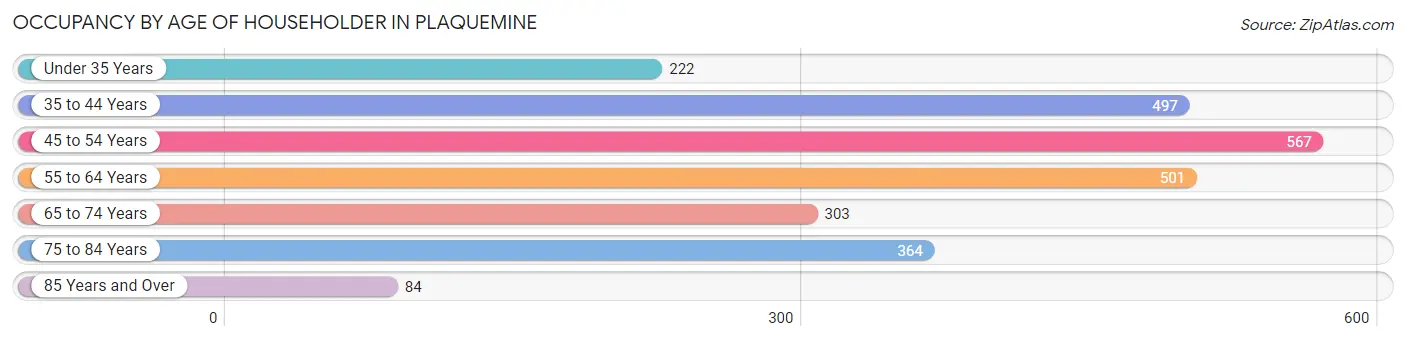
| Age Bracket | # Households | % Households |
| Under 35 Years | 222 | 8.7% |
| 35 to 44 Years | 497 | 19.6% |
| 45 to 54 Years | 567 | 22.3% |
| 55 to 64 Years | 501 | 19.7% |
| 65 to 74 Years | 303 | 11.9% |
| 75 to 84 Years | 364 | 14.3% |
| 85 Years and Over | 84 | 3.3% |
| Total | 2,538 | 100.0% |
Housing Finances in Plaquemine
Median Income by Occupancy in Plaquemine
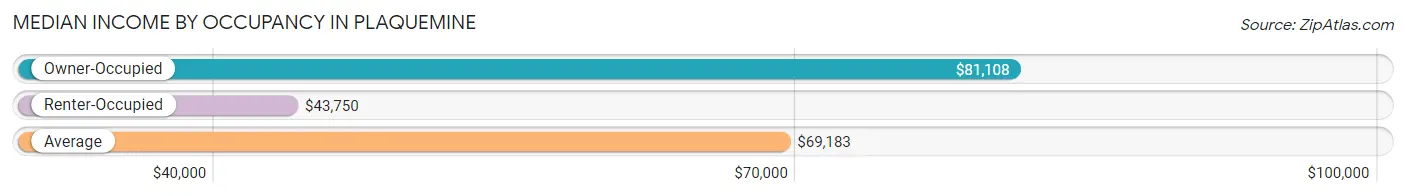
| Occupancy Type | # Households | Median Income |
| Owner-Occupied | 1,911 (75.3%) | $81,108 |
| Renter-Occupied | 627 (24.7%) | $43,750 |
| Average | 2,538 (100.0%) | $69,183 |
Occupancy by Householder Income Bracket in Plaquemine
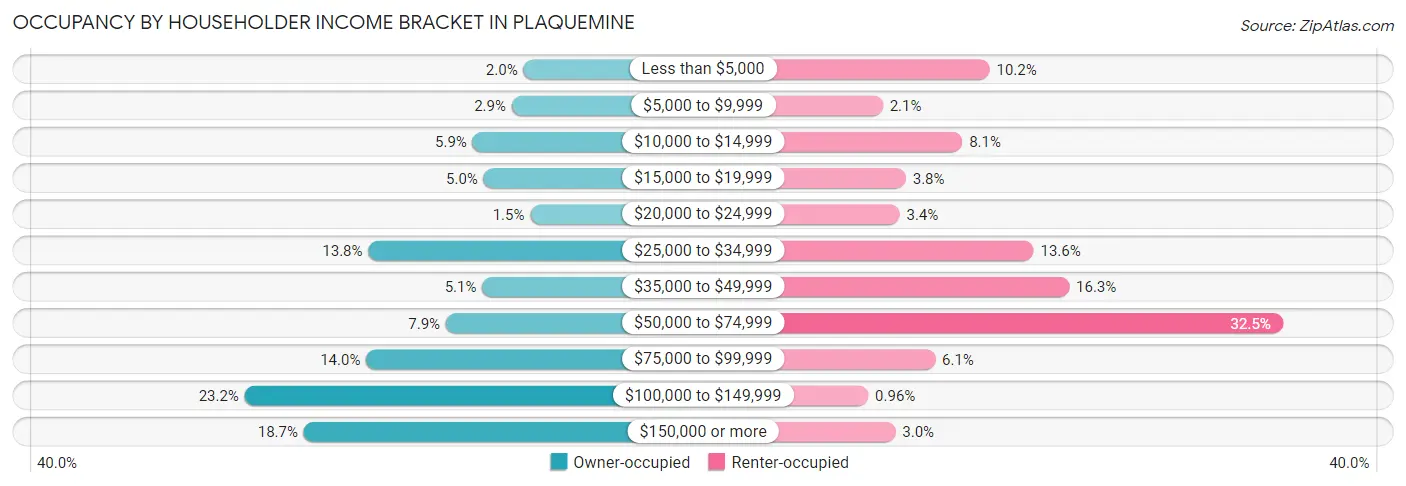
| Income Bracket | Owner-occupied | Renter-occupied |
| Less than $5,000 | 38 (2.0%) | 64 (10.2%) |
| $5,000 to $9,999 | 55 (2.9%) | 13 (2.1%) |
| $10,000 to $14,999 | 112 (5.9%) | 51 (8.1%) |
| $15,000 to $19,999 | 96 (5.0%) | 24 (3.8%) |
| $20,000 to $24,999 | 28 (1.5%) | 21 (3.4%) |
| $25,000 to $34,999 | 264 (13.8%) | 85 (13.6%) |
| $35,000 to $49,999 | 98 (5.1%) | 102 (16.3%) |
| $50,000 to $74,999 | 151 (7.9%) | 204 (32.5%) |
| $75,000 to $99,999 | 267 (14.0%) | 38 (6.1%) |
| $100,000 to $149,999 | 444 (23.2%) | 6 (1.0%) |
| $150,000 or more | 358 (18.7%) | 19 (3.0%) |
| Total | 1,911 (100.0%) | 627 (100.0%) |
Monthly Housing Cost Tiers in Plaquemine
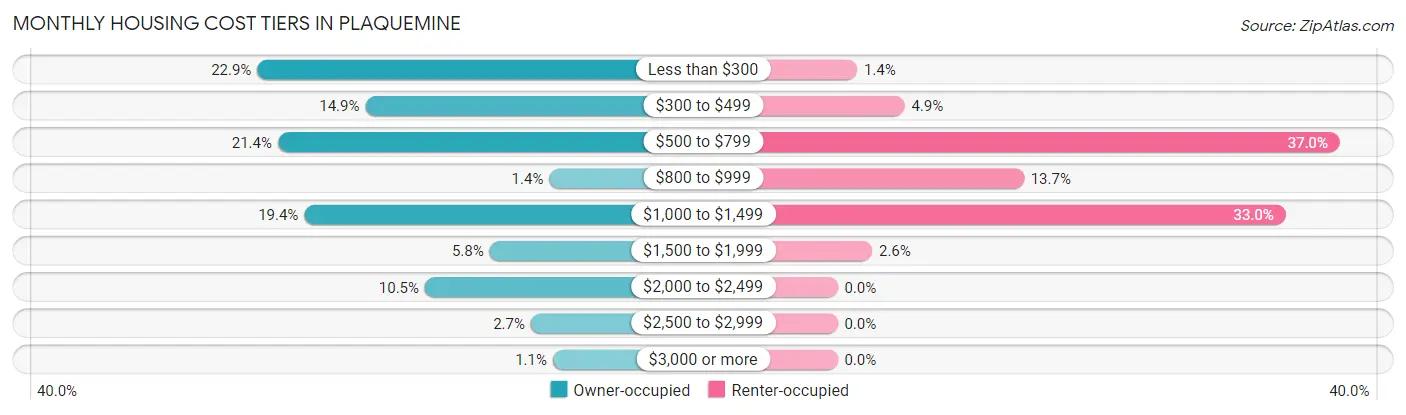
| Monthly Cost | Owner-occupied | Renter-occupied |
| Less than $300 | 437 (22.9%) | 9 (1.4%) |
| $300 to $499 | 285 (14.9%) | 31 (4.9%) |
| $500 to $799 | 408 (21.3%) | 232 (37.0%) |
| $800 to $999 | 26 (1.4%) | 86 (13.7%) |
| $1,000 to $1,499 | 371 (19.4%) | 207 (33.0%) |
| $1,500 to $1,999 | 110 (5.8%) | 16 (2.5%) |
| $2,000 to $2,499 | 201 (10.5%) | 0 (0.0%) |
| $2,500 to $2,999 | 52 (2.7%) | 0 (0.0%) |
| $3,000 or more | 21 (1.1%) | 0 (0.0%) |
| Total | 1,911 (100.0%) | 627 (100.0%) |
Physical Housing Characteristics in Plaquemine
Housing Structures in Plaquemine
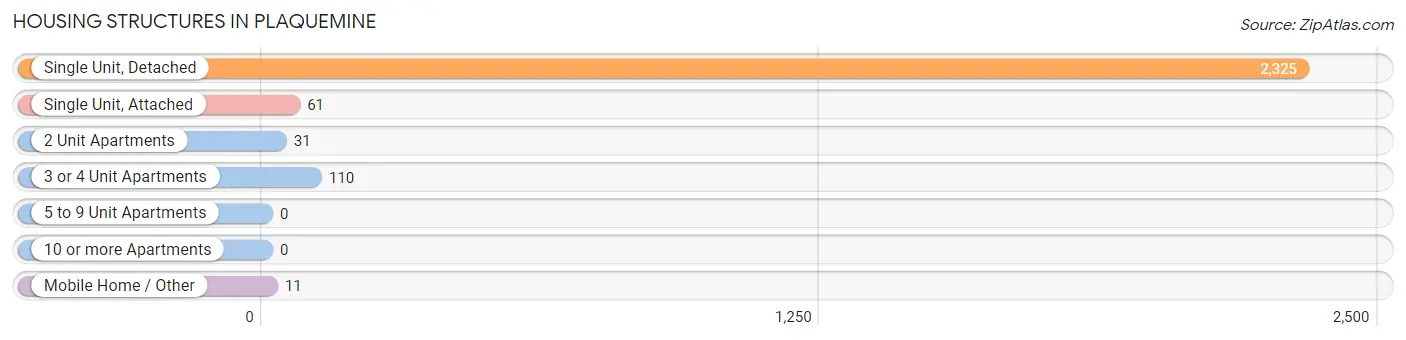
| Structure Type | # Housing Units | % Housing Units |
| Single Unit, Detached | 2,325 | 91.6% |
| Single Unit, Attached | 61 | 2.4% |
| 2 Unit Apartments | 31 | 1.2% |
| 3 or 4 Unit Apartments | 110 | 4.3% |
| 5 to 9 Unit Apartments | 0 | 0.0% |
| 10 or more Apartments | 0 | 0.0% |
| Mobile Home / Other | 11 | 0.4% |
| Total | 2,538 | 100.0% |
Housing Structures by Occupancy in Plaquemine
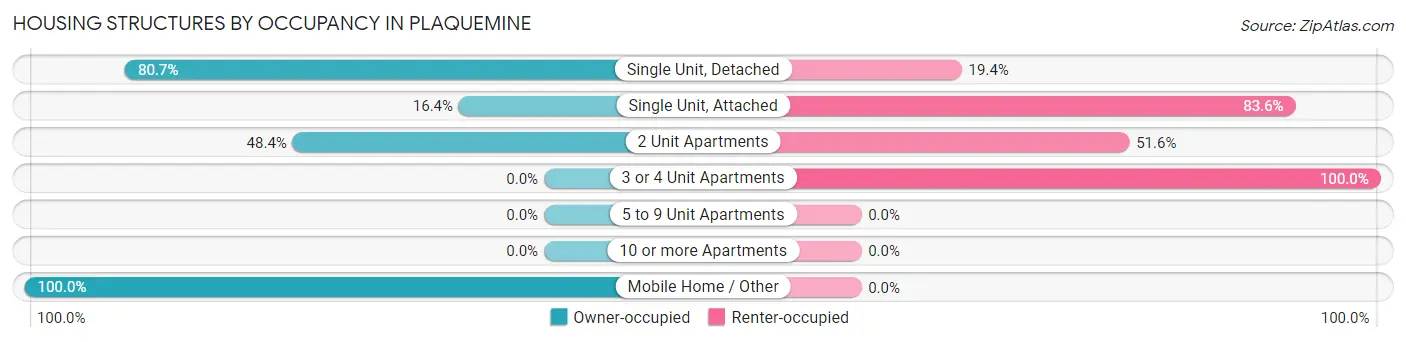
| Structure Type | Owner-occupied | Renter-occupied |
| Single Unit, Detached | 1,875 (80.6%) | 450 (19.4%) |
| Single Unit, Attached | 10 (16.4%) | 51 (83.6%) |
| 2 Unit Apartments | 15 (48.4%) | 16 (51.6%) |
| 3 or 4 Unit Apartments | 0 (0.0%) | 110 (100.0%) |
| 5 to 9 Unit Apartments | 0 (0.0%) | 0 (0.0%) |
| 10 or more Apartments | 0 (0.0%) | 0 (0.0%) |
| Mobile Home / Other | 11 (100.0%) | 0 (0.0%) |
| Total | 1,911 (75.3%) | 627 (24.7%) |
Housing Structures by Number of Rooms in Plaquemine
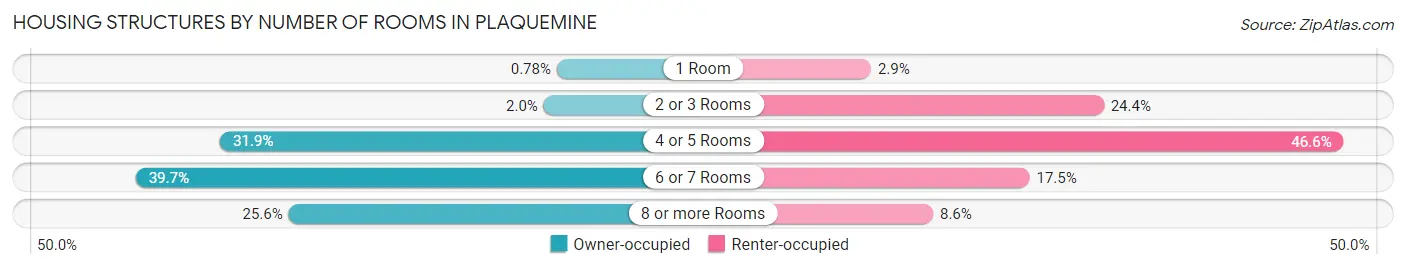
| Number of Rooms | Owner-occupied | Renter-occupied |
| 1 Room | 15 (0.8%) | 18 (2.9%) |
| 2 or 3 Rooms | 38 (2.0%) | 153 (24.4%) |
| 4 or 5 Rooms | 610 (31.9%) | 292 (46.6%) |
| 6 or 7 Rooms | 759 (39.7%) | 110 (17.5%) |
| 8 or more Rooms | 489 (25.6%) | 54 (8.6%) |
| Total | 1,911 (100.0%) | 627 (100.0%) |
Housing Structure by Heating Type in Plaquemine
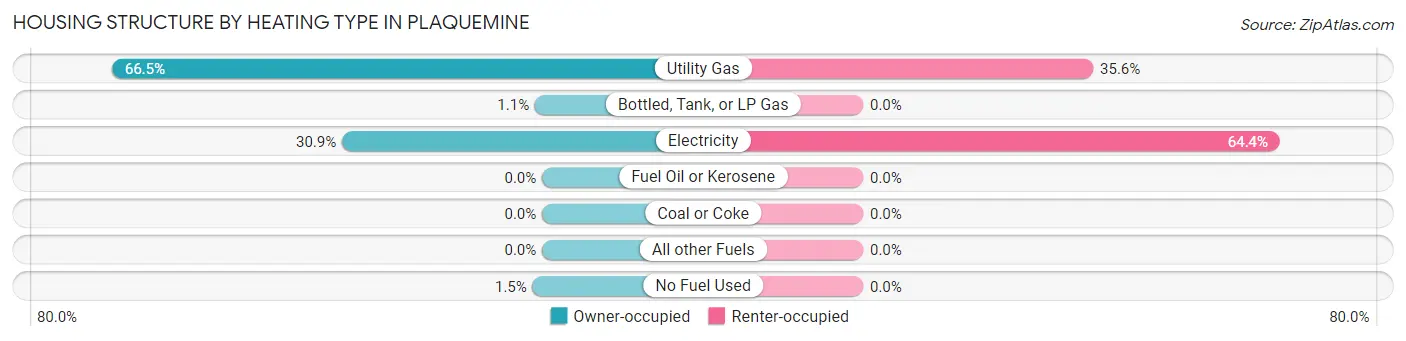
| Heating Type | Owner-occupied | Renter-occupied |
| Utility Gas | 1,271 (66.5%) | 223 (35.6%) |
| Bottled, Tank, or LP Gas | 21 (1.1%) | 0 (0.0%) |
| Electricity | 591 (30.9%) | 404 (64.4%) |
| Fuel Oil or Kerosene | 0 (0.0%) | 0 (0.0%) |
| Coal or Coke | 0 (0.0%) | 0 (0.0%) |
| All other Fuels | 0 (0.0%) | 0 (0.0%) |
| No Fuel Used | 28 (1.5%) | 0 (0.0%) |
| Total | 1,911 (100.0%) | 627 (100.0%) |
Household Vehicle Usage in Plaquemine
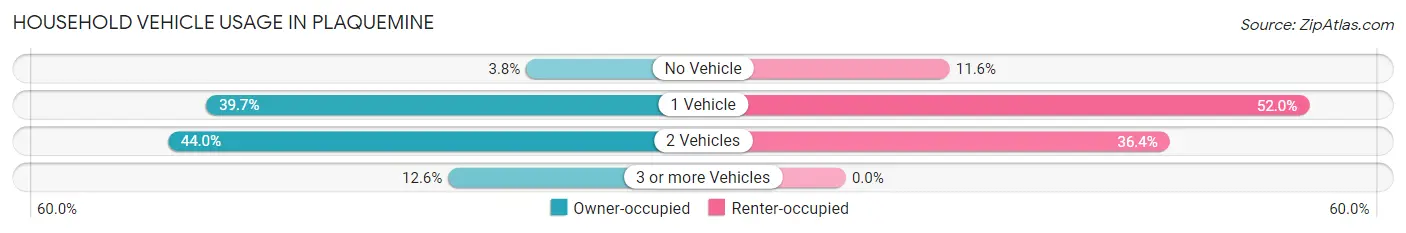
| Vehicles per Household | Owner-occupied | Renter-occupied |
| No Vehicle | 73 (3.8%) | 73 (11.6%) |
| 1 Vehicle | 758 (39.7%) | 326 (52.0%) |
| 2 Vehicles | 840 (44.0%) | 228 (36.4%) |
| 3 or more Vehicles | 240 (12.6%) | 0 (0.0%) |
| Total | 1,911 (100.0%) | 627 (100.0%) |
Real Estate & Mortgages in Plaquemine
Real Estate and Mortgage Overview in Plaquemine
| Characteristic | Without Mortgage | With Mortgage |
| Housing Units | 985 | 926 |
| Median Property Value | $159,600 | $203,000 |
| Median Household Income | $80,262 | $268 |
| Monthly Housing Costs | $362 | $21 |
| Real Estate Taxes | $199 | $26 |
Property Value by Mortgage Status in Plaquemine
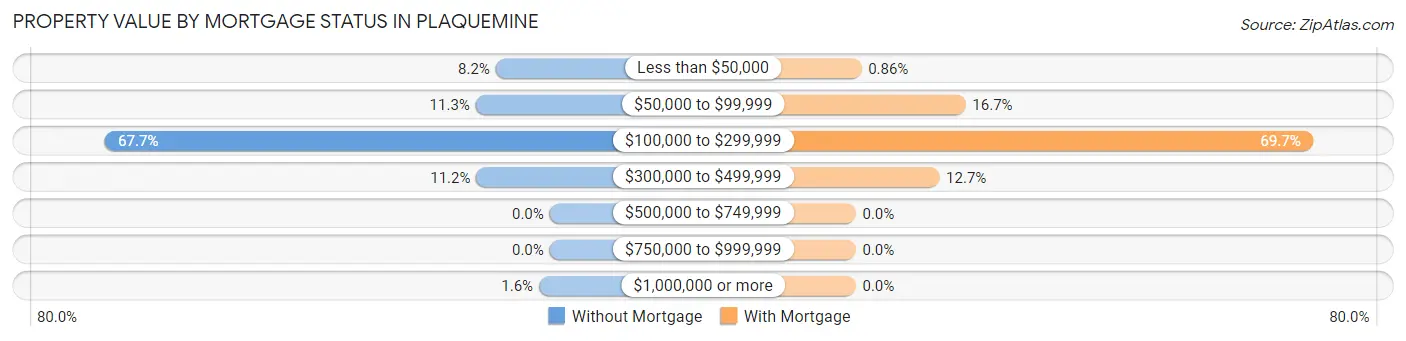
| Property Value | Without Mortgage | With Mortgage |
| Less than $50,000 | 81 (8.2%) | 8 (0.9%) |
| $50,000 to $99,999 | 111 (11.3%) | 155 (16.7%) |
| $100,000 to $299,999 | 667 (67.7%) | 645 (69.7%) |
| $300,000 to $499,999 | 110 (11.2%) | 118 (12.7%) |
| $500,000 to $749,999 | 0 (0.0%) | 0 (0.0%) |
| $750,000 to $999,999 | 0 (0.0%) | 0 (0.0%) |
| $1,000,000 or more | 16 (1.6%) | 0 (0.0%) |
| Total | 985 (100.0%) | 926 (100.0%) |
Household Income by Mortgage Status in Plaquemine
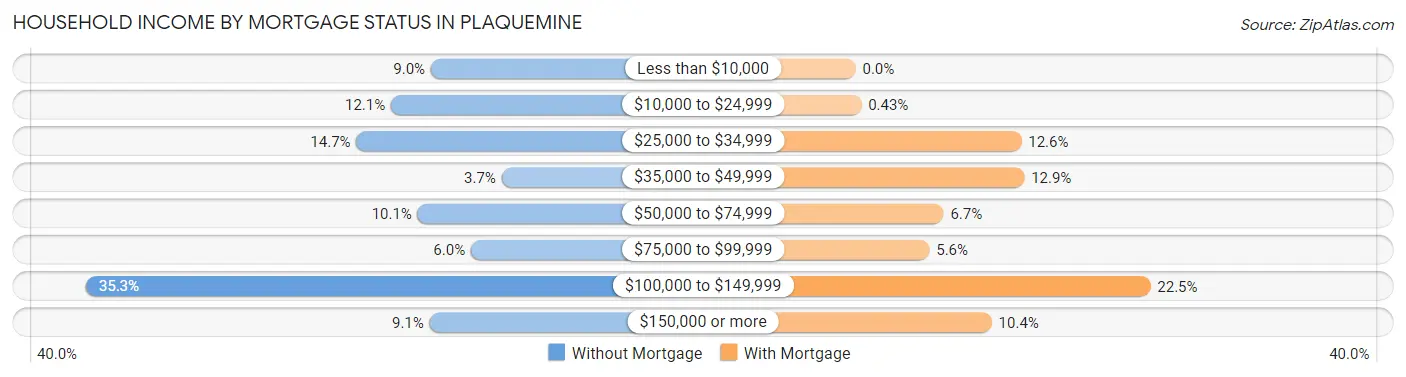
| Household Income | Without Mortgage | With Mortgage |
| Less than $10,000 | 89 (9.0%) | 0 (0.0%) |
| $10,000 to $24,999 | 119 (12.1%) | 4 (0.4%) |
| $25,000 to $34,999 | 145 (14.7%) | 117 (12.6%) |
| $35,000 to $49,999 | 36 (3.6%) | 119 (12.9%) |
| $50,000 to $74,999 | 99 (10.1%) | 62 (6.7%) |
| $75,000 to $99,999 | 59 (6.0%) | 52 (5.6%) |
| $100,000 to $149,999 | 348 (35.3%) | 208 (22.5%) |
| $150,000 or more | 90 (9.1%) | 96 (10.4%) |
| Total | 985 (100.0%) | 926 (100.0%) |
Property Value to Household Income Ratio in Plaquemine
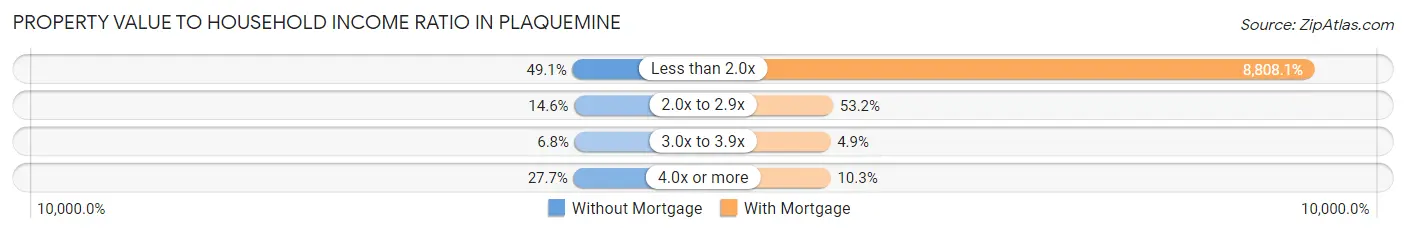
| Value-to-Income Ratio | Without Mortgage | With Mortgage |
| Less than 2.0x | 484 (49.1%) | 81,563 (8,808.1%) |
| 2.0x to 2.9x | 144 (14.6%) | 493 (53.2%) |
| 3.0x to 3.9x | 67 (6.8%) | 45 (4.9%) |
| 4.0x or more | 273 (27.7%) | 95 (10.3%) |
| Total | 985 (100.0%) | 926 (100.0%) |
Real Estate Taxes by Mortgage Status in Plaquemine
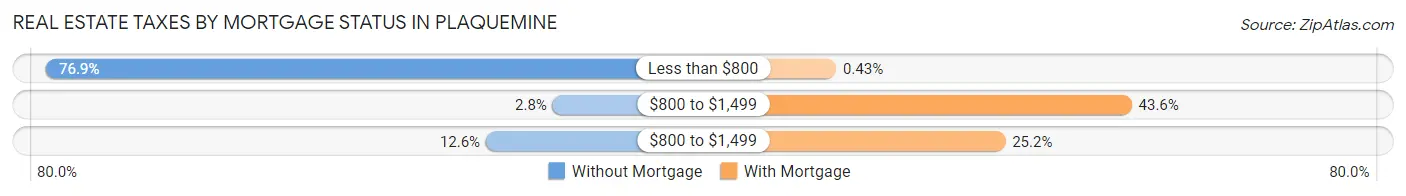
| Property Taxes | Without Mortgage | With Mortgage |
| Less than $800 | 757 (76.8%) | 4 (0.4%) |
| $800 to $1,499 | 28 (2.8%) | 404 (43.6%) |
| $800 to $1,499 | 124 (12.6%) | 233 (25.2%) |
| Total | 985 (100.0%) | 926 (100.0%) |
Health & Disability in Plaquemine
Health Insurance Coverage by Age in Plaquemine
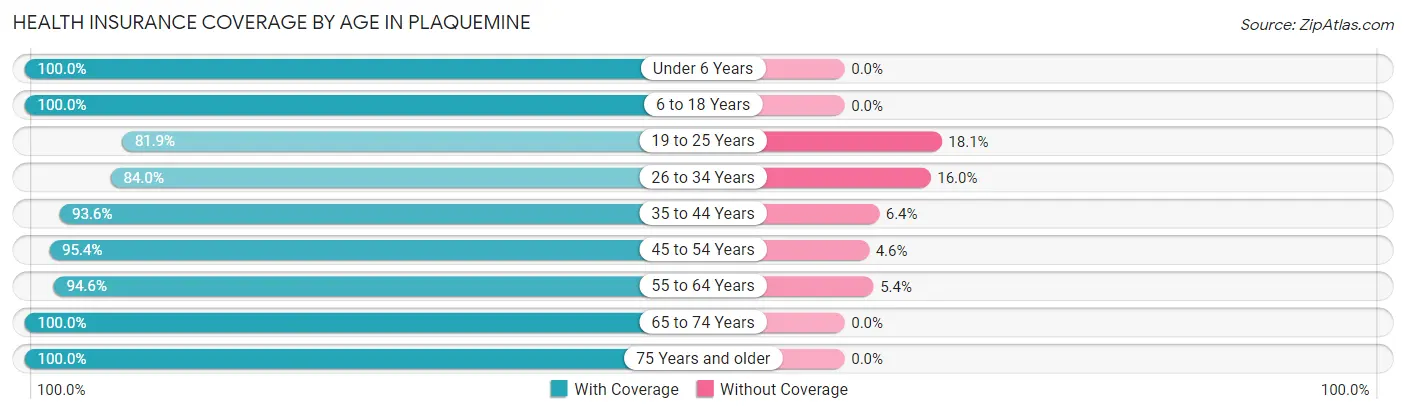
| Age Bracket | With Coverage | Without Coverage |
| Under 6 Years | 404 (100.0%) | 0 (0.0%) |
| 6 to 18 Years | 1,386 (100.0%) | 0 (0.0%) |
| 19 to 25 Years | 217 (81.9%) | 48 (18.1%) |
| 26 to 34 Years | 241 (84.0%) | 46 (16.0%) |
| 35 to 44 Years | 975 (93.6%) | 67 (6.4%) |
| 45 to 54 Years | 754 (95.4%) | 36 (4.6%) |
| 55 to 64 Years | 806 (94.6%) | 46 (5.4%) |
| 65 to 74 Years | 503 (100.0%) | 0 (0.0%) |
| 75 Years and older | 626 (100.0%) | 0 (0.0%) |
| Total | 5,912 (96.1%) | 243 (4.0%) |
Health Insurance Coverage by Citizenship Status in Plaquemine
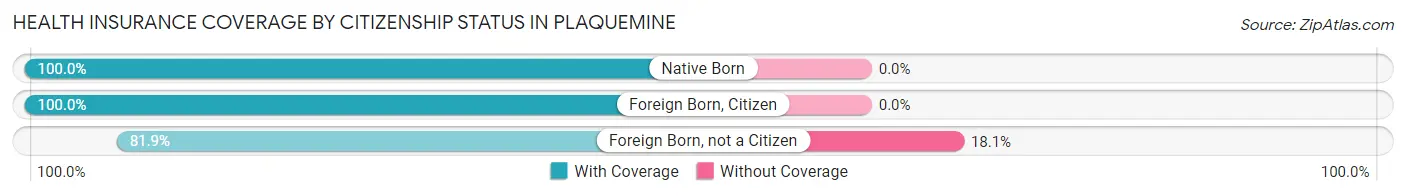
| Citizenship Status | With Coverage | Without Coverage |
| Native Born | 404 (100.0%) | 0 (0.0%) |
| Foreign Born, Citizen | 1,386 (100.0%) | 0 (0.0%) |
| Foreign Born, not a Citizen | 217 (81.9%) | 48 (18.1%) |
Health Insurance Coverage by Household Income in Plaquemine
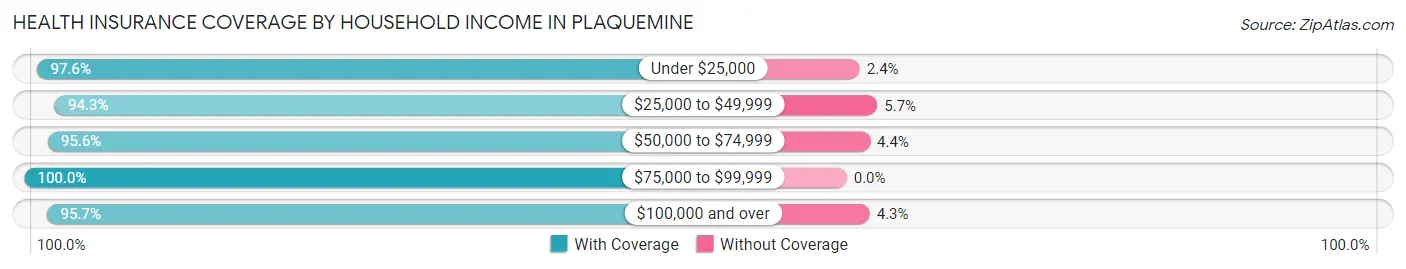
| Household Income | With Coverage | Without Coverage |
| Under $25,000 | 719 (97.6%) | 18 (2.4%) |
| $25,000 to $49,999 | 1,301 (94.3%) | 79 (5.7%) |
| $50,000 to $74,999 | 810 (95.6%) | 37 (4.4%) |
| $75,000 to $99,999 | 667 (100.0%) | 0 (0.0%) |
| $100,000 and over | 2,396 (95.7%) | 108 (4.3%) |
Public vs Private Health Insurance Coverage by Age in Plaquemine
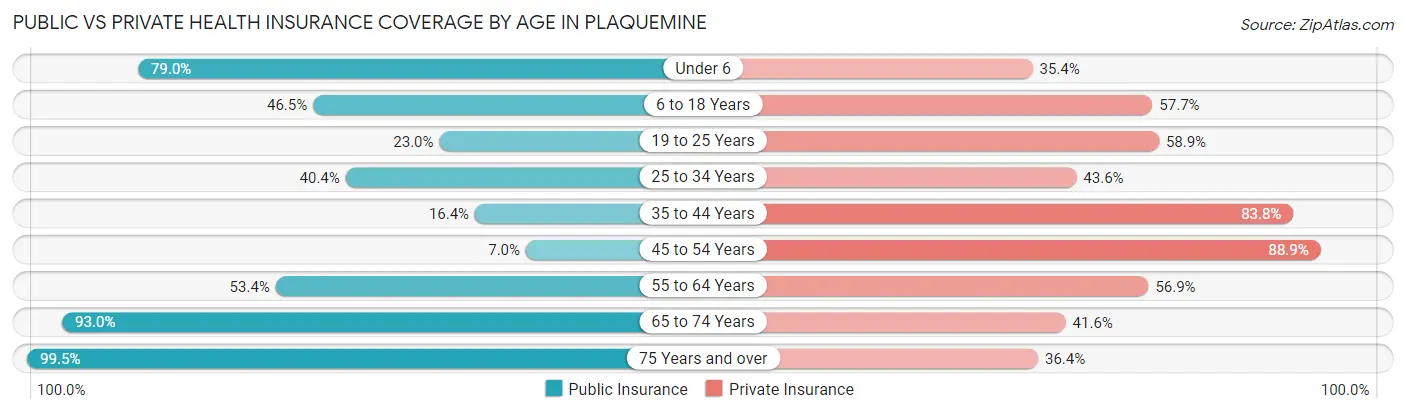
| Age Bracket | Public Insurance | Private Insurance |
| Under 6 | 319 (79.0%) | 143 (35.4%) |
| 6 to 18 Years | 644 (46.5%) | 799 (57.7%) |
| 19 to 25 Years | 61 (23.0%) | 156 (58.9%) |
| 25 to 34 Years | 116 (40.4%) | 125 (43.5%) |
| 35 to 44 Years | 171 (16.4%) | 873 (83.8%) |
| 45 to 54 Years | 55 (7.0%) | 702 (88.9%) |
| 55 to 64 Years | 455 (53.4%) | 485 (56.9%) |
| 65 to 74 Years | 468 (93.0%) | 209 (41.5%) |
| 75 Years and over | 623 (99.5%) | 228 (36.4%) |
| Total | 2,912 (47.3%) | 3,720 (60.4%) |
Disability Status by Sex by Age in Plaquemine
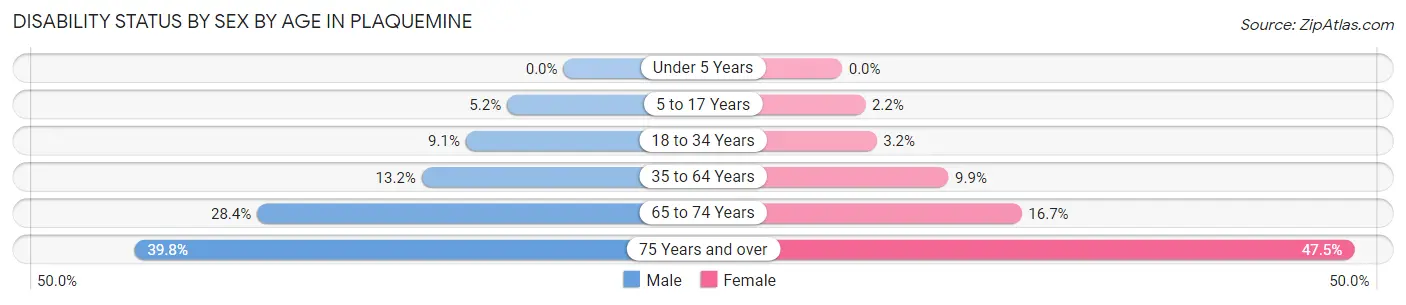
| Age Bracket | Male | Female |
| Under 5 Years | 0 (0.0%) | 0 (0.0%) |
| 5 to 17 Years | 34 (5.2%) | 16 (2.1%) |
| 18 to 34 Years | 29 (9.1%) | 8 (3.2%) |
| 35 to 64 Years | 165 (13.2%) | 141 (9.9%) |
| 65 to 74 Years | 56 (28.4%) | 51 (16.7%) |
| 75 Years and over | 80 (39.8%) | 202 (47.5%) |
Disability Class by Sex by Age in Plaquemine
Disability Class: Hearing Difficulty
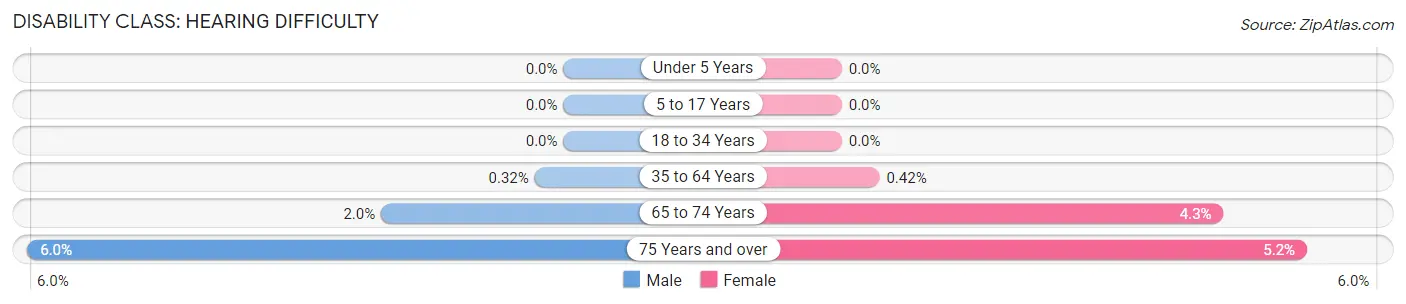
| Age Bracket | Male | Female |
| Under 5 Years | 0 (0.0%) | 0 (0.0%) |
| 5 to 17 Years | 0 (0.0%) | 0 (0.0%) |
| 18 to 34 Years | 0 (0.0%) | 0 (0.0%) |
| 35 to 64 Years | 4 (0.3%) | 6 (0.4%) |
| 65 to 74 Years | 4 (2.0%) | 13 (4.3%) |
| 75 Years and over | 12 (6.0%) | 22 (5.2%) |
Disability Class: Vision Difficulty
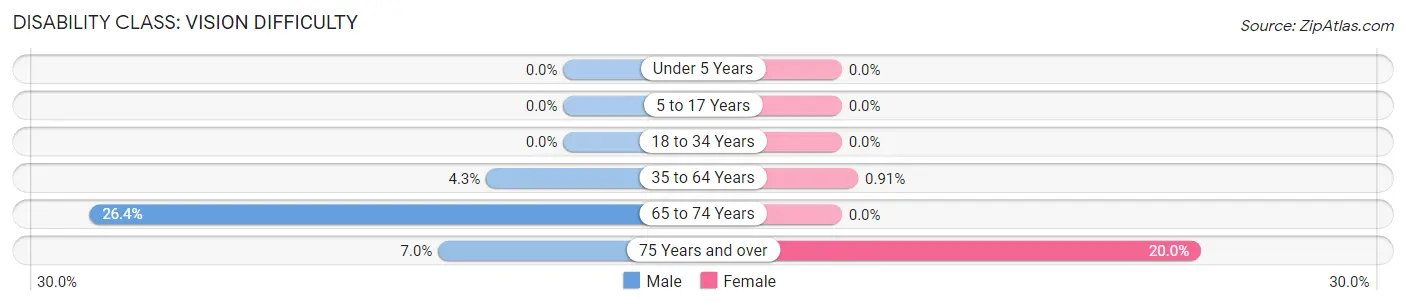
| Age Bracket | Male | Female |
| Under 5 Years | 0 (0.0%) | 0 (0.0%) |
| 5 to 17 Years | 0 (0.0%) | 0 (0.0%) |
| 18 to 34 Years | 0 (0.0%) | 0 (0.0%) |
| 35 to 64 Years | 54 (4.3%) | 13 (0.9%) |
| 65 to 74 Years | 52 (26.4%) | 0 (0.0%) |
| 75 Years and over | 14 (7.0%) | 85 (20.0%) |
Disability Class: Cognitive Difficulty
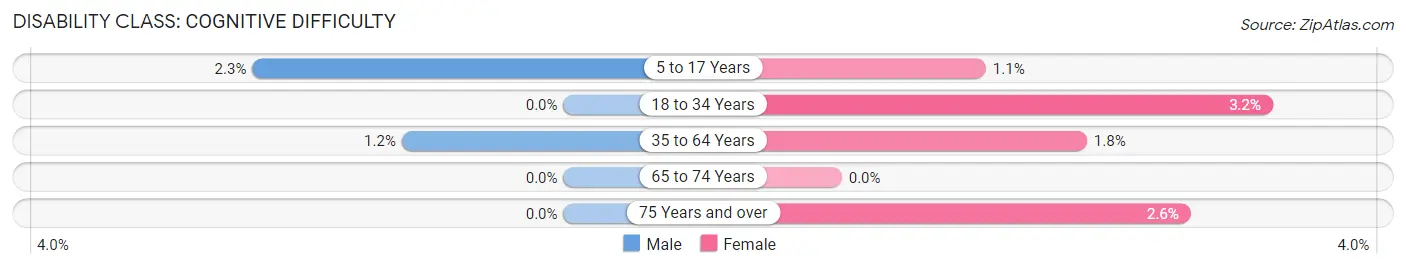
| Age Bracket | Male | Female |
| 5 to 17 Years | 15 (2.3%) | 8 (1.1%) |
| 18 to 34 Years | 0 (0.0%) | 8 (3.2%) |
| 35 to 64 Years | 15 (1.2%) | 26 (1.8%) |
| 65 to 74 Years | 0 (0.0%) | 0 (0.0%) |
| 75 Years and over | 0 (0.0%) | 11 (2.6%) |
Disability Class: Ambulatory Difficulty
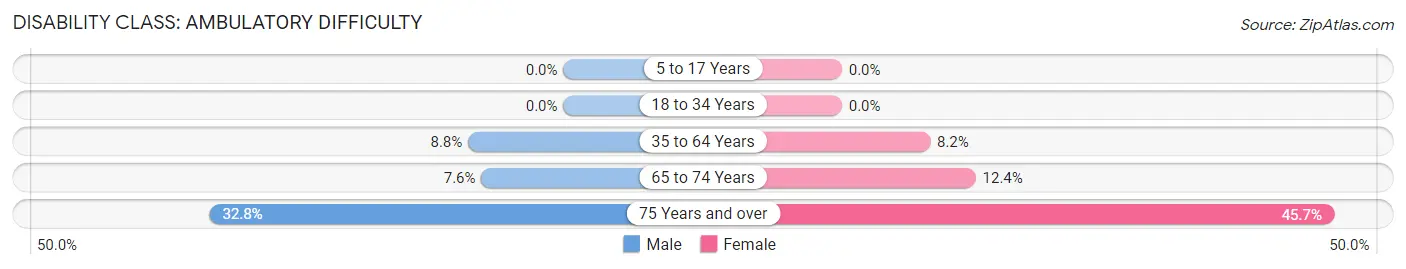
| Age Bracket | Male | Female |
| 5 to 17 Years | 0 (0.0%) | 0 (0.0%) |
| 18 to 34 Years | 0 (0.0%) | 0 (0.0%) |
| 35 to 64 Years | 111 (8.8%) | 117 (8.2%) |
| 65 to 74 Years | 15 (7.6%) | 38 (12.4%) |
| 75 Years and over | 66 (32.8%) | 194 (45.7%) |
Disability Class: Self-Care Difficulty
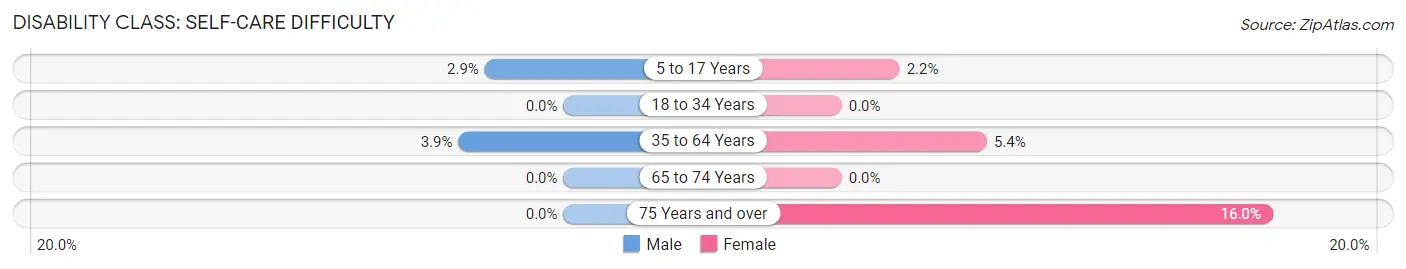
| Age Bracket | Male | Female |
| 5 to 17 Years | 19 (2.9%) | 16 (2.1%) |
| 18 to 34 Years | 0 (0.0%) | 0 (0.0%) |
| 35 to 64 Years | 49 (3.9%) | 77 (5.4%) |
| 65 to 74 Years | 0 (0.0%) | 0 (0.0%) |
| 75 Years and over | 0 (0.0%) | 68 (16.0%) |
Technology Access in Plaquemine
Computing Device Access in Plaquemine
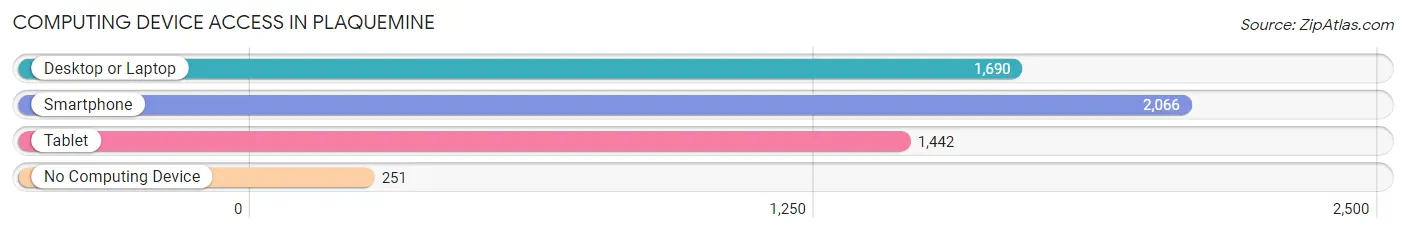
| Device Type | # Households | % Households |
| Desktop or Laptop | 1,690 | 66.6% |
| Smartphone | 2,066 | 81.4% |
| Tablet | 1,442 | 56.8% |
| No Computing Device | 251 | 9.9% |
| Total | 2,538 | 100.0% |
Internet Access in Plaquemine
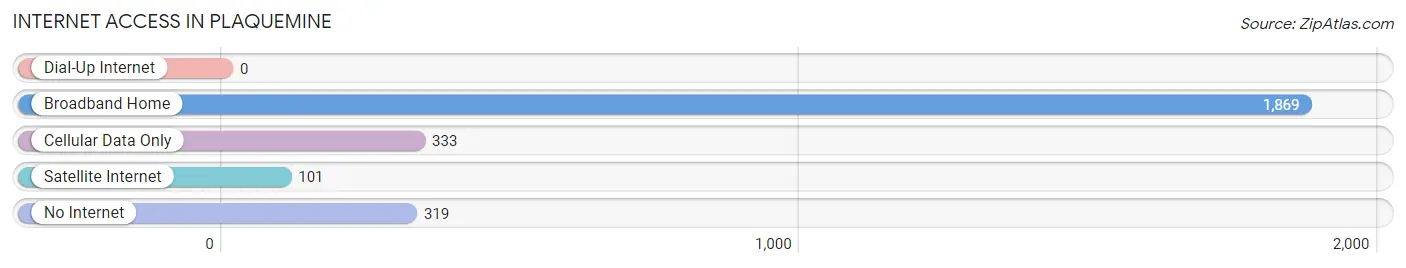
| Internet Type | # Households | % Households |
| Dial-Up Internet | 0 | 0.0% |
| Broadband Home | 1,869 | 73.6% |
| Cellular Data Only | 333 | 13.1% |
| Satellite Internet | 101 | 4.0% |
| No Internet | 319 | 12.6% |
| Total | 2,538 | 100.0% |
Plaquemine Summary
Plaquemine is a city located in Iberville Parish, Louisiana, United States. It is situated on the banks of the Mississippi River, about 30 miles (48 km) south of Baton Rouge. The population was 7,064 at the 2010 census, down from 7,423 in 2000. It is the parish seat of Iberville Parish.
History
The area around Plaquemine was first inhabited by Native Americans, including the Chitimacha, Houma, and Tunica tribes. The first European settlers arrived in the area in the late 1700s, and the city was founded in 1775 by French settlers. The city was named after the Indian word for the local river, Plaquemine.
In the early 1800s, the city became an important port for the cotton and sugar industries. During the Civil War, the city was occupied by Union forces, and the port was used to transport supplies to the Confederate army. After the war, the city experienced a period of growth and prosperity, and by the early 1900s, it had become an important center for the lumber and oil industries.
Geography
Plaquemine is located at 30°17'N 91°17'W (30.2833, -91.2833). According to the United States Census Bureau, the city has a total area of 5.2 square miles (13.4 km2), of which 5.1 square miles (13.2 km2) is land and 0.1 square miles (0.2 km2) (1.90%) is water.
Economy
Plaquemine’s economy is largely based on agriculture, manufacturing, and tourism. The city is home to several large industries, including a paper mill, a sugar refinery, and a chemical plant. The city also has a thriving tourism industry, with many visitors coming to the area to enjoy the city’s historic sites, outdoor activities, and cultural attractions.
Demographics
As of the census of 2000, there were 7,423 people, 2,817 households, and 1,945 families residing in the city. The population density was 1,444.3 people per square mile (558.7/km2). There were 3,093 housing units at an average density of 597.2 per square mile (230.7/km2). The racial makeup of the city was 57.45% White, 40.45% African American, 0.17% Native American, 0.45% Asian, 0.02% Pacific Islander, 0.45% from other races, and 0.99% from two or more races. Hispanic or Latino of any race were 1.45% of the population.
There were 2,817 households, out of which 33.2% had children under the age of 18 living with them, 41.2% were married couples living together, 22.2% had a female householder with no husband present, and 32.2% were non-families. 28.2% of all households were made up of individuals, and 12.7% had someone living alone who was 65 years of age or older. The average household size was 2.60 and the average family size was 3.19.
In the city, the population was spread out, with 28.2% under the age of 18, 8.7% from 18 to 24, 25.7% from 25 to 44, 22.2% from 45 to 64, and 15.2% who were 65 years of age or older. The median age was 36 years. For every 100 females, there were 87.2 males. For every 100 females age 18 and over, there were 81.2 males.
The median income for a household in the city was $27,917, and the median income for a family was $33,917. Males had a median income of $31,250 versus $20,000 for females. The per capita income for the city was $14,845. About 19.2% of families and 22.2% of the population were below the poverty line, including 28.2% of those under age 18 and 20.2% of those age 65 or over.
Common Questions
What is Per Capita Income in Plaquemine?
Per Capita income in Plaquemine is $31,192.
What is the Median Family Income in Plaquemine?
Median Family Income in Plaquemine is $88,388.
What is the Median Household income in Plaquemine?
Median Household Income in Plaquemine is $69,183.
What is Income or Wage Gap in Plaquemine?
Income or Wage Gap in Plaquemine is 8.4%.
Women in Plaquemine earn 91.6 cents for every dollar earned by a man.
What is Inequality or Gini Index in Plaquemine?
Inequality or Gini Index in Plaquemine is 0.44.
What is the Total Population of Plaquemine?
Total Population of Plaquemine is 6,218.
What is the Total Male Population of Plaquemine?
Total Male Population of Plaquemine is 3,003.
What is the Total Female Population of Plaquemine?
Total Female Population of Plaquemine is 3,215.
What is the Ratio of Males per 100 Females in Plaquemine?
There are 93.41 Males per 100 Females in Plaquemine.
What is the Ratio of Females per 100 Males in Plaquemine?
There are 107.06 Females per 100 Males in Plaquemine.
What is the Median Population Age in Plaquemine?
Median Population Age in Plaquemine is 43.4 Years.
What is the Average Family Size in Plaquemine
Average Family Size in Plaquemine is 3.2 People.
What is the Average Household Size in Plaquemine
Average Household Size in Plaquemine is 2.4 People.
How Large is the Labor Force in Plaquemine?
There are 2,865 People in the Labor Forcein in Plaquemine.
What is the Percentage of People in the Labor Force in Plaquemine?
61.0% of People are in the Labor Force in Plaquemine.
What is the Unemployment Rate in Plaquemine?
Unemployment Rate in Plaquemine is 6.2%.