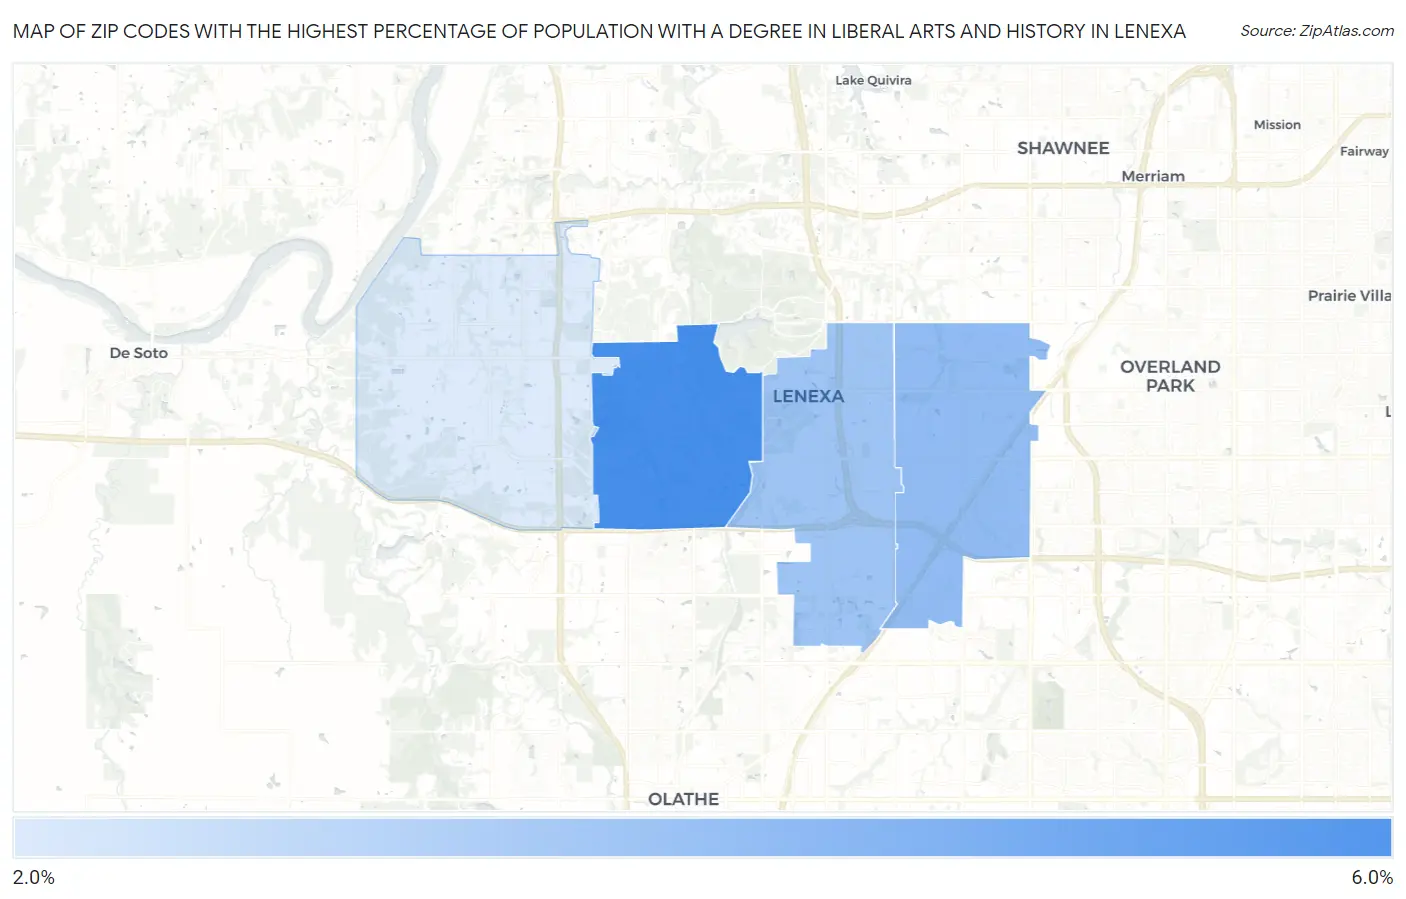
Zip Codes with the Highest Percentage of Population with a Degree in Liberal Arts and History in Lenexa, KS
RELATED REPORTS & OPTIONS
Liberal Arts and History
Lenexa
Compare Zip Codes
Map of Zip Codes with the Highest Percentage of Population with a Degree in Liberal Arts and History in Lenexa
2.1%
5.9%
Zip Codes with the Highest Percentage of Population with a Degree in Liberal Arts and History in Lenexa, KS
| Zip Code | % Graduates | vs State | vs National | |
| 1. | 66220 | 5.9% | 4.6%(+1.36)#163 | 4.9%(+1.05)#8,737 |
| 2. | 66215 | 4.0% | 4.6%(-0.532)#257 | 4.9%(-0.844)#14,671 |
| 3. | 66219 | 3.7% | 4.6%(-0.906)#286 | 4.9%(-1.22)#16,051 |
| 4. | 66227 | 2.1% | 4.6%(-2.49)#395 | 4.9%(-2.80)#21,182 |
1
Common Questions
What are the Top 3 Zip Codes with the Highest Percentage of Population with a Degree in Liberal Arts and History in Lenexa, KS?
Top 3 Zip Codes with the Highest Percentage of Population with a Degree in Liberal Arts and History in Lenexa, KS are:
What zip code has the Highest Percentage of Population with a Degree in Liberal Arts and History in Lenexa, KS?
66220 has the Highest Percentage of Population with a Degree in Liberal Arts and History in Lenexa, KS with 5.9%.
What is the Percentage of Population with a Degree in Liberal Arts and History in Lenexa, KS?
Percentage of Population with a Degree in Liberal Arts and History in Lenexa is 4.0%.
What is the Percentage of Population with a Degree in Liberal Arts and History in Kansas?
Percentage of Population with a Degree in Liberal Arts and History in Kansas is 4.6%.
What is the Percentage of Population with a Degree in Liberal Arts and History in the United States?
Percentage of Population with a Degree in Liberal Arts and History in the United States is 4.9%.