Zip Codes with the Highest Percentage of Population with a Degree in Liberal Arts and History in Lawrence, KS
RELATED REPORTS & OPTIONS
Liberal Arts and History
Lawrence
Compare Zip Codes
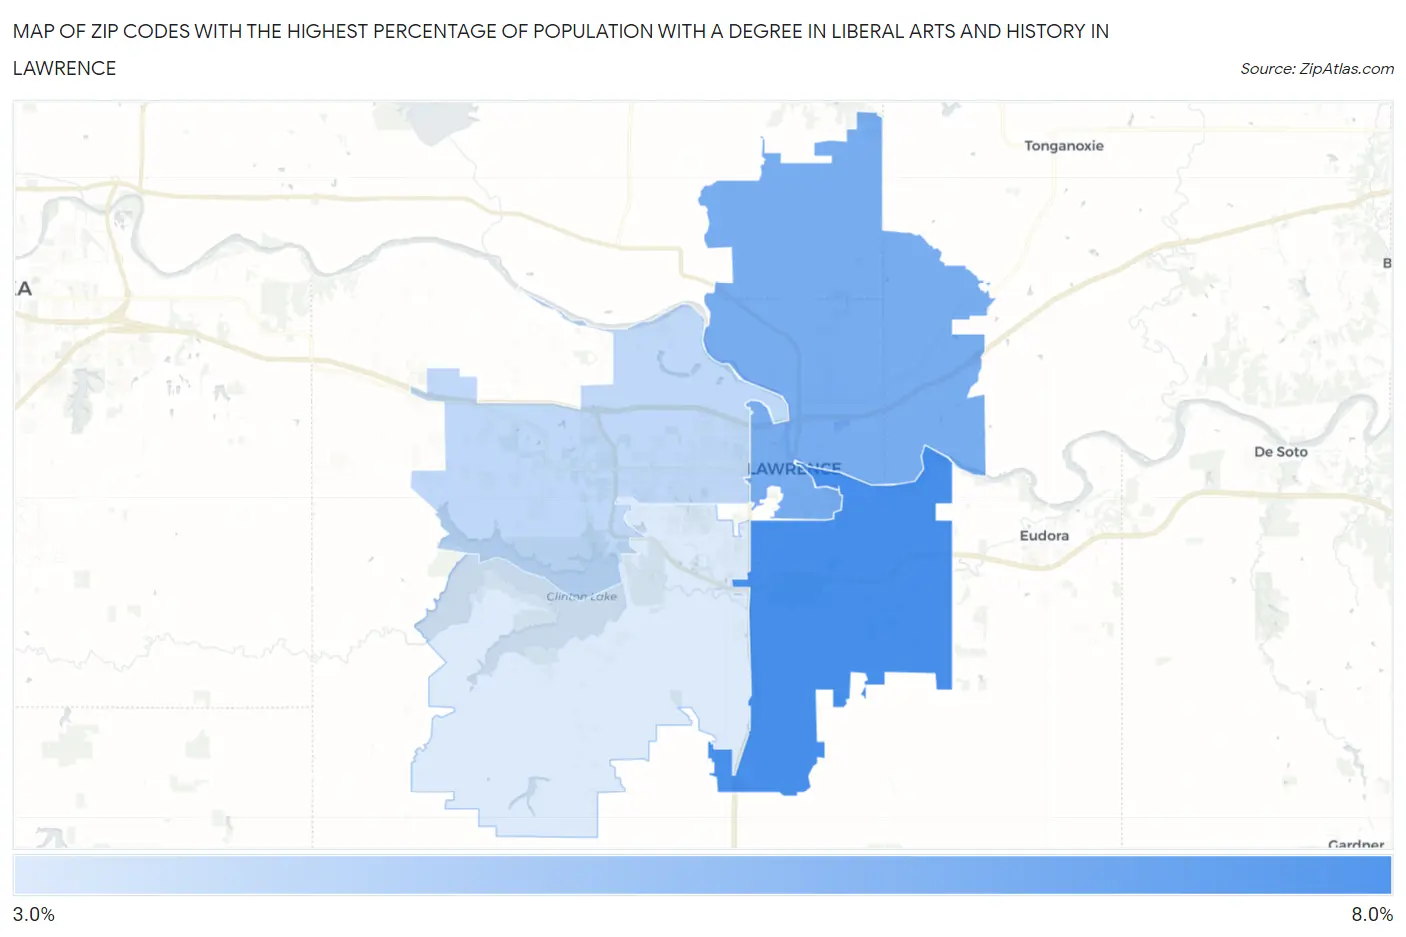
Map of Zip Codes with the Highest Percentage of Population with a Degree in Liberal Arts and History in Lawrence
3.9%
6.9%
Zip Codes with the Highest Percentage of Population with a Degree in Liberal Arts and History in Lawrence, KS
| Zip Code | % Graduates | vs State | vs National | |
| 1. | 66046 | 6.9% | 4.6%(+2.36)#124 | 4.9%(+2.05)#6,529 |
| 2. | 66044 | 5.9% | 4.6%(+1.34)#164 | 4.9%(+1.03)#8,767 |
| 3. | 66049 | 4.5% | 4.6%(-0.082)#234 | 4.9%(-0.393)#13,030 |
| 4. | 66047 | 3.9% | 4.6%(-0.686)#269 | 4.9%(-0.998)#15,250 |
1
Common Questions
What are the Top 3 Zip Codes with the Highest Percentage of Population with a Degree in Liberal Arts and History in Lawrence, KS?
Top 3 Zip Codes with the Highest Percentage of Population with a Degree in Liberal Arts and History in Lawrence, KS are:
What zip code has the Highest Percentage of Population with a Degree in Liberal Arts and History in Lawrence, KS?
66046 has the Highest Percentage of Population with a Degree in Liberal Arts and History in Lawrence, KS with 6.9%.
What is the Percentage of Population with a Degree in Liberal Arts and History in Lawrence, KS?
Percentage of Population with a Degree in Liberal Arts and History in Lawrence is 5.2%.
What is the Percentage of Population with a Degree in Liberal Arts and History in Kansas?
Percentage of Population with a Degree in Liberal Arts and History in Kansas is 4.6%.
What is the Percentage of Population with a Degree in Liberal Arts and History in the United States?
Percentage of Population with a Degree in Liberal Arts and History in the United States is 4.9%.