Zip Codes with the Highest Percentage of Population with a Degree in Liberal Arts and History in Kansas
RELATED REPORTS & OPTIONS
Liberal Arts and History
Kansas
Compare Zip Codes
Map of Zip Codes with the Highest Percentage of Population with a Degree in Liberal Arts and History in Kansas
0.0%
100.0%
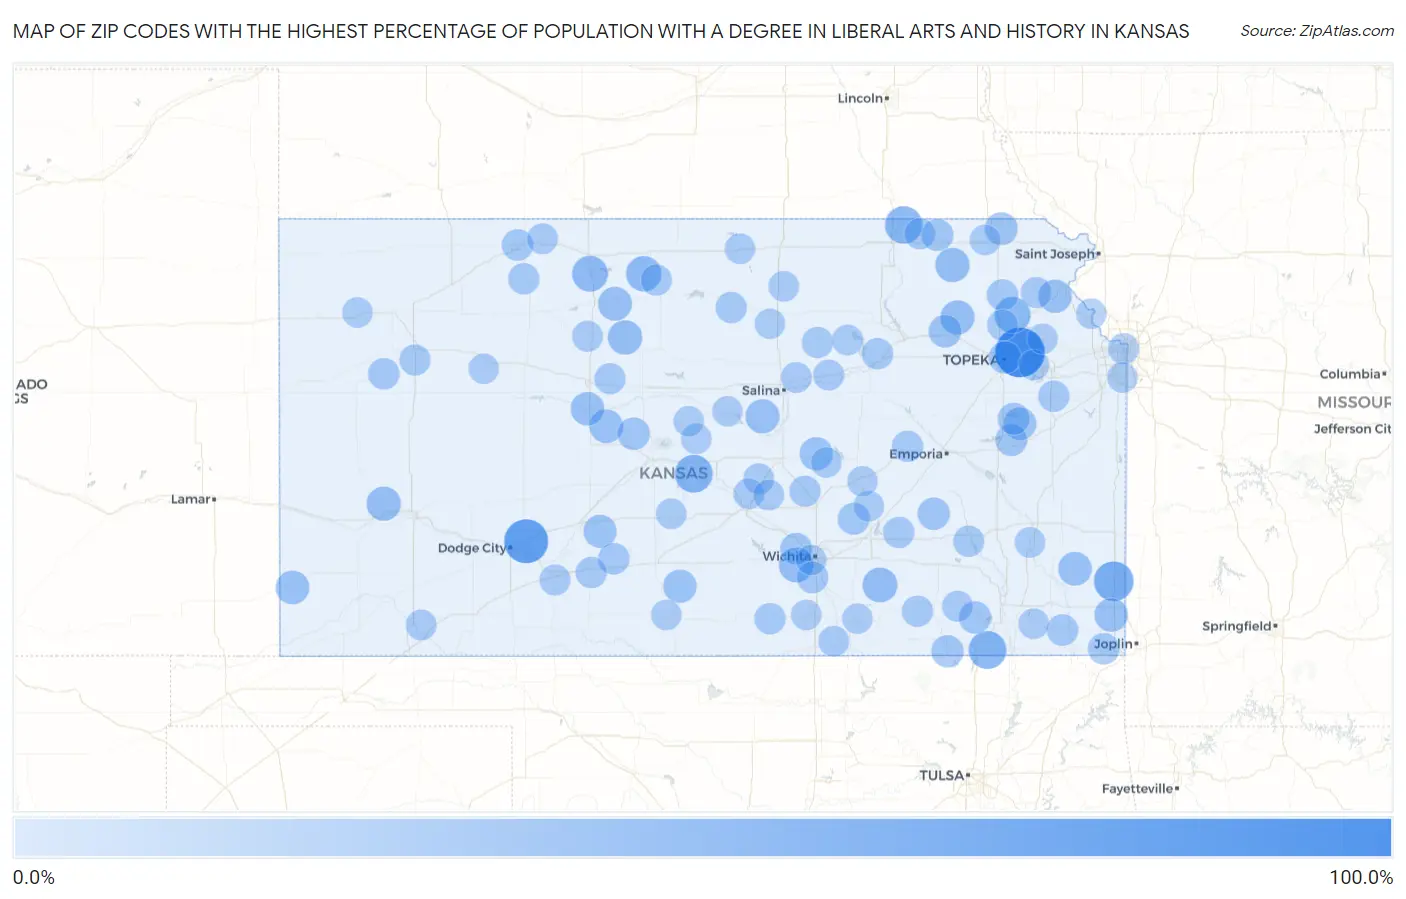
Zip Codes with the Highest Percentage of Population with a Degree in Liberal Arts and History in Kansas
| Zip Code | % Graduates | vs State | vs National | |
| 1. | 66429 | 100.0% | 4.6% (+95.4)#1 | 4.9% (+95.1)#18 |
| 2. | 67882 | 72.7% | 4.6% (+68.2)#2 | 4.9% (+67.9)#73 |
| 3. | 66735 | 51.4% | 4.6% (+46.8)#3 | 4.9% (+46.5)#136 |
| 4. | 67573 | 43.2% | 4.6% (+38.6)#4 | 4.9% (+38.3)#217 |
| 5. | 67364 | 42.9% | 4.6% (+38.3)#5 | 4.9% (+38.0)#222 |
| 6. | 66518 | 41.2% | 4.6% (+36.6)#6 | 4.9% (+36.3)#239 |
| 7. | 66419 | 35.0% | 4.6% (+30.4)#7 | 4.9% (+30.1)#317 |
| 8. | 67639 | 33.3% | 4.6% (+28.8)#8 | 4.9% (+28.5)#350 |
| 9. | 67638 | 31.6% | 4.6% (+27.0)#9 | 4.9% (+26.7)#391 |
| 10. | 67227 | 28.6% | 4.6% (+24.0)#10 | 4.9% (+23.7)#450 |
| 11. | 67008 | 28.4% | 4.6% (+23.9)#11 | 4.9% (+23.6)#452 |
| 12. | 67651 | 26.7% | 4.6% (+22.2)#12 | 4.9% (+21.9)#509 |
| 13. | 66415 | 26.4% | 4.6% (+21.8)#13 | 4.9% (+21.5)#520 |
| 14. | 67838 | 25.9% | 4.6% (+21.3)#14 | 4.9% (+21.0)#542 |
| 15. | 66422 | 25.7% | 4.6% (+21.2)#15 | 4.9% (+20.8)#549 |
| 16. | 67442 | 25.0% | 4.6% (+20.4)#16 | 4.9% (+20.1)#579 |
| 17. | 67675 | 24.3% | 4.6% (+19.8)#17 | 4.9% (+19.5)#616 |
| 18. | 67520 | 23.6% | 4.6% (+19.1)#18 | 4.9% (+18.8)#646 |
| 19. | 66780 | 23.1% | 4.6% (+18.5)#19 | 4.9% (+18.2)#676 |
| 20. | 67862 | 22.6% | 4.6% (+18.0)#20 | 4.9% (+17.7)#704 |
| 21. | 67667 | 22.4% | 4.6% (+17.9)#21 | 4.9% (+17.6)#711 |
| 22. | 66781 | 22.2% | 4.6% (+17.7)#22 | 4.9% (+17.4)#718 |
| 23. | 66016 | 21.8% | 4.6% (+17.3)#23 | 4.9% (+17.0)#745 |
| 24. | 67065 | 21.7% | 4.6% (+17.1)#24 | 4.9% (+16.8)#755 |
| 25. | 67073 | 21.2% | 4.6% (+16.7)#25 | 4.9% (+16.4)#782 |
| 26. | 67552 | 20.4% | 4.6% (+15.8)#26 | 4.9% (+15.5)#833 |
| 27. | 66515 | 19.0% | 4.6% (+14.5)#27 | 4.9% (+14.2)#930 |
| 28. | 66528 | 18.5% | 4.6% (+14.0)#28 | 4.9% (+13.7)#972 |
| 29. | 66407 | 18.5% | 4.6% (+13.9)#29 | 4.9% (+13.6)#980 |
| 30. | 67564 | 17.9% | 4.6% (+13.3)#30 | 4.9% (+13.0)#1,053 |
| 31. | 66853 | 17.5% | 4.6% (+12.9)#31 | 4.9% (+12.6)#1,082 |
| 32. | 66603 | 16.9% | 4.6% (+12.4)#32 | 4.9% (+12.1)#1,135 |
| 33. | 67344 | 16.7% | 4.6% (+12.1)#33 | 4.9% (+11.8)#1,159 |
| 34. | 67334 | 16.7% | 4.6% (+12.1)#34 | 4.9% (+11.8)#1,179 |
| 35. | 66510 | 15.6% | 4.6% (+11.0)#35 | 4.9% (+10.7)#1,318 |
| 36. | 66543 | 15.2% | 4.6% (+10.7)#36 | 4.9% (+10.3)#1,381 |
| 37. | 67123 | 15.0% | 4.6% (+10.5)#37 | 4.9% (+10.2)#1,411 |
| 38. | 66403 | 14.9% | 4.6% (+10.3)#38 | 4.9% (+9.98)#1,448 |
| 39. | 67223 | 14.8% | 4.6% (+10.3)#39 | 4.9% (+9.94)#1,458 |
| 40. | 67060 | 13.6% | 4.6% (+9.05)#40 | 4.9% (+8.74)#1,737 |
| 41. | 67059 | 13.4% | 4.6% (+8.84)#41 | 4.9% (+8.52)#1,803 |
| 42. | 67356 | 13.2% | 4.6% (+8.66)#42 | 4.9% (+8.35)#1,843 |
| 43. | 67764 | 13.0% | 4.6% (+8.48)#43 | 4.9% (+8.17)#1,902 |
| 44. | 66436 | 12.9% | 4.6% (+8.35)#44 | 4.9% (+8.03)#1,933 |
| 45. | 67654 | 12.9% | 4.6% (+8.34)#45 | 4.9% (+8.03)#1,939 |
| 46. | 66713 | 12.6% | 4.6% (+8.09)#46 | 4.9% (+7.78)#1,999 |
| 47. | 66442 | 12.3% | 4.6% (+7.78)#47 | 4.9% (+7.47)#2,097 |
| 48. | 67132 | 12.3% | 4.6% (+7.77)#48 | 4.9% (+7.46)#2,099 |
| 49. | 67420 | 12.3% | 4.6% (+7.71)#49 | 4.9% (+7.40)#2,117 |
| 50. | 67004 | 12.2% | 4.6% (+7.61)#50 | 4.9% (+7.30)#2,147 |
| 51. | 67645 | 12.1% | 4.6% (+7.54)#51 | 4.9% (+7.22)#2,180 |
| 52. | 66006 | 11.8% | 4.6% (+7.24)#52 | 4.9% (+6.93)#2,263 |
| 53. | 66869 | 11.8% | 4.6% (+7.20)#53 | 4.9% (+6.89)#2,273 |
| 54. | 67054 | 11.7% | 4.6% (+7.11)#54 | 4.9% (+6.80)#2,308 |
| 55. | 67346 | 11.6% | 4.6% (+7.07)#55 | 4.9% (+6.76)#2,319 |
| 56. | 67474 | 11.6% | 4.6% (+7.07)#56 | 4.9% (+6.76)#2,320 |
| 57. | 67458 | 11.4% | 4.6% (+6.87)#57 | 4.9% (+6.56)#2,384 |
| 58. | 66777 | 11.4% | 4.6% (+6.80)#58 | 4.9% (+6.49)#2,420 |
| 59. | 67062 | 11.3% | 4.6% (+6.70)#59 | 4.9% (+6.39)#2,451 |
| 60. | 66406 | 11.1% | 4.6% (+6.55)#60 | 4.9% (+6.24)#2,512 |
| 61. | 67748 | 11.0% | 4.6% (+6.40)#61 | 4.9% (+6.09)#2,574 |
| 62. | 67671 | 10.8% | 4.6% (+6.25)#62 | 4.9% (+5.94)#2,641 |
| 63. | 66023 | 10.7% | 4.6% (+6.15)#63 | 4.9% (+5.84)#2,683 |
| 64. | 66101 | 10.6% | 4.6% (+6.01)#64 | 4.9% (+5.70)#2,778 |
| 65. | 67663 | 10.5% | 4.6% (+5.97)#65 | 4.9% (+5.65)#2,800 |
| 66. | 66440 | 10.4% | 4.6% (+5.86)#66 | 4.9% (+5.55)#2,849 |
| 67. | 67622 | 10.4% | 4.6% (+5.82)#67 | 4.9% (+5.51)#2,877 |
| 68. | 67834 | 10.3% | 4.6% (+5.77)#68 | 4.9% (+5.46)#2,908 |
| 69. | 67410 | 10.3% | 4.6% (+5.71)#69 | 4.9% (+5.40)#2,952 |
| 70. | 67352 | 10.2% | 4.6% (+5.64)#70 | 4.9% (+5.33)#2,996 |
| 71. | 67546 | 9.7% | 4.6% (+5.12)#71 | 4.9% (+4.81)#3,316 |
| 72. | 67470 | 9.6% | 4.6% (+5.05)#72 | 4.9% (+4.74)#3,360 |
| 73. | 67487 | 9.6% | 4.6% (+4.99)#73 | 4.9% (+4.68)#3,408 |
| 74. | 67502 | 9.4% | 4.6% (+4.85)#74 | 4.9% (+4.54)#3,518 |
| 75. | 67859 | 9.4% | 4.6% (+4.79)#75 | 4.9% (+4.48)#3,554 |
| 76. | 67051 | 9.3% | 4.6% (+4.74)#76 | 4.9% (+4.43)#3,603 |
| 77. | 66840 | 9.2% | 4.6% (+4.67)#77 | 4.9% (+4.36)#3,663 |
| 78. | 67578 | 9.1% | 4.6% (+4.53)#78 | 4.9% (+4.22)#3,758 |
| 79. | 66901 | 9.1% | 4.6% (+4.50)#79 | 4.9% (+4.19)#3,795 |
| 80. | 67522 | 9.0% | 4.6% (+4.45)#80 | 4.9% (+4.13)#3,849 |
| 81. | 66050 | 8.9% | 4.6% (+4.37)#81 | 4.9% (+4.06)#3,909 |
| 82. | 66534 | 8.9% | 4.6% (+4.33)#82 | 4.9% (+4.02)#3,946 |
| 83. | 66942 | 8.8% | 4.6% (+4.26)#83 | 4.9% (+3.95)#4,009 |
| 84. | 67063 | 8.8% | 4.6% (+4.24)#84 | 4.9% (+3.93)#4,035 |
| 85. | 66748 | 8.8% | 4.6% (+4.21)#85 | 4.9% (+3.89)#4,065 |
| 86. | 67213 | 8.7% | 4.6% (+4.14)#86 | 4.9% (+3.82)#4,124 |
| 87. | 67354 | 8.7% | 4.6% (+4.14)#87 | 4.9% (+3.82)#4,131 |
| 88. | 67732 | 8.6% | 4.6% (+4.01)#88 | 4.9% (+3.70)#4,270 |
| 89. | 67427 | 8.6% | 4.6% (+4.01)#89 | 4.9% (+3.70)#4,272 |
| 90. | 67450 | 8.6% | 4.6% (+4.00)#90 | 4.9% (+3.68)#4,284 |
| 91. | 67104 | 8.4% | 4.6% (+3.86)#91 | 4.9% (+3.55)#4,425 |
| 92. | 66066 | 8.3% | 4.6% (+3.77)#92 | 4.9% (+3.46)#4,508 |
| 93. | 67156 | 8.3% | 4.6% (+3.73)#93 | 4.9% (+3.42)#4,556 |
| 94. | 67152 | 8.2% | 4.6% (+3.69)#94 | 4.9% (+3.38)#4,602 |
| 95. | 67436 | 8.2% | 4.6% (+3.66)#95 | 4.9% (+3.35)#4,635 |
| 96. | 66211 | 8.1% | 4.6% (+3.53)#96 | 4.9% (+3.22)#4,784 |
| 97. | 67752 | 8.1% | 4.6% (+3.52)#97 | 4.9% (+3.21)#4,798 |
| 98. | 66027 | 8.1% | 4.6% (+3.52)#98 | 4.9% (+3.21)#4,806 |
| 99. | 67454 | 8.1% | 4.6% (+3.50)#99 | 4.9% (+3.19)#4,820 |
| 100. | 66851 | 8.0% | 4.6% (+3.49)#100 | 4.9% (+3.17)#4,843 |
Common Questions
What are the Top 10 Zip Codes with the Highest Percentage of Population with a Degree in Liberal Arts and History in Kansas?
Top 10 Zip Codes with the Highest Percentage of Population with a Degree in Liberal Arts and History in Kansas are:
What zip code has the Highest Percentage of Population with a Degree in Liberal Arts and History in Kansas?
66429 has the Highest Percentage of Population with a Degree in Liberal Arts and History in Kansas with 100.0%.
What is the Percentage of Population with a Degree in Liberal Arts and History in the State of Kansas?
Percentage of Population with a Degree in Liberal Arts and History in Kansas is 4.6%.
What is the Percentage of Population with a Degree in Liberal Arts and History in the United States?
Percentage of Population with a Degree in Liberal Arts and History in the United States is 4.9%.