Zip Codes with the Highest Percentage of Population with a Degree in Liberal Arts and History in Leawood, KS
RELATED REPORTS & OPTIONS
Liberal Arts and History
Leawood
Compare Zip Codes
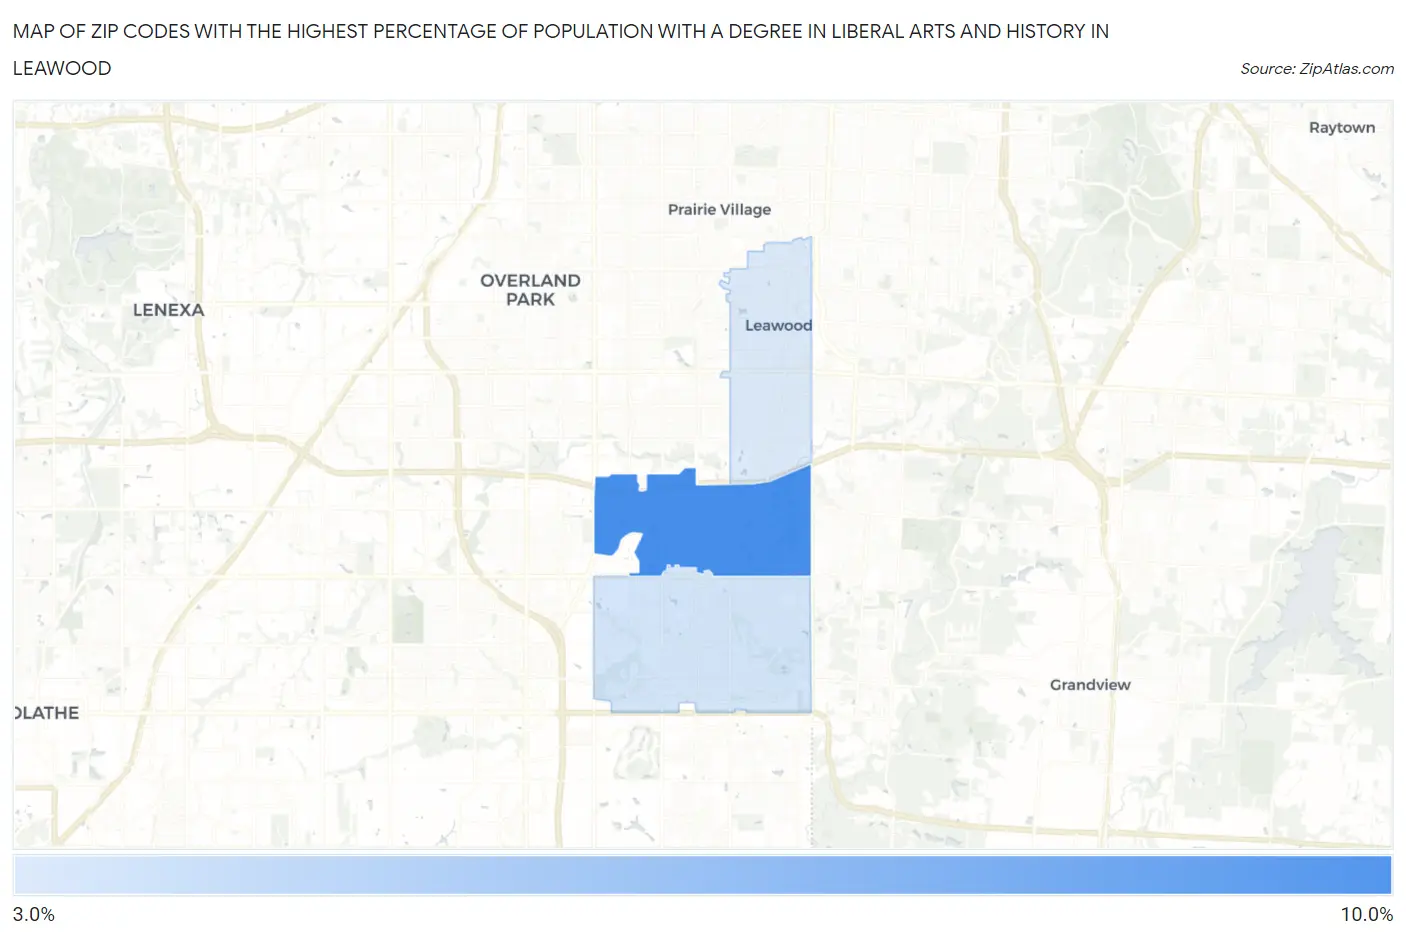
Map of Zip Codes with the Highest Percentage of Population with a Degree in Liberal Arts and History in Leawood
3.3%
8.1%
Zip Codes with the Highest Percentage of Population with a Degree in Liberal Arts and History in Leawood, KS
| Zip Code | % Graduates | vs State | vs National | |
| 1. | 66211 | 8.1% | 4.6%(+3.53)#96 | 4.9%(+3.22)#4,784 |
| 2. | 66209 | 3.6% | 4.6%(-0.979)#290 | 4.9%(-1.29)#16,300 |
| 3. | 66206 | 3.3% | 4.6%(-1.28)#312 | 4.9%(-1.59)#17,369 |
1
Common Questions
What are the Top Zip Codes with the Highest Percentage of Population with a Degree in Liberal Arts and History in Leawood, KS?
Top Zip Codes with the Highest Percentage of Population with a Degree in Liberal Arts and History in Leawood, KS are:
What zip code has the Highest Percentage of Population with a Degree in Liberal Arts and History in Leawood, KS?
66211 has the Highest Percentage of Population with a Degree in Liberal Arts and History in Leawood, KS with 8.1%.
What is the Percentage of Population with a Degree in Liberal Arts and History in Leawood, KS?
Percentage of Population with a Degree in Liberal Arts and History in Leawood is 3.9%.
What is the Percentage of Population with a Degree in Liberal Arts and History in Kansas?
Percentage of Population with a Degree in Liberal Arts and History in Kansas is 4.6%.
What is the Percentage of Population with a Degree in Liberal Arts and History in the United States?
Percentage of Population with a Degree in Liberal Arts and History in the United States is 4.9%.