Kurtistown, HI Map & Demographics
Kurtistown Map
Kurtistown Overview
$33,663
PER CAPITA INCOME
$85,221
AVG FAMILY INCOME
$80,625
AVG HOUSEHOLD INCOME
3.9%
WAGE / INCOME GAP [ % ]
96.1¢/ $1
WAGE / INCOME GAP [ $ ]
0.40
INEQUALITY / GINI INDEX
2,896
TOTAL POPULATION
1,413
MALE POPULATION
1,483
FEMALE POPULATION
95.28
MALES / 100 FEMALES
104.95
FEMALES / 100 MALES
49.4
MEDIAN AGE
3.3
AVG FAMILY SIZE
3.1
AVG HOUSEHOLD SIZE
1,268
LABOR FORCE [ PEOPLE ]
53.3%
PERCENT IN LABOR FORCE
8.0%
UNEMPLOYMENT RATE
Kurtistown Zip Codes
Kurtistown Area Codes
Income in Kurtistown
Income Overview in Kurtistown
Per Capita Income in Kurtistown is $33,663, while median incomes of families and households are $85,221 and $80,625 respectively.
| Characteristic | Number | Measure |
| Per Capita Income | 2,896 | $33,663 |
| Median Family Income | 813 | $85,221 |
| Mean Family Income | 813 | $106,893 |
| Median Household Income | 914 | $80,625 |
| Mean Household Income | 914 | $103,495 |
| Income Deficit | 813 | $0 |
| Wage / Income Gap (%) | 2,896 | 3.90% |
| Wage / Income Gap ($) | 2,896 | 96.10¢ per $1 |
| Gini / Inequality Index | 2,896 | 0.40 |
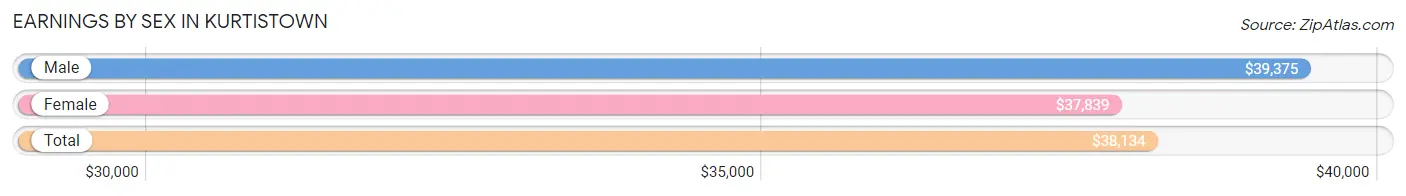
Earnings by Sex in Kurtistown
Average Earnings in Kurtistown are $38,134, $39,375 for men and $37,839 for women, a difference of 3.9%.
| Sex | Number | Average Earnings |
| Male | 727 (55.1%) | $39,375 |
| Female | 592 (44.9%) | $37,839 |
| Total | 1,319 (100.0%) | $38,134 |
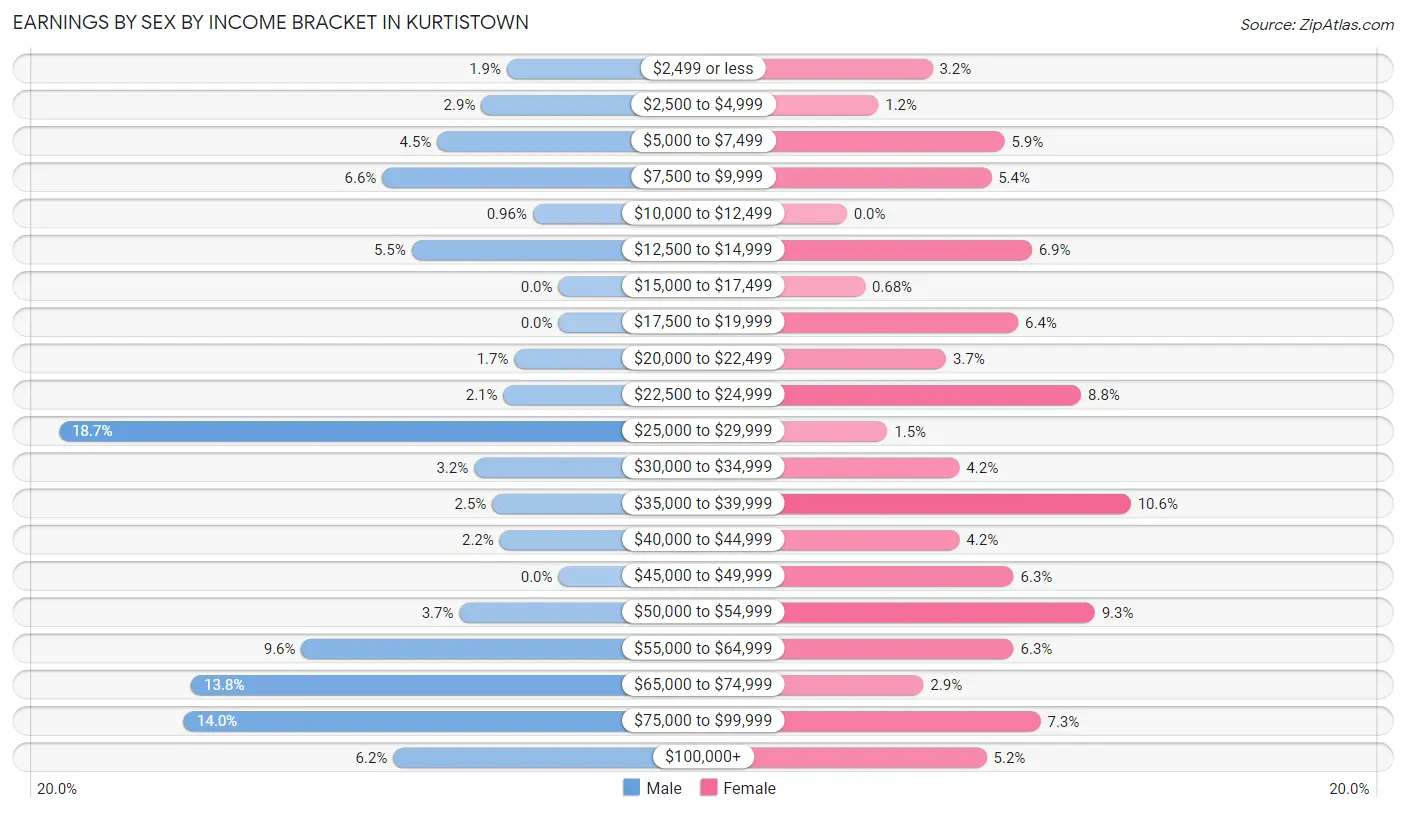
Earnings by Sex by Income Bracket in Kurtistown
The most common earnings brackets in Kurtistown are $25,000 to $29,999 for men (136 | 18.7%) and $35,000 to $39,999 for women (63 | 10.6%).
| Income | Male | Female |
| $2,499 or less | 14 (1.9%) | 19 (3.2%) |
| $2,500 to $4,999 | 21 (2.9%) | 7 (1.2%) |
| $5,000 to $7,499 | 33 (4.5%) | 35 (5.9%) |
| $7,500 to $9,999 | 48 (6.6%) | 32 (5.4%) |
| $10,000 to $12,499 | 7 (1.0%) | 0 (0.0%) |
| $12,500 to $14,999 | 40 (5.5%) | 41 (6.9%) |
| $15,000 to $17,499 | 0 (0.0%) | 4 (0.7%) |
| $17,500 to $19,999 | 0 (0.0%) | 38 (6.4%) |
| $20,000 to $22,499 | 12 (1.7%) | 22 (3.7%) |
| $22,500 to $24,999 | 15 (2.1%) | 52 (8.8%) |
| $25,000 to $29,999 | 136 (18.7%) | 9 (1.5%) |
| $30,000 to $34,999 | 23 (3.2%) | 25 (4.2%) |
| $35,000 to $39,999 | 18 (2.5%) | 63 (10.6%) |
| $40,000 to $44,999 | 16 (2.2%) | 25 (4.2%) |
| $45,000 to $49,999 | 0 (0.0%) | 37 (6.2%) |
| $50,000 to $54,999 | 27 (3.7%) | 55 (9.3%) |
| $55,000 to $64,999 | 70 (9.6%) | 37 (6.2%) |
| $65,000 to $74,999 | 100 (13.8%) | 17 (2.9%) |
| $75,000 to $99,999 | 102 (14.0%) | 43 (7.3%) |
| $100,000+ | 45 (6.2%) | 31 (5.2%) |
| Total | 727 (100.0%) | 592 (100.0%) |
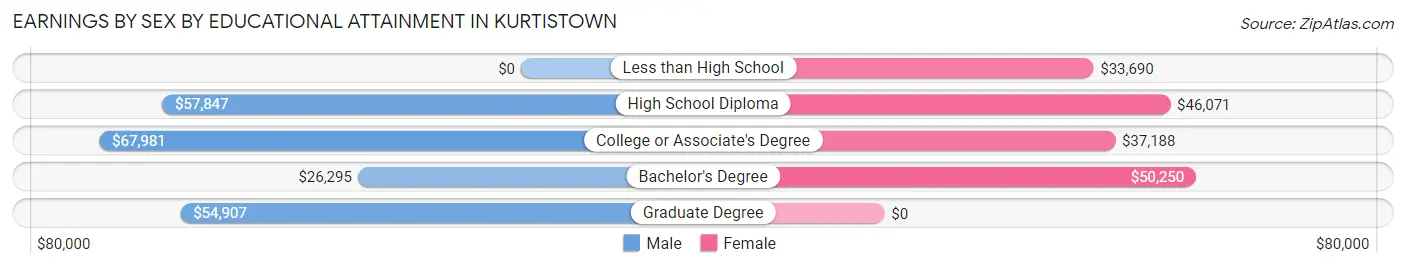
Earnings by Sex by Educational Attainment in Kurtistown
Average earnings in Kurtistown are $40,625 for men and $37,987 for women, a difference of 6.5%. Men with an educational attainment of college or associate's degree enjoy the highest average annual earnings of $67,981, while those with bachelor's degree education earn the least with $26,295. Women with an educational attainment of bachelor's degree earn the most with the average annual earnings of $50,250, while those with less than high school education have the smallest earnings of $33,690.
| Educational Attainment | Male Income | Female Income |
| Less than High School | - | - |
| High School Diploma | $57,847 | $46,071 |
| College or Associate's Degree | $67,981 | $37,188 |
| Bachelor's Degree | $26,295 | $50,250 |
| Graduate Degree | $54,907 | $0 |
| Total | $40,625 | $37,987 |
Family Income in Kurtistown
Family Income Brackets in Kurtistown
According to the Kurtistown family income data, there are 217 families falling into the $50,000 to $74,999 income range, which is the most common income bracket and makes up 26.7% of all families. Conversely, the $25,000 to $34,999 income bracket is the least frequent group with only 12 families (1.5%) belonging to this category.
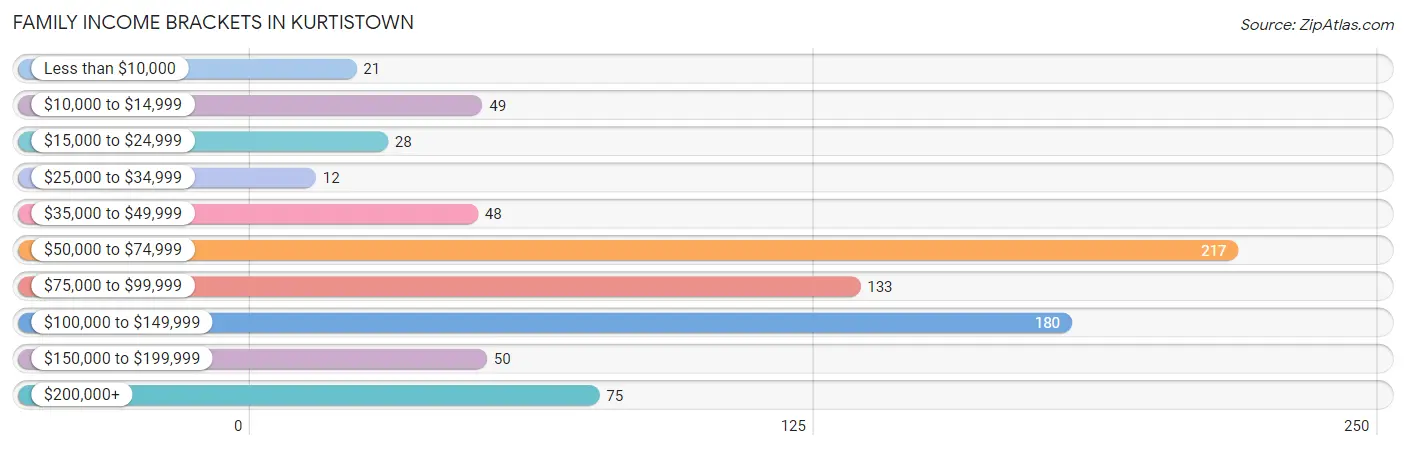
| Income Bracket | # Families | % Families |
| Less than $10,000 | 21 | 2.6% |
| $10,000 to $14,999 | 49 | 6.0% |
| $15,000 to $24,999 | 28 | 3.4% |
| $25,000 to $34,999 | 12 | 1.5% |
| $35,000 to $49,999 | 48 | 5.9% |
| $50,000 to $74,999 | 217 | 26.7% |
| $75,000 to $99,999 | 133 | 16.4% |
| $100,000 to $149,999 | 180 | 22.1% |
| $150,000 to $199,999 | 50 | 6.2% |
| $200,000+ | 75 | 9.2% |
Family Income by Famaliy Size in Kurtistown
7+ person families (37 | 4.5%) account for the highest median family income in Kurtistown with $205,795 per family, while 2-person families (374 | 46.0%) have the highest median income of $44,360 per family member.
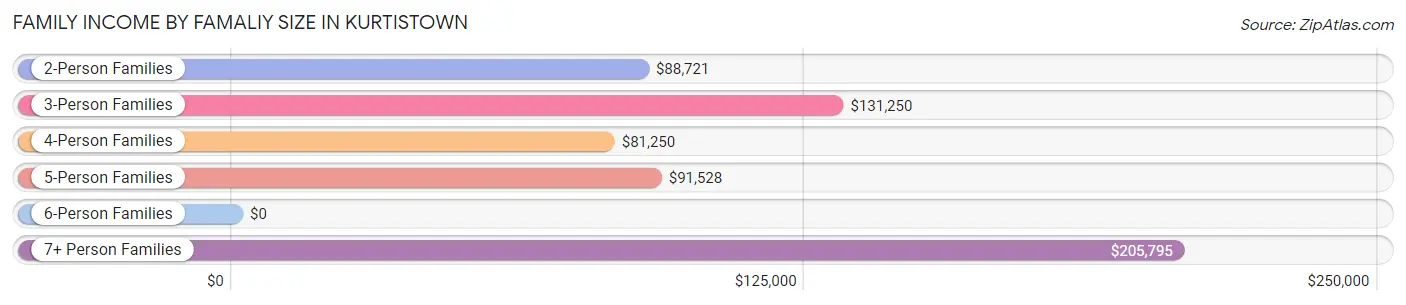
| Income Bracket | # Families | Median Income |
| 2-Person Families | 374 (46.0%) | $88,721 |
| 3-Person Families | 171 (21.0%) | $131,250 |
| 4-Person Families | 78 (9.6%) | $81,250 |
| 5-Person Families | 43 (5.3%) | $91,528 |
| 6-Person Families | 110 (13.5%) | $0 |
| 7+ Person Families | 37 (4.5%) | $205,795 |
| Total | 813 (100.0%) | $85,221 |
Family Income by Number of Earners in Kurtistown
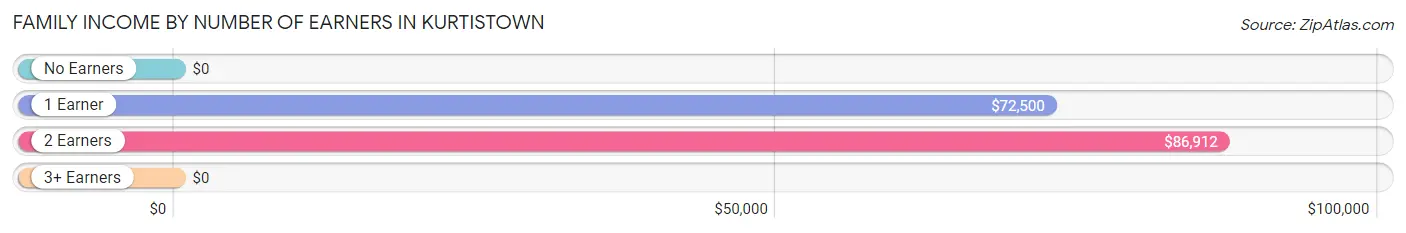
| Number of Earners | # Families | Median Income |
| No Earners | 128 (15.7%) | $0 |
| 1 Earner | 282 (34.7%) | $72,500 |
| 2 Earners | 326 (40.1%) | $86,912 |
| 3+ Earners | 77 (9.5%) | $0 |
| Total | 813 (100.0%) | $85,221 |
Household Income in Kurtistown
Household Income Brackets in Kurtistown
With 242 households falling in the category, the $50,000 to $74,999 income range is the most frequent in Kurtistown, accounting for 26.5% of all households. In contrast, only 18 households (2.0%) fall into the less than $10,000 income bracket, making it the least populous group.
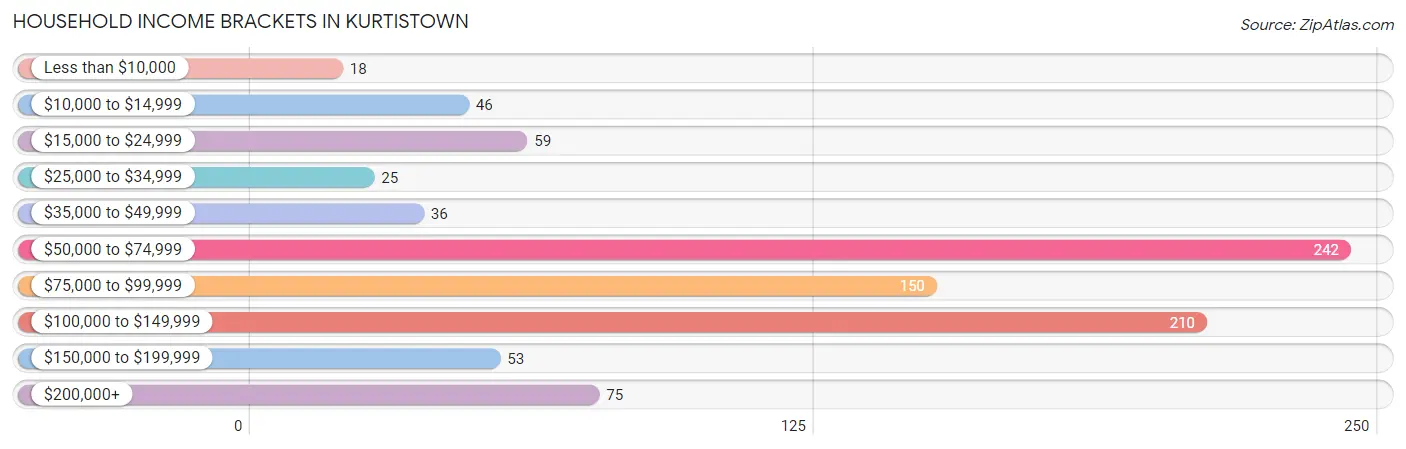
| Income Bracket | # Households | % Households |
| Less than $10,000 | 18 | 2.0% |
| $10,000 to $14,999 | 46 | 5.0% |
| $15,000 to $24,999 | 59 | 6.5% |
| $25,000 to $34,999 | 25 | 2.7% |
| $35,000 to $49,999 | 36 | 3.9% |
| $50,000 to $74,999 | 242 | 26.5% |
| $75,000 to $99,999 | 150 | 16.4% |
| $100,000 to $149,999 | 210 | 23.0% |
| $150,000 to $199,999 | 53 | 5.8% |
| $200,000+ | 75 | 8.2% |
Household Income by Householder Age in Kurtistown
The median household income in Kurtistown is $80,625, with the highest median household income of $87,344 found in the 25 to 44 years age bracket for the primary householder. A total of 127 households (13.9%) fall into this category. Meanwhile, the 15 to 24 years age bracket for the primary householder has the lowest median household income of $0, with 4 households (0.4%) in this group.
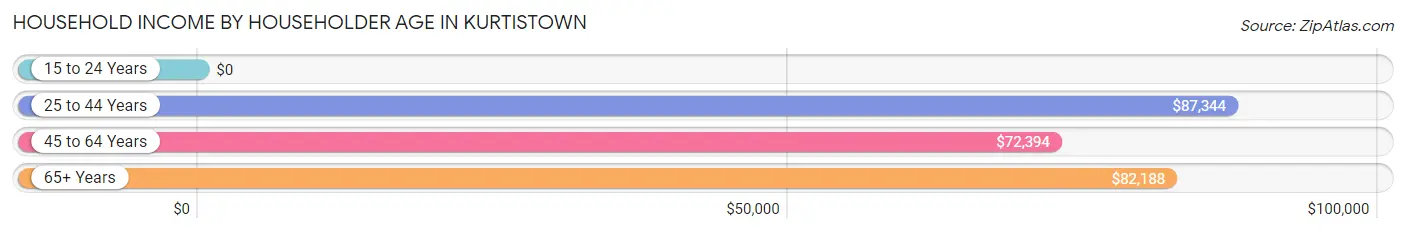
| Income Bracket | # Households | Median Income |
| 15 to 24 Years | 4 (0.4%) | $0 |
| 25 to 44 Years | 127 (13.9%) | $87,344 |
| 45 to 64 Years | 426 (46.6%) | $72,394 |
| 65+ Years | 357 (39.1%) | $82,188 |
| Total | 914 (100.0%) | $80,625 |
Poverty in Kurtistown
Income Below Poverty by Sex and Age in Kurtistown
With 10.1% poverty level for males and 13.6% for females among the residents of Kurtistown, 6 to 11 year old males and 18 to 24 year old females are the most vulnerable to poverty, with 42 males (26.6%) and 21 females (75.0%) in their respective age groups living below the poverty level.
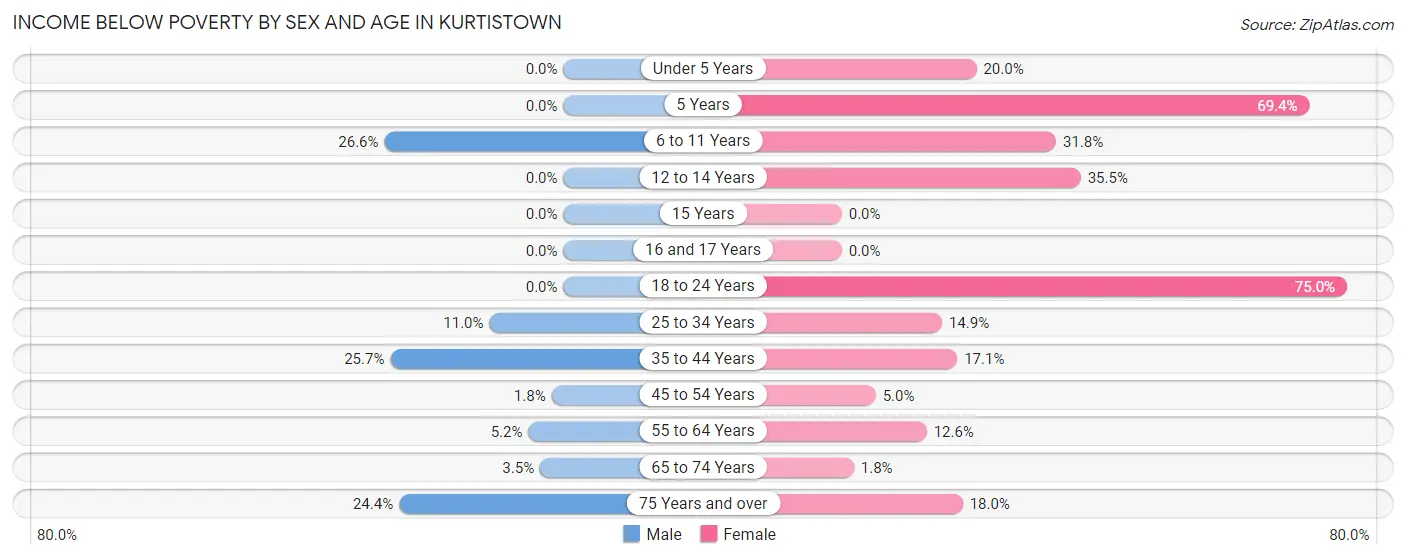
| Age Bracket | Male | Female |
| Under 5 Years | 0 (0.0%) | 12 (20.0%) |
| 5 Years | 0 (0.0%) | 25 (69.4%) |
| 6 to 11 Years | 42 (26.6%) | 28 (31.8%) |
| 12 to 14 Years | 0 (0.0%) | 11 (35.5%) |
| 15 Years | 0 (0.0%) | 0 (0.0%) |
| 16 and 17 Years | 0 (0.0%) | 0 (0.0%) |
| 18 to 24 Years | 0 (0.0%) | 21 (75.0%) |
| 25 to 34 Years | 21 (11.0%) | 25 (14.9%) |
| 35 to 44 Years | 27 (25.7%) | 12 (17.1%) |
| 45 to 54 Years | 4 (1.8%) | 13 (5.0%) |
| 55 to 64 Years | 11 (5.2%) | 28 (12.6%) |
| 65 to 74 Years | 7 (3.5%) | 6 (1.8%) |
| 75 Years and over | 31 (24.4%) | 21 (17.9%) |
| Total | 143 (10.1%) | 202 (13.6%) |
Income Above Poverty by Sex and Age in Kurtistown
According to the poverty statistics in Kurtistown, males aged under 5 years and females aged 15 years are the age groups that are most secure financially, with 100.0% of males and 100.0% of females in these age groups living above the poverty line.
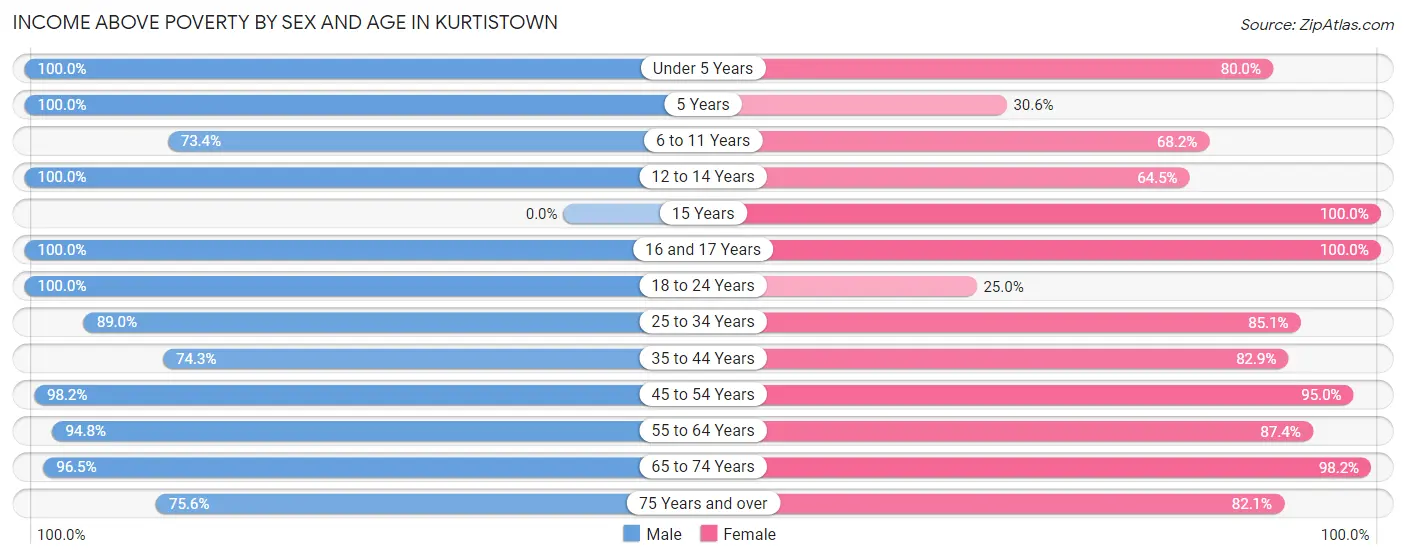
| Age Bracket | Male | Female |
| Under 5 Years | 34 (100.0%) | 48 (80.0%) |
| 5 Years | 33 (100.0%) | 11 (30.6%) |
| 6 to 11 Years | 116 (73.4%) | 60 (68.2%) |
| 12 to 14 Years | 34 (100.0%) | 20 (64.5%) |
| 15 Years | 0 (0.0%) | 43 (100.0%) |
| 16 and 17 Years | 19 (100.0%) | 26 (100.0%) |
| 18 to 24 Years | 71 (100.0%) | 7 (25.0%) |
| 25 to 34 Years | 170 (89.0%) | 143 (85.1%) |
| 35 to 44 Years | 78 (74.3%) | 58 (82.9%) |
| 45 to 54 Years | 223 (98.2%) | 245 (95.0%) |
| 55 to 64 Years | 200 (94.8%) | 194 (87.4%) |
| 65 to 74 Years | 195 (96.5%) | 330 (98.2%) |
| 75 Years and over | 96 (75.6%) | 96 (82.1%) |
| Total | 1,269 (89.9%) | 1,281 (86.4%) |
Income Below Poverty Among Married-Couple Families in Kurtistown
The poverty statistics for married-couple families in Kurtistown show that 4.9% or 30 of the total 619 families live below the poverty line. Families with no children have the highest poverty rate of 7.2%, comprising of 26 families. On the other hand, families with 3 or 4 children have the lowest poverty rate of 0.0%, which includes 0 families.
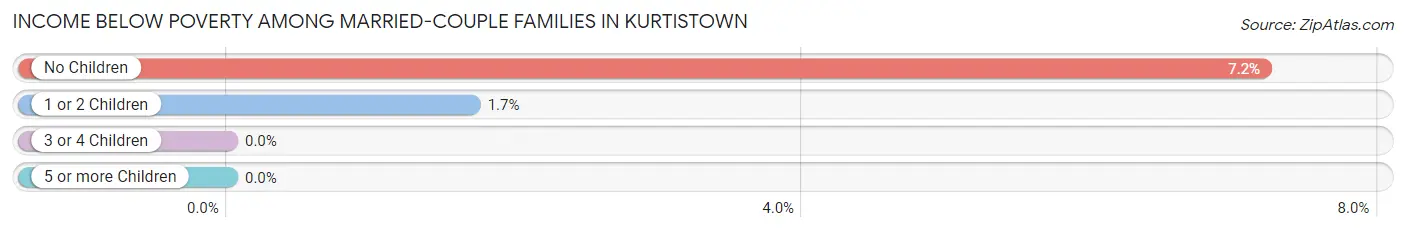
| Children | Above Poverty | Below Poverty |
| No Children | 335 (92.8%) | 26 (7.2%) |
| 1 or 2 Children | 232 (98.3%) | 4 (1.7%) |
| 3 or 4 Children | 18 (100.0%) | 0 (0.0%) |
| 5 or more Children | 4 (100.0%) | 0 (0.0%) |
| Total | 589 (95.2%) | 30 (4.9%) |
Income Below Poverty Among Single-Parent Households in Kurtistown
According to the poverty data in Kurtistown, 35.0% or 21 single-father households and 28.4% or 38 single-mother households are living below the poverty line. Among single-father households, those with 1 or 2 children have the highest poverty rate, with 21 households (100.0%) experiencing poverty. Likewise, among single-mother households, those with 3 or 4 children have the highest poverty rate, with 13 households (100.0%) falling below the poverty line.
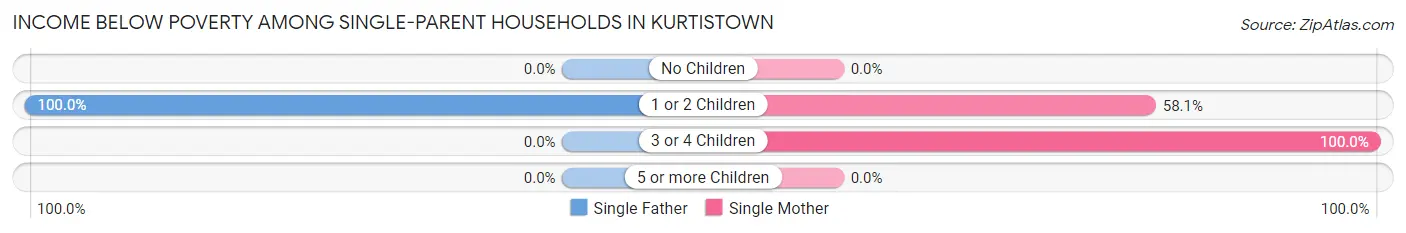
| Children | Single Father | Single Mother |
| No Children | 0 (0.0%) | 0 (0.0%) |
| 1 or 2 Children | 21 (100.0%) | 25 (58.1%) |
| 3 or 4 Children | 0 (0.0%) | 13 (100.0%) |
| 5 or more Children | 0 (0.0%) | 0 (0.0%) |
| Total | 21 (35.0%) | 38 (28.4%) |
Income Below Poverty Among Married-Couple vs Single-Parent Households in Kurtistown
The poverty data for Kurtistown shows that 30 of the married-couple family households (4.9%) and 59 of the single-parent households (30.4%) are living below the poverty level. Within the married-couple family households, those with no children have the highest poverty rate, with 26 households (7.2%) falling below the poverty line. Among the single-parent households, those with 3 or 4 children have the highest poverty rate, with 13 household (100.0%) living below poverty.
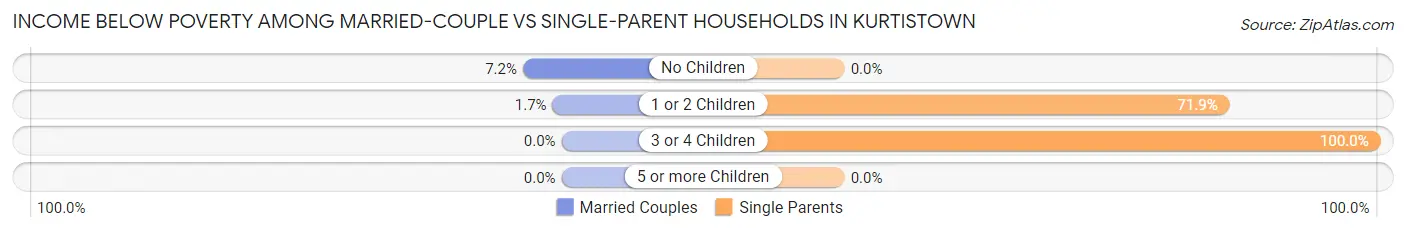
| Children | Married-Couple Families | Single-Parent Households |
| No Children | 26 (7.2%) | 0 (0.0%) |
| 1 or 2 Children | 4 (1.7%) | 46 (71.9%) |
| 3 or 4 Children | 0 (0.0%) | 13 (100.0%) |
| 5 or more Children | 0 (0.0%) | 0 (0.0%) |
| Total | 30 (4.9%) | 59 (30.4%) |
Race in Kurtistown
The most populous races in Kurtistown are Asian (1,127 | 38.9%), Two or more Races (769 | 26.6%), and Hawaiian / Pacific (537 | 18.5%).
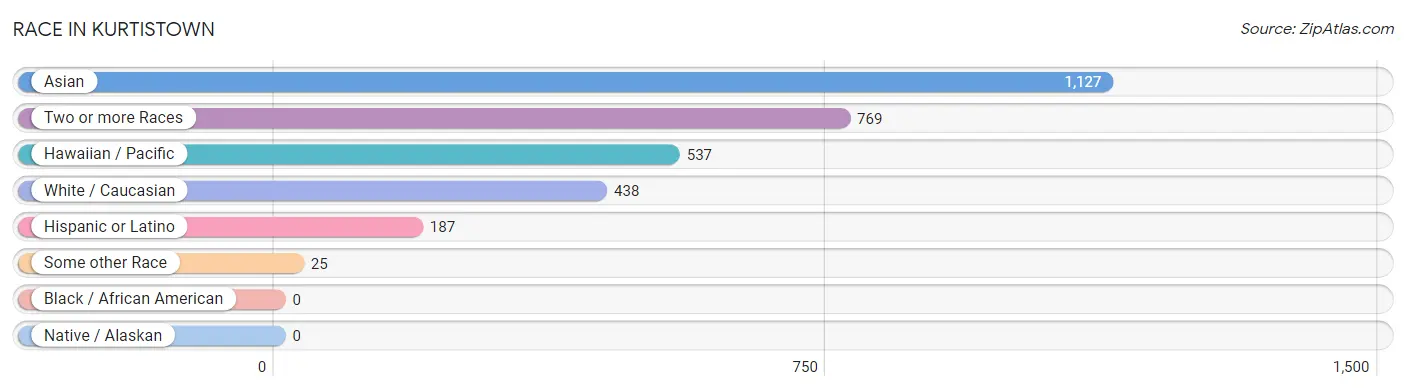
| Race | # Population | % Population |
| Asian | 1,127 | 38.9% |
| Black / African American | 0 | 0.0% |
| Hawaiian / Pacific | 537 | 18.5% |
| Hispanic or Latino | 187 | 6.5% |
| Native / Alaskan | 0 | 0.0% |
| White / Caucasian | 438 | 15.1% |
| Two or more Races | 769 | 26.6% |
| Some other Race | 25 | 0.9% |
| Total | 2,896 | 100.0% |
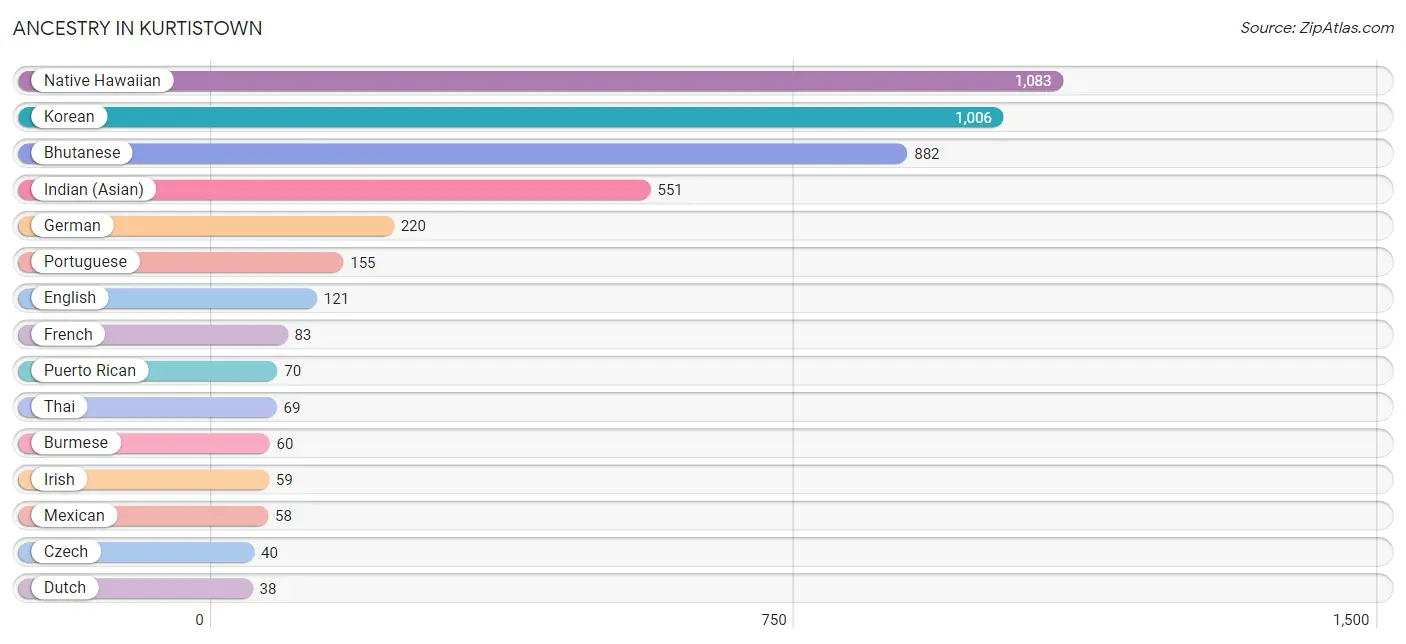
Ancestry in Kurtistown
The most populous ancestries reported in Kurtistown are Native Hawaiian (1,083 | 37.4%), Korean (1,006 | 34.7%), Bhutanese (882 | 30.5%), Indian (Asian) (551 | 19.0%), and German (220 | 7.6%), together accounting for 129.2% of all Kurtistown residents.
| Ancestry | # Population | % Population |
| Apache | 33 | 1.1% |
| Bhutanese | 882 | 30.5% |
| Blackfeet | 10 | 0.4% |
| British | 5 | 0.2% |
| Burmese | 60 | 2.1% |
| Creek | 6 | 0.2% |
| Czech | 40 | 1.4% |
| Danish | 7 | 0.2% |
| Dutch | 38 | 1.3% |
| English | 121 | 4.2% |
| European | 36 | 1.2% |
| Filipino | 11 | 0.4% |
| French | 83 | 2.9% |
| German | 220 | 7.6% |
| Indian (Asian) | 551 | 19.0% |
| Irish | 59 | 2.0% |
| Italian | 22 | 0.8% |
| Korean | 1,006 | 34.7% |
| Lithuanian | 14 | 0.5% |
| Mexican | 58 | 2.0% |
| Native Hawaiian | 1,083 | 37.4% |
| Norwegian | 17 | 0.6% |
| Polish | 20 | 0.7% |
| Portuguese | 155 | 5.3% |
| Pueblo | 4 | 0.1% |
| Puerto Rican | 70 | 2.4% |
| Russian | 16 | 0.5% |
| Samoan | 36 | 1.2% |
| Scottish | 9 | 0.3% |
| Spanish | 4 | 0.1% |
| Swedish | 15 | 0.5% |
| Thai | 69 | 2.4% |
| Ukrainian | 16 | 0.5% |
| Welsh | 12 | 0.4% | View All 34 Rows |
Immigrants in Kurtistown
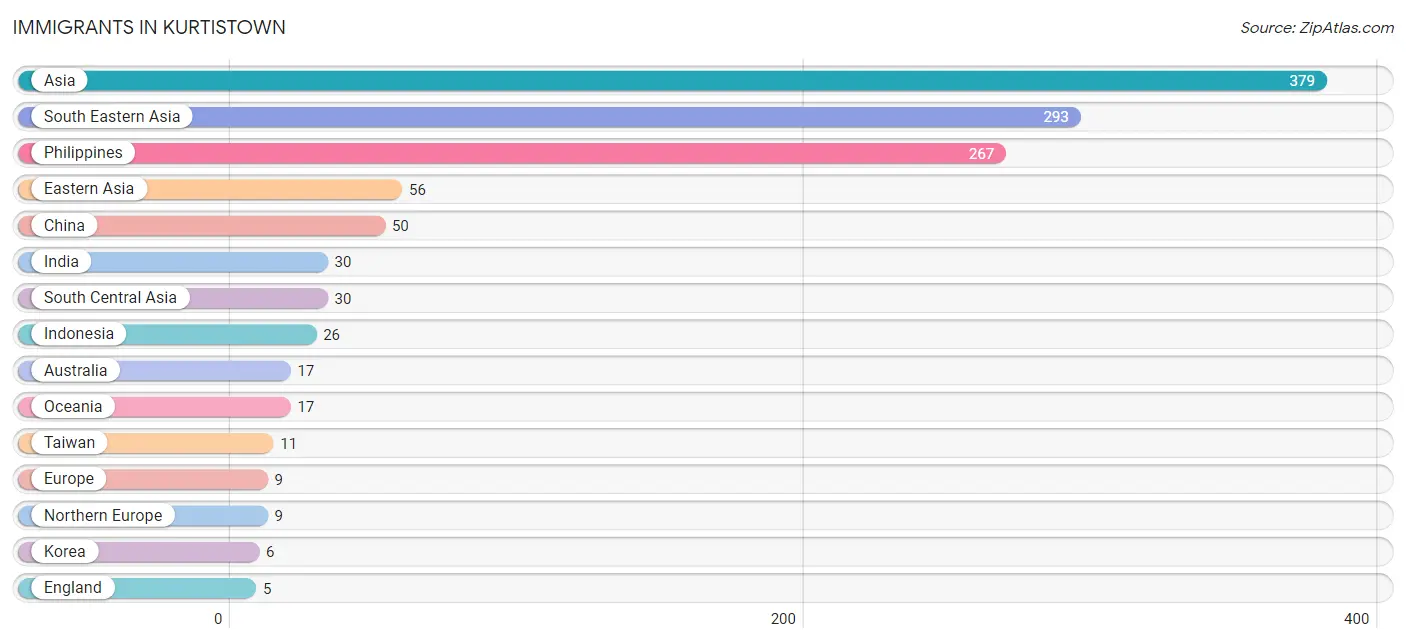
The most numerous immigrant groups reported in Kurtistown came from Asia (379 | 13.1%), South Eastern Asia (293 | 10.1%), Philippines (267 | 9.2%), Eastern Asia (56 | 1.9%), and China (50 | 1.7%), together accounting for 36.1% of all Kurtistown residents.
| Immigration Origin | # Population | % Population |
| Asia | 379 | 13.1% |
| Australia | 17 | 0.6% |
| China | 50 | 1.7% |
| Eastern Asia | 56 | 1.9% |
| England | 5 | 0.2% |
| Europe | 9 | 0.3% |
| India | 30 | 1.0% |
| Indonesia | 26 | 0.9% |
| Korea | 6 | 0.2% |
| Northern Europe | 9 | 0.3% |
| Oceania | 17 | 0.6% |
| Philippines | 267 | 9.2% |
| South Central Asia | 30 | 1.0% |
| South Eastern Asia | 293 | 10.1% |
| Taiwan | 11 | 0.4% | View All 15 Rows |
Sex and Age in Kurtistown
Sex and Age in Kurtistown
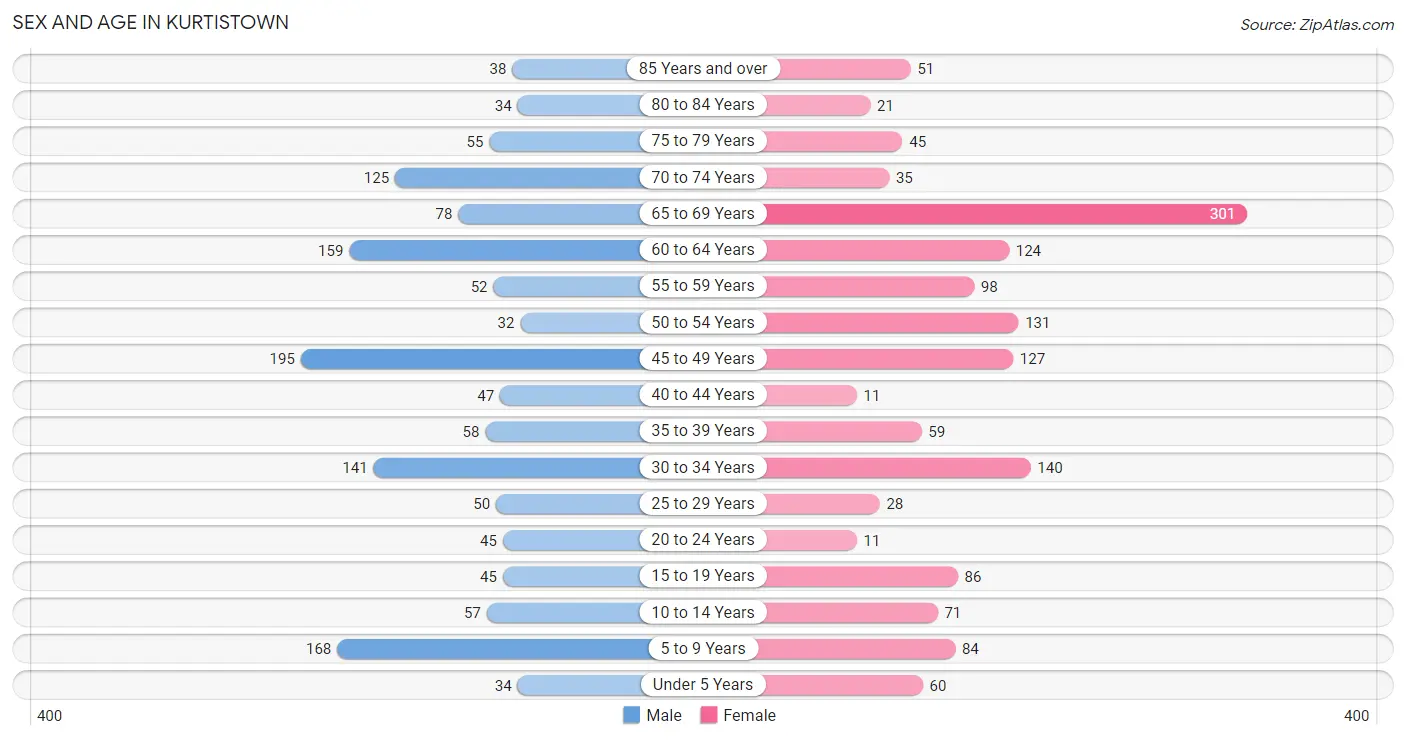
The most populous age groups in Kurtistown are 45 to 49 Years (195 | 13.8%) for men and 65 to 69 Years (301 | 20.3%) for women.
| Age Bracket | Male | Female |
| Under 5 Years | 34 (2.4%) | 60 (4.1%) |
| 5 to 9 Years | 168 (11.9%) | 84 (5.7%) |
| 10 to 14 Years | 57 (4.0%) | 71 (4.8%) |
| 15 to 19 Years | 45 (3.2%) | 86 (5.8%) |
| 20 to 24 Years | 45 (3.2%) | 11 (0.7%) |
| 25 to 29 Years | 50 (3.5%) | 28 (1.9%) |
| 30 to 34 Years | 141 (10.0%) | 140 (9.4%) |
| 35 to 39 Years | 58 (4.1%) | 59 (4.0%) |
| 40 to 44 Years | 47 (3.3%) | 11 (0.7%) |
| 45 to 49 Years | 195 (13.8%) | 127 (8.6%) |
| 50 to 54 Years | 32 (2.3%) | 131 (8.8%) |
| 55 to 59 Years | 52 (3.7%) | 98 (6.6%) |
| 60 to 64 Years | 159 (11.3%) | 124 (8.4%) |
| 65 to 69 Years | 78 (5.5%) | 301 (20.3%) |
| 70 to 74 Years | 125 (8.8%) | 35 (2.4%) |
| 75 to 79 Years | 55 (3.9%) | 45 (3.0%) |
| 80 to 84 Years | 34 (2.4%) | 21 (1.4%) |
| 85 Years and over | 38 (2.7%) | 51 (3.4%) |
| Total | 1,413 (100.0%) | 1,483 (100.0%) |
Families and Households in Kurtistown
Median Family Size in Kurtistown
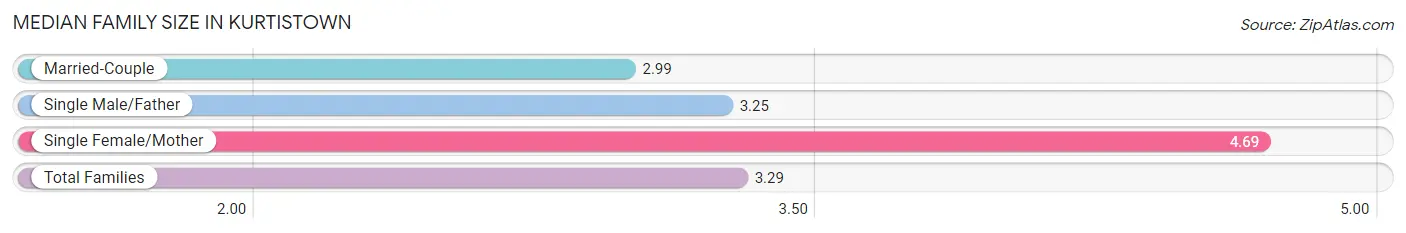
The median family size in Kurtistown is 3.29 persons per family, with single female/mother families (134 | 16.5%) accounting for the largest median family size of 4.69 persons per family. On the other hand, married-couple families (619 | 76.1%) represent the smallest median family size with 2.99 persons per family.
| Family Type | # Families | Family Size |
| Married-Couple | 619 (76.1%) | 2.99 |
| Single Male/Father | 60 (7.4%) | 3.25 |
| Single Female/Mother | 134 (16.5%) | 4.69 |
| Total Families | 813 (100.0%) | 3.29 |
Median Household Size in Kurtistown
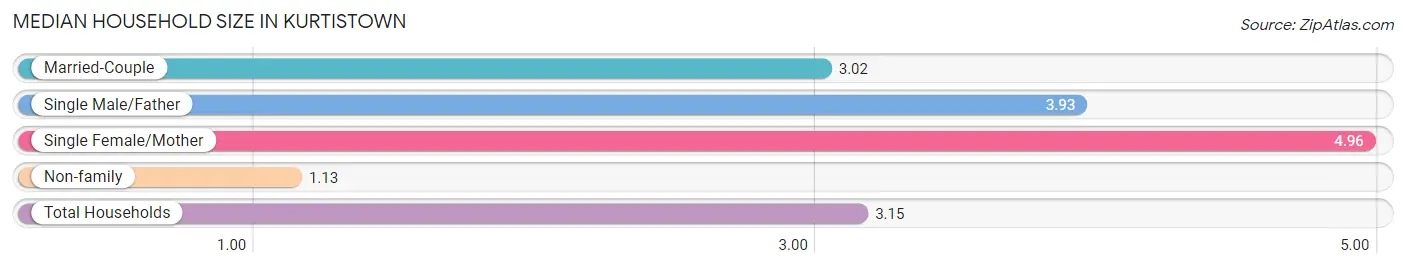
The median household size in Kurtistown is 3.15 persons per household, with single female/mother households (134 | 14.7%) accounting for the largest median household size of 4.96 persons per household. non-family households (101 | 11.1%) represent the smallest median household size with 1.13 persons per household.
| Household Type | # Households | Household Size |
| Married-Couple | 619 (67.7%) | 3.02 |
| Single Male/Father | 60 (6.6%) | 3.93 |
| Single Female/Mother | 134 (14.7%) | 4.96 |
| Non-family | 101 (11.1%) | 1.13 |
| Total Households | 914 (100.0%) | 3.15 |
Household Size by Marriage Status in Kurtistown
Out of a total of 914 households in Kurtistown, 813 (88.9%) are family households, while 101 (11.1%) are nonfamily households. The most numerous type of family households are 2-person households, comprising 339, and the most common type of nonfamily households are 1-person households, comprising 90.
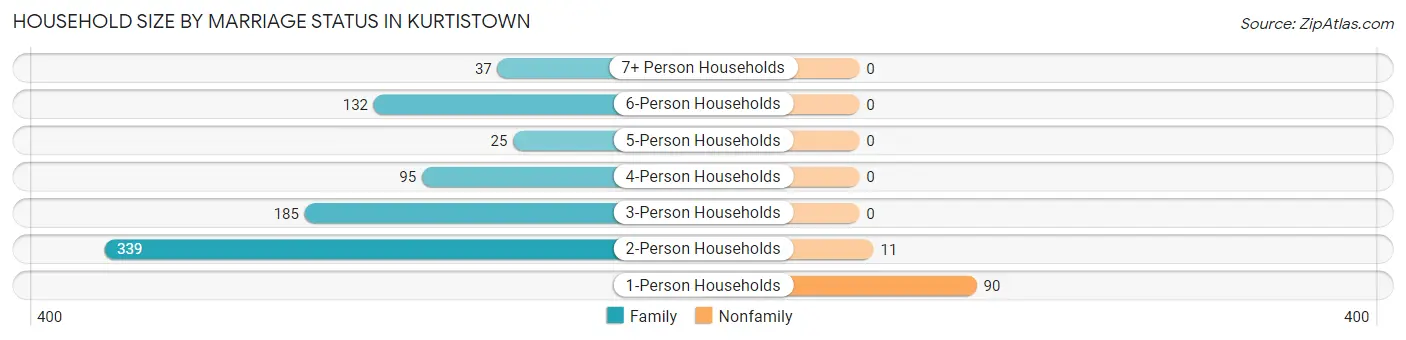
| Household Size | Family Households | Nonfamily Households |
| 1-Person Households | - | 90 (9.9%) |
| 2-Person Households | 339 (37.1%) | 11 (1.2%) |
| 3-Person Households | 185 (20.2%) | 0 (0.0%) |
| 4-Person Households | 95 (10.4%) | 0 (0.0%) |
| 5-Person Households | 25 (2.7%) | 0 (0.0%) |
| 6-Person Households | 132 (14.4%) | 0 (0.0%) |
| 7+ Person Households | 37 (4.1%) | 0 (0.0%) |
| Total | 813 (88.9%) | 101 (11.1%) |
Female Fertility in Kurtistown
Fertility by Age in Kurtistown
Average fertility rate in Kurtistown is 88.0 births per 1,000 women. Women in the age bracket of 15 to 19 years have the highest fertility rate with 198.0 births per 1,000 women. Women in the age bracket of 15 to 19 years acount for 37.0% of all women with births.
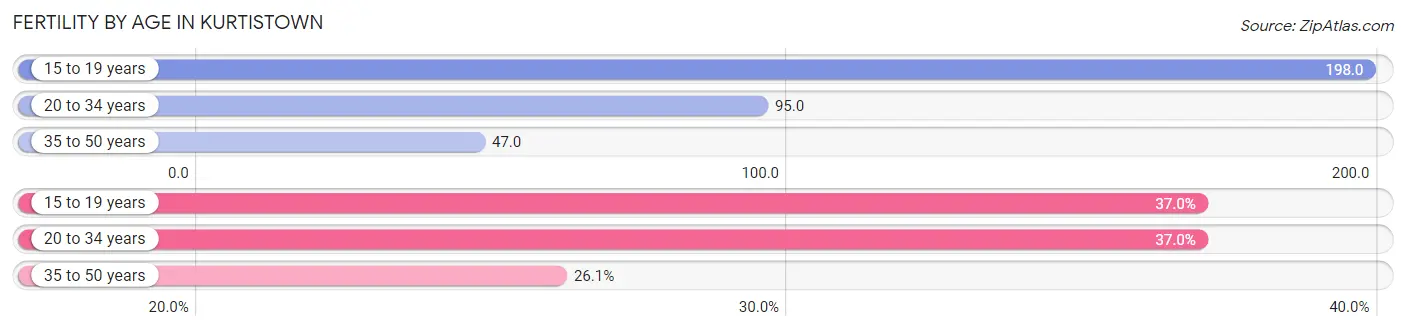
| Age Bracket | Women with Births | Births / 1,000 Women |
| 15 to 19 years | 17 (37.0%) | 198.0 |
| 20 to 34 years | 17 (37.0%) | 95.0 |
| 35 to 50 years | 12 (26.1%) | 47.0 |
| Total | 46 (100.0%) | 88.0 |
Fertility by Age by Marriage Status in Kurtistown
37.0% of women with births (46) in Kurtistown are married. The highest percentage of unmarried women with births falls into 15 to 19 years age bracket with 100.0% of them unmarried at the time of birth, while the lowest percentage of unmarried women with births belong to 20 to 34 years age bracket with 0.0% of them unmarried.
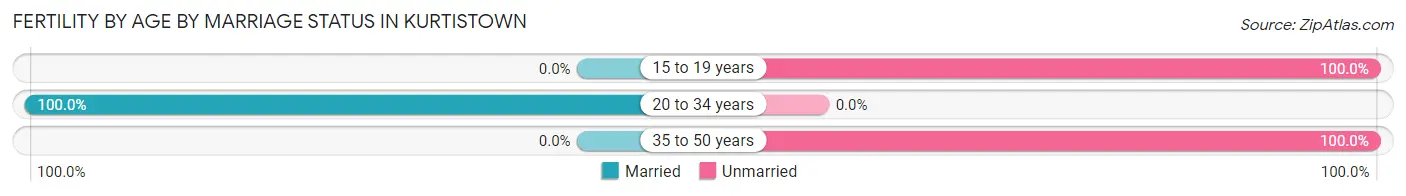
| Age Bracket | Married | Unmarried |
| 15 to 19 years | 0 (0.0%) | 17 (100.0%) |
| 20 to 34 years | 17 (100.0%) | 0 (0.0%) |
| 35 to 50 years | 0 (0.0%) | 12 (100.0%) |
| Total | 17 (37.0%) | 29 (63.0%) |
Fertility by Education in Kurtistown
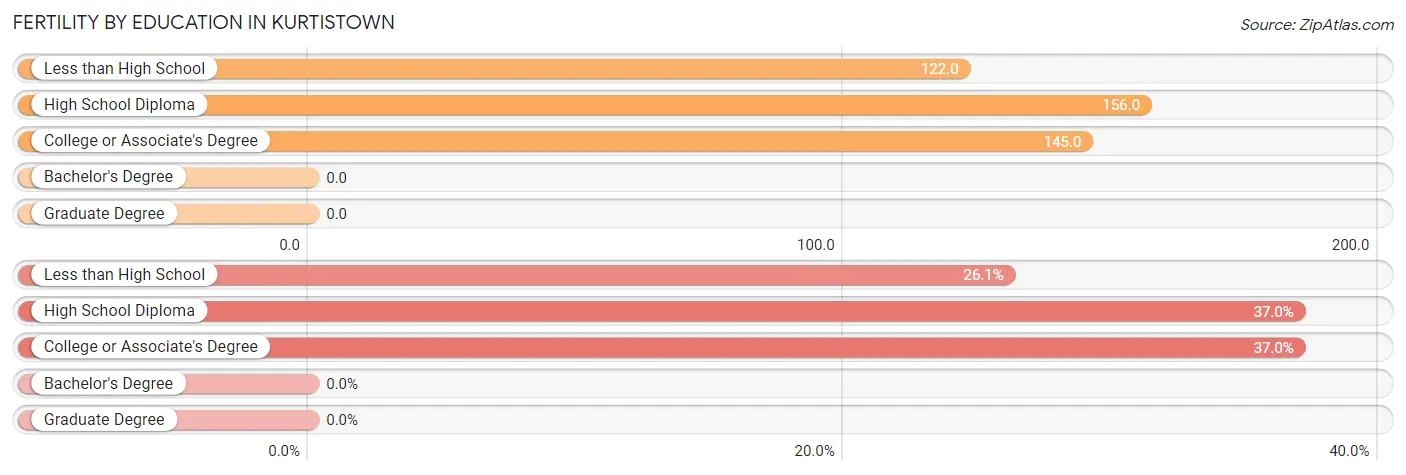
| Educational Attainment | Women with Births | Births / 1,000 Women |
| Less than High School | 12 (26.1%) | 122.0 |
| High School Diploma | 17 (37.0%) | 156.0 |
| College or Associate's Degree | 17 (37.0%) | 145.0 |
| Bachelor's Degree | 0 (0.0%) | 0.0 |
| Graduate Degree | 0 (0.0%) | 0.0 |
| Total | 46 (100.0%) | 88.0 |
Fertility by Education by Marriage Status in Kurtistown
63.0% of women with births in Kurtistown are unmarried. Women with the educational attainment of college or associate's degree are most likely to be married with 100.0% of them married at childbirth, while women with the educational attainment of less than high school are least likely to be married with 100.0% of them unmarried at childbirth.
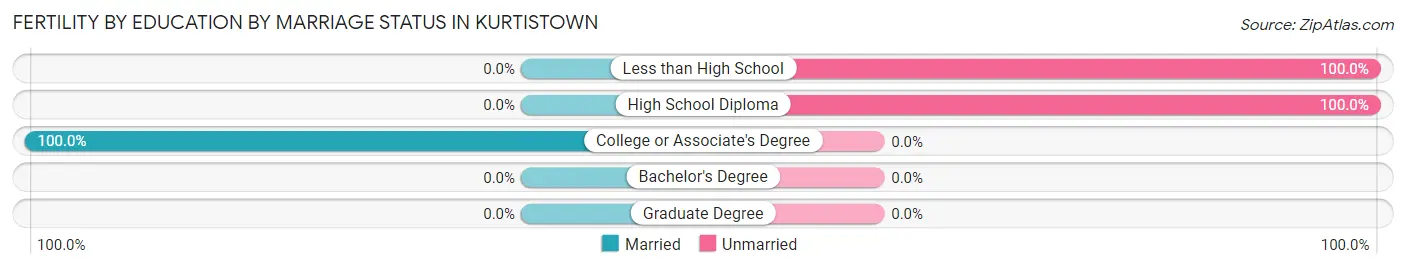
| Educational Attainment | Married | Unmarried |
| Less than High School | 0 (0.0%) | 12 (100.0%) |
| High School Diploma | 0 (0.0%) | 17 (100.0%) |
| College or Associate's Degree | 17 (100.0%) | 0 (0.0%) |
| Bachelor's Degree | 0 (0.0%) | 0 (0.0%) |
| Graduate Degree | 0 (0.0%) | 0 (0.0%) |
| Total | 17 (37.0%) | 29 (63.0%) |
Employment Characteristics in Kurtistown
Employment by Class of Employer in Kurtistown
Among the 1,140 employed individuals in Kurtistown, private company employees (720 | 63.2%), self-employed (not incorporated) (155 | 13.6%), and state government employees (94 | 8.3%) make up the most common classes of employment.
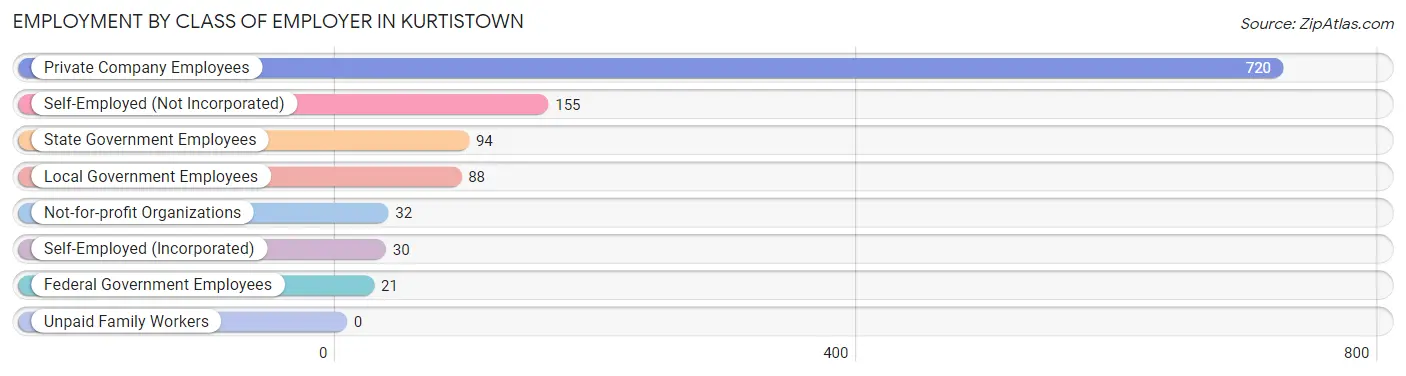
| Employer Class | # Employees | % Employees |
| Private Company Employees | 720 | 63.2% |
| Self-Employed (Incorporated) | 30 | 2.6% |
| Self-Employed (Not Incorporated) | 155 | 13.6% |
| Not-for-profit Organizations | 32 | 2.8% |
| Local Government Employees | 88 | 7.7% |
| State Government Employees | 94 | 8.3% |
| Federal Government Employees | 21 | 1.8% |
| Unpaid Family Workers | 0 | 0.0% |
| Total | 1,140 | 100.0% |
Employment Status by Age in Kurtistown
According to the labor force statistics for Kurtistown, out of the total population over 16 years of age (2,379), 53.3% or 1,268 individuals are in the labor force, with 8.0% or 101 of them unemployed. The age group with the highest labor force participation rate is 20 to 24 years, with 92.9% or 52 individuals in the labor force. Within the labor force, the 16 to 19 years age range has the highest percentage of unemployed individuals, with 100.0% or 30 of them being unemployed.
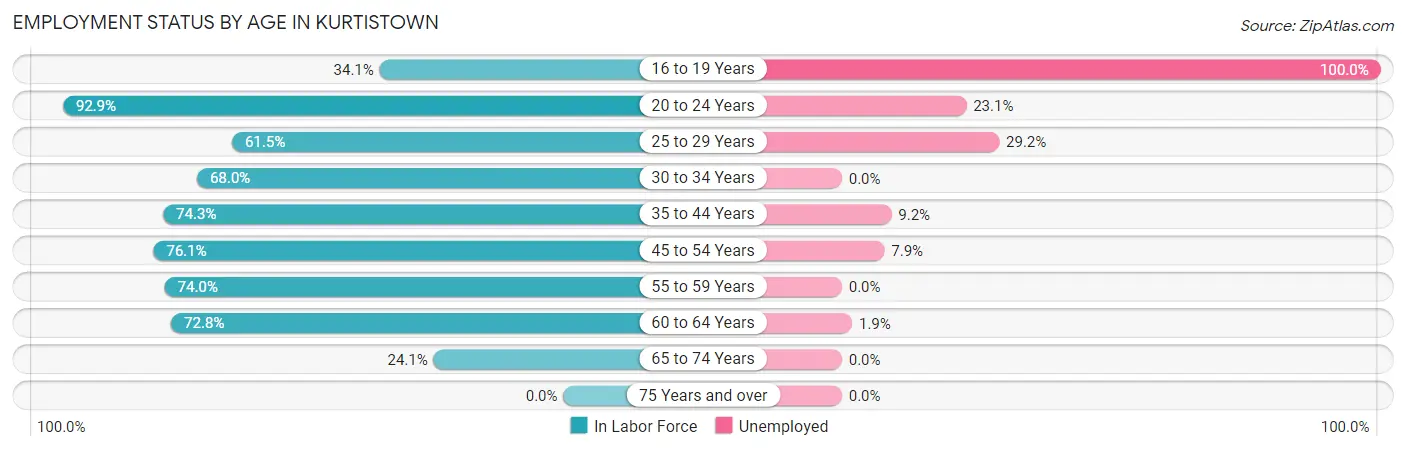
| Age Bracket | In Labor Force | Unemployed |
| 16 to 19 Years | 30 (34.1%) | 30 (100.0%) |
| 20 to 24 Years | 52 (92.9%) | 12 (23.1%) |
| 25 to 29 Years | 48 (61.5%) | 14 (29.2%) |
| 30 to 34 Years | 191 (68.0%) | 0 (0.0%) |
| 35 to 44 Years | 130 (74.3%) | 12 (9.2%) |
| 45 to 54 Years | 369 (76.1%) | 29 (7.9%) |
| 55 to 59 Years | 111 (74.0%) | 0 (0.0%) |
| 60 to 64 Years | 206 (72.8%) | 4 (1.9%) |
| 65 to 74 Years | 130 (24.1%) | 0 (0.0%) |
| 75 Years and over | 0 (0.0%) | 0 (0.0%) |
| Total | 1,268 (53.3%) | 101 (8.0%) |
Employment Status by Educational Attainment in Kurtistown
According to labor force statistics for Kurtistown, 72.7% of individuals (1,056) out of the total population between 25 and 64 years of age (1,452) are in the labor force, with 5.6% or 59 of them being unemployed. The group with the highest labor force participation rate are those with the educational attainment of less than high school, with 82.2% or 97 individuals in the labor force. Within the labor force, individuals with less than high school education have the highest percentage of unemployment, with 42.3% or 41 of them being unemployed.
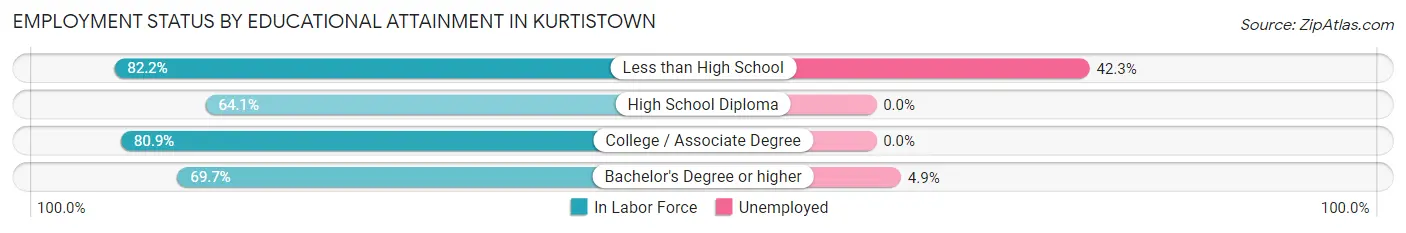
| Educational Attainment | In Labor Force | Unemployed |
| Less than High School | 97 (82.2%) | 50 (42.3%) |
| High School Diploma | 237 (64.1%) | 0 (0.0%) |
| College / Associate Degree | 356 (80.9%) | 0 (0.0%) |
| Bachelor's Degree or higher | 365 (69.7%) | 26 (4.9%) |
| Total | 1,056 (72.7%) | 81 (5.6%) |
Employment Occupations by Sex in Kurtistown
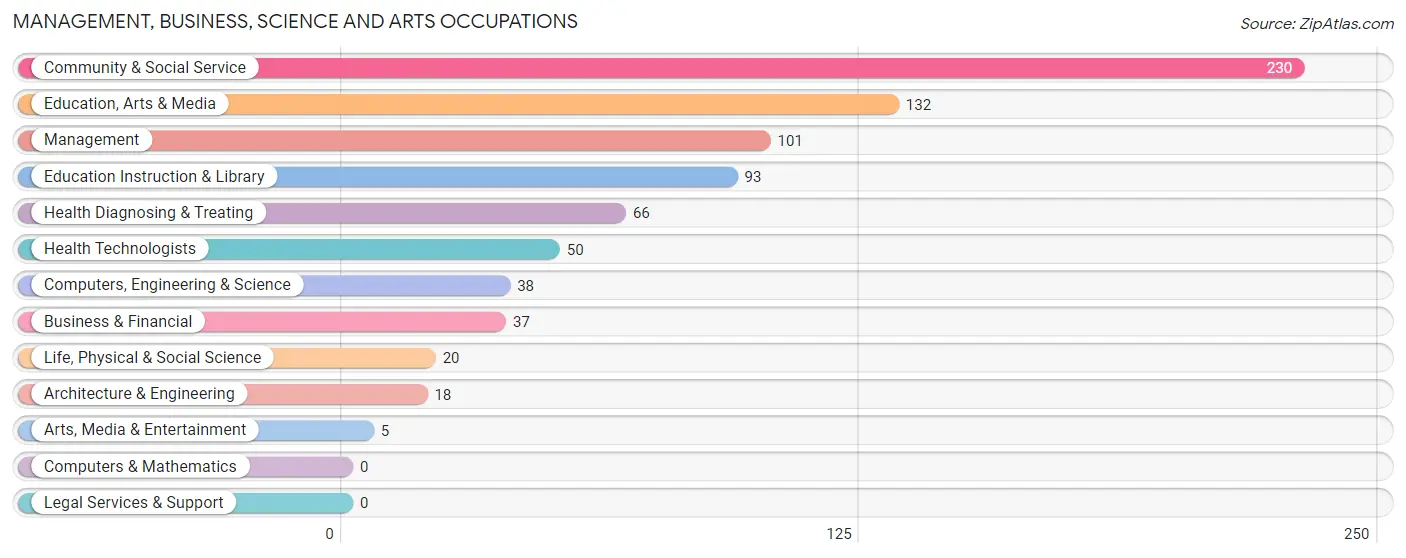
Management, Business, Science and Arts Occupations
The most common Management, Business, Science and Arts occupations in Kurtistown are Community & Social Service (230 | 19.7%), Education, Arts & Media (132 | 11.3%), Management (101 | 8.7%), Education Instruction & Library (93 | 8.0%), and Health Diagnosing & Treating (66 | 5.7%).
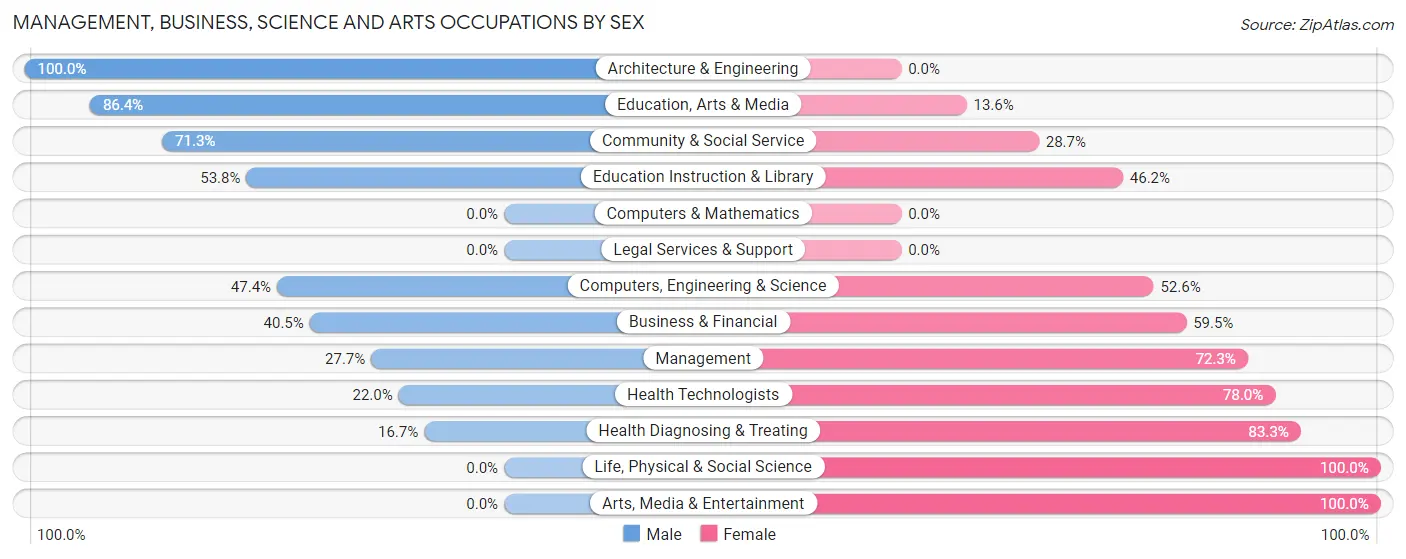
Management, Business, Science and Arts Occupations by Sex
Within the Management, Business, Science and Arts occupations in Kurtistown, the most male-oriented occupations are Architecture & Engineering (100.0%), Education, Arts & Media (86.4%), and Community & Social Service (71.3%), while the most female-oriented occupations are Life, Physical & Social Science (100.0%), Arts, Media & Entertainment (100.0%), and Health Diagnosing & Treating (83.3%).
| Occupation | Male | Female |
| Management | 28 (27.7%) | 73 (72.3%) |
| Business & Financial | 15 (40.5%) | 22 (59.5%) |
| Computers, Engineering & Science | 18 (47.4%) | 20 (52.6%) |
| Computers & Mathematics | 0 (0.0%) | 0 (0.0%) |
| Architecture & Engineering | 18 (100.0%) | 0 (0.0%) |
| Life, Physical & Social Science | 0 (0.0%) | 20 (100.0%) |
| Community & Social Service | 164 (71.3%) | 66 (28.7%) |
| Education, Arts & Media | 114 (86.4%) | 18 (13.6%) |
| Legal Services & Support | 0 (0.0%) | 0 (0.0%) |
| Education Instruction & Library | 50 (53.8%) | 43 (46.2%) |
| Arts, Media & Entertainment | 0 (0.0%) | 5 (100.0%) |
| Health Diagnosing & Treating | 11 (16.7%) | 55 (83.3%) |
| Health Technologists | 11 (22.0%) | 39 (78.0%) |
| Total (Category) | 236 (50.0%) | 236 (50.0%) |
| Total (Overall) | 654 (56.1%) | 512 (43.9%) |
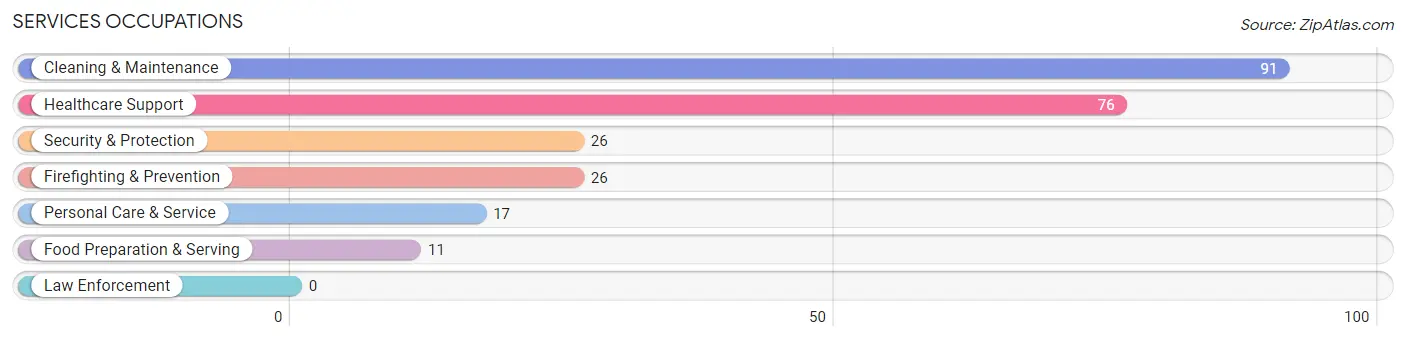
Services Occupations
The most common Services occupations in Kurtistown are Cleaning & Maintenance (91 | 7.8%), Healthcare Support (76 | 6.5%), Security & Protection (26 | 2.2%), Firefighting & Prevention (26 | 2.2%), and Personal Care & Service (17 | 1.5%).
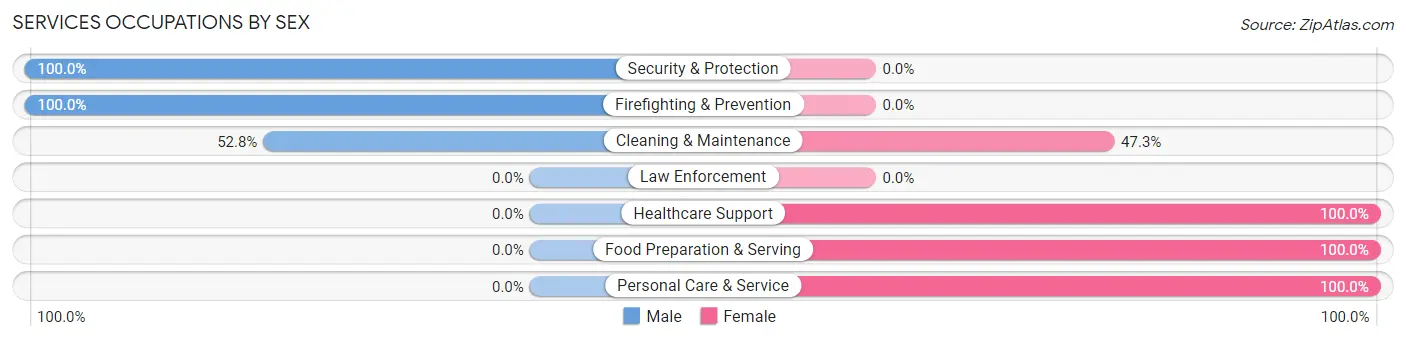
Services Occupations by Sex
Within the Services occupations in Kurtistown, the most male-oriented occupations are Security & Protection (100.0%), Firefighting & Prevention (100.0%), and Cleaning & Maintenance (52.7%), while the most female-oriented occupations are Healthcare Support (100.0%), Food Preparation & Serving (100.0%), and Personal Care & Service (100.0%).
| Occupation | Male | Female |
| Healthcare Support | 0 (0.0%) | 76 (100.0%) |
| Security & Protection | 26 (100.0%) | 0 (0.0%) |
| Firefighting & Prevention | 26 (100.0%) | 0 (0.0%) |
| Law Enforcement | 0 (0.0%) | 0 (0.0%) |
| Food Preparation & Serving | 0 (0.0%) | 11 (100.0%) |
| Cleaning & Maintenance | 48 (52.7%) | 43 (47.2%) |
| Personal Care & Service | 0 (0.0%) | 17 (100.0%) |
| Total (Category) | 74 (33.5%) | 147 (66.5%) |
| Total (Overall) | 654 (56.1%) | 512 (43.9%) |
Sales and Office Occupations
The most common Sales and Office occupations in Kurtistown are Sales & Related (92 | 7.9%), and Office & Administration (52 | 4.5%).
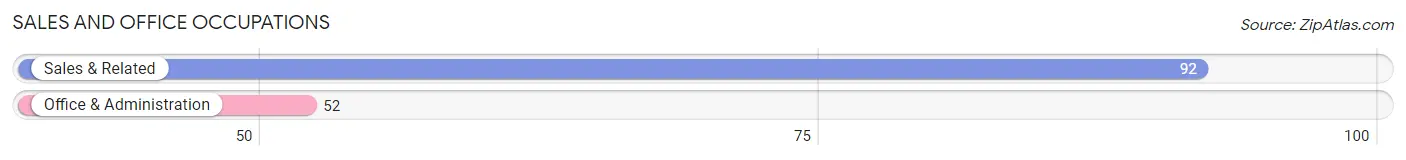
Sales and Office Occupations by Sex
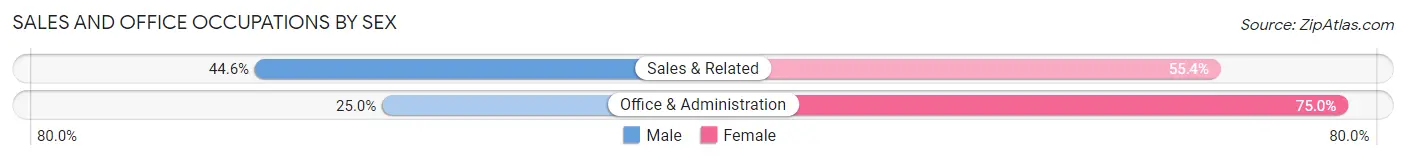
| Occupation | Male | Female |
| Sales & Related | 41 (44.6%) | 51 (55.4%) |
| Office & Administration | 13 (25.0%) | 39 (75.0%) |
| Total (Category) | 54 (37.5%) | 90 (62.5%) |
| Total (Overall) | 654 (56.1%) | 512 (43.9%) |
Natural Resources, Construction and Maintenance Occupations
The most common Natural Resources, Construction and Maintenance occupations in Kurtistown are Construction & Extraction (105 | 9.0%), Installation, Maintenance & Repair (97 | 8.3%), and Farming, Fishing & Forestry (25 | 2.1%).
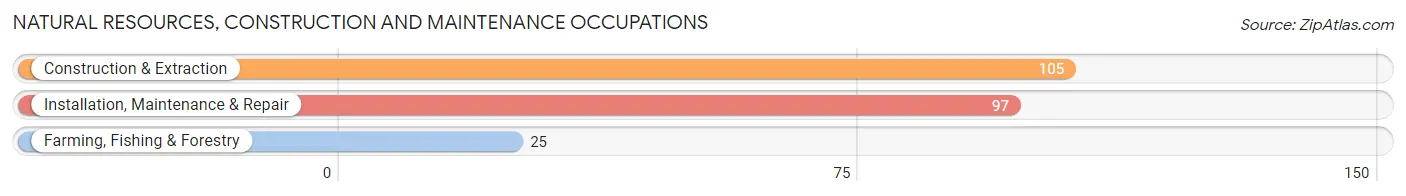
Natural Resources, Construction and Maintenance Occupations by Sex
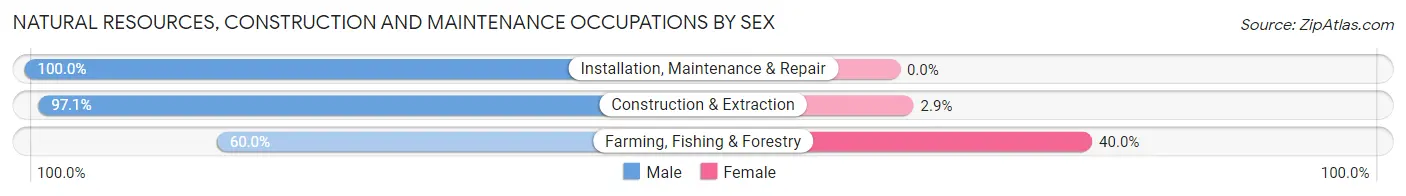
| Occupation | Male | Female |
| Farming, Fishing & Forestry | 15 (60.0%) | 10 (40.0%) |
| Construction & Extraction | 102 (97.1%) | 3 (2.9%) |
| Installation, Maintenance & Repair | 97 (100.0%) | 0 (0.0%) |
| Total (Category) | 214 (94.3%) | 13 (5.7%) |
| Total (Overall) | 654 (56.1%) | 512 (43.9%) |
Production, Transportation and Moving Occupations
The most common Production, Transportation and Moving occupations in Kurtistown are Material Moving (49 | 4.2%), Transportation (33 | 2.8%), and Production (20 | 1.7%).
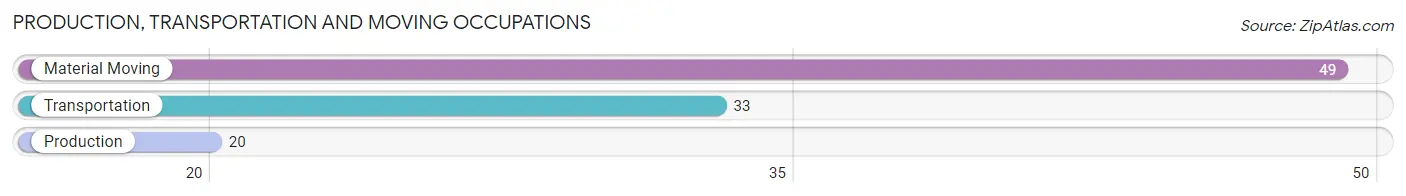
Production, Transportation and Moving Occupations by Sex
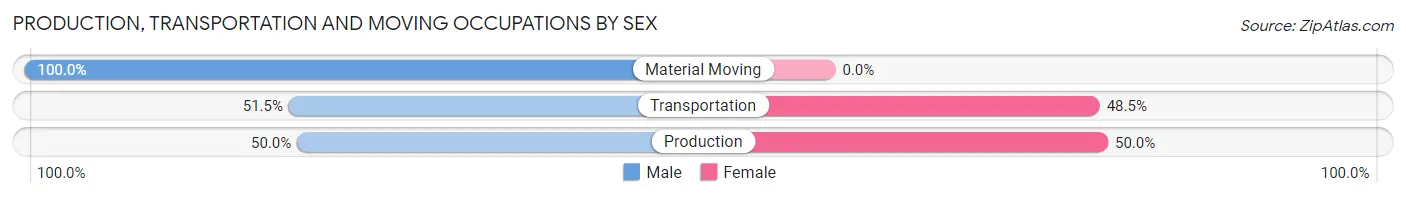
| Occupation | Male | Female |
| Production | 10 (50.0%) | 10 (50.0%) |
| Transportation | 17 (51.5%) | 16 (48.5%) |
| Material Moving | 49 (100.0%) | 0 (0.0%) |
| Total (Category) | 76 (74.5%) | 26 (25.5%) |
| Total (Overall) | 654 (56.1%) | 512 (43.9%) |
Employment Industries by Sex in Kurtistown
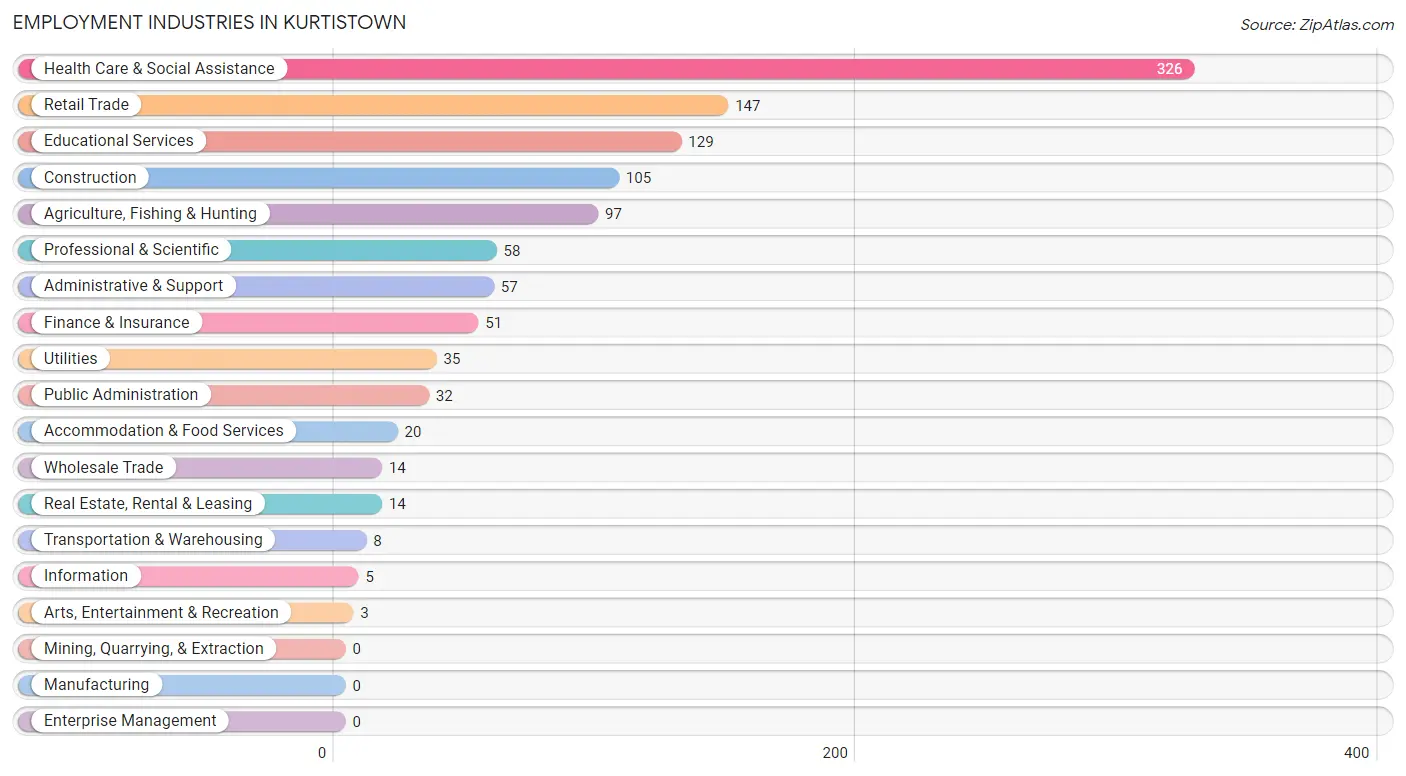
Employment Industries in Kurtistown
The major employment industries in Kurtistown include Health Care & Social Assistance (326 | 28.0%), Retail Trade (147 | 12.6%), Educational Services (129 | 11.1%), Construction (105 | 9.0%), and Agriculture, Fishing & Hunting (97 | 8.3%).
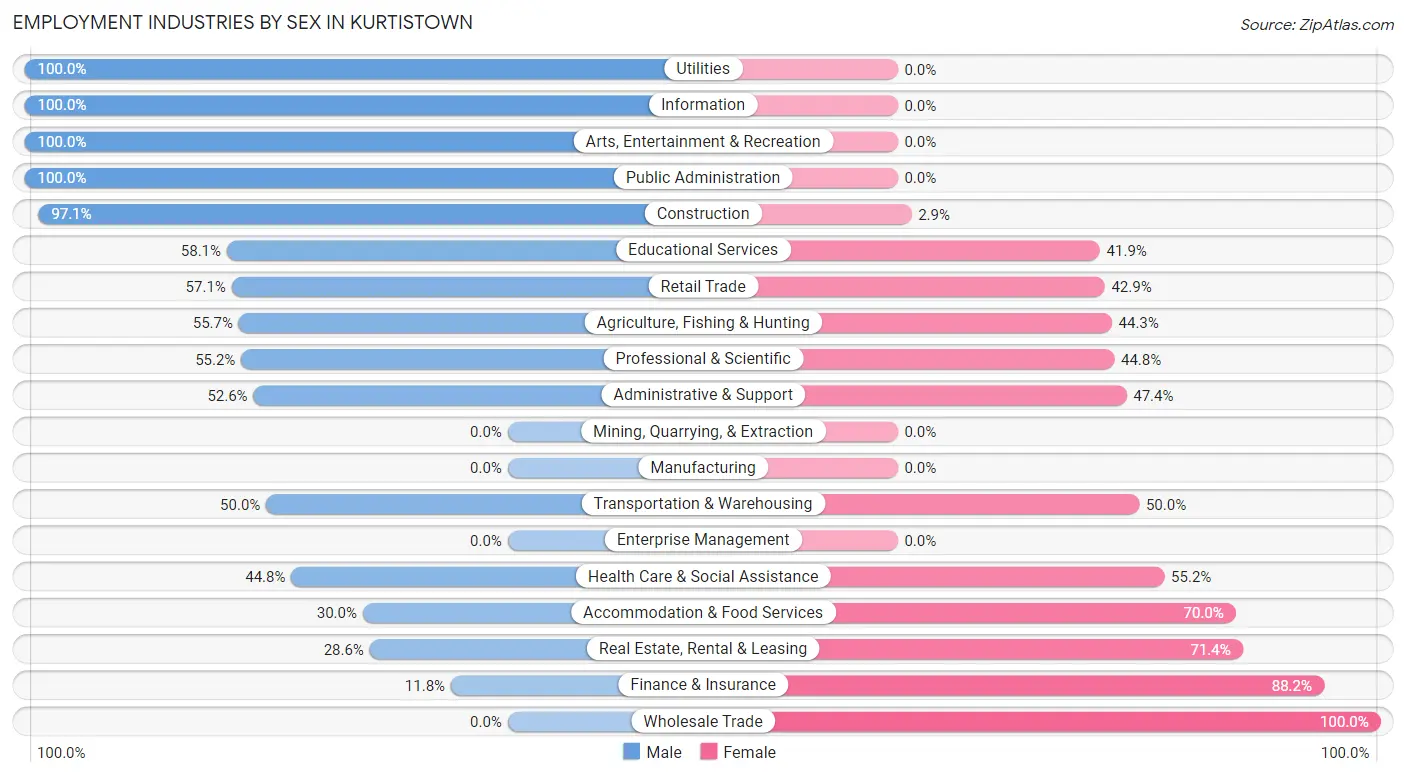
Employment Industries by Sex in Kurtistown
The Kurtistown industries that see more men than women are Utilities (100.0%), Information (100.0%), and Arts, Entertainment & Recreation (100.0%), whereas the industries that tend to have a higher number of women are Wholesale Trade (100.0%), Finance & Insurance (88.2%), and Real Estate, Rental & Leasing (71.4%).
| Industry | Male | Female |
| Agriculture, Fishing & Hunting | 54 (55.7%) | 43 (44.3%) |
| Mining, Quarrying, & Extraction | 0 (0.0%) | 0 (0.0%) |
| Construction | 102 (97.1%) | 3 (2.9%) |
| Manufacturing | 0 (0.0%) | 0 (0.0%) |
| Wholesale Trade | 0 (0.0%) | 14 (100.0%) |
| Retail Trade | 84 (57.1%) | 63 (42.9%) |
| Transportation & Warehousing | 4 (50.0%) | 4 (50.0%) |
| Utilities | 35 (100.0%) | 0 (0.0%) |
| Information | 5 (100.0%) | 0 (0.0%) |
| Finance & Insurance | 6 (11.8%) | 45 (88.2%) |
| Real Estate, Rental & Leasing | 4 (28.6%) | 10 (71.4%) |
| Professional & Scientific | 32 (55.2%) | 26 (44.8%) |
| Enterprise Management | 0 (0.0%) | 0 (0.0%) |
| Administrative & Support | 30 (52.6%) | 27 (47.4%) |
| Educational Services | 75 (58.1%) | 54 (41.9%) |
| Health Care & Social Assistance | 146 (44.8%) | 180 (55.2%) |
| Arts, Entertainment & Recreation | 3 (100.0%) | 0 (0.0%) |
| Accommodation & Food Services | 6 (30.0%) | 14 (70.0%) |
| Public Administration | 32 (100.0%) | 0 (0.0%) |
| Total | 654 (56.1%) | 512 (43.9%) |
Education in Kurtistown
School Enrollment in Kurtistown
The most common levels of schooling among the 702 students in Kurtistown are high school (196 | 27.9%), college / undergraduate (172 | 24.5%), and elementary school (133 | 19.0%).
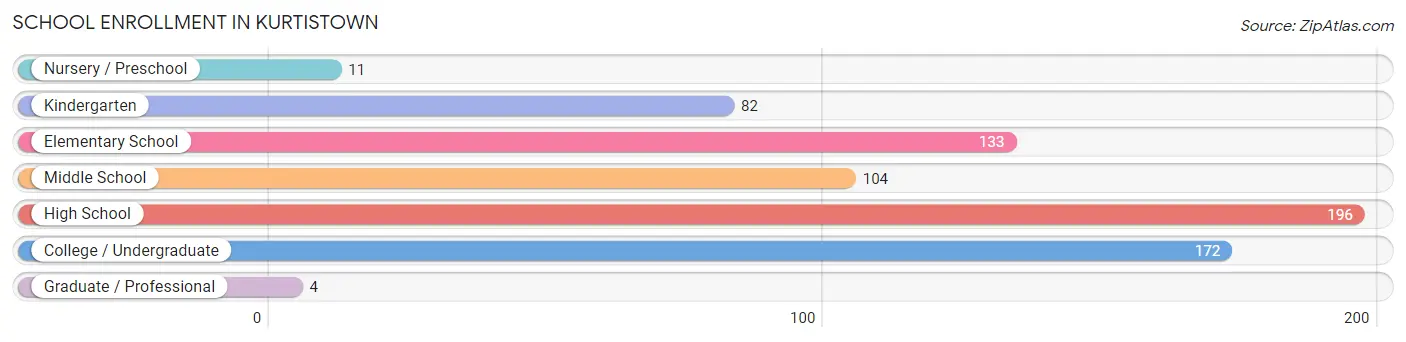
| School Level | # Students | % Students |
| Nursery / Preschool | 11 | 1.6% |
| Kindergarten | 82 | 11.7% |
| Elementary School | 133 | 19.0% |
| Middle School | 104 | 14.8% |
| High School | 196 | 27.9% |
| College / Undergraduate | 172 | 24.5% |
| Graduate / Professional | 4 | 0.6% |
| Total | 702 | 100.0% |
School Enrollment by Age by Funding Source in Kurtistown
Out of a total of 702 students who are enrolled in schools in Kurtistown, 37 (5.3%) attend a private institution, while the remaining 665 (94.7%) are enrolled in public schools. The age group of 3 to 4 year olds has the highest likelihood of being enrolled in private schools, with 5 (100.0% in the age bracket) enrolled. Conversely, the age group of 10 to 14 year olds has the lowest likelihood of being enrolled in a private school, with 128 (100.0% in the age bracket) attending a public institution.
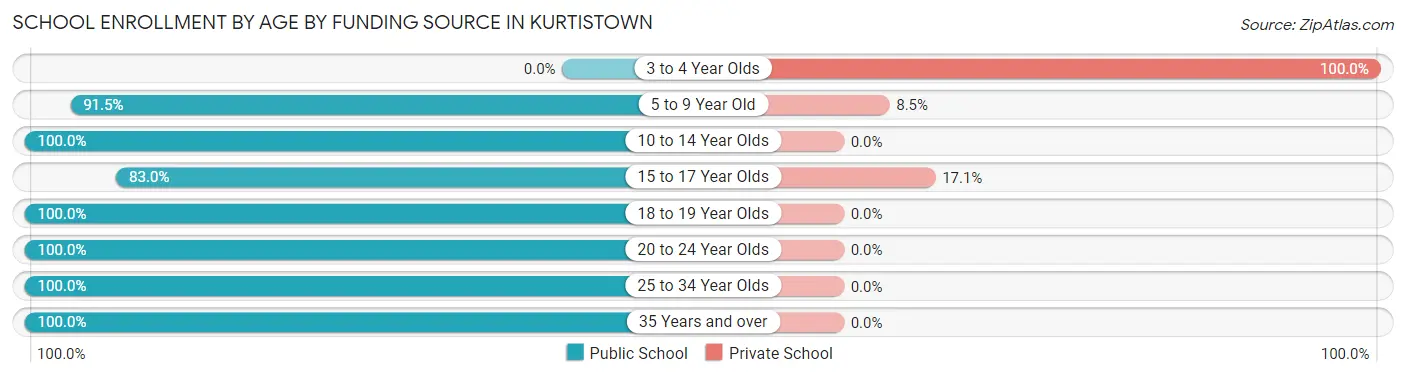
| Age Bracket | Public School | Private School |
| 3 to 4 Year Olds | 0 (0.0%) | 5 (100.0%) |
| 5 to 9 Year Old | 183 (91.5%) | 17 (8.5%) |
| 10 to 14 Year Olds | 128 (100.0%) | 0 (0.0%) |
| 15 to 17 Year Olds | 73 (83.0%) | 15 (17.1%) |
| 18 to 19 Year Olds | 13 (100.0%) | 0 (0.0%) |
| 20 to 24 Year Olds | 10 (100.0%) | 0 (0.0%) |
| 25 to 34 Year Olds | 7 (100.0%) | 0 (0.0%) |
| 35 Years and over | 251 (100.0%) | 0 (0.0%) |
| Total | 665 (94.7%) | 37 (5.3%) |
Educational Attainment by Field of Study in Kurtistown
Arts & humanities (138 | 18.1%), education (116 | 15.2%), social sciences (94 | 12.3%), business (92 | 12.1%), and psychology (65 | 8.5%) are the most common fields of study among 761 individuals in Kurtistown who have obtained a bachelor's degree or higher.
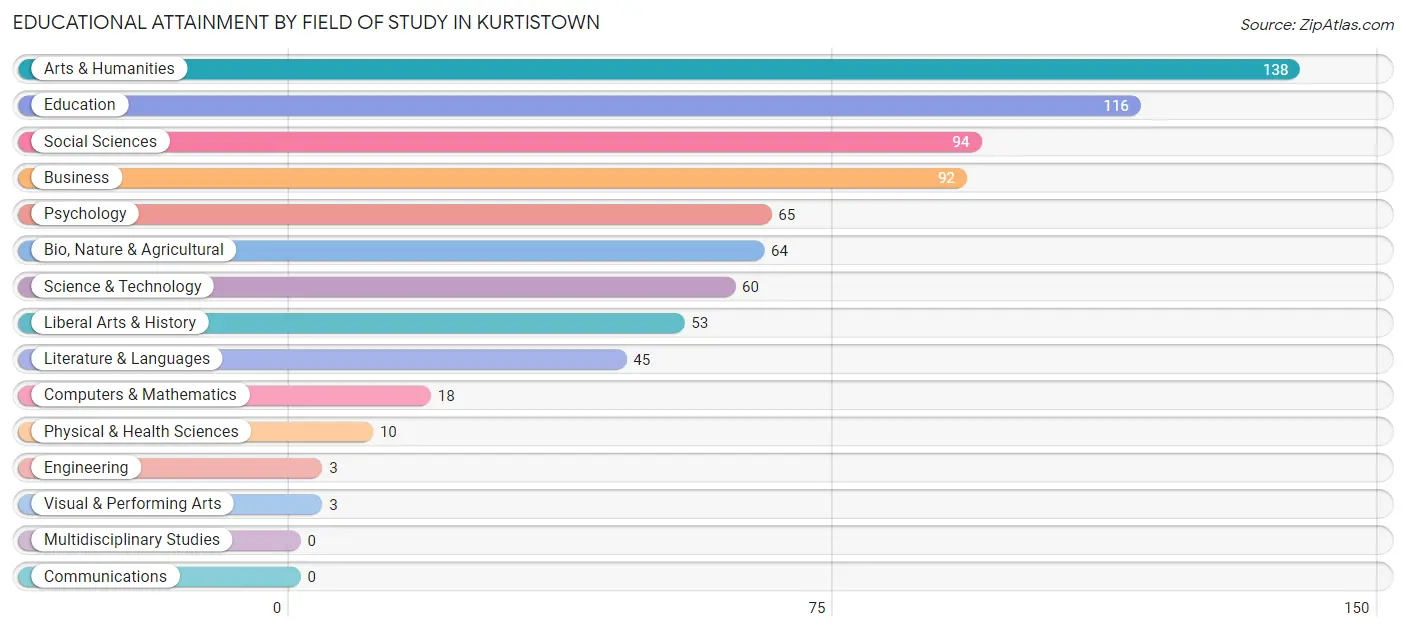
| Field of Study | # Graduates | % Graduates |
| Computers & Mathematics | 18 | 2.4% |
| Bio, Nature & Agricultural | 64 | 8.4% |
| Physical & Health Sciences | 10 | 1.3% |
| Psychology | 65 | 8.5% |
| Social Sciences | 94 | 12.3% |
| Engineering | 3 | 0.4% |
| Multidisciplinary Studies | 0 | 0.0% |
| Science & Technology | 60 | 7.9% |
| Business | 92 | 12.1% |
| Education | 116 | 15.2% |
| Literature & Languages | 45 | 5.9% |
| Liberal Arts & History | 53 | 7.0% |
| Visual & Performing Arts | 3 | 0.4% |
| Communications | 0 | 0.0% |
| Arts & Humanities | 138 | 18.1% |
| Total | 761 | 100.0% |
Transportation & Commute in Kurtistown
Vehicle Availability by Sex in Kurtistown
The most prevalent vehicle ownership categories in Kurtistown are males with 1 vehicle (157, accounting for 24.0%) and females with 1 vehicle (99, making up 32.3%).
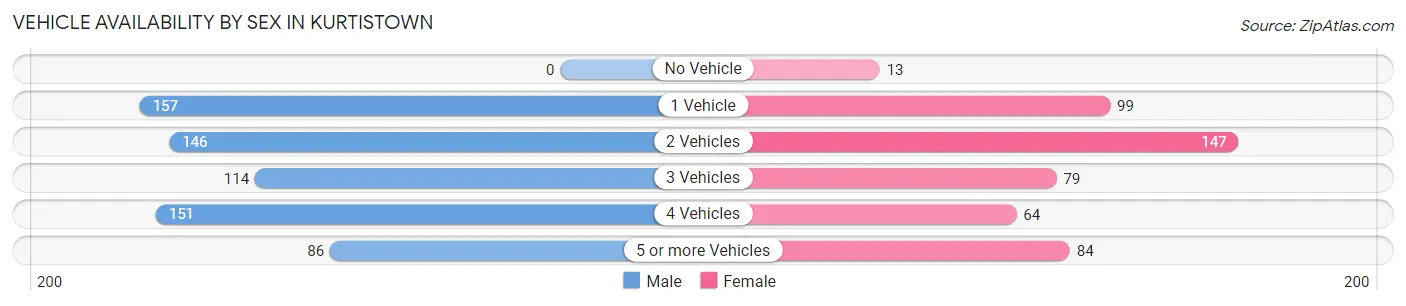
| Vehicles Available | Male | Female |
| No Vehicle | 0 (0.0%) | 13 (2.7%) |
| 1 Vehicle | 157 (24.0%) | 99 (20.4%) |
| 2 Vehicles | 146 (22.3%) | 147 (30.2%) |
| 3 Vehicles | 114 (17.4%) | 79 (16.3%) |
| 4 Vehicles | 151 (23.1%) | 64 (13.2%) |
| 5 or more Vehicles | 86 (13.2%) | 84 (17.3%) |
| Total | 654 (100.0%) | 486 (100.0%) |
Commute Time in Kurtistown
The most frequently occuring commute durations in Kurtistown are 20 to 24 minutes (196 commuters, 18.3%), 30 to 34 minutes (193 commuters, 18.0%), and 60 to 89 minutes (154 commuters, 14.4%).
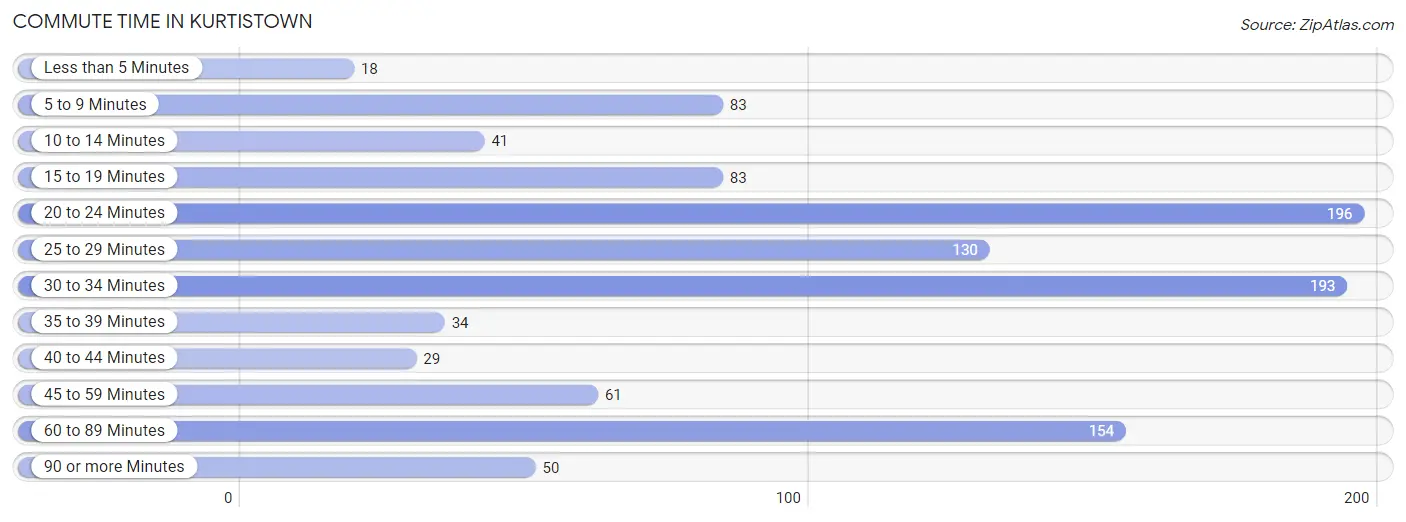
| Commute Time | # Commuters | % Commuters |
| Less than 5 Minutes | 18 | 1.7% |
| 5 to 9 Minutes | 83 | 7.7% |
| 10 to 14 Minutes | 41 | 3.8% |
| 15 to 19 Minutes | 83 | 7.7% |
| 20 to 24 Minutes | 196 | 18.3% |
| 25 to 29 Minutes | 130 | 12.1% |
| 30 to 34 Minutes | 193 | 18.0% |
| 35 to 39 Minutes | 34 | 3.2% |
| 40 to 44 Minutes | 29 | 2.7% |
| 45 to 59 Minutes | 61 | 5.7% |
| 60 to 89 Minutes | 154 | 14.4% |
| 90 or more Minutes | 50 | 4.7% |
Commute Time by Sex in Kurtistown
The most common commute times in Kurtistown are 20 to 24 minutes (120 commuters, 18.9%) for males and 30 to 34 minutes (94 commuters, 21.6%) for females.
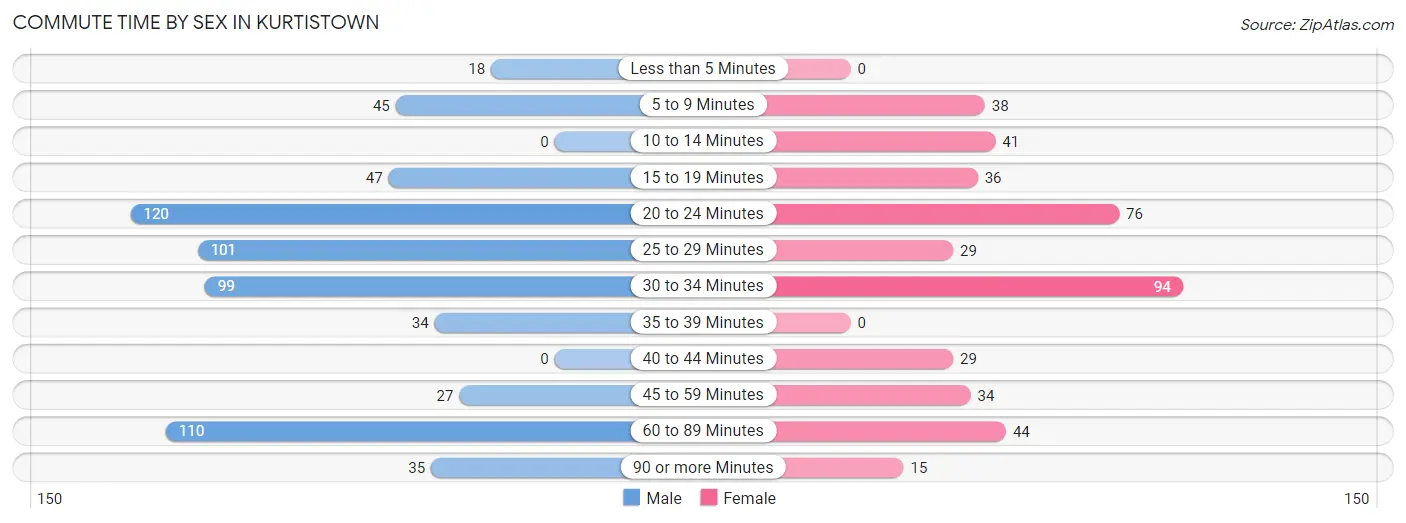
| Commute Time | Male | Female |
| Less than 5 Minutes | 18 (2.8%) | 0 (0.0%) |
| 5 to 9 Minutes | 45 (7.1%) | 38 (8.7%) |
| 10 to 14 Minutes | 0 (0.0%) | 41 (9.4%) |
| 15 to 19 Minutes | 47 (7.4%) | 36 (8.3%) |
| 20 to 24 Minutes | 120 (18.9%) | 76 (17.4%) |
| 25 to 29 Minutes | 101 (15.9%) | 29 (6.7%) |
| 30 to 34 Minutes | 99 (15.6%) | 94 (21.6%) |
| 35 to 39 Minutes | 34 (5.3%) | 0 (0.0%) |
| 40 to 44 Minutes | 0 (0.0%) | 29 (6.7%) |
| 45 to 59 Minutes | 27 (4.3%) | 34 (7.8%) |
| 60 to 89 Minutes | 110 (17.3%) | 44 (10.1%) |
| 90 or more Minutes | 35 (5.5%) | 15 (3.4%) |
Time of Departure to Work by Sex in Kurtistown
The most frequent times of departure to work in Kurtistown are 6:00 AM to 6:29 AM (167, 26.3%) for males and 7:00 AM to 7:29 AM (85, 19.5%) for females.
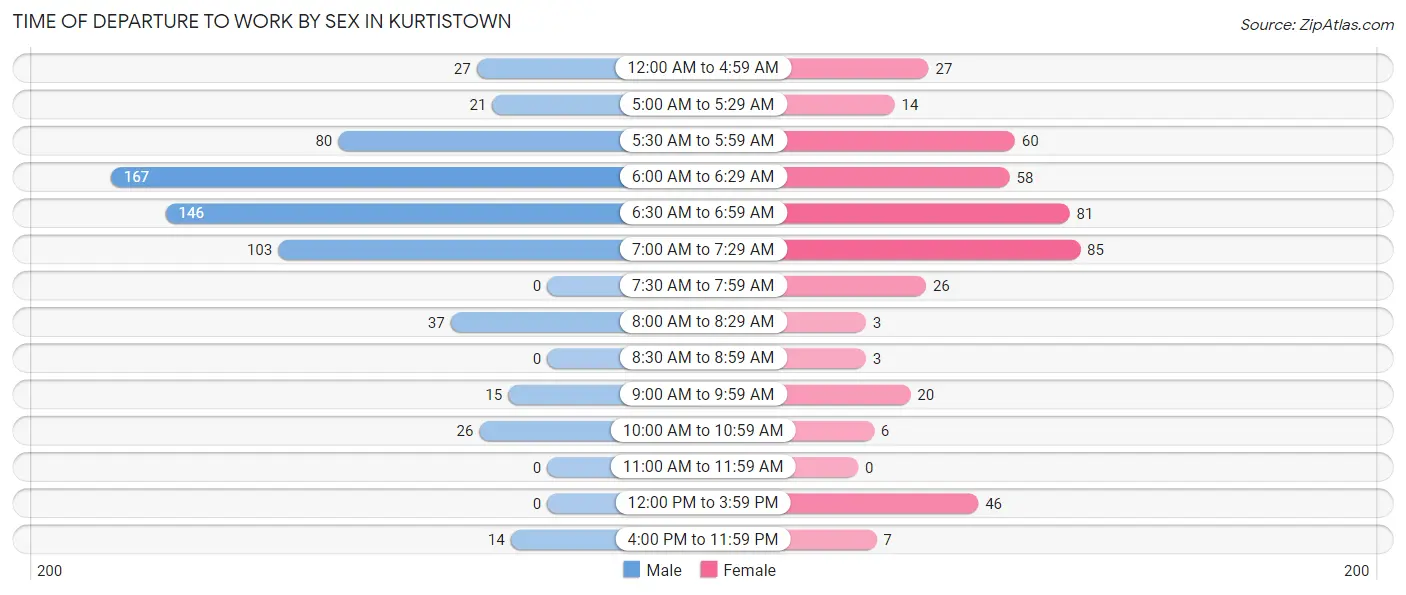
| Time of Departure | Male | Female |
| 12:00 AM to 4:59 AM | 27 (4.3%) | 27 (6.2%) |
| 5:00 AM to 5:29 AM | 21 (3.3%) | 14 (3.2%) |
| 5:30 AM to 5:59 AM | 80 (12.6%) | 60 (13.8%) |
| 6:00 AM to 6:29 AM | 167 (26.3%) | 58 (13.3%) |
| 6:30 AM to 6:59 AM | 146 (23.0%) | 81 (18.6%) |
| 7:00 AM to 7:29 AM | 103 (16.2%) | 85 (19.5%) |
| 7:30 AM to 7:59 AM | 0 (0.0%) | 26 (6.0%) |
| 8:00 AM to 8:29 AM | 37 (5.8%) | 3 (0.7%) |
| 8:30 AM to 8:59 AM | 0 (0.0%) | 3 (0.7%) |
| 9:00 AM to 9:59 AM | 15 (2.4%) | 20 (4.6%) |
| 10:00 AM to 10:59 AM | 26 (4.1%) | 6 (1.4%) |
| 11:00 AM to 11:59 AM | 0 (0.0%) | 0 (0.0%) |
| 12:00 PM to 3:59 PM | 0 (0.0%) | 46 (10.5%) |
| 4:00 PM to 11:59 PM | 14 (2.2%) | 7 (1.6%) |
| Total | 636 (100.0%) | 436 (100.0%) |
Housing Occupancy in Kurtistown
Occupancy by Ownership in Kurtistown
Of the total 914 dwellings in Kurtistown, owner-occupied units account for 816 (89.3%), while renter-occupied units make up 98 (10.7%).
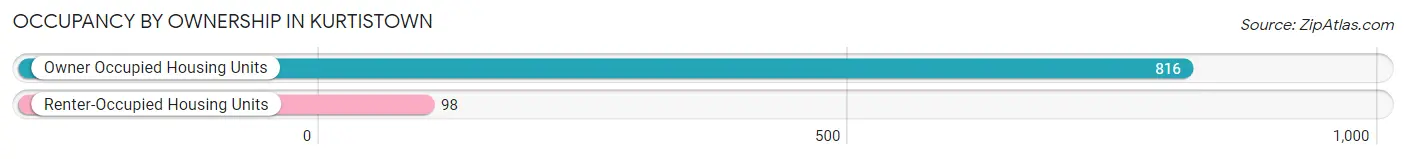
| Occupancy | # Housing Units | % Housing Units |
| Owner Occupied Housing Units | 816 | 89.3% |
| Renter-Occupied Housing Units | 98 | 10.7% |
| Total Occupied Housing Units | 914 | 100.0% |
Occupancy by Household Size in Kurtistown
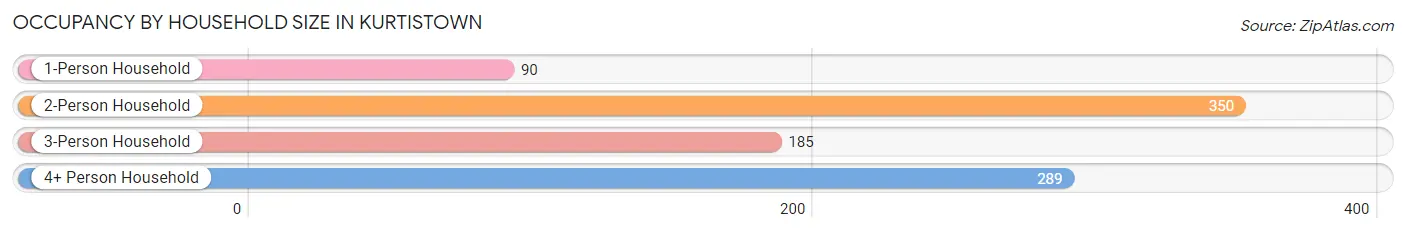
| Household Size | # Housing Units | % Housing Units |
| 1-Person Household | 90 | 9.9% |
| 2-Person Household | 350 | 38.3% |
| 3-Person Household | 185 | 20.2% |
| 4+ Person Household | 289 | 31.6% |
| Total Housing Units | 914 | 100.0% |
Occupancy by Ownership by Household Size in Kurtistown
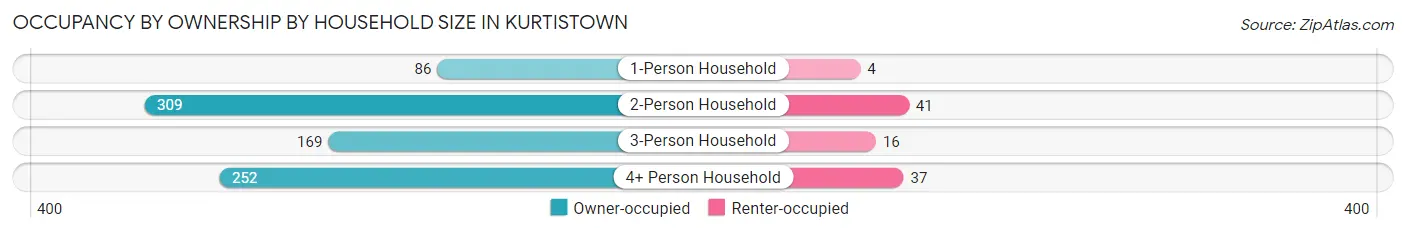
| Household Size | Owner-occupied | Renter-occupied |
| 1-Person Household | 86 (95.6%) | 4 (4.4%) |
| 2-Person Household | 309 (88.3%) | 41 (11.7%) |
| 3-Person Household | 169 (91.3%) | 16 (8.6%) |
| 4+ Person Household | 252 (87.2%) | 37 (12.8%) |
| Total Housing Units | 816 (89.3%) | 98 (10.7%) |
Occupancy by Educational Attainment in Kurtistown
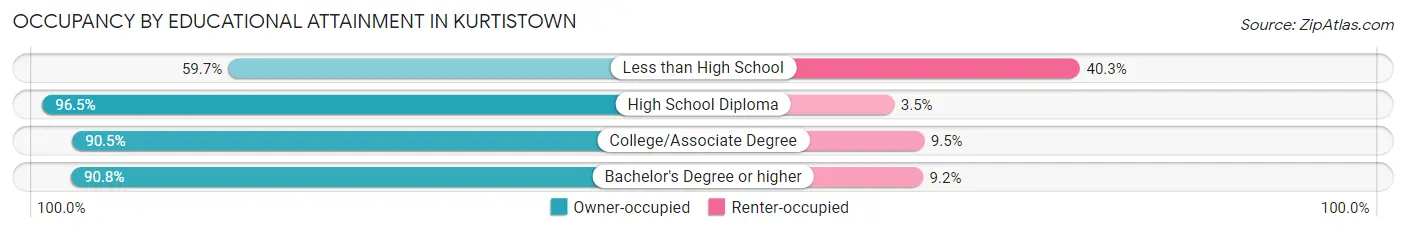
| Household Size | Owner-occupied | Renter-occupied |
| Less than High School | 37 (59.7%) | 25 (40.3%) |
| High School Diploma | 110 (96.5%) | 4 (3.5%) |
| College/Associate Degree | 354 (90.5%) | 37 (9.5%) |
| Bachelor's Degree or higher | 315 (90.8%) | 32 (9.2%) |
Occupancy by Age of Householder in Kurtistown
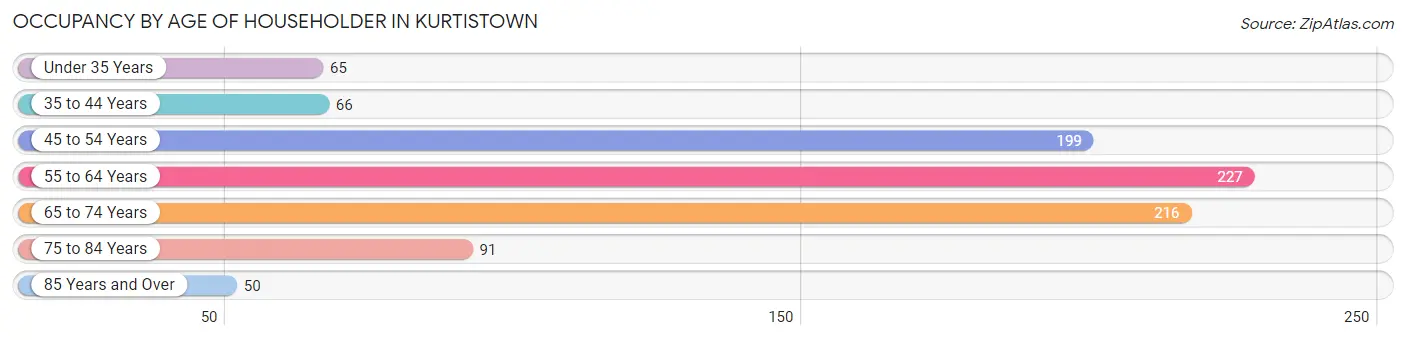
| Age Bracket | # Households | % Households |
| Under 35 Years | 65 | 7.1% |
| 35 to 44 Years | 66 | 7.2% |
| 45 to 54 Years | 199 | 21.8% |
| 55 to 64 Years | 227 | 24.8% |
| 65 to 74 Years | 216 | 23.6% |
| 75 to 84 Years | 91 | 10.0% |
| 85 Years and Over | 50 | 5.5% |
| Total | 914 | 100.0% |
Housing Finances in Kurtistown
Median Income by Occupancy in Kurtistown
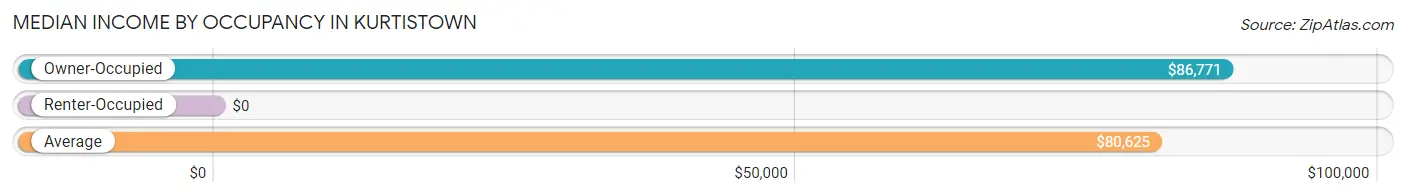
| Occupancy Type | # Households | Median Income |
| Owner-Occupied | 816 (89.3%) | $86,771 |
| Renter-Occupied | 98 (10.7%) | $0 |
| Average | 914 (100.0%) | $80,625 |
Occupancy by Householder Income Bracket in Kurtistown
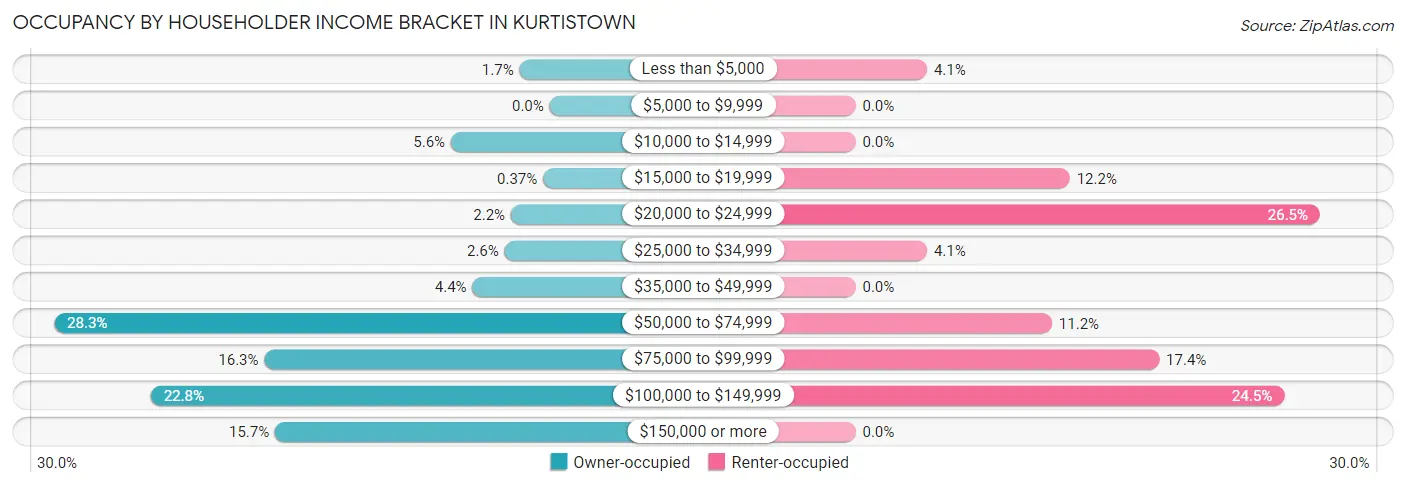
| Income Bracket | Owner-occupied | Renter-occupied |
| Less than $5,000 | 14 (1.7%) | 4 (4.1%) |
| $5,000 to $9,999 | 0 (0.0%) | 0 (0.0%) |
| $10,000 to $14,999 | 46 (5.6%) | 0 (0.0%) |
| $15,000 to $19,999 | 3 (0.4%) | 12 (12.2%) |
| $20,000 to $24,999 | 18 (2.2%) | 26 (26.5%) |
| $25,000 to $34,999 | 21 (2.6%) | 4 (4.1%) |
| $35,000 to $49,999 | 36 (4.4%) | 0 (0.0%) |
| $50,000 to $74,999 | 231 (28.3%) | 11 (11.2%) |
| $75,000 to $99,999 | 133 (16.3%) | 17 (17.3%) |
| $100,000 to $149,999 | 186 (22.8%) | 24 (24.5%) |
| $150,000 or more | 128 (15.7%) | 0 (0.0%) |
| Total | 816 (100.0%) | 98 (100.0%) |
Monthly Housing Cost Tiers in Kurtistown
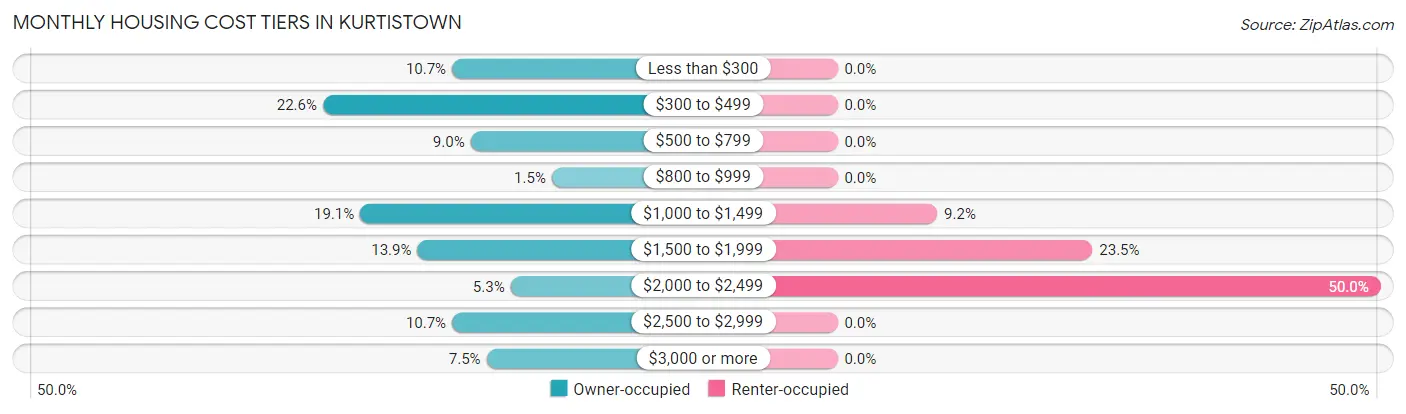
| Monthly Cost | Owner-occupied | Renter-occupied |
| Less than $300 | 87 (10.7%) | 0 (0.0%) |
| $300 to $499 | 184 (22.6%) | 0 (0.0%) |
| $500 to $799 | 73 (8.9%) | 0 (0.0%) |
| $800 to $999 | 12 (1.5%) | 0 (0.0%) |
| $1,000 to $1,499 | 156 (19.1%) | 9 (9.2%) |
| $1,500 to $1,999 | 113 (13.9%) | 23 (23.5%) |
| $2,000 to $2,499 | 43 (5.3%) | 49 (50.0%) |
| $2,500 to $2,999 | 87 (10.7%) | 0 (0.0%) |
| $3,000 or more | 61 (7.5%) | 0 (0.0%) |
| Total | 816 (100.0%) | 98 (100.0%) |
Physical Housing Characteristics in Kurtistown
Housing Structures in Kurtistown
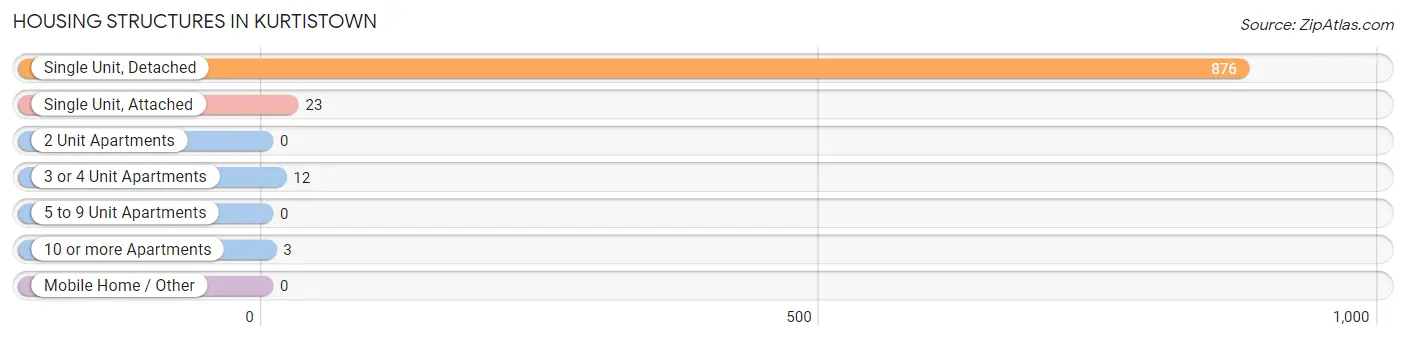
| Structure Type | # Housing Units | % Housing Units |
| Single Unit, Detached | 876 | 95.8% |
| Single Unit, Attached | 23 | 2.5% |
| 2 Unit Apartments | 0 | 0.0% |
| 3 or 4 Unit Apartments | 12 | 1.3% |
| 5 to 9 Unit Apartments | 0 | 0.0% |
| 10 or more Apartments | 3 | 0.3% |
| Mobile Home / Other | 0 | 0.0% |
| Total | 914 | 100.0% |
Housing Structures by Occupancy in Kurtistown
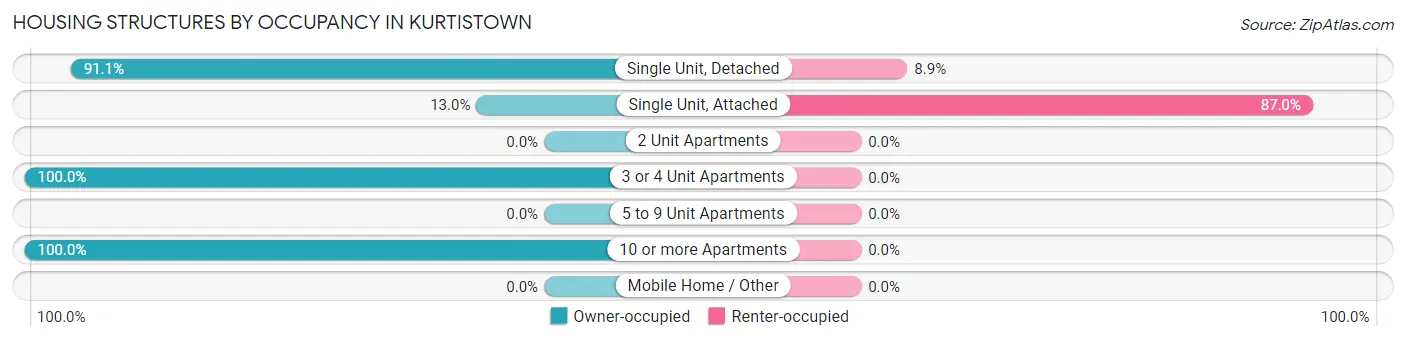
| Structure Type | Owner-occupied | Renter-occupied |
| Single Unit, Detached | 798 (91.1%) | 78 (8.9%) |
| Single Unit, Attached | 3 (13.0%) | 20 (87.0%) |
| 2 Unit Apartments | 0 (0.0%) | 0 (0.0%) |
| 3 or 4 Unit Apartments | 12 (100.0%) | 0 (0.0%) |
| 5 to 9 Unit Apartments | 0 (0.0%) | 0 (0.0%) |
| 10 or more Apartments | 3 (100.0%) | 0 (0.0%) |
| Mobile Home / Other | 0 (0.0%) | 0 (0.0%) |
| Total | 816 (89.3%) | 98 (10.7%) |
Housing Structures by Number of Rooms in Kurtistown
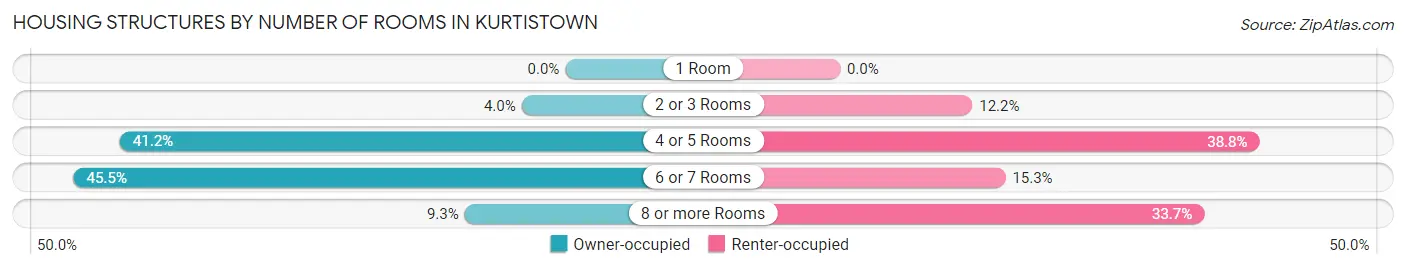
| Number of Rooms | Owner-occupied | Renter-occupied |
| 1 Room | 0 (0.0%) | 0 (0.0%) |
| 2 or 3 Rooms | 33 (4.0%) | 12 (12.2%) |
| 4 or 5 Rooms | 336 (41.2%) | 38 (38.8%) |
| 6 or 7 Rooms | 371 (45.5%) | 15 (15.3%) |
| 8 or more Rooms | 76 (9.3%) | 33 (33.7%) |
| Total | 816 (100.0%) | 98 (100.0%) |
Housing Structure by Heating Type in Kurtistown
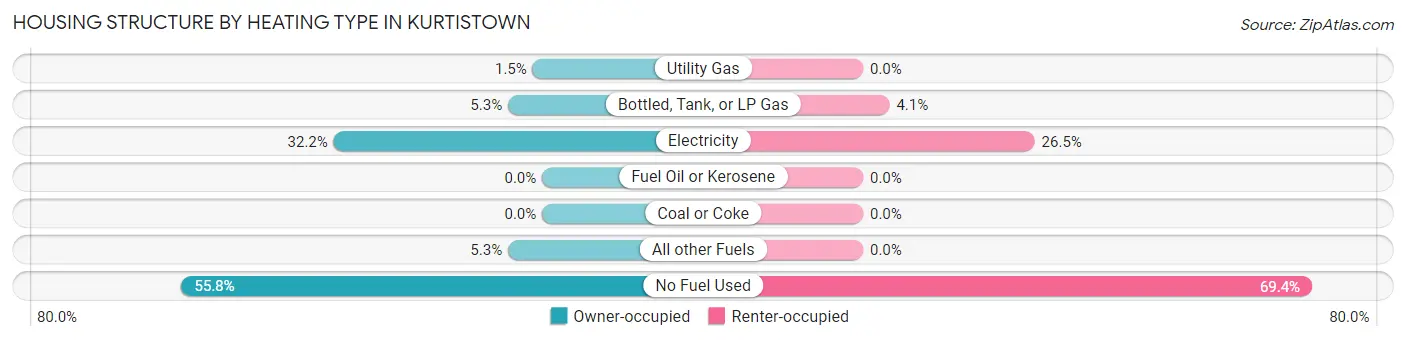
| Heating Type | Owner-occupied | Renter-occupied |
| Utility Gas | 12 (1.5%) | 0 (0.0%) |
| Bottled, Tank, or LP Gas | 43 (5.3%) | 4 (4.1%) |
| Electricity | 263 (32.2%) | 26 (26.5%) |
| Fuel Oil or Kerosene | 0 (0.0%) | 0 (0.0%) |
| Coal or Coke | 0 (0.0%) | 0 (0.0%) |
| All other Fuels | 43 (5.3%) | 0 (0.0%) |
| No Fuel Used | 455 (55.8%) | 68 (69.4%) |
| Total | 816 (100.0%) | 98 (100.0%) |
Household Vehicle Usage in Kurtistown
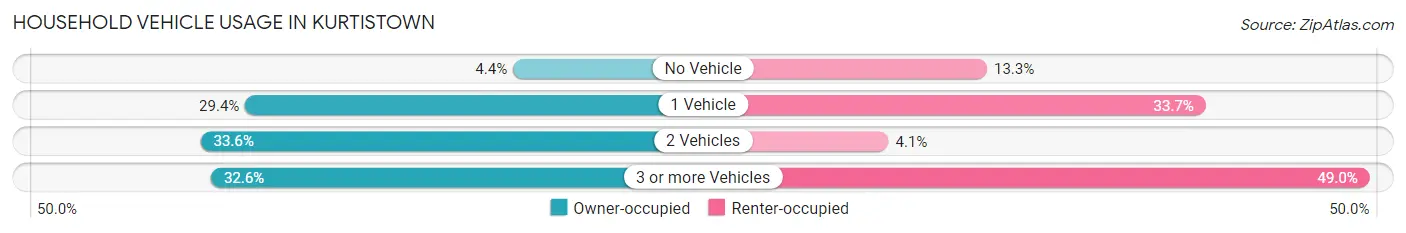
| Vehicles per Household | Owner-occupied | Renter-occupied |
| No Vehicle | 36 (4.4%) | 13 (13.3%) |
| 1 Vehicle | 240 (29.4%) | 33 (33.7%) |
| 2 Vehicles | 274 (33.6%) | 4 (4.1%) |
| 3 or more Vehicles | 266 (32.6%) | 48 (49.0%) |
| Total | 816 (100.0%) | 98 (100.0%) |
Real Estate & Mortgages in Kurtistown
Real Estate and Mortgage Overview in Kurtistown
| Characteristic | Without Mortgage | With Mortgage |
| Housing Units | 310 | 506 |
| Median Property Value | $412,500 | $418,800 |
| Median Household Income | $76,964 | $62 |
| Monthly Housing Costs | $368 | $61 |
| Real Estate Taxes | $1,007 | $133 |
Property Value by Mortgage Status in Kurtistown
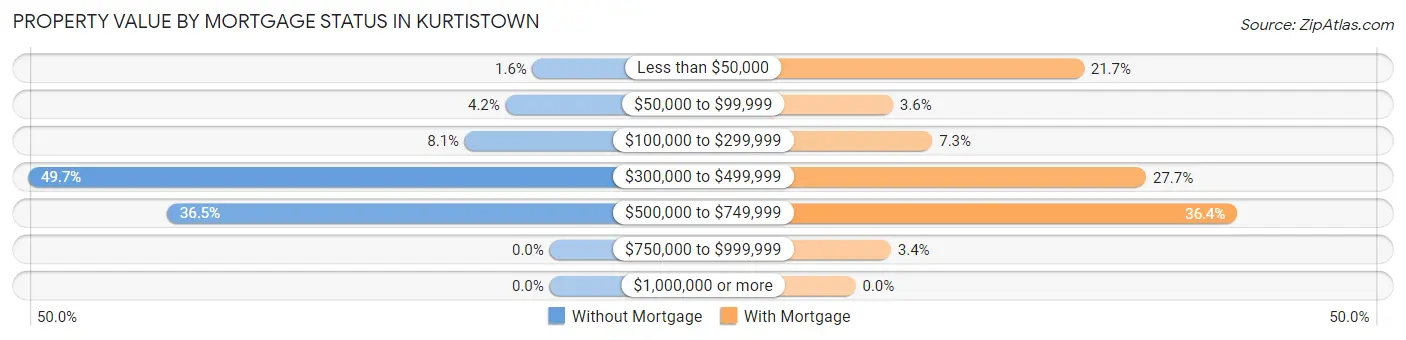
| Property Value | Without Mortgage | With Mortgage |
| Less than $50,000 | 5 (1.6%) | 110 (21.7%) |
| $50,000 to $99,999 | 13 (4.2%) | 18 (3.6%) |
| $100,000 to $299,999 | 25 (8.1%) | 37 (7.3%) |
| $300,000 to $499,999 | 154 (49.7%) | 140 (27.7%) |
| $500,000 to $749,999 | 113 (36.4%) | 184 (36.4%) |
| $750,000 to $999,999 | 0 (0.0%) | 17 (3.4%) |
| $1,000,000 or more | 0 (0.0%) | 0 (0.0%) |
| Total | 310 (100.0%) | 506 (100.0%) |
Household Income by Mortgage Status in Kurtistown
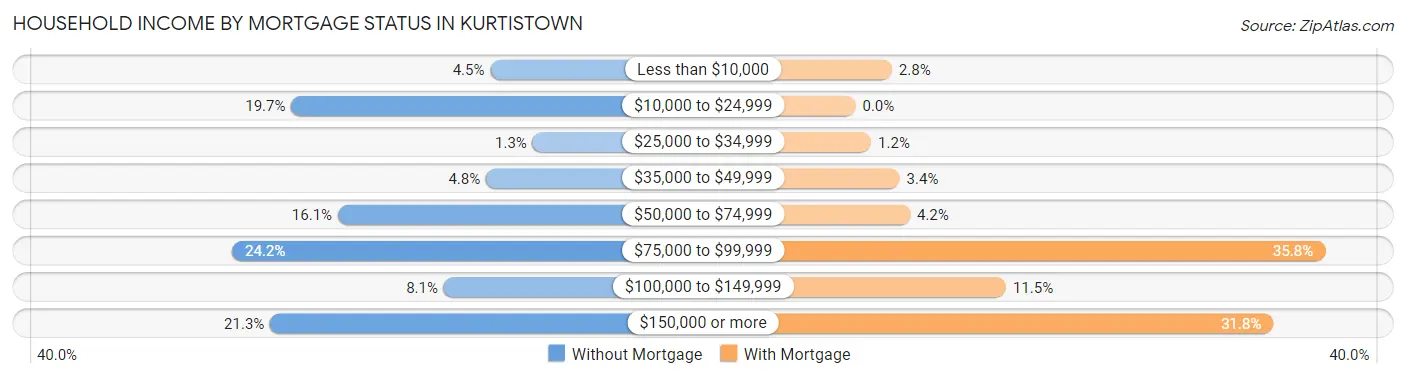
| Household Income | Without Mortgage | With Mortgage |
| Less than $10,000 | 14 (4.5%) | 14 (2.8%) |
| $10,000 to $24,999 | 61 (19.7%) | 0 (0.0%) |
| $25,000 to $34,999 | 4 (1.3%) | 6 (1.2%) |
| $35,000 to $49,999 | 15 (4.8%) | 17 (3.4%) |
| $50,000 to $74,999 | 50 (16.1%) | 21 (4.2%) |
| $75,000 to $99,999 | 75 (24.2%) | 181 (35.8%) |
| $100,000 to $149,999 | 25 (8.1%) | 58 (11.5%) |
| $150,000 or more | 66 (21.3%) | 161 (31.8%) |
| Total | 310 (100.0%) | 506 (100.0%) |
Property Value to Household Income Ratio in Kurtistown
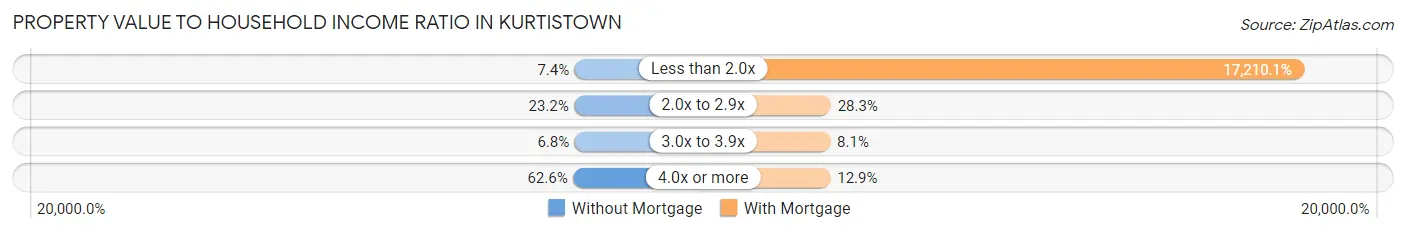
| Value-to-Income Ratio | Without Mortgage | With Mortgage |
| Less than 2.0x | 23 (7.4%) | 87,083 (17,210.1%) |
| 2.0x to 2.9x | 72 (23.2%) | 143 (28.3%) |
| 3.0x to 3.9x | 21 (6.8%) | 41 (8.1%) |
| 4.0x or more | 194 (62.6%) | 65 (12.9%) |
| Total | 310 (100.0%) | 506 (100.0%) |
Real Estate Taxes by Mortgage Status in Kurtistown
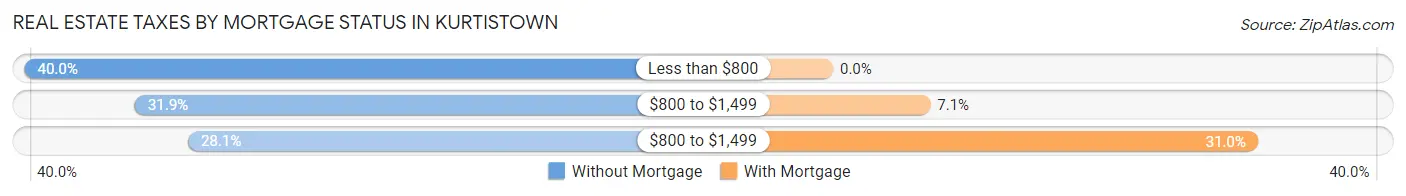
| Property Taxes | Without Mortgage | With Mortgage |
| Less than $800 | 124 (40.0%) | 0 (0.0%) |
| $800 to $1,499 | 99 (31.9%) | 36 (7.1%) |
| $800 to $1,499 | 87 (28.1%) | 157 (31.0%) |
| Total | 310 (100.0%) | 506 (100.0%) |
Health & Disability in Kurtistown
Health Insurance Coverage by Age in Kurtistown
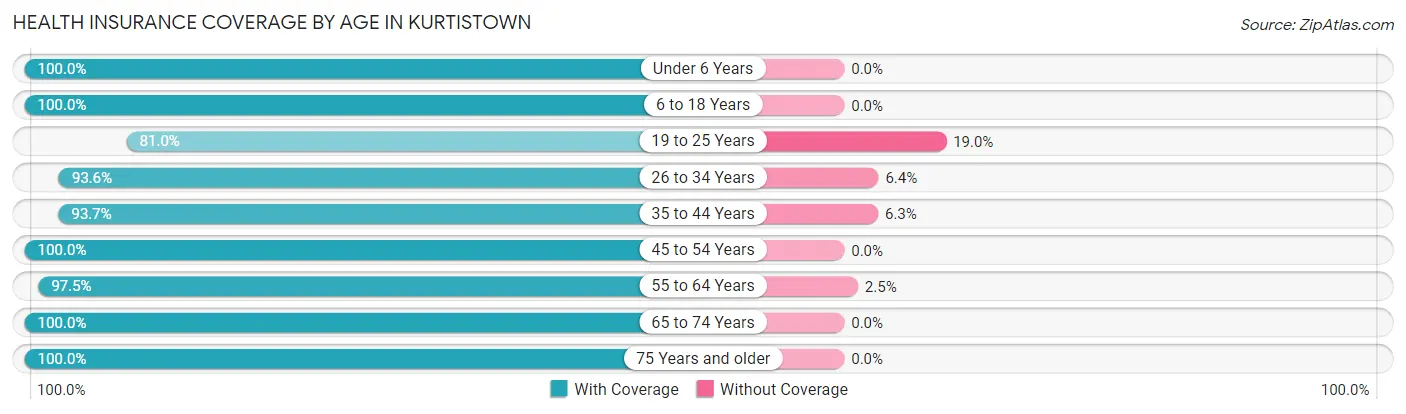
| Age Bracket | With Coverage | Without Coverage |
| Under 6 Years | 163 (100.0%) | 0 (0.0%) |
| 6 to 18 Years | 412 (100.0%) | 0 (0.0%) |
| 19 to 25 Years | 81 (81.0%) | 19 (19.0%) |
| 26 to 34 Years | 323 (93.6%) | 22 (6.4%) |
| 35 to 44 Years | 164 (93.7%) | 11 (6.3%) |
| 45 to 54 Years | 485 (100.0%) | 0 (0.0%) |
| 55 to 64 Years | 422 (97.5%) | 11 (2.5%) |
| 65 to 74 Years | 538 (100.0%) | 0 (0.0%) |
| 75 Years and older | 244 (100.0%) | 0 (0.0%) |
| Total | 2,832 (97.8%) | 63 (2.2%) |
Health Insurance Coverage by Citizenship Status in Kurtistown
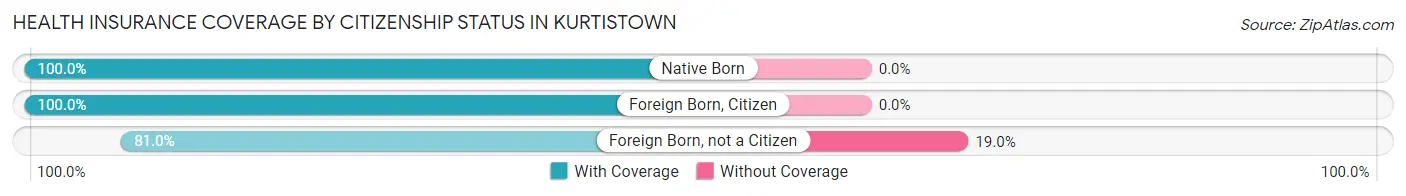
| Citizenship Status | With Coverage | Without Coverage |
| Native Born | 163 (100.0%) | 0 (0.0%) |
| Foreign Born, Citizen | 412 (100.0%) | 0 (0.0%) |
| Foreign Born, not a Citizen | 81 (81.0%) | 19 (19.0%) |
Health Insurance Coverage by Household Income in Kurtistown
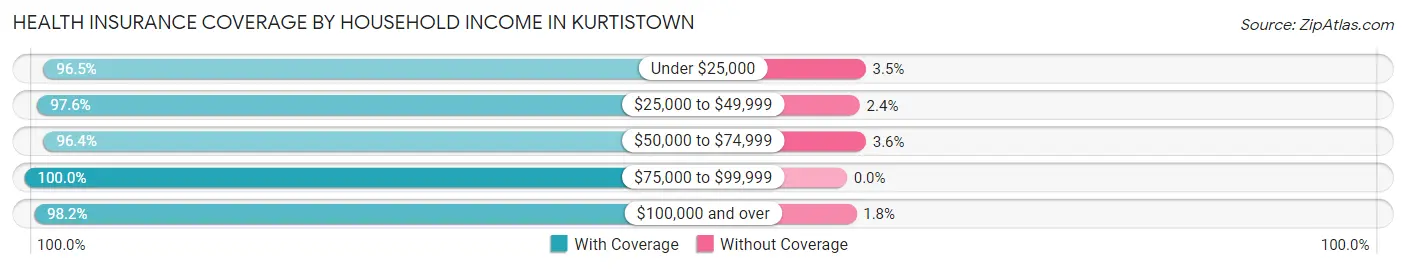
| Household Income | With Coverage | Without Coverage |
| Under $25,000 | 301 (96.5%) | 11 (3.5%) |
| $25,000 to $49,999 | 162 (97.6%) | 4 (2.4%) |
| $50,000 to $74,999 | 704 (96.4%) | 26 (3.6%) |
| $75,000 to $99,999 | 435 (100.0%) | 0 (0.0%) |
| $100,000 and over | 1,217 (98.2%) | 22 (1.8%) |
Public vs Private Health Insurance Coverage by Age in Kurtistown
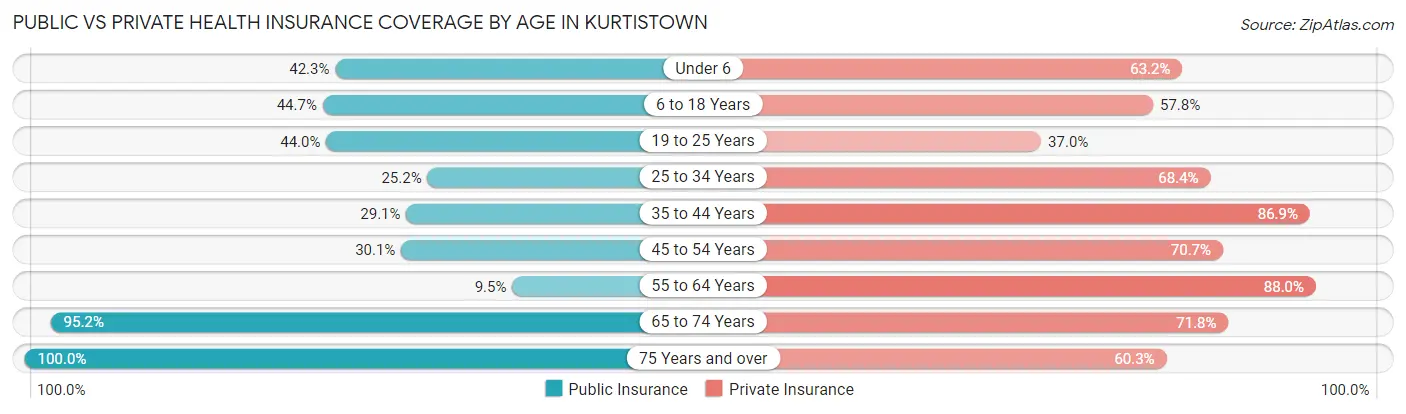
| Age Bracket | Public Insurance | Private Insurance |
| Under 6 | 69 (42.3%) | 103 (63.2%) |
| 6 to 18 Years | 184 (44.7%) | 238 (57.8%) |
| 19 to 25 Years | 44 (44.0%) | 37 (37.0%) |
| 25 to 34 Years | 87 (25.2%) | 236 (68.4%) |
| 35 to 44 Years | 51 (29.1%) | 152 (86.9%) |
| 45 to 54 Years | 146 (30.1%) | 343 (70.7%) |
| 55 to 64 Years | 41 (9.5%) | 381 (88.0%) |
| 65 to 74 Years | 512 (95.2%) | 386 (71.8%) |
| 75 Years and over | 244 (100.0%) | 147 (60.3%) |
| Total | 1,378 (47.6%) | 2,023 (69.9%) |
Disability Status by Sex by Age in Kurtistown
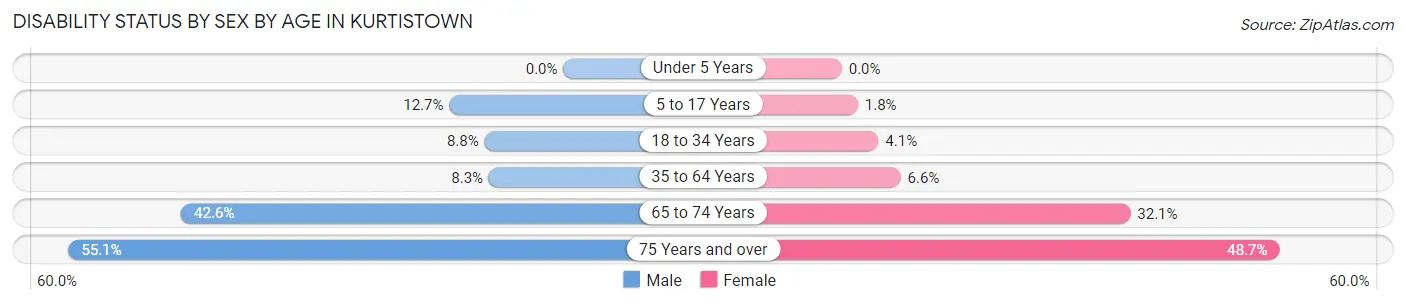
| Age Bracket | Male | Female |
| Under 5 Years | 0 (0.0%) | 0 (0.0%) |
| 5 to 17 Years | 31 (12.7%) | 4 (1.8%) |
| 18 to 34 Years | 23 (8.8%) | 8 (4.1%) |
| 35 to 64 Years | 45 (8.3%) | 36 (6.6%) |
| 65 to 74 Years | 86 (42.6%) | 108 (32.1%) |
| 75 Years and over | 70 (55.1%) | 57 (48.7%) |
Disability Class by Sex by Age in Kurtistown
Disability Class: Hearing Difficulty
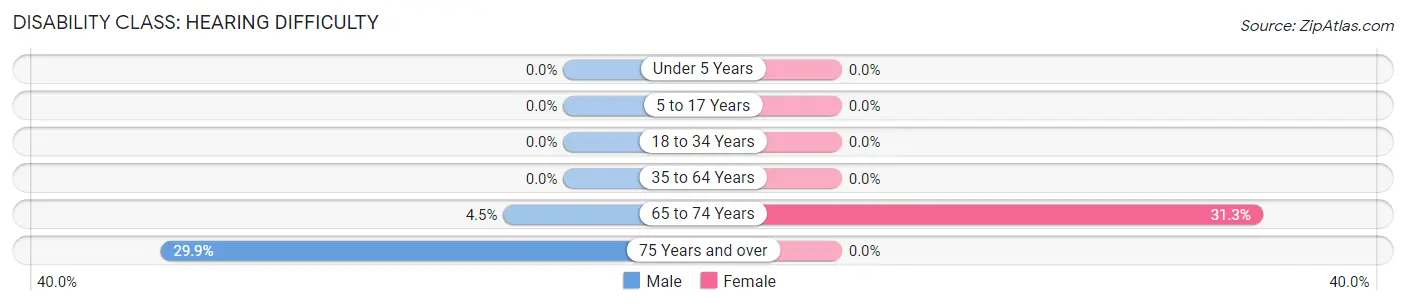
| Age Bracket | Male | Female |
| Under 5 Years | 0 (0.0%) | 0 (0.0%) |
| 5 to 17 Years | 0 (0.0%) | 0 (0.0%) |
| 18 to 34 Years | 0 (0.0%) | 0 (0.0%) |
| 35 to 64 Years | 0 (0.0%) | 0 (0.0%) |
| 65 to 74 Years | 9 (4.5%) | 105 (31.2%) |
| 75 Years and over | 38 (29.9%) | 0 (0.0%) |
Disability Class: Vision Difficulty
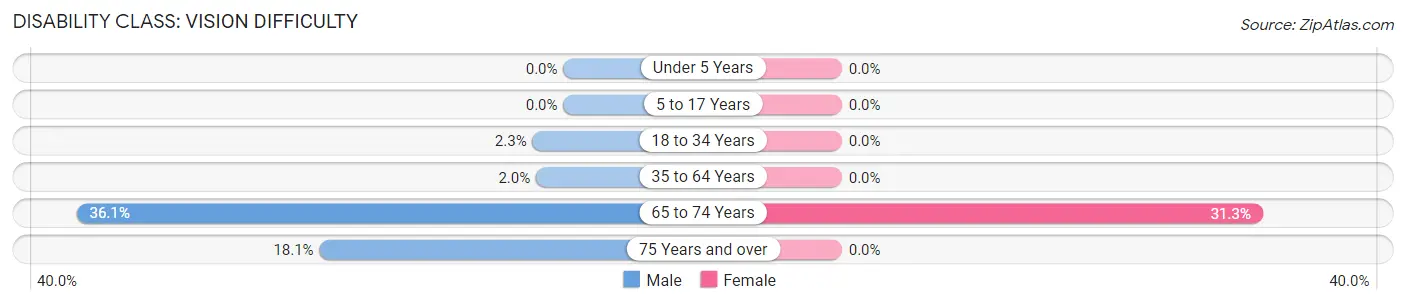
| Age Bracket | Male | Female |
| Under 5 Years | 0 (0.0%) | 0 (0.0%) |
| 5 to 17 Years | 0 (0.0%) | 0 (0.0%) |
| 18 to 34 Years | 6 (2.3%) | 0 (0.0%) |
| 35 to 64 Years | 11 (2.0%) | 0 (0.0%) |
| 65 to 74 Years | 73 (36.1%) | 105 (31.2%) |
| 75 Years and over | 23 (18.1%) | 0 (0.0%) |
Disability Class: Cognitive Difficulty
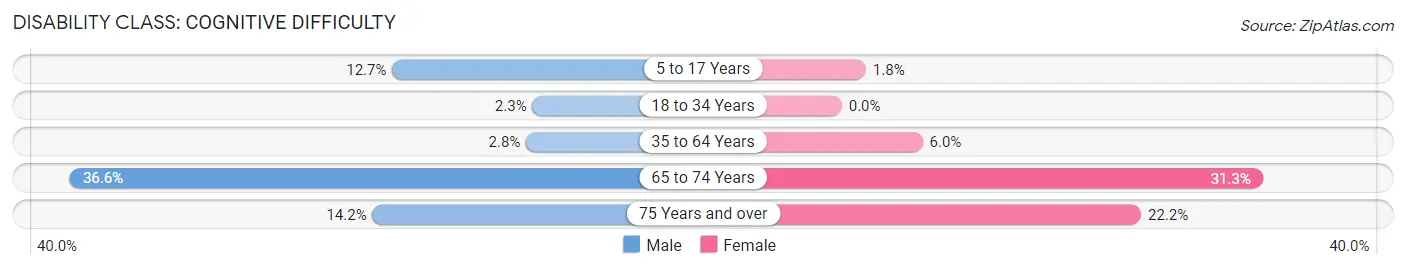
| Age Bracket | Male | Female |
| 5 to 17 Years | 31 (12.7%) | 4 (1.8%) |
| 18 to 34 Years | 6 (2.3%) | 0 (0.0%) |
| 35 to 64 Years | 15 (2.8%) | 33 (6.0%) |
| 65 to 74 Years | 74 (36.6%) | 105 (31.2%) |
| 75 Years and over | 18 (14.2%) | 26 (22.2%) |
Disability Class: Ambulatory Difficulty
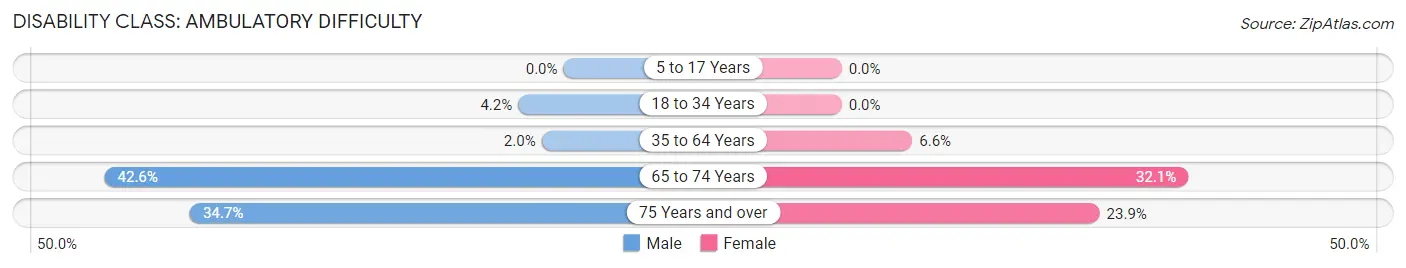
| Age Bracket | Male | Female |
| 5 to 17 Years | 0 (0.0%) | 0 (0.0%) |
| 18 to 34 Years | 11 (4.2%) | 0 (0.0%) |
| 35 to 64 Years | 11 (2.0%) | 36 (6.6%) |
| 65 to 74 Years | 86 (42.6%) | 108 (32.1%) |
| 75 Years and over | 44 (34.6%) | 28 (23.9%) |
Disability Class: Self-Care Difficulty
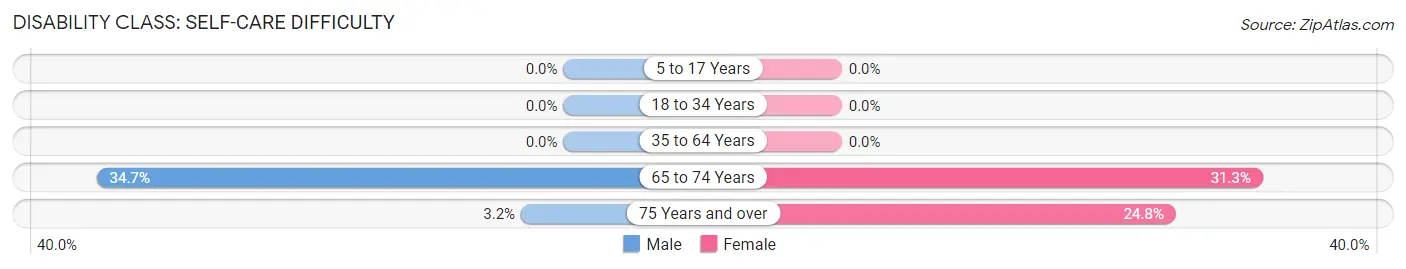
| Age Bracket | Male | Female |
| 5 to 17 Years | 0 (0.0%) | 0 (0.0%) |
| 18 to 34 Years | 0 (0.0%) | 0 (0.0%) |
| 35 to 64 Years | 0 (0.0%) | 0 (0.0%) |
| 65 to 74 Years | 70 (34.6%) | 105 (31.2%) |
| 75 Years and over | 4 (3.2%) | 29 (24.8%) |
Technology Access in Kurtistown
Computing Device Access in Kurtistown
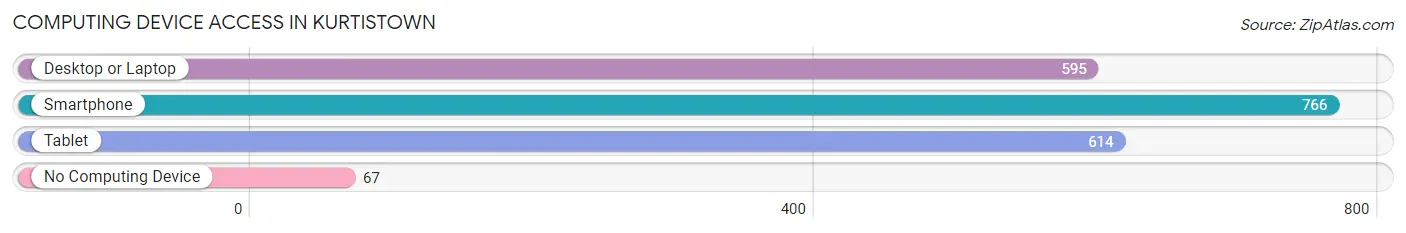
| Device Type | # Households | % Households |
| Desktop or Laptop | 595 | 65.1% |
| Smartphone | 766 | 83.8% |
| Tablet | 614 | 67.2% |
| No Computing Device | 67 | 7.3% |
| Total | 914 | 100.0% |
Internet Access in Kurtistown
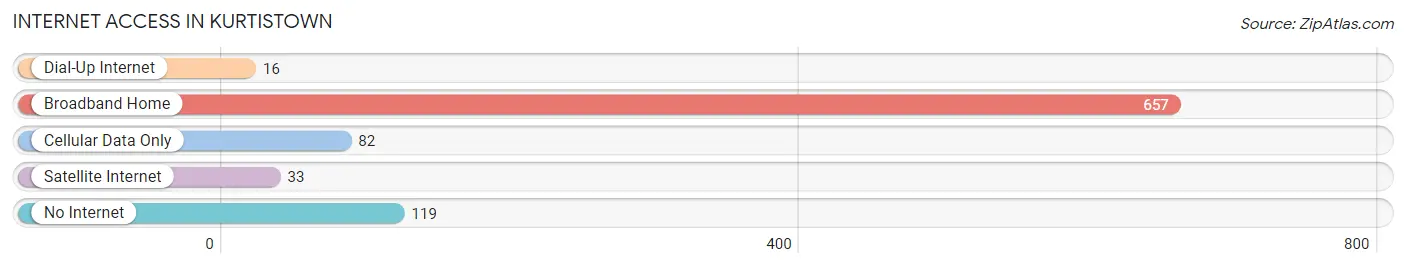
| Internet Type | # Households | % Households |
| Dial-Up Internet | 16 | 1.8% |
| Broadband Home | 657 | 71.9% |
| Cellular Data Only | 82 | 9.0% |
| Satellite Internet | 33 | 3.6% |
| No Internet | 119 | 13.0% |
| Total | 914 | 100.0% |
Kurtistown Summary
Kurtistown is a census-designated place (CDP) located in the Puna District of Hawaii County, Hawaii, United States. The population was 2,845 at the 2010 census, up from 2,077 at the 2000 census. Kurtistown is located on the eastern side of the island of Hawaii, about 10 miles (16 km) south of Hilo.
Geography
Kurtistown is located at 19°33′17″N 155°2′17″W (19.554800, -155.038100). According to the United States Census Bureau, the CDP has a total area of 4.3 square miles (11.2 km2), all of it land.
Demographics
As of the census of 2000, there were 2,077 people, 690 households, and 517 families residing in the CDP. The population density was 483.3 people per square mile (186.7/km2). There were 745 housing units at an average density of 173.9 per square mile (67.1/km2). The racial makeup of the CDP was 24.2% White, 0.2% African American, 0.2% Native American, 28.2% Asian, 10.2% Pacific Islander, 0.2% from other races, and 36.9% from two or more races. Hispanic or Latino of any race were 8.2% of the population.
There were 690 households, out of which 37.2% had children under the age of 18 living with them, 54.3% were married couples living together, 14.5% had a female householder with no husband present, and 24.6% were non-families. 19.4% of all households were made up of individuals, and 8.3% had someone living alone who was 65 years of age or older. The average household size was 3.00 and the average family size was 3.45.
In the CDP the population was spread out, with 28.7% under the age of 18, 8.7% from 18 to 24, 27.2% from 25 to 44, 22.2% from 45 to 64, and 13.2% who were 65 years of age or older. The median age was 36 years. For every 100 females, there were 101.2 males. For every 100 females age 18 and over, there were 97.7 males.
The median income for a household in the CDP was $37,917, and the median income for a family was $41,250. Males had a median income of $30,000 versus $25,000 for females. The per capita income for the CDP was $14,945. About 11.2% of families and 14.2% of the population were below the poverty line, including 17.2% of those under age 18 and 8.3% of those age 65 or over.
Economy
Kurtistown is home to several small businesses, including a gas station, a grocery store, a hardware store, and a few restaurants. The town is also home to a number of small farms, which produce a variety of fruits and vegetables.
Kurtistown is also home to the Hawaii Tropical Botanical Garden, a popular tourist attraction. The garden features a variety of tropical plants, flowers, and trees, as well as a number of walking trails.
Kurtistown is also home to the Hawaii Volcanoes National Park, which is a popular tourist destination. The park features a variety of volcanic features, including lava tubes, steam vents, and craters. The park also features a variety of hiking trails, as well as a number of camping sites.
Kurtistown is also home to the University of Hawaii at Hilo, which is a public university. The university offers a variety of degree programs, including business, engineering, and education. The university also offers a number of research opportunities, as well as a variety of student activities.
Kurtistown is also home to the Hawaii County Fair, which is held annually in October. The fair features a variety of attractions, including carnival rides, food vendors, and live entertainment. The fair also features a variety of agricultural and livestock exhibits.
Conclusion
Kurtistown is a small town located in the Puna District of Hawaii County, Hawaii. The town has a population of 2,845 as of the 2010 census, and is home to a variety of small businesses, farms, and tourist attractions. The town is also home to the University of Hawaii at Hilo and the Hawaii County Fair. Kurtistown is a great place to live, work, and visit.
Common Questions
What is Per Capita Income in Kurtistown?
Per Capita income in Kurtistown is $33,663.
What is the Median Family Income in Kurtistown?
Median Family Income in Kurtistown is $85,221.
What is the Median Household income in Kurtistown?
Median Household Income in Kurtistown is $80,625.
What is Income or Wage Gap in Kurtistown?
Income or Wage Gap in Kurtistown is 3.9%.
Women in Kurtistown earn 96.1 cents for every dollar earned by a man.
What is Inequality or Gini Index in Kurtistown?
Inequality or Gini Index in Kurtistown is 0.40.
What is the Total Population of Kurtistown?
Total Population of Kurtistown is 2,896.
What is the Total Male Population of Kurtistown?
Total Male Population of Kurtistown is 1,413.
What is the Total Female Population of Kurtistown?
Total Female Population of Kurtistown is 1,483.
What is the Ratio of Males per 100 Females in Kurtistown?
There are 95.28 Males per 100 Females in Kurtistown.
What is the Ratio of Females per 100 Males in Kurtistown?
There are 104.95 Females per 100 Males in Kurtistown.
What is the Median Population Age in Kurtistown?
Median Population Age in Kurtistown is 49.4 Years.
What is the Average Family Size in Kurtistown
Average Family Size in Kurtistown is 3.3 People.
What is the Average Household Size in Kurtistown
Average Household Size in Kurtistown is 3.1 People.
How Large is the Labor Force in Kurtistown?
There are 1,268 People in the Labor Forcein in Kurtistown.
What is the Percentage of People in the Labor Force in Kurtistown?
53.3% of People are in the Labor Force in Kurtistown.
What is the Unemployment Rate in Kurtistown?
Unemployment Rate in Kurtistown is 8.0%.