Kapaau, HI Map & Demographics
Kapaau Map
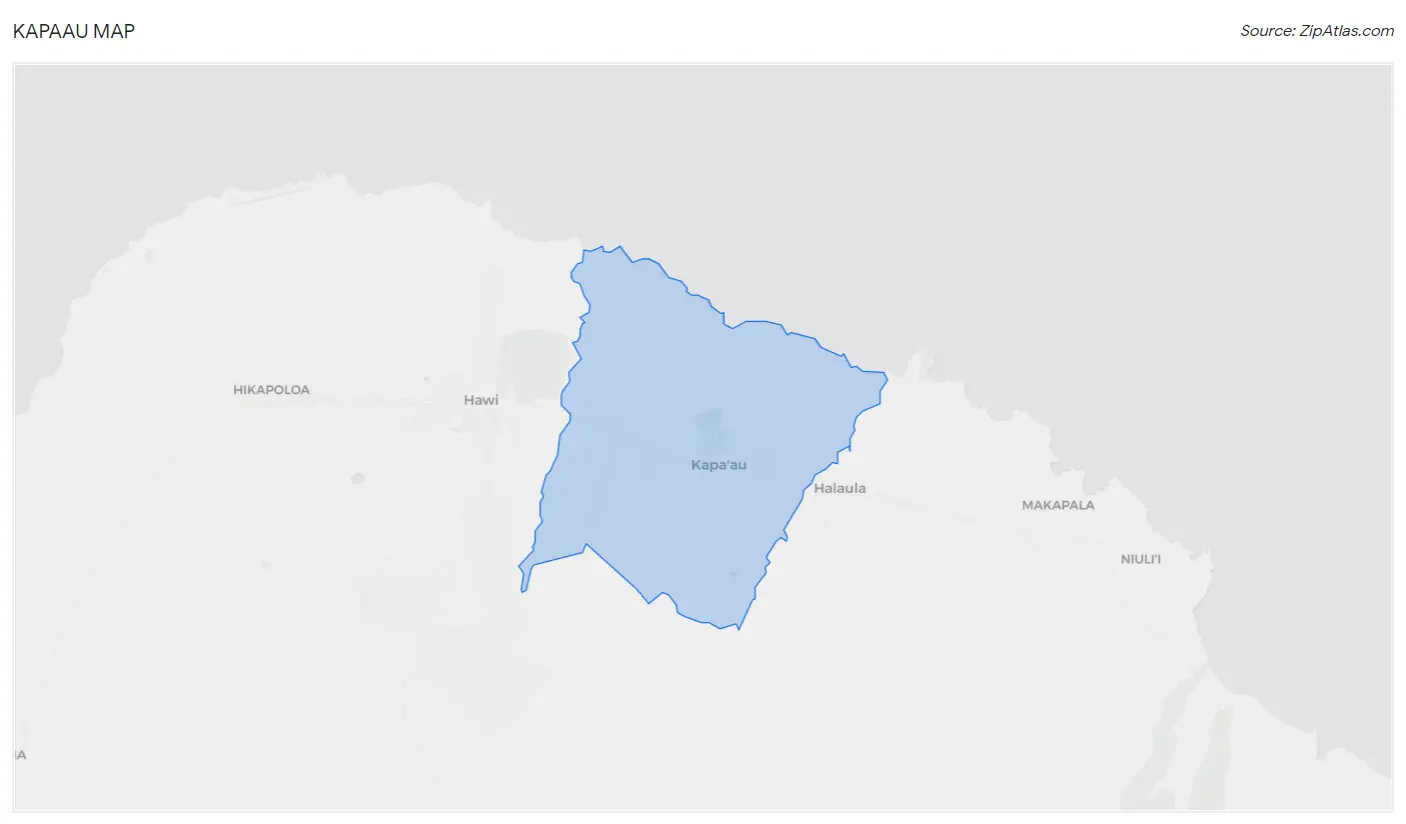
Kapaau Overview
$29,172
PER CAPITA INCOME
$83,021
AVG FAMILY INCOME
$65,076
AVG HOUSEHOLD INCOME
13.2%
WAGE / INCOME GAP [ % ]
86.8¢/ $1
WAGE / INCOME GAP [ $ ]
0.39
INEQUALITY / GINI INDEX
1,972
TOTAL POPULATION
885
MALE POPULATION
1,087
FEMALE POPULATION
81.42
MALES / 100 FEMALES
122.82
FEMALES / 100 MALES
45.8
MEDIAN AGE
3.8
AVG FAMILY SIZE
2.9
AVG HOUSEHOLD SIZE
1,100
LABOR FORCE [ PEOPLE ]
63.5%
PERCENT IN LABOR FORCE
5.4%
UNEMPLOYMENT RATE
Kapaau Zip Codes
Kapaau Area Codes
Income in Kapaau
Income Overview in Kapaau
Per Capita Income in Kapaau is $29,172, while median incomes of families and households are $83,021 and $65,076 respectively.
| Characteristic | Number | Measure |
| Per Capita Income | 1,972 | $29,172 |
| Median Family Income | 391 | $83,021 |
| Mean Family Income | 391 | $88,695 |
| Median Household Income | 666 | $65,076 |
| Mean Household Income | 666 | $74,252 |
| Income Deficit | 391 | $0 |
| Wage / Income Gap (%) | 1,972 | 13.25% |
| Wage / Income Gap ($) | 1,972 | 86.75¢ per $1 |
| Gini / Inequality Index | 1,972 | 0.39 |
Earnings by Sex in Kapaau
Average Earnings in Kapaau are $34,286, $31,644 for men and $36,477 for women, a difference of 13.3%.
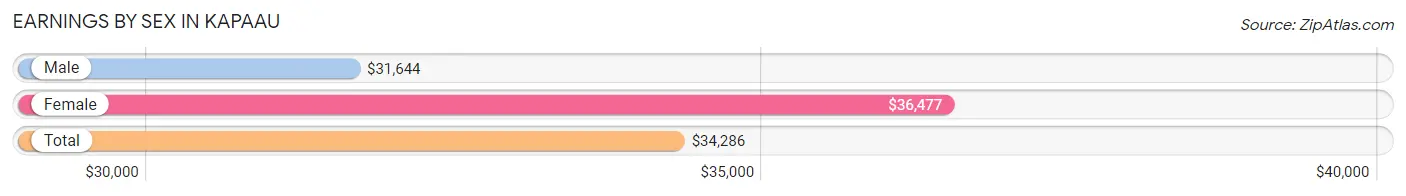
| Sex | Number | Average Earnings |
| Male | 539 (50.1%) | $31,644 |
| Female | 537 (49.9%) | $36,477 |
| Total | 1,076 (100.0%) | $34,286 |
Earnings by Sex by Income Bracket in Kapaau
The most common earnings brackets in Kapaau are $55,000 to $64,999 for men (104 | 19.3%) and $50,000 to $54,999 for women (71 | 13.2%).
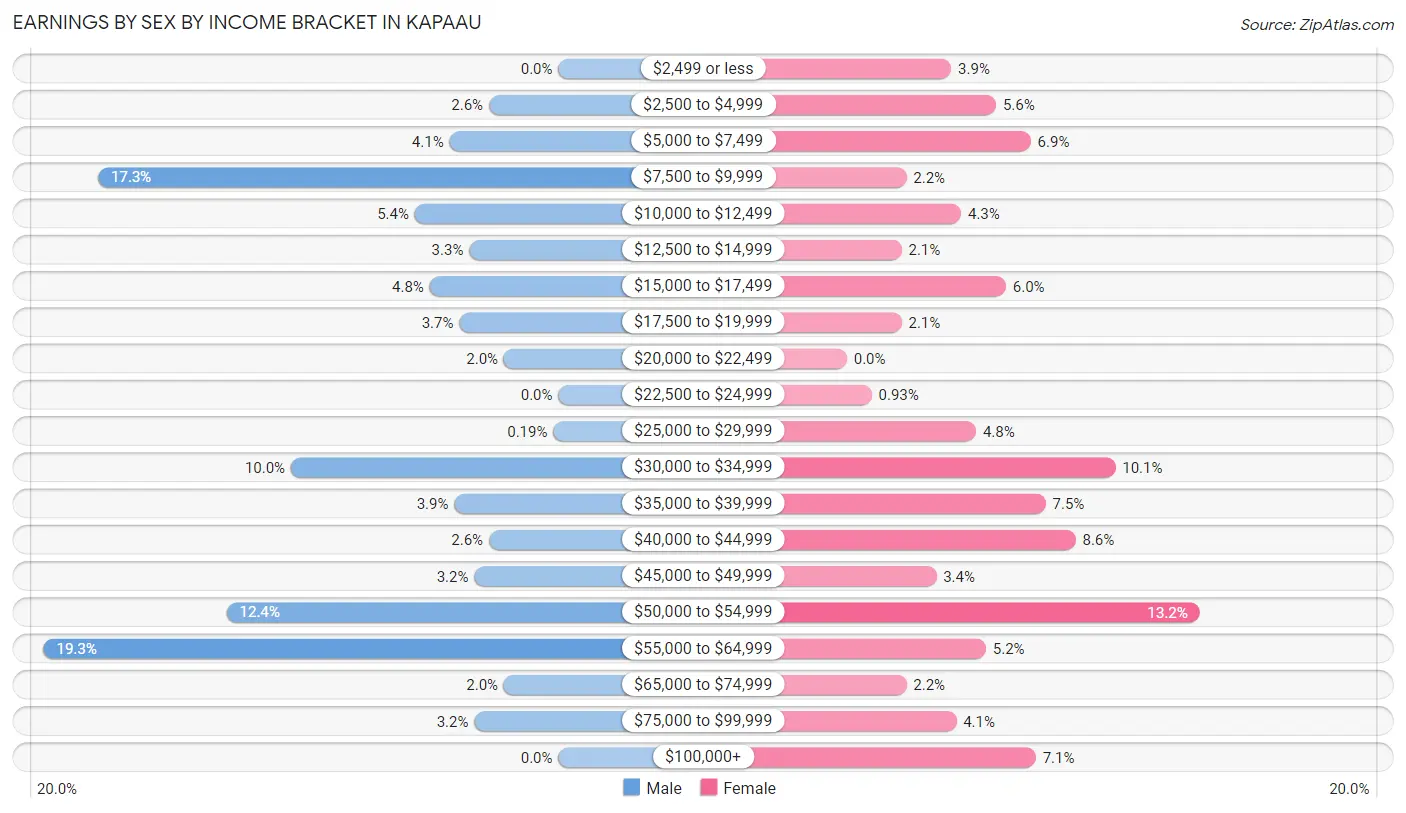
| Income | Male | Female |
| $2,499 or less | 0 (0.0%) | 21 (3.9%) |
| $2,500 to $4,999 | 14 (2.6%) | 30 (5.6%) |
| $5,000 to $7,499 | 22 (4.1%) | 37 (6.9%) |
| $7,500 to $9,999 | 93 (17.2%) | 12 (2.2%) |
| $10,000 to $12,499 | 29 (5.4%) | 23 (4.3%) |
| $12,500 to $14,999 | 18 (3.3%) | 11 (2.1%) |
| $15,000 to $17,499 | 26 (4.8%) | 32 (6.0%) |
| $17,500 to $19,999 | 20 (3.7%) | 11 (2.1%) |
| $20,000 to $22,499 | 11 (2.0%) | 0 (0.0%) |
| $22,500 to $24,999 | 0 (0.0%) | 5 (0.9%) |
| $25,000 to $29,999 | 1 (0.2%) | 26 (4.8%) |
| $30,000 to $34,999 | 54 (10.0%) | 54 (10.1%) |
| $35,000 to $39,999 | 21 (3.9%) | 40 (7.4%) |
| $40,000 to $44,999 | 14 (2.6%) | 46 (8.6%) |
| $45,000 to $49,999 | 17 (3.2%) | 18 (3.4%) |
| $50,000 to $54,999 | 67 (12.4%) | 71 (13.2%) |
| $55,000 to $64,999 | 104 (19.3%) | 28 (5.2%) |
| $65,000 to $74,999 | 11 (2.0%) | 12 (2.2%) |
| $75,000 to $99,999 | 17 (3.2%) | 22 (4.1%) |
| $100,000+ | 0 (0.0%) | 38 (7.1%) |
| Total | 539 (100.0%) | 537 (100.0%) |
Earnings by Sex by Educational Attainment in Kapaau
Average earnings in Kapaau are $35,694 for men and $38,362 for women, a difference of 7.0%. Men with an educational attainment of high school diploma enjoy the highest average annual earnings of $44,018, while those with graduate degree education earn the least with $10,625. Women with an educational attainment of bachelor's degree earn the most with the average annual earnings of $56,827, while those with college or associate's degree education have the smallest earnings of $34,922.
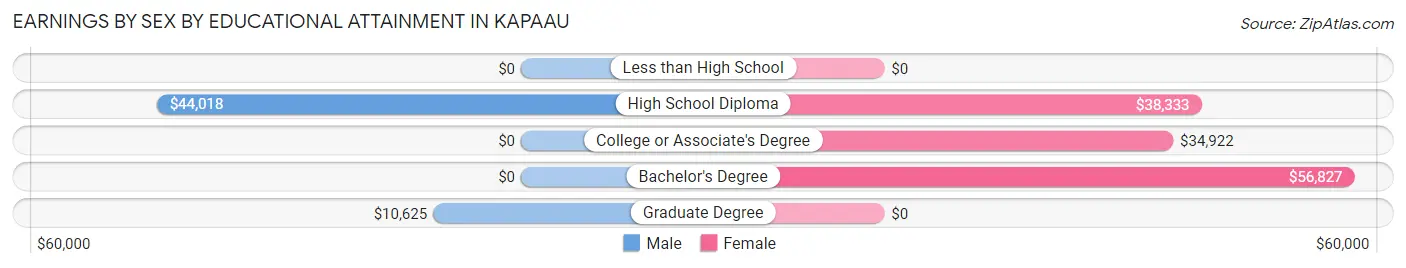
| Educational Attainment | Male Income | Female Income |
| Less than High School | - | - |
| High School Diploma | $44,018 | $38,333 |
| College or Associate's Degree | - | - |
| Bachelor's Degree | - | - |
| Graduate Degree | $10,625 | $0 |
| Total | $35,694 | $38,362 |
Family Income in Kapaau
Family Income Brackets in Kapaau
According to the Kapaau family income data, there are 130 families falling into the $100,000 to $149,999 income range, which is the most common income bracket and makes up 33.3% of all families.
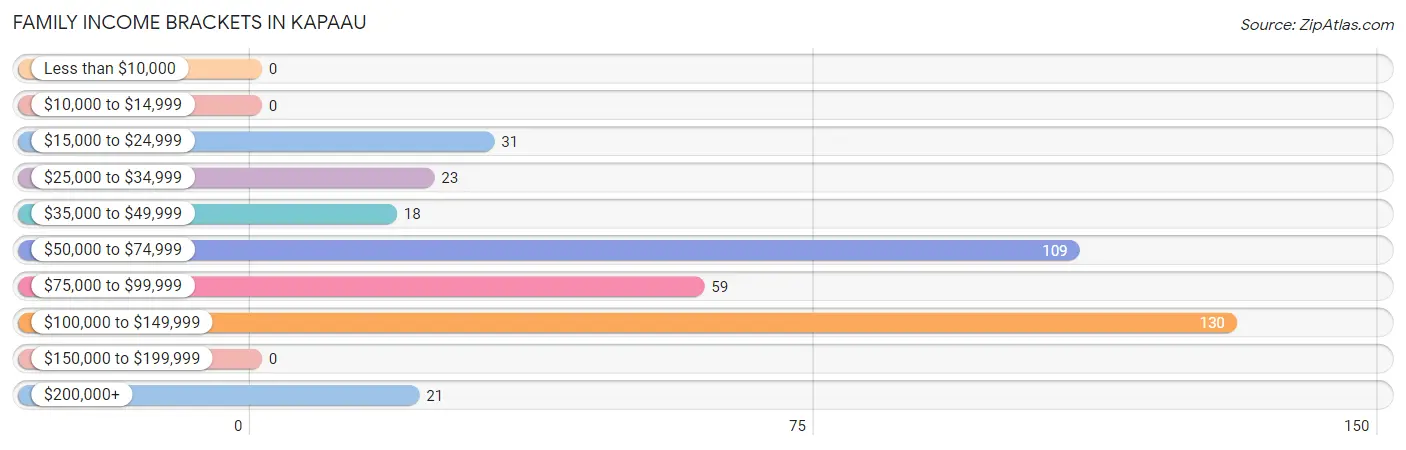
| Income Bracket | # Families | % Families |
| Less than $10,000 | 0 | 0.0% |
| $10,000 to $14,999 | 0 | 0.0% |
| $15,000 to $24,999 | 31 | 7.9% |
| $25,000 to $34,999 | 23 | 5.9% |
| $35,000 to $49,999 | 18 | 4.6% |
| $50,000 to $74,999 | 109 | 27.9% |
| $75,000 to $99,999 | 59 | 15.1% |
| $100,000 to $149,999 | 130 | 33.2% |
| $150,000 to $199,999 | 0 | 0.0% |
| $200,000+ | 21 | 5.4% |
Family Income by Famaliy Size in Kapaau
5-person families (23 | 5.9%) account for the highest median family income in Kapaau with $133,750 per family, while 2-person families (186 | 47.6%) have the highest median income of $33,371 per family member.
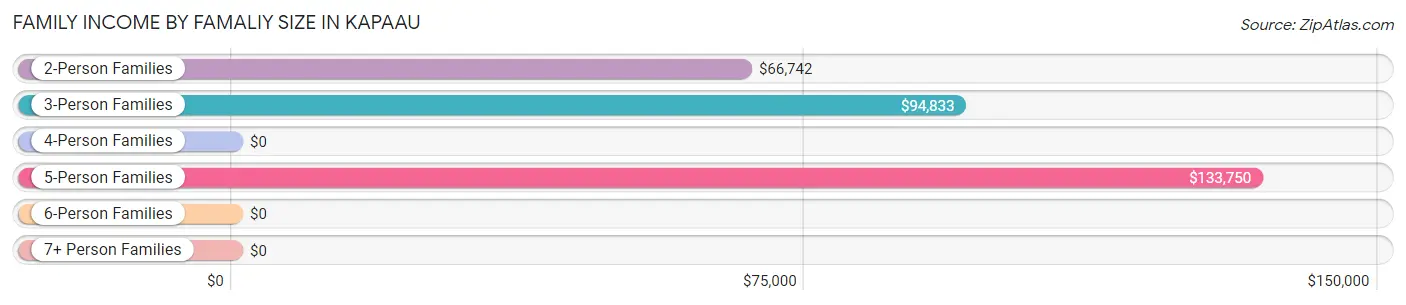
| Income Bracket | # Families | Median Income |
| 2-Person Families | 186 (47.6%) | $66,742 |
| 3-Person Families | 142 (36.3%) | $94,833 |
| 4-Person Families | 30 (7.7%) | $0 |
| 5-Person Families | 23 (5.9%) | $133,750 |
| 6-Person Families | 0 (0.0%) | $0 |
| 7+ Person Families | 10 (2.6%) | $0 |
| Total | 391 (100.0%) | $83,021 |
Family Income by Number of Earners in Kapaau
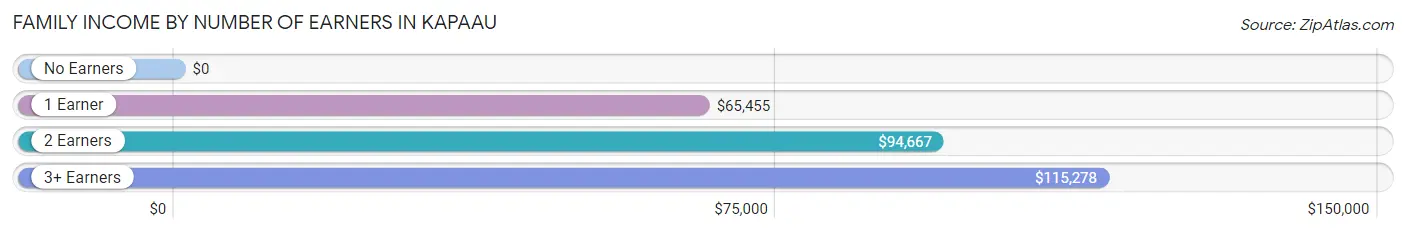
| Number of Earners | # Families | Median Income |
| No Earners | 39 (10.0%) | $0 |
| 1 Earner | 134 (34.3%) | $65,455 |
| 2 Earners | 182 (46.6%) | $94,667 |
| 3+ Earners | 36 (9.2%) | $115,278 |
| Total | 391 (100.0%) | $83,021 |
Household Income in Kapaau
Household Income Brackets in Kapaau
With 150 households falling in the category, the $50,000 to $74,999 income range is the most frequent in Kapaau, accounting for 22.5% of all households. In contrast, only 11 households (1.7%) fall into the less than $10,000 income bracket, making it the least populous group.
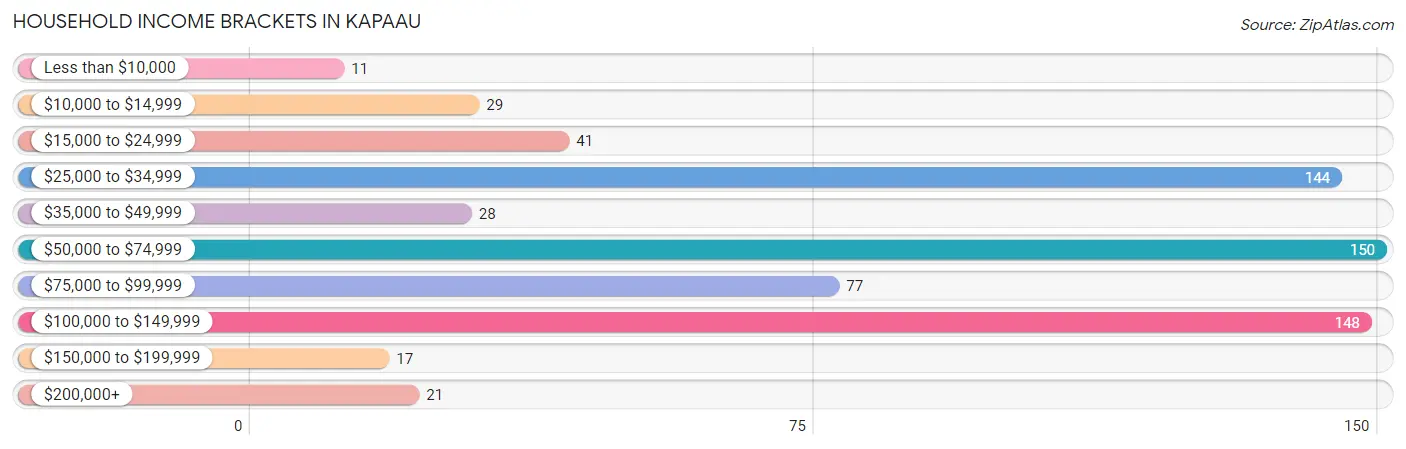
| Income Bracket | # Households | % Households |
| Less than $10,000 | 11 | 1.7% |
| $10,000 to $14,999 | 29 | 4.4% |
| $15,000 to $24,999 | 41 | 6.2% |
| $25,000 to $34,999 | 144 | 21.6% |
| $35,000 to $49,999 | 28 | 4.2% |
| $50,000 to $74,999 | 150 | 22.5% |
| $75,000 to $99,999 | 77 | 11.6% |
| $100,000 to $149,999 | 148 | 22.2% |
| $150,000 to $199,999 | 17 | 2.6% |
| $200,000+ | 21 | 3.2% |
Household Income by Householder Age in Kapaau
The median household income in Kapaau is $65,076, with the highest median household income of $136,307 found in the 25 to 44 years age bracket for the primary householder. A total of 105 households (15.8%) fall into this category. Meanwhile, the 15 to 24 years age bracket for the primary householder has the lowest median household income of $0, with 18 households (2.7%) in this group.
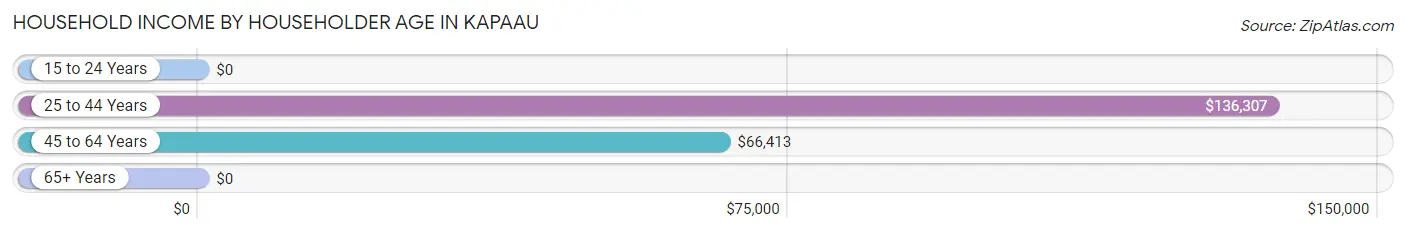
| Income Bracket | # Households | Median Income |
| 15 to 24 Years | 18 (2.7%) | $0 |
| 25 to 44 Years | 105 (15.8%) | $136,307 |
| 45 to 64 Years | 276 (41.4%) | $66,413 |
| 65+ Years | 267 (40.1%) | $0 |
| Total | 666 (100.0%) | $65,076 |
Poverty in Kapaau
Income Below Poverty by Sex and Age in Kapaau
With 10.2% poverty level for males and 13.1% for females among the residents of Kapaau, under 5 year old males and 15 year old females are the most vulnerable to poverty, with 9 males (100.0%) and 21 females (100.0%) in their respective age groups living below the poverty level.
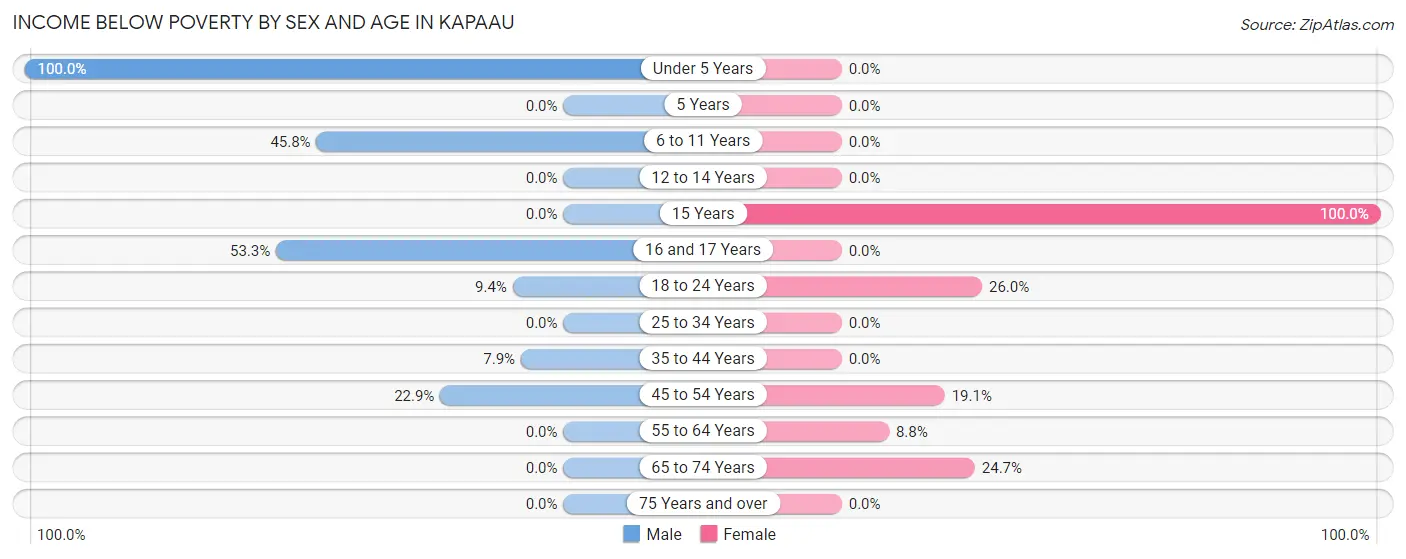
| Age Bracket | Male | Female |
| Under 5 Years | 9 (100.0%) | 0 (0.0%) |
| 5 Years | 0 (0.0%) | 0 (0.0%) |
| 6 to 11 Years | 11 (45.8%) | 0 (0.0%) |
| 12 to 14 Years | 0 (0.0%) | 0 (0.0%) |
| 15 Years | 0 (0.0%) | 21 (100.0%) |
| 16 and 17 Years | 16 (53.3%) | 0 (0.0%) |
| 18 to 24 Years | 11 (9.4%) | 38 (26.0%) |
| 25 to 34 Years | 0 (0.0%) | 0 (0.0%) |
| 35 to 44 Years | 10 (7.9%) | 0 (0.0%) |
| 45 to 54 Years | 32 (22.9%) | 30 (19.1%) |
| 55 to 64 Years | 0 (0.0%) | 12 (8.8%) |
| 65 to 74 Years | 0 (0.0%) | 41 (24.7%) |
| 75 Years and over | 0 (0.0%) | 0 (0.0%) |
| Total | 89 (10.2%) | 142 (13.1%) |
Income Above Poverty by Sex and Age in Kapaau
According to the poverty statistics in Kapaau, males aged 12 to 14 years and females aged under 5 years are the age groups that are most secure financially, with 100.0% of males and 100.0% of females in these age groups living above the poverty line.
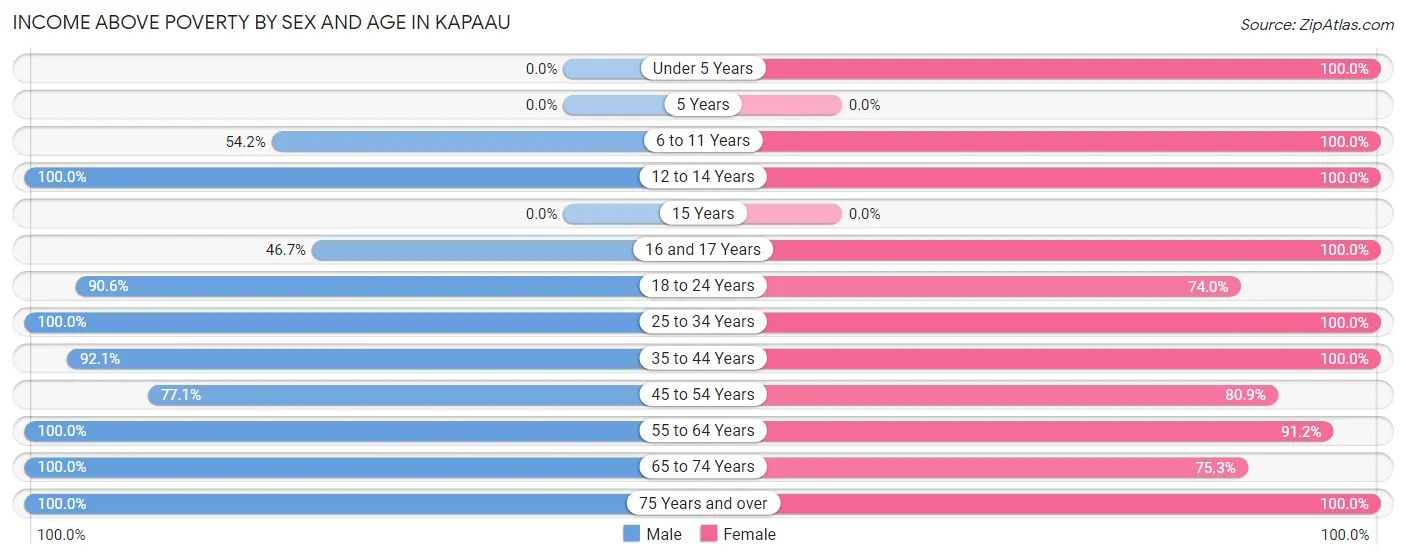
| Age Bracket | Male | Female |
| Under 5 Years | 0 (0.0%) | 33 (100.0%) |
| 5 Years | 0 (0.0%) | 0 (0.0%) |
| 6 to 11 Years | 13 (54.2%) | 85 (100.0%) |
| 12 to 14 Years | 14 (100.0%) | 53 (100.0%) |
| 15 Years | 0 (0.0%) | 0 (0.0%) |
| 16 and 17 Years | 14 (46.7%) | 20 (100.0%) |
| 18 to 24 Years | 106 (90.6%) | 108 (74.0%) |
| 25 to 34 Years | 137 (100.0%) | 49 (100.0%) |
| 35 to 44 Years | 117 (92.1%) | 76 (100.0%) |
| 45 to 54 Years | 108 (77.1%) | 127 (80.9%) |
| 55 to 64 Years | 118 (100.0%) | 125 (91.2%) |
| 65 to 74 Years | 106 (100.0%) | 125 (75.3%) |
| 75 Years and over | 47 (100.0%) | 139 (100.0%) |
| Total | 780 (89.8%) | 940 (86.9%) |
Income Below Poverty Among Married-Couple Families in Kapaau
The poverty statistics for married-couple families in Kapaau show that 12.0% or 31 of the total 259 families live below the poverty line. Families with 1 or 2 children have the highest poverty rate of 28.2%, comprising of 11 families. On the other hand, families with 3 or 4 children have the lowest poverty rate of 0.0%, which includes 0 families.
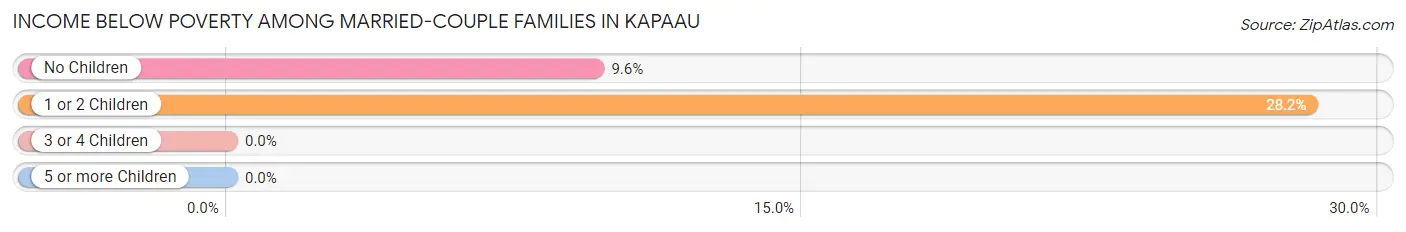
| Children | Above Poverty | Below Poverty |
| No Children | 189 (90.4%) | 20 (9.6%) |
| 1 or 2 Children | 28 (71.8%) | 11 (28.2%) |
| 3 or 4 Children | 11 (100.0%) | 0 (0.0%) |
| 5 or more Children | 0 (0.0%) | 0 (0.0%) |
| Total | 228 (88.0%) | 31 (12.0%) |
Income Below Poverty Among Single-Parent Households in Kapaau
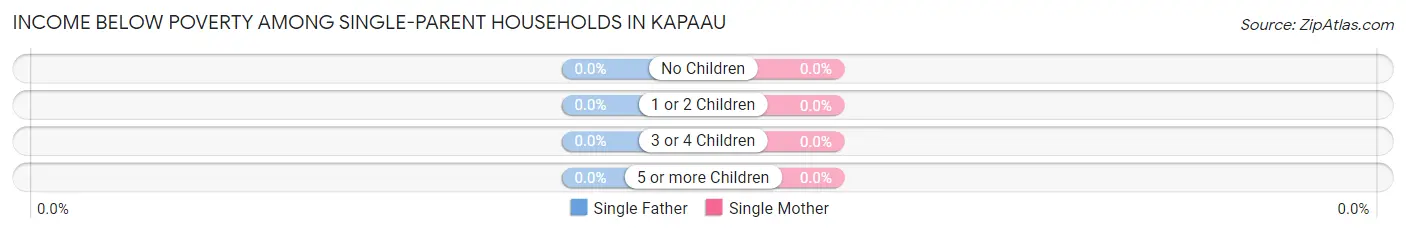
| Children | Single Father | Single Mother |
| No Children | 0 (0.0%) | 0 (0.0%) |
| 1 or 2 Children | 0 (0.0%) | 0 (0.0%) |
| 3 or 4 Children | 0 (0.0%) | 0 (0.0%) |
| 5 or more Children | 0 (0.0%) | 0 (0.0%) |
| Total | 0 (0.0%) | 0 (0.0%) |
Income Below Poverty Among Married-Couple vs Single-Parent Households in Kapaau
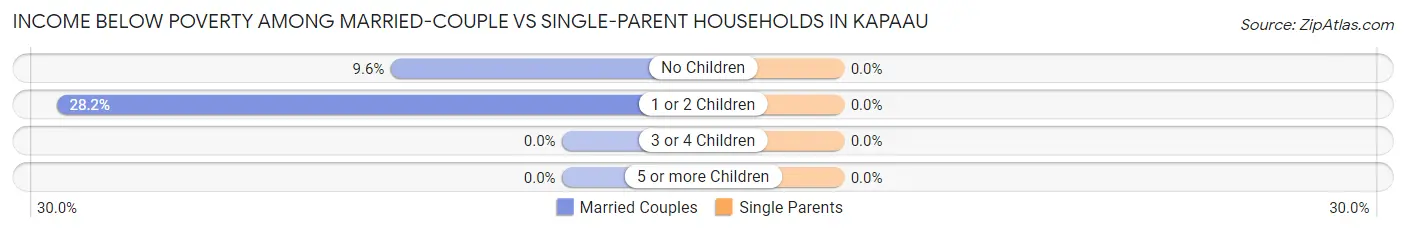
| Children | Married-Couple Families | Single-Parent Households |
| No Children | 20 (9.6%) | 0 (0.0%) |
| 1 or 2 Children | 11 (28.2%) | 0 (0.0%) |
| 3 or 4 Children | 0 (0.0%) | 0 (0.0%) |
| 5 or more Children | 0 (0.0%) | 0 (0.0%) |
| Total | 31 (12.0%) | 0 (0.0%) |
Race in Kapaau
The most populous races in Kapaau are Two or more Races (890 | 45.1%), Hispanic or Latino (662 | 33.6%), and Asian (515 | 26.1%).
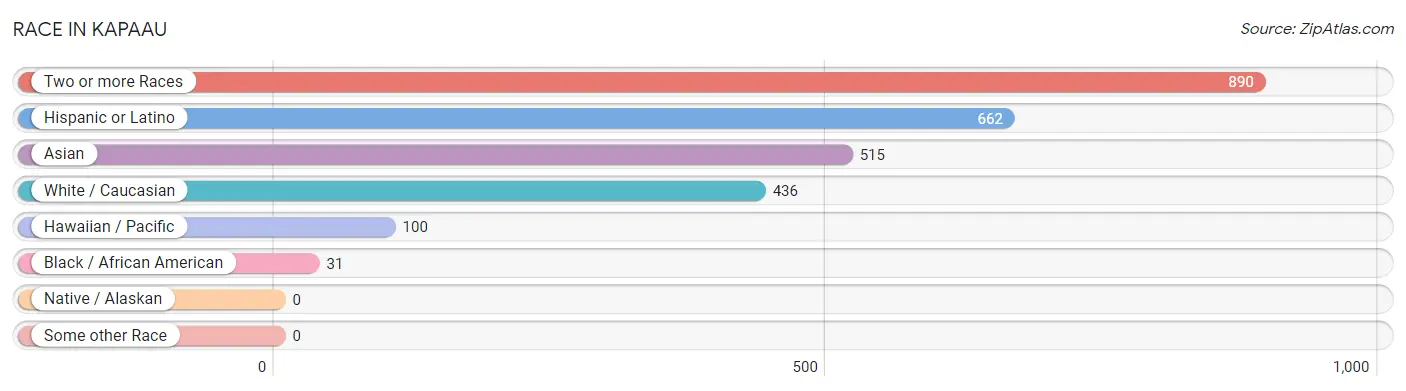
| Race | # Population | % Population |
| Asian | 515 | 26.1% |
| Black / African American | 31 | 1.6% |
| Hawaiian / Pacific | 100 | 5.1% |
| Hispanic or Latino | 662 | 33.6% |
| Native / Alaskan | 0 | 0.0% |
| White / Caucasian | 436 | 22.1% |
| Two or more Races | 890 | 45.1% |
| Some other Race | 0 | 0.0% |
| Total | 1,972 | 100.0% |
Ancestry in Kapaau
The most populous ancestries reported in Kapaau are Korean (1,160 | 58.8%), Native Hawaiian (755 | 38.3%), Puerto Rican (601 | 30.5%), Indian (Asian) (451 | 22.9%), and Bhutanese (258 | 13.1%), together accounting for 163.5% of all Kapaau residents.
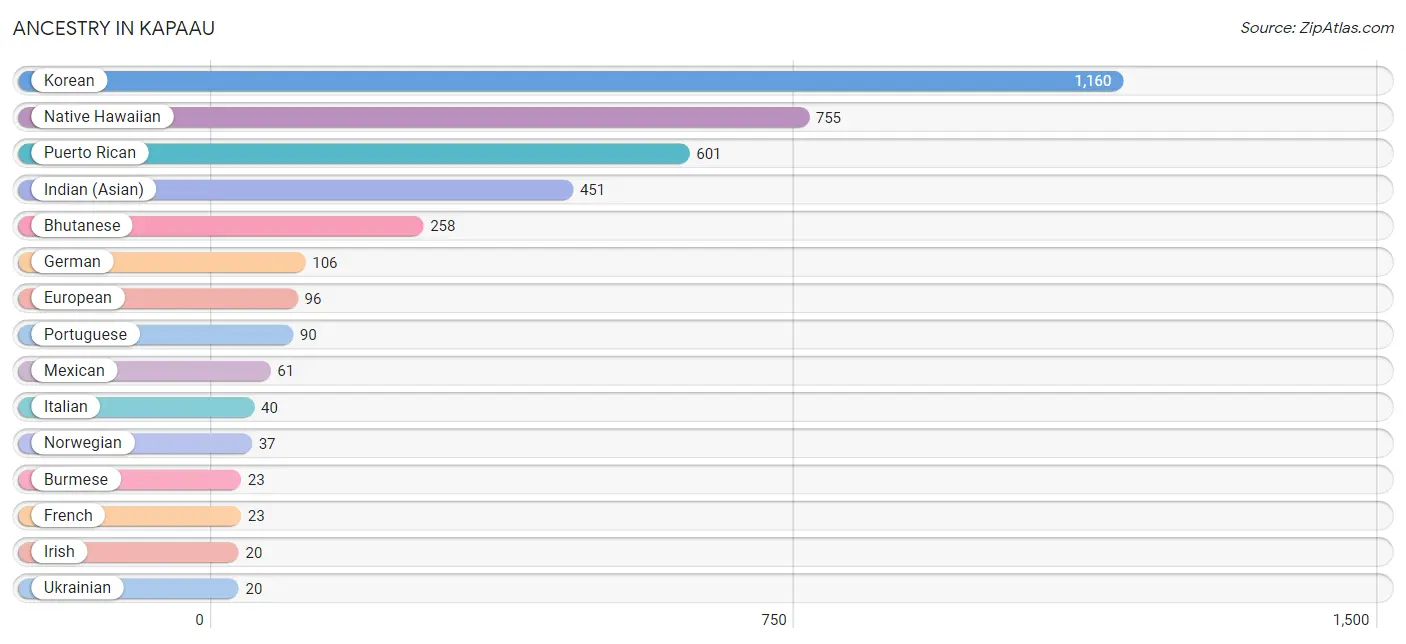
| Ancestry | # Population | % Population |
| African | 15 | 0.8% |
| Bhutanese | 258 | 13.1% |
| Burmese | 23 | 1.2% |
| Dutch | 10 | 0.5% |
| English | 19 | 1.0% |
| European | 96 | 4.9% |
| French | 23 | 1.2% |
| German | 106 | 5.4% |
| Icelander | 11 | 0.6% |
| Indian (Asian) | 451 | 22.9% |
| Irish | 20 | 1.0% |
| Israeli | 10 | 0.5% |
| Italian | 40 | 2.0% |
| Korean | 1,160 | 58.8% |
| Mexican | 61 | 3.1% |
| Native Hawaiian | 755 | 38.3% |
| Norwegian | 37 | 1.9% |
| Polish | 18 | 0.9% |
| Portuguese | 90 | 4.6% |
| Puerto Rican | 601 | 30.5% |
| Romanian | 13 | 0.7% |
| Russian | 8 | 0.4% |
| Scandinavian | 11 | 0.6% |
| Scotch-Irish | 12 | 0.6% |
| Scottish | 18 | 0.9% |
| Subsaharan African | 15 | 0.8% |
| Swedish | 15 | 0.8% |
| Ukrainian | 20 | 1.0% |
| Welsh | 1 | 0.1% | View All 29 Rows |
Immigrants in Kapaau
The most numerous immigrant groups reported in Kapaau came from Asia (293 | 14.9%), South Eastern Asia (283 | 14.3%), Philippines (273 | 13.8%), Europe (10 | 0.5%), and Indonesia (10 | 0.5%), together accounting for 44.1% of all Kapaau residents.
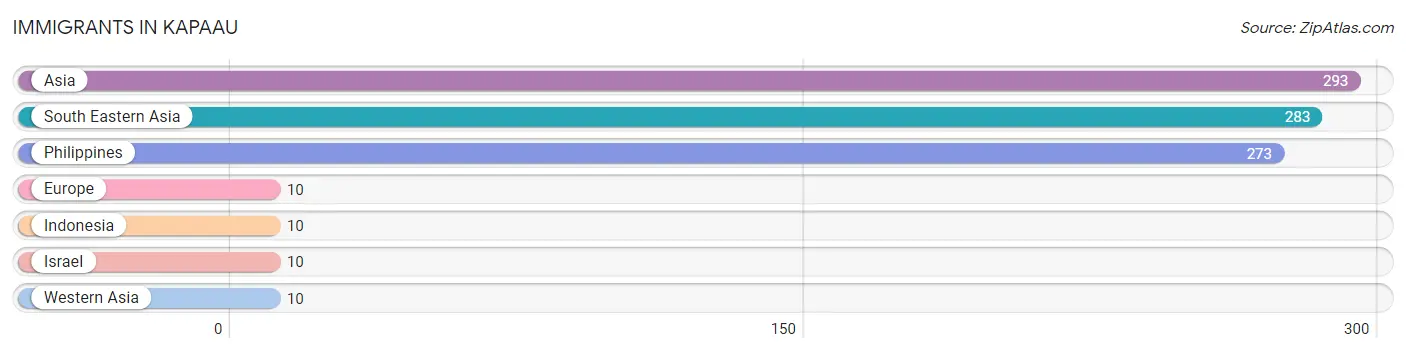
| Immigration Origin | # Population | % Population |
| Asia | 293 | 14.9% |
| Europe | 10 | 0.5% |
| Indonesia | 10 | 0.5% |
| Israel | 10 | 0.5% |
| Philippines | 273 | 13.8% |
| South Eastern Asia | 283 | 14.3% |
| Western Asia | 10 | 0.5% | View All 7 Rows |
Sex and Age in Kapaau
Sex and Age in Kapaau
The most populous age groups in Kapaau are 25 to 29 Years (102 | 11.5%) for men and 20 to 24 Years (135 | 12.4%) for women.
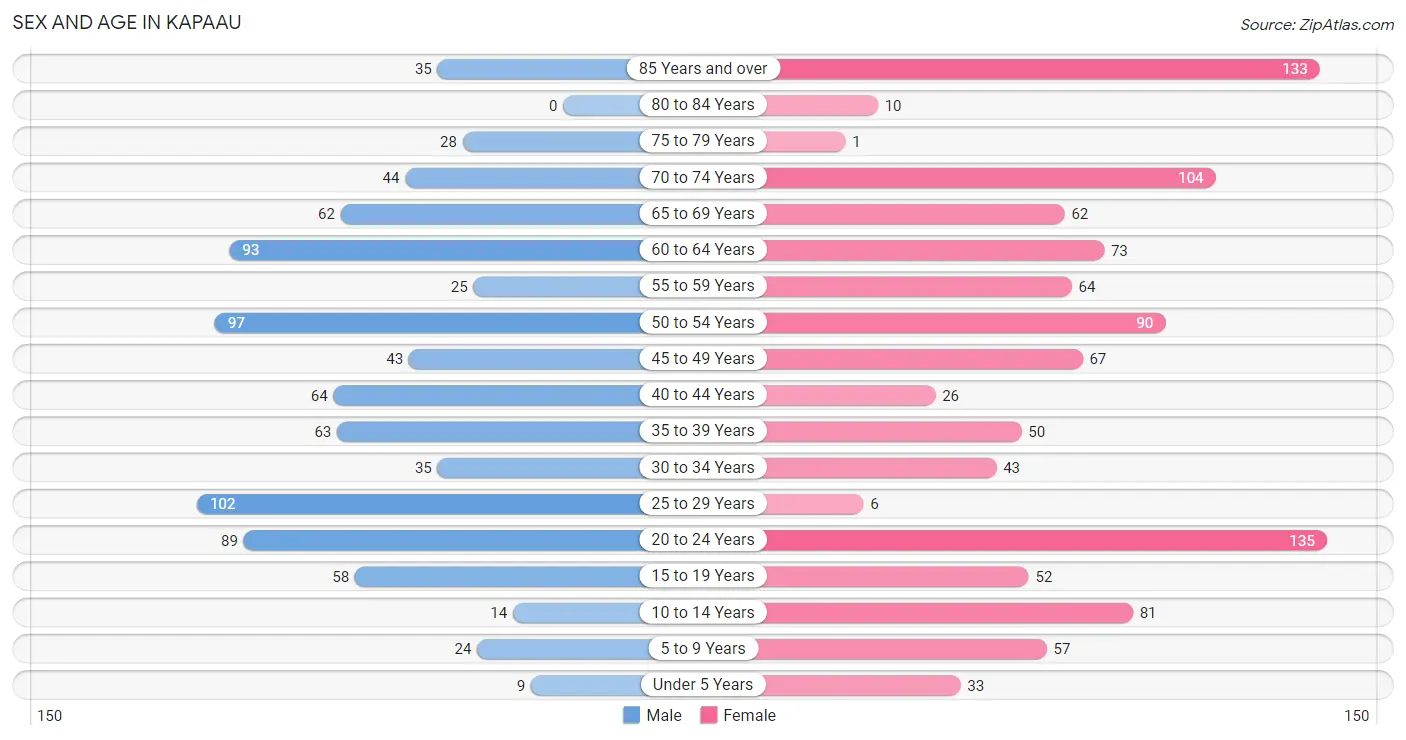
| Age Bracket | Male | Female |
| Under 5 Years | 9 (1.0%) | 33 (3.0%) |
| 5 to 9 Years | 24 (2.7%) | 57 (5.2%) |
| 10 to 14 Years | 14 (1.6%) | 81 (7.4%) |
| 15 to 19 Years | 58 (6.6%) | 52 (4.8%) |
| 20 to 24 Years | 89 (10.1%) | 135 (12.4%) |
| 25 to 29 Years | 102 (11.5%) | 6 (0.5%) |
| 30 to 34 Years | 35 (4.0%) | 43 (4.0%) |
| 35 to 39 Years | 63 (7.1%) | 50 (4.6%) |
| 40 to 44 Years | 64 (7.2%) | 26 (2.4%) |
| 45 to 49 Years | 43 (4.9%) | 67 (6.2%) |
| 50 to 54 Years | 97 (11.0%) | 90 (8.3%) |
| 55 to 59 Years | 25 (2.8%) | 64 (5.9%) |
| 60 to 64 Years | 93 (10.5%) | 73 (6.7%) |
| 65 to 69 Years | 62 (7.0%) | 62 (5.7%) |
| 70 to 74 Years | 44 (5.0%) | 104 (9.6%) |
| 75 to 79 Years | 28 (3.2%) | 1 (0.1%) |
| 80 to 84 Years | 0 (0.0%) | 10 (0.9%) |
| 85 Years and over | 35 (4.0%) | 133 (12.2%) |
| Total | 885 (100.0%) | 1,087 (100.0%) |
Families and Households in Kapaau
Median Family Size in Kapaau
The median family size in Kapaau is 3.82 persons per family, with single female/mother families (102 | 26.1%) accounting for the largest median family size of 4.27 persons per family. On the other hand, single male/father families (30 | 7.7%) represent the smallest median family size with 2.53 persons per family.
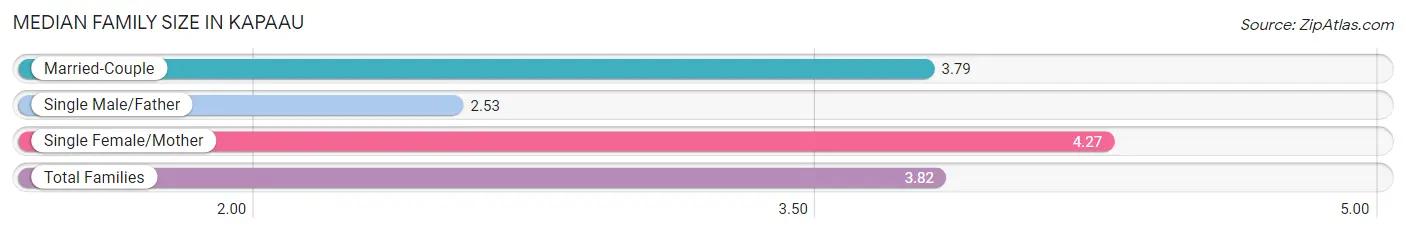
| Family Type | # Families | Family Size |
| Married-Couple | 259 (66.2%) | 3.79 |
| Single Male/Father | 30 (7.7%) | 2.53 |
| Single Female/Mother | 102 (26.1%) | 4.27 |
| Total Families | 391 (100.0%) | 3.82 |
Median Household Size in Kapaau
The median household size in Kapaau is 2.93 persons per household, with single female/mother households (102 | 15.3%) accounting for the largest median household size of 4.65 persons per household. non-family households (275 | 41.3%) represent the smallest median household size with 1.29 persons per household.
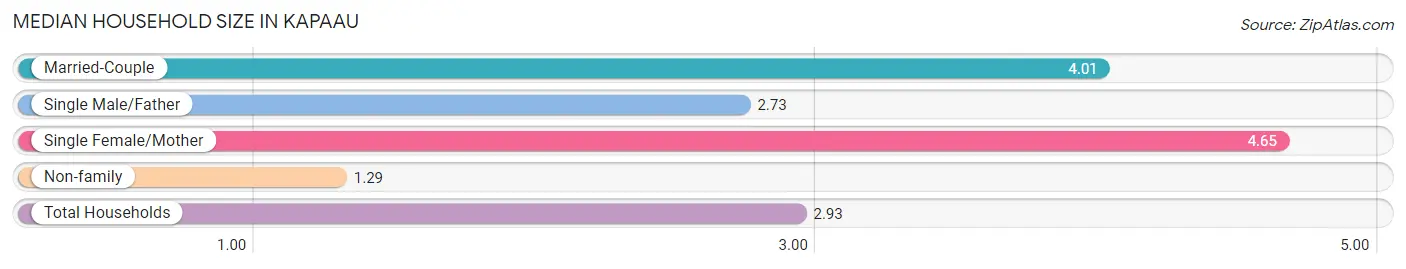
| Household Type | # Households | Household Size |
| Married-Couple | 259 (38.9%) | 4.01 |
| Single Male/Father | 30 (4.5%) | 2.73 |
| Single Female/Mother | 102 (15.3%) | 4.65 |
| Non-family | 275 (41.3%) | 1.29 |
| Total Households | 666 (100.0%) | 2.93 |
Household Size by Marriage Status in Kapaau
Out of a total of 666 households in Kapaau, 391 (58.7%) are family households, while 275 (41.3%) are nonfamily households. The most numerous type of family households are 2-person households, comprising 167, and the most common type of nonfamily households are 1-person households, comprising 219.
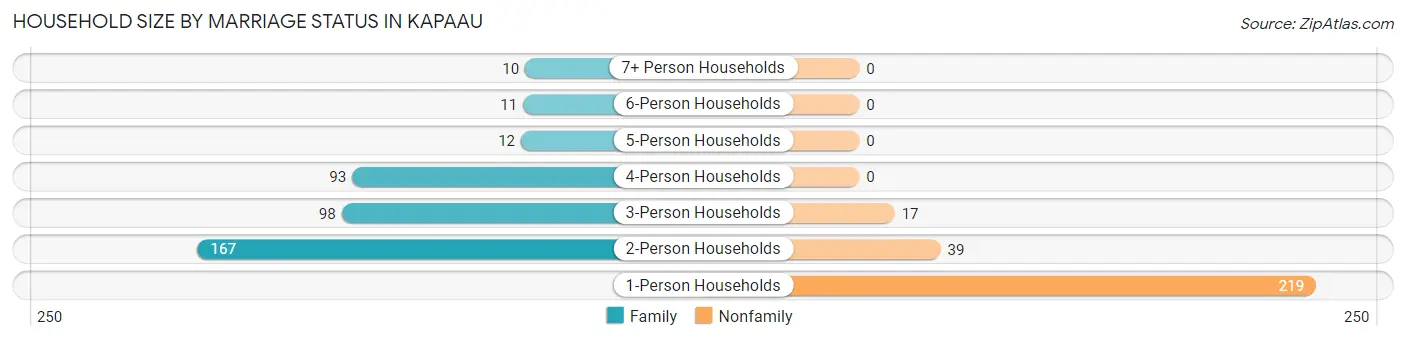
| Household Size | Family Households | Nonfamily Households |
| 1-Person Households | - | 219 (32.9%) |
| 2-Person Households | 167 (25.1%) | 39 (5.9%) |
| 3-Person Households | 98 (14.7%) | 17 (2.5%) |
| 4-Person Households | 93 (14.0%) | 0 (0.0%) |
| 5-Person Households | 12 (1.8%) | 0 (0.0%) |
| 6-Person Households | 11 (1.7%) | 0 (0.0%) |
| 7+ Person Households | 10 (1.5%) | 0 (0.0%) |
| Total | 391 (58.7%) | 275 (41.3%) |
Female Fertility in Kapaau
Fertility by Age in Kapaau
| Age Bracket | Women with Births | Births / 1,000 Women |
| 15 to 19 years | 0 (0.0%) | 0.0 |
| 20 to 34 years | 0 (0.0%) | 0.0 |
| 35 to 50 years | 0 (0.0%) | 0.0 |
| Total | 0 (0.0%) | 0.0 |
Fertility by Age by Marriage Status in Kapaau
| Age Bracket | Married | Unmarried |
| 15 to 19 years | 0 (0.0%) | 0 (0.0%) |
| 20 to 34 years | 0 (0.0%) | 0 (0.0%) |
| 35 to 50 years | 0 (0.0%) | 0 (0.0%) |
| Total | 0 (0.0%) | 0 (0.0%) |
Fertility by Education in Kapaau
| Educational Attainment | Women with Births | Births / 1,000 Women |
| Less than High School | 0 (0.0%) | 0.0 |
| High School Diploma | 0 (0.0%) | 0.0 |
| College or Associate's Degree | 0 (0.0%) | 0.0 |
| Bachelor's Degree | 0 (0.0%) | 0.0 |
| Graduate Degree | 0 (0.0%) | 0.0 |
| Total | 0 (0.0%) | 0.0 |
Fertility by Education by Marriage Status in Kapaau
| Educational Attainment | Married | Unmarried |
| Less than High School | 0 (0.0%) | 0 (0.0%) |
| High School Diploma | 0 (0.0%) | 0 (0.0%) |
| College or Associate's Degree | 0 (0.0%) | 0 (0.0%) |
| Bachelor's Degree | 0 (0.0%) | 0 (0.0%) |
| Graduate Degree | 0 (0.0%) | 0 (0.0%) |
| Total | 0 (0.0%) | 0 (0.0%) |
Employment Characteristics in Kapaau
Employment by Class of Employer in Kapaau
Among the 1,005 employed individuals in Kapaau, private company employees (698 | 69.5%), self-employed (not incorporated) (87 | 8.7%), and local government employees (76 | 7.6%) make up the most common classes of employment.
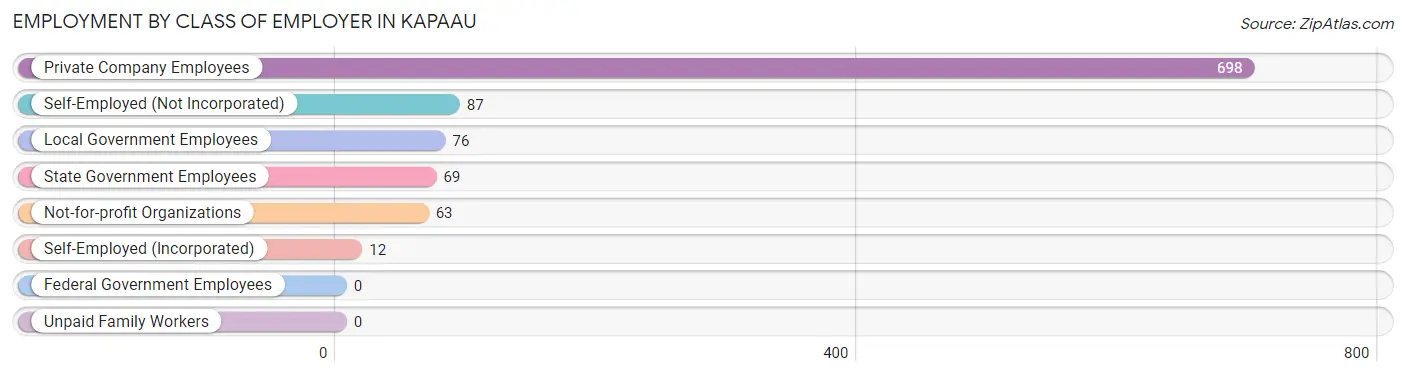
| Employer Class | # Employees | % Employees |
| Private Company Employees | 698 | 69.5% |
| Self-Employed (Incorporated) | 12 | 1.2% |
| Self-Employed (Not Incorporated) | 87 | 8.7% |
| Not-for-profit Organizations | 63 | 6.3% |
| Local Government Employees | 76 | 7.6% |
| State Government Employees | 69 | 6.9% |
| Federal Government Employees | 0 | 0.0% |
| Unpaid Family Workers | 0 | 0.0% |
| Total | 1,005 | 100.0% |
Employment Status by Age in Kapaau
According to the labor force statistics for Kapaau, out of the total population over 16 years of age (1,733), 63.5% or 1,100 individuals are in the labor force, with 5.4% or 59 of them unemployed. The age group with the highest labor force participation rate is 25 to 29 years, with 100.0% or 108 individuals in the labor force. Within the labor force, the 16 to 19 years age range has the highest percentage of unemployed individuals, with 16.9% or 10 of them being unemployed.
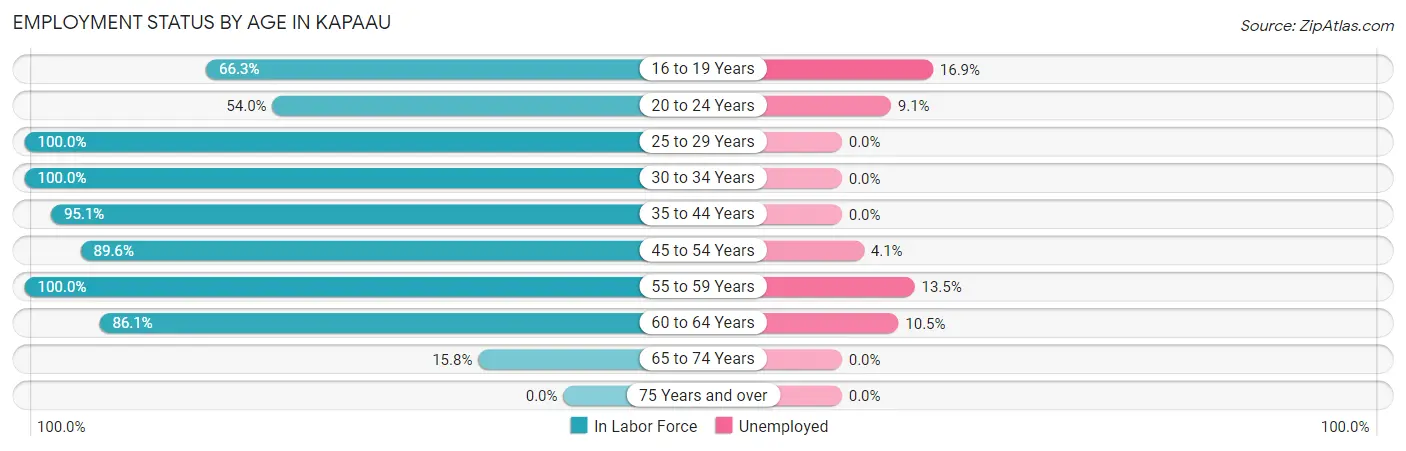
| Age Bracket | In Labor Force | Unemployed |
| 16 to 19 Years | 59 (66.3%) | 10 (16.9%) |
| 20 to 24 Years | 121 (54.0%) | 11 (9.1%) |
| 25 to 29 Years | 108 (100.0%) | 0 (0.0%) |
| 30 to 34 Years | 78 (100.0%) | 0 (0.0%) |
| 35 to 44 Years | 193 (95.1%) | 0 (0.0%) |
| 45 to 54 Years | 266 (89.6%) | 11 (4.1%) |
| 55 to 59 Years | 89 (100.0%) | 12 (13.5%) |
| 60 to 64 Years | 143 (86.1%) | 15 (10.5%) |
| 65 to 74 Years | 43 (15.8%) | 0 (0.0%) |
| 75 Years and over | 0 (0.0%) | 0 (0.0%) |
| Total | 1,100 (63.5%) | 59 (5.4%) |
Employment Status by Educational Attainment in Kapaau
According to labor force statistics for Kapaau, 93.2% of individuals (877) out of the total population between 25 and 64 years of age (941) are in the labor force, with 4.3% or 38 of them being unemployed. The group with the highest labor force participation rate are those with the educational attainment of less than high school, with 100.0% or 38 individuals in the labor force. Within the labor force, individuals with bachelor's degree or higher education have the highest percentage of unemployment, with 12.9% or 12 of them being unemployed.
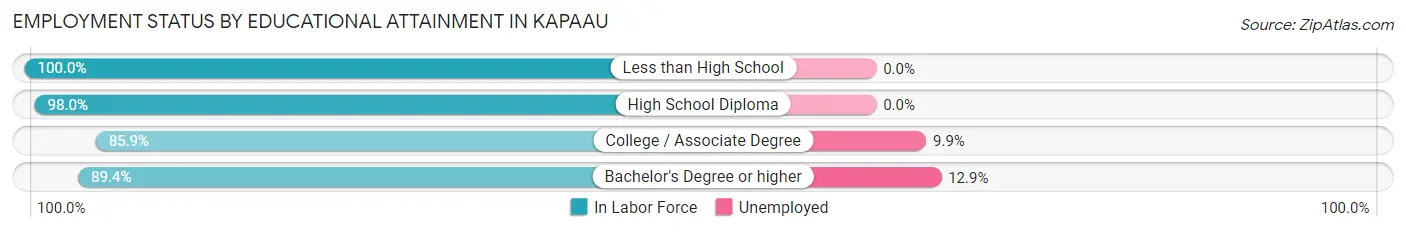
| Educational Attainment | In Labor Force | Unemployed |
| Less than High School | 38 (100.0%) | 0 (0.0%) |
| High School Diploma | 483 (98.0%) | 0 (0.0%) |
| College / Associate Degree | 263 (85.9%) | 30 (9.9%) |
| Bachelor's Degree or higher | 93 (89.4%) | 13 (12.9%) |
| Total | 877 (93.2%) | 40 (4.3%) |
Employment Occupations by Sex in Kapaau
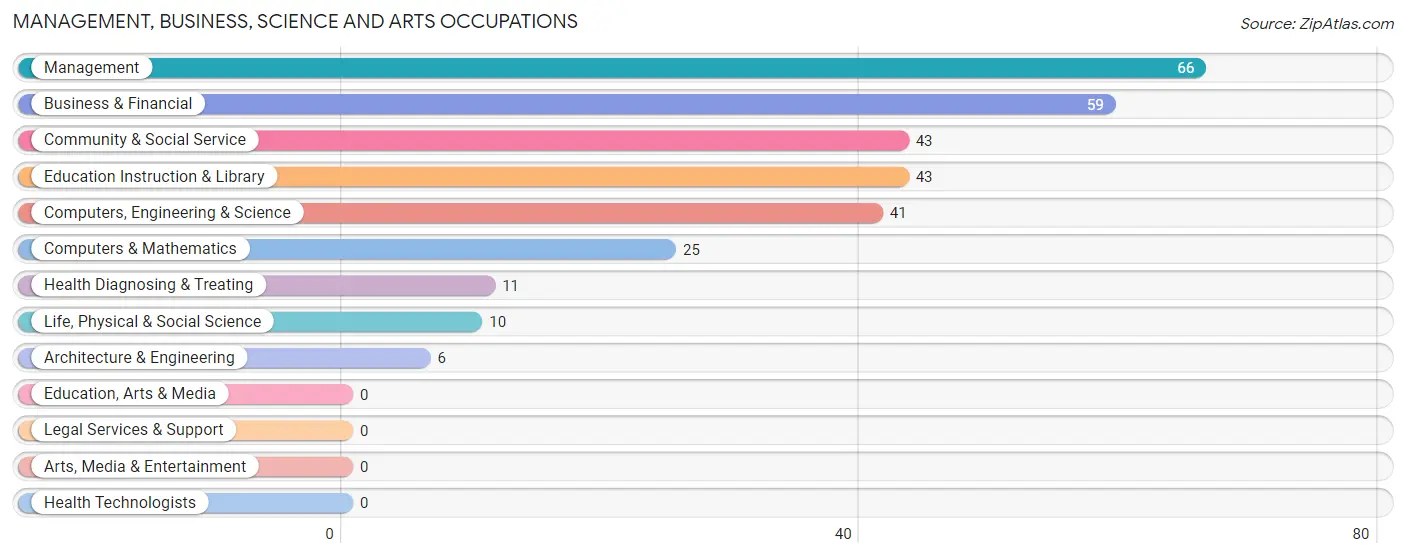
Management, Business, Science and Arts Occupations
The most common Management, Business, Science and Arts occupations in Kapaau are Management (66 | 6.3%), Business & Financial (59 | 5.7%), Community & Social Service (43 | 4.1%), Education Instruction & Library (43 | 4.1%), and Computers, Engineering & Science (41 | 3.9%).
Management, Business, Science and Arts Occupations by Sex
Within the Management, Business, Science and Arts occupations in Kapaau, the most male-oriented occupations are Business & Financial (100.0%), Architecture & Engineering (100.0%), and Computers, Engineering & Science (14.6%), while the most female-oriented occupations are Management (100.0%), Computers & Mathematics (100.0%), and Life, Physical & Social Science (100.0%).
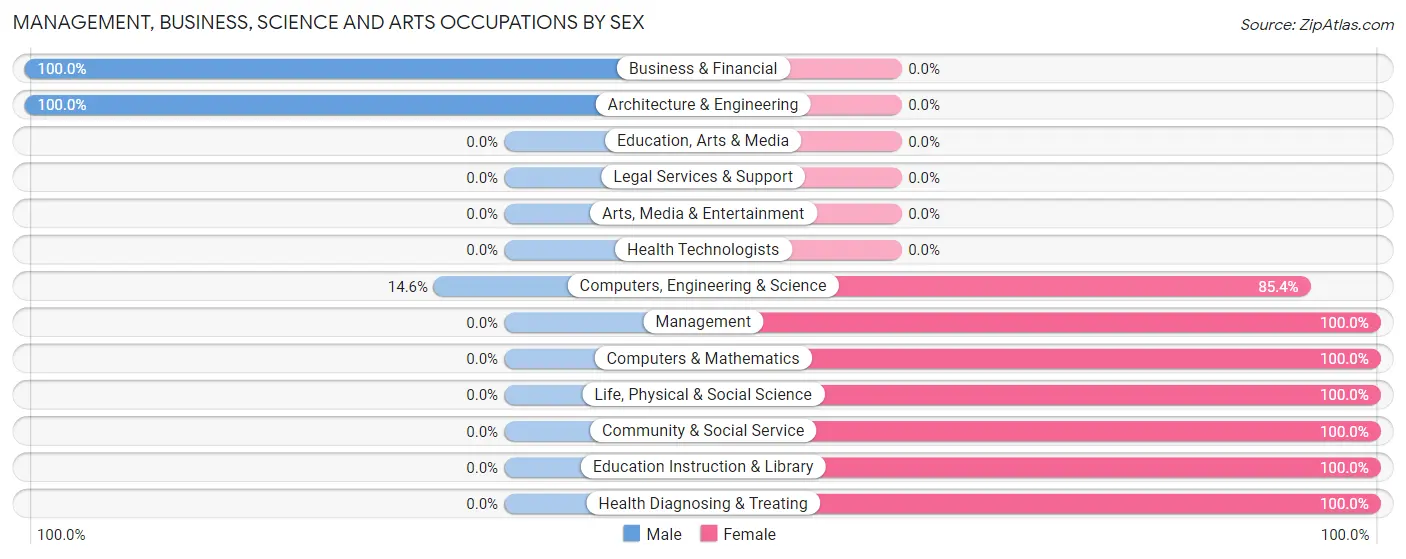
| Occupation | Male | Female |
| Management | 0 (0.0%) | 66 (100.0%) |
| Business & Financial | 59 (100.0%) | 0 (0.0%) |
| Computers, Engineering & Science | 6 (14.6%) | 35 (85.4%) |
| Computers & Mathematics | 0 (0.0%) | 25 (100.0%) |
| Architecture & Engineering | 6 (100.0%) | 0 (0.0%) |
| Life, Physical & Social Science | 0 (0.0%) | 10 (100.0%) |
| Community & Social Service | 0 (0.0%) | 43 (100.0%) |
| Education, Arts & Media | 0 (0.0%) | 0 (0.0%) |
| Legal Services & Support | 0 (0.0%) | 0 (0.0%) |
| Education Instruction & Library | 0 (0.0%) | 43 (100.0%) |
| Arts, Media & Entertainment | 0 (0.0%) | 0 (0.0%) |
| Health Diagnosing & Treating | 0 (0.0%) | 11 (100.0%) |
| Health Technologists | 0 (0.0%) | 0 (0.0%) |
| Total (Category) | 65 (29.5%) | 155 (70.5%) |
| Total (Overall) | 519 (49.9%) | 522 (50.1%) |
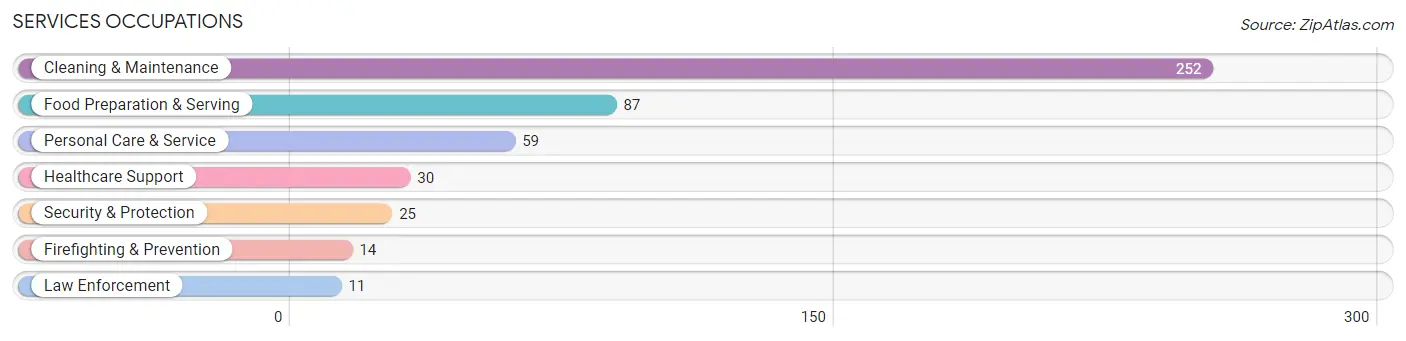
Services Occupations
The most common Services occupations in Kapaau are Cleaning & Maintenance (252 | 24.2%), Food Preparation & Serving (87 | 8.4%), Personal Care & Service (59 | 5.7%), Healthcare Support (30 | 2.9%), and Security & Protection (25 | 2.4%).
Services Occupations by Sex
Within the Services occupations in Kapaau, the most male-oriented occupations are Security & Protection (100.0%), Firefighting & Prevention (100.0%), and Law Enforcement (100.0%), while the most female-oriented occupations are Food Preparation & Serving (83.9%), Personal Care & Service (81.4%), and Healthcare Support (60.0%).
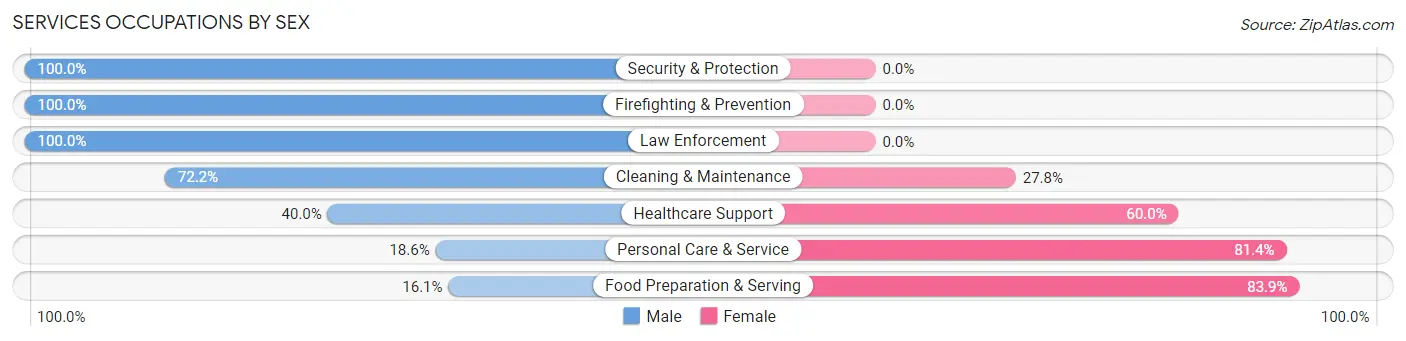
| Occupation | Male | Female |
| Healthcare Support | 12 (40.0%) | 18 (60.0%) |
| Security & Protection | 25 (100.0%) | 0 (0.0%) |
| Firefighting & Prevention | 14 (100.0%) | 0 (0.0%) |
| Law Enforcement | 11 (100.0%) | 0 (0.0%) |
| Food Preparation & Serving | 14 (16.1%) | 73 (83.9%) |
| Cleaning & Maintenance | 182 (72.2%) | 70 (27.8%) |
| Personal Care & Service | 11 (18.6%) | 48 (81.4%) |
| Total (Category) | 244 (53.9%) | 209 (46.1%) |
| Total (Overall) | 519 (49.9%) | 522 (50.1%) |
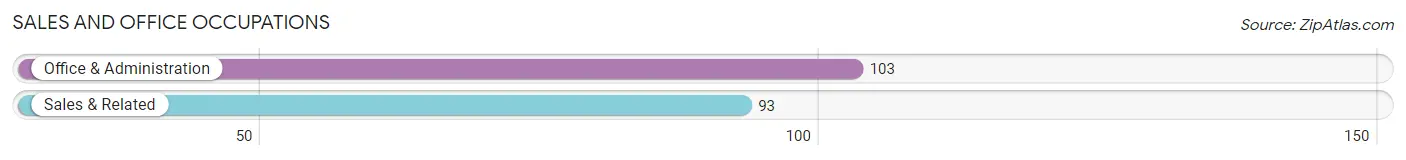
Sales and Office Occupations
The most common Sales and Office occupations in Kapaau are Office & Administration (103 | 9.9%), and Sales & Related (93 | 8.9%).
Sales and Office Occupations by Sex
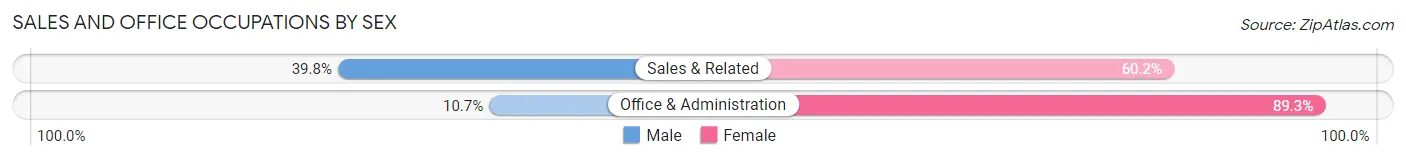
| Occupation | Male | Female |
| Sales & Related | 37 (39.8%) | 56 (60.2%) |
| Office & Administration | 11 (10.7%) | 92 (89.3%) |
| Total (Category) | 48 (24.5%) | 148 (75.5%) |
| Total (Overall) | 519 (49.9%) | 522 (50.1%) |
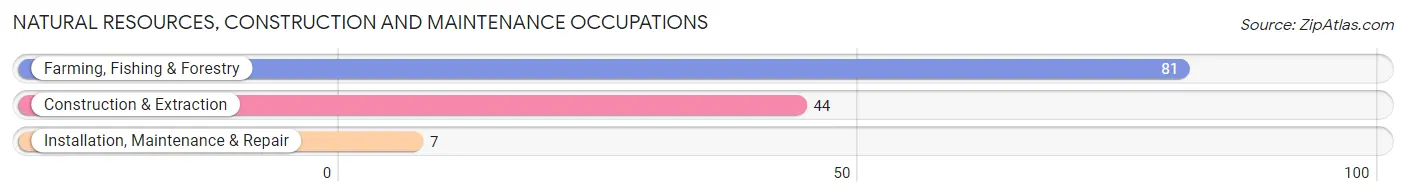
Natural Resources, Construction and Maintenance Occupations
The most common Natural Resources, Construction and Maintenance occupations in Kapaau are Farming, Fishing & Forestry (81 | 7.8%), Construction & Extraction (44 | 4.2%), and Installation, Maintenance & Repair (7 | 0.7%).
Natural Resources, Construction and Maintenance Occupations by Sex
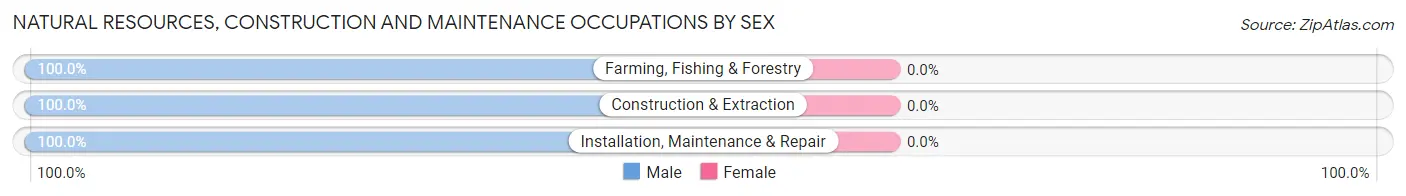
| Occupation | Male | Female |
| Farming, Fishing & Forestry | 81 (100.0%) | 0 (0.0%) |
| Construction & Extraction | 44 (100.0%) | 0 (0.0%) |
| Installation, Maintenance & Repair | 7 (100.0%) | 0 (0.0%) |
| Total (Category) | 132 (100.0%) | 0 (0.0%) |
| Total (Overall) | 519 (49.9%) | 522 (50.1%) |
Production, Transportation and Moving Occupations
The most common Production, Transportation and Moving occupations in Kapaau are , and Production (40 | 3.8%).
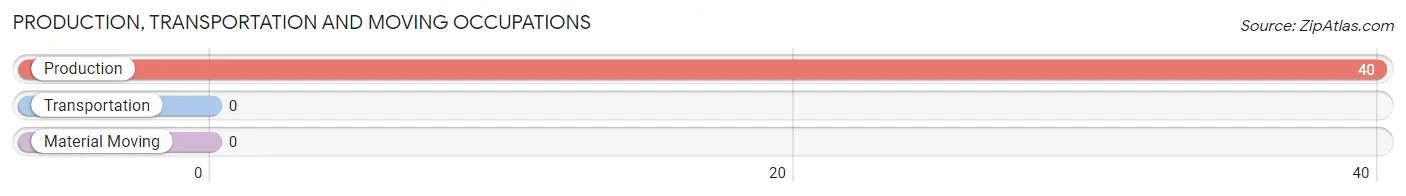
Production, Transportation and Moving Occupations by Sex
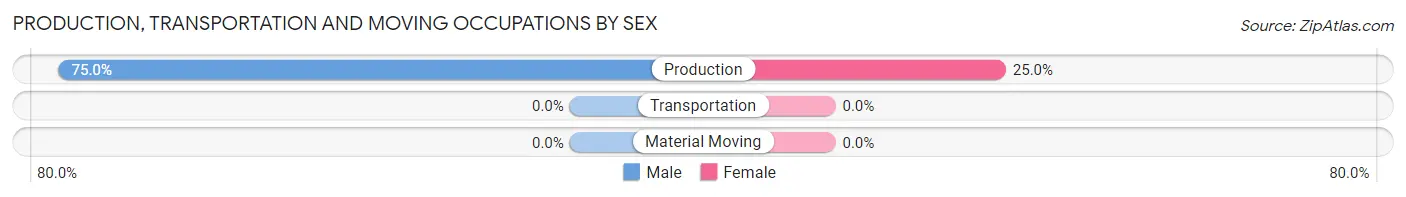
| Occupation | Male | Female |
| Production | 30 (75.0%) | 10 (25.0%) |
| Transportation | 0 (0.0%) | 0 (0.0%) |
| Material Moving | 0 (0.0%) | 0 (0.0%) |
| Total (Category) | 30 (75.0%) | 10 (25.0%) |
| Total (Overall) | 519 (49.9%) | 522 (50.1%) |
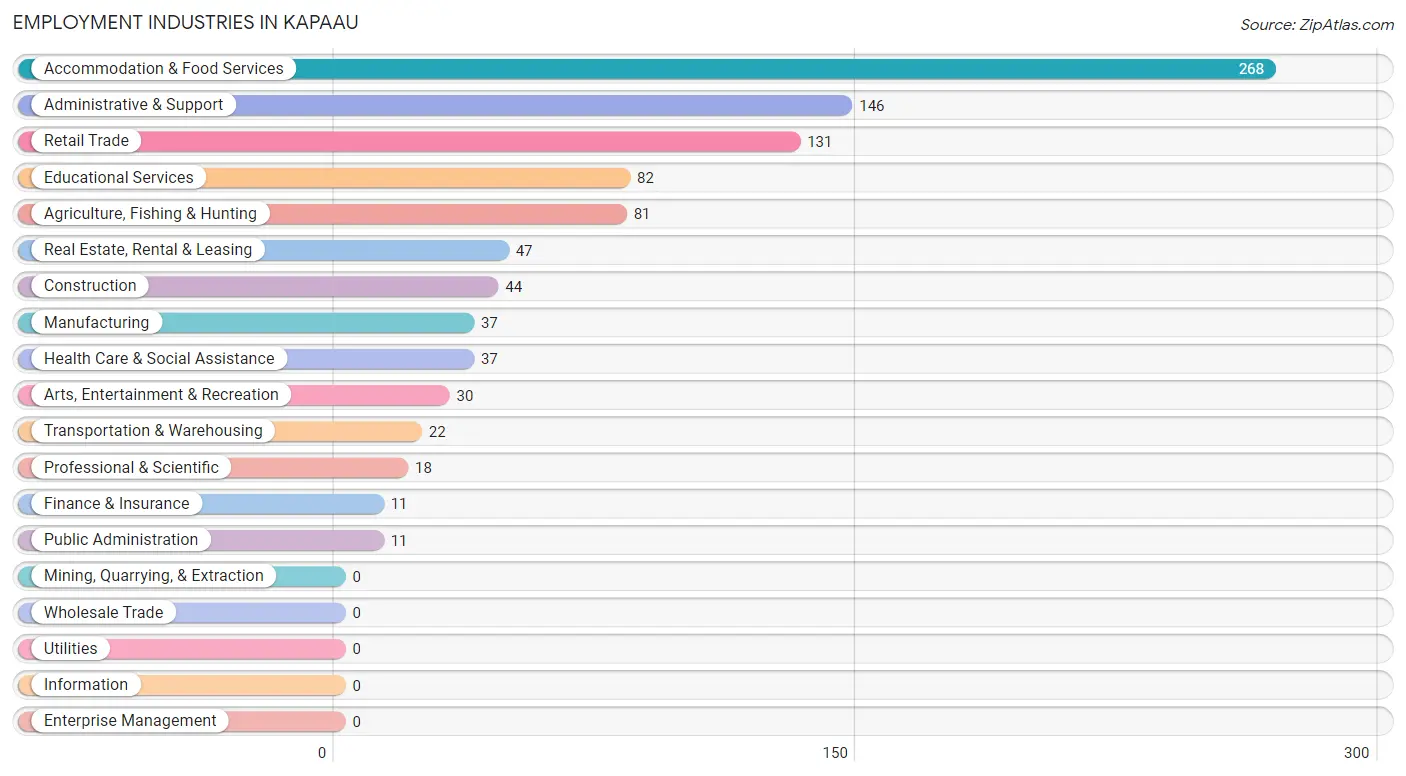
Employment Industries by Sex in Kapaau
Employment Industries in Kapaau
The major employment industries in Kapaau include Accommodation & Food Services (268 | 25.7%), Administrative & Support (146 | 14.0%), Retail Trade (131 | 12.6%), Educational Services (82 | 7.9%), and Agriculture, Fishing & Hunting (81 | 7.8%).
Employment Industries by Sex in Kapaau
The Kapaau industries that see more men than women are Agriculture, Fishing & Hunting (100.0%), Construction (100.0%), and Professional & Scientific (100.0%), whereas the industries that tend to have a higher number of women are Finance & Insurance (100.0%), Real Estate, Rental & Leasing (85.1%), and Educational Services (76.8%).
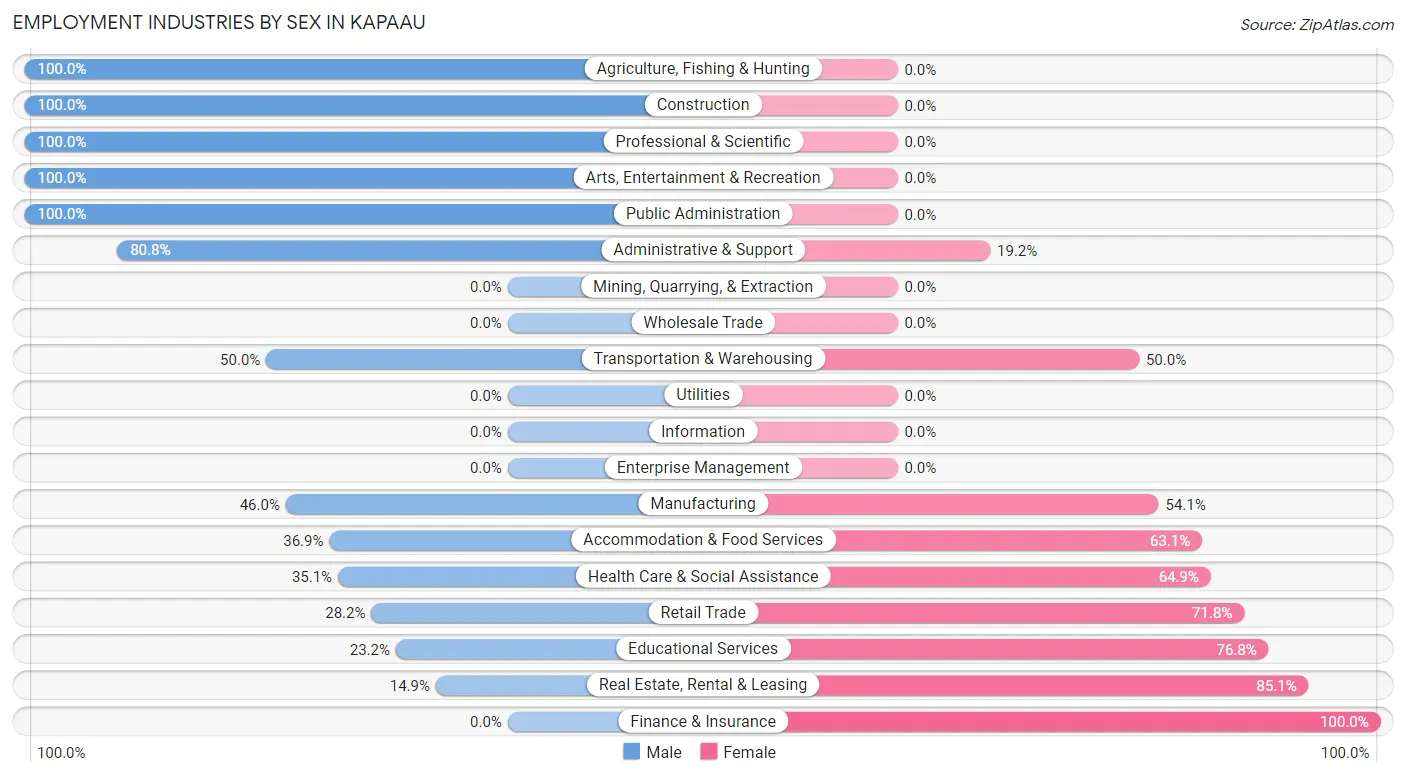
| Industry | Male | Female |
| Agriculture, Fishing & Hunting | 81 (100.0%) | 0 (0.0%) |
| Mining, Quarrying, & Extraction | 0 (0.0%) | 0 (0.0%) |
| Construction | 44 (100.0%) | 0 (0.0%) |
| Manufacturing | 17 (46.0%) | 20 (54.0%) |
| Wholesale Trade | 0 (0.0%) | 0 (0.0%) |
| Retail Trade | 37 (28.2%) | 94 (71.8%) |
| Transportation & Warehousing | 11 (50.0%) | 11 (50.0%) |
| Utilities | 0 (0.0%) | 0 (0.0%) |
| Information | 0 (0.0%) | 0 (0.0%) |
| Finance & Insurance | 0 (0.0%) | 11 (100.0%) |
| Real Estate, Rental & Leasing | 7 (14.9%) | 40 (85.1%) |
| Professional & Scientific | 18 (100.0%) | 0 (0.0%) |
| Enterprise Management | 0 (0.0%) | 0 (0.0%) |
| Administrative & Support | 118 (80.8%) | 28 (19.2%) |
| Educational Services | 19 (23.2%) | 63 (76.8%) |
| Health Care & Social Assistance | 13 (35.1%) | 24 (64.9%) |
| Arts, Entertainment & Recreation | 30 (100.0%) | 0 (0.0%) |
| Accommodation & Food Services | 99 (36.9%) | 169 (63.1%) |
| Public Administration | 11 (100.0%) | 0 (0.0%) |
| Total | 519 (49.9%) | 522 (50.1%) |
Education in Kapaau
School Enrollment in Kapaau
The most common levels of schooling among the 267 students in Kapaau are middle school (83 | 31.1%), high school (82 | 30.7%), and elementary school (77 | 28.8%).
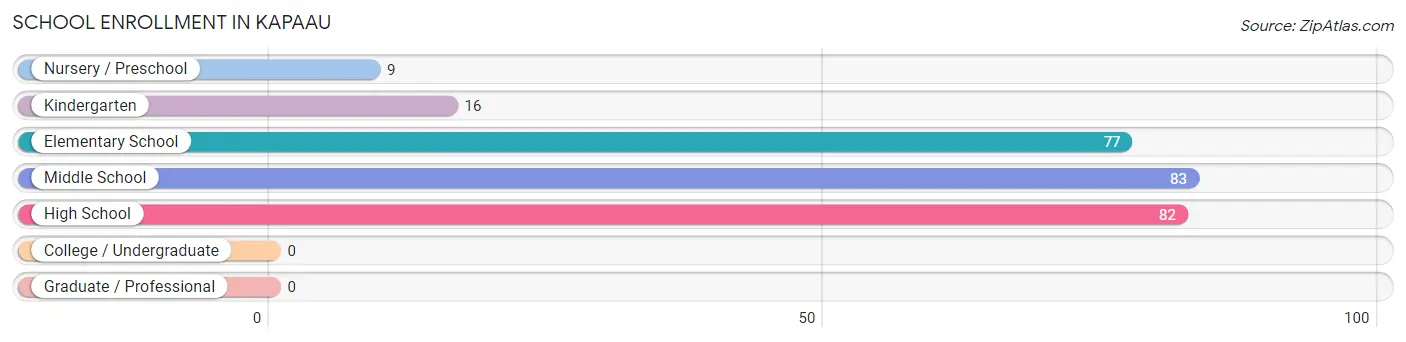
| School Level | # Students | % Students |
| Nursery / Preschool | 9 | 3.4% |
| Kindergarten | 16 | 6.0% |
| Elementary School | 77 | 28.8% |
| Middle School | 83 | 31.1% |
| High School | 82 | 30.7% |
| College / Undergraduate | 0 | 0.0% |
| Graduate / Professional | 0 | 0.0% |
| Total | 267 | 100.0% |
School Enrollment by Age by Funding Source in Kapaau
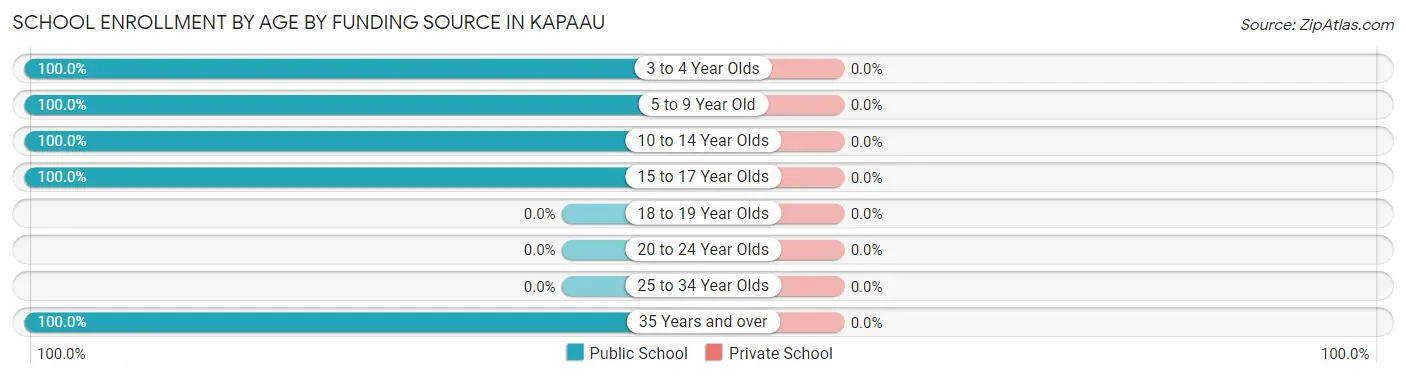
| Age Bracket | Public School | Private School |
| 3 to 4 Year Olds | 9 (100.0%) | 0 (0.0%) |
| 5 to 9 Year Old | 81 (100.0%) | 0 (0.0%) |
| 10 to 14 Year Olds | 95 (100.0%) | 0 (0.0%) |
| 15 to 17 Year Olds | 71 (100.0%) | 0 (0.0%) |
| 18 to 19 Year Olds | 0 (0.0%) | 0 (0.0%) |
| 20 to 24 Year Olds | 0 (0.0%) | 0 (0.0%) |
| 25 to 34 Year Olds | 0 (0.0%) | 0 (0.0%) |
| 35 Years and over | 11 (100.0%) | 0 (0.0%) |
| Total | 267 (100.0%) | 0 (0.0%) |
Educational Attainment by Field of Study in Kapaau
Education (91 | 36.8%), engineering (30 | 12.1%), visual & performing arts (25 | 10.1%), business (24 | 9.7%), and social sciences (23 | 9.3%) are the most common fields of study among 247 individuals in Kapaau who have obtained a bachelor's degree or higher.
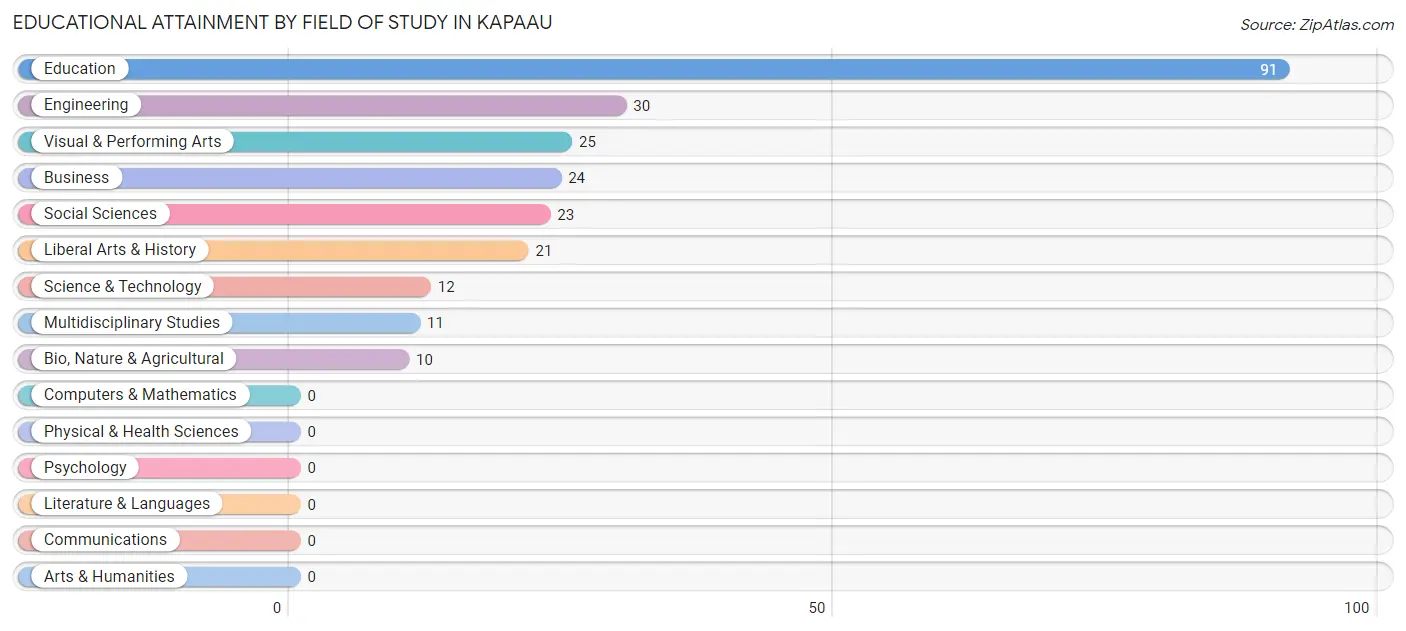
| Field of Study | # Graduates | % Graduates |
| Computers & Mathematics | 0 | 0.0% |
| Bio, Nature & Agricultural | 10 | 4.1% |
| Physical & Health Sciences | 0 | 0.0% |
| Psychology | 0 | 0.0% |
| Social Sciences | 23 | 9.3% |
| Engineering | 30 | 12.1% |
| Multidisciplinary Studies | 11 | 4.4% |
| Science & Technology | 12 | 4.9% |
| Business | 24 | 9.7% |
| Education | 91 | 36.8% |
| Literature & Languages | 0 | 0.0% |
| Liberal Arts & History | 21 | 8.5% |
| Visual & Performing Arts | 25 | 10.1% |
| Communications | 0 | 0.0% |
| Arts & Humanities | 0 | 0.0% |
| Total | 247 | 100.0% |
Transportation & Commute in Kapaau
Vehicle Availability by Sex in Kapaau
The most prevalent vehicle ownership categories in Kapaau are males with 2 vehicles (206, accounting for 40.8%) and females with 2 vehicles (279, making up 41.3%).
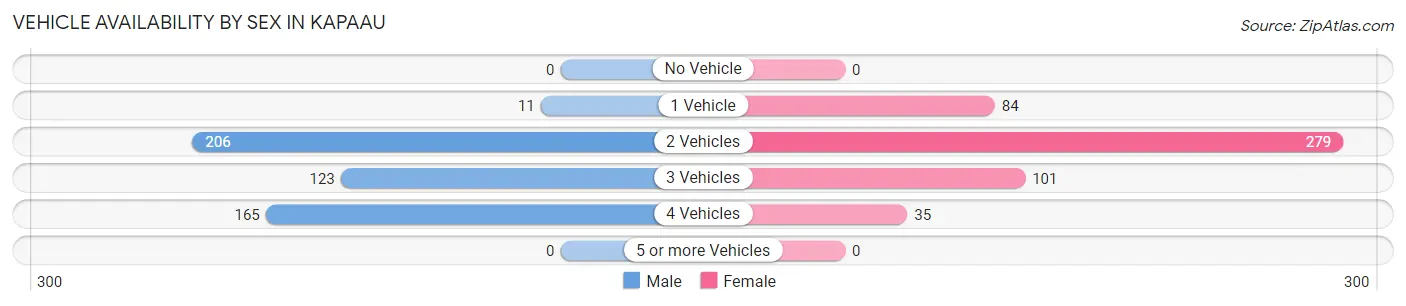
| Vehicles Available | Male | Female |
| No Vehicle | 0 (0.0%) | 0 (0.0%) |
| 1 Vehicle | 11 (2.2%) | 84 (16.8%) |
| 2 Vehicles | 206 (40.8%) | 279 (55.9%) |
| 3 Vehicles | 123 (24.4%) | 101 (20.2%) |
| 4 Vehicles | 165 (32.7%) | 35 (7.0%) |
| 5 or more Vehicles | 0 (0.0%) | 0 (0.0%) |
| Total | 505 (100.0%) | 499 (100.0%) |
Commute Time in Kapaau
The most frequently occuring commute durations in Kapaau are 5 to 9 minutes (232 commuters, 24.2%), 40 to 44 minutes (157 commuters, 16.4%), and 45 to 59 minutes (146 commuters, 15.2%).
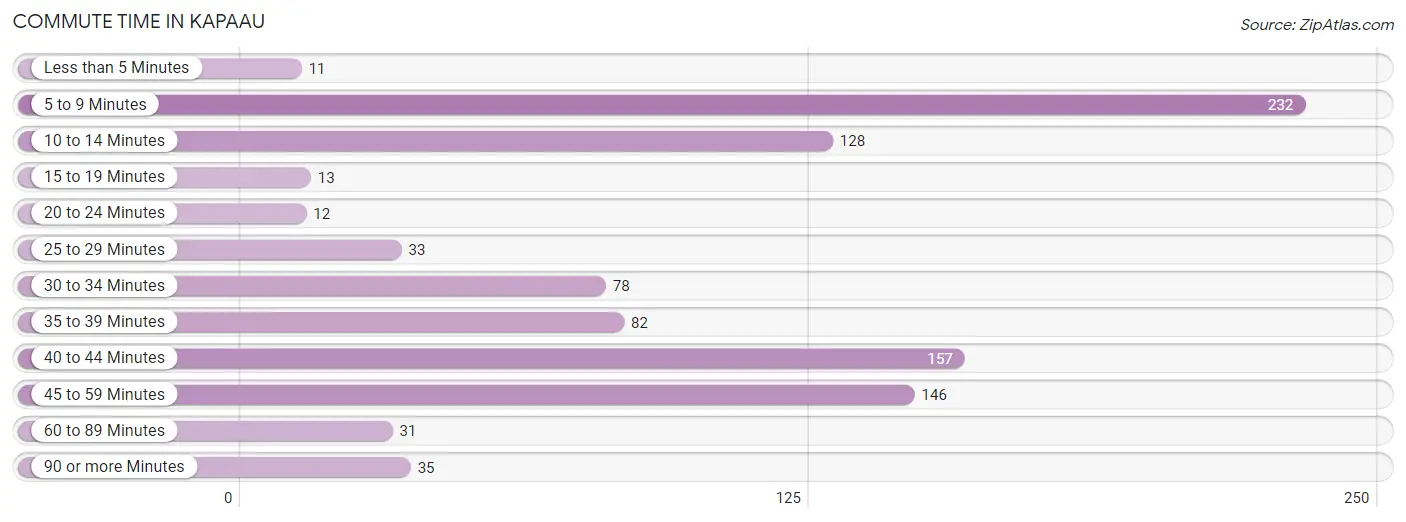
| Commute Time | # Commuters | % Commuters |
| Less than 5 Minutes | 11 | 1.1% |
| 5 to 9 Minutes | 232 | 24.2% |
| 10 to 14 Minutes | 128 | 13.4% |
| 15 to 19 Minutes | 13 | 1.4% |
| 20 to 24 Minutes | 12 | 1.3% |
| 25 to 29 Minutes | 33 | 3.4% |
| 30 to 34 Minutes | 78 | 8.1% |
| 35 to 39 Minutes | 82 | 8.6% |
| 40 to 44 Minutes | 157 | 16.4% |
| 45 to 59 Minutes | 146 | 15.2% |
| 60 to 89 Minutes | 31 | 3.2% |
| 90 or more Minutes | 35 | 3.6% |
Commute Time by Sex in Kapaau
The most common commute times in Kapaau are 5 to 9 minutes (119 commuters, 24.1%) for males and 45 to 59 minutes (114 commuters, 24.6%) for females.
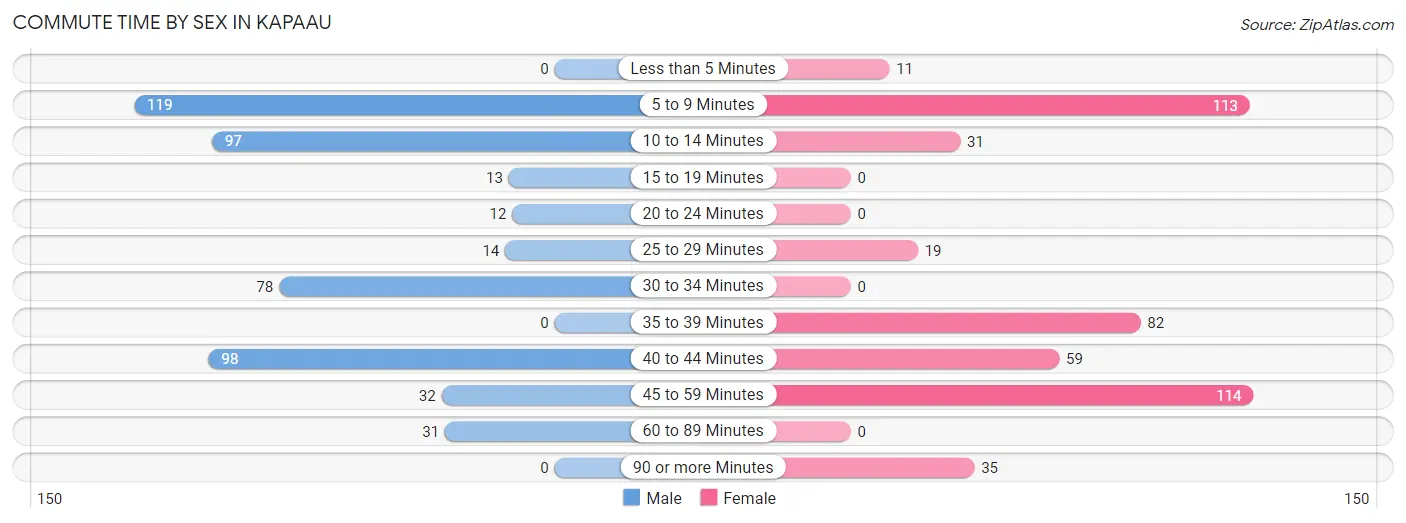
| Commute Time | Male | Female |
| Less than 5 Minutes | 0 (0.0%) | 11 (2.4%) |
| 5 to 9 Minutes | 119 (24.1%) | 113 (24.3%) |
| 10 to 14 Minutes | 97 (19.6%) | 31 (6.7%) |
| 15 to 19 Minutes | 13 (2.6%) | 0 (0.0%) |
| 20 to 24 Minutes | 12 (2.4%) | 0 (0.0%) |
| 25 to 29 Minutes | 14 (2.8%) | 19 (4.1%) |
| 30 to 34 Minutes | 78 (15.8%) | 0 (0.0%) |
| 35 to 39 Minutes | 0 (0.0%) | 82 (17.7%) |
| 40 to 44 Minutes | 98 (19.8%) | 59 (12.7%) |
| 45 to 59 Minutes | 32 (6.5%) | 114 (24.6%) |
| 60 to 89 Minutes | 31 (6.3%) | 0 (0.0%) |
| 90 or more Minutes | 0 (0.0%) | 35 (7.5%) |
Time of Departure to Work by Sex in Kapaau
The most frequent times of departure to work in Kapaau are 7:00 AM to 7:29 AM (141, 28.5%) for males and 6:00 AM to 6:29 AM (114, 24.6%) for females.
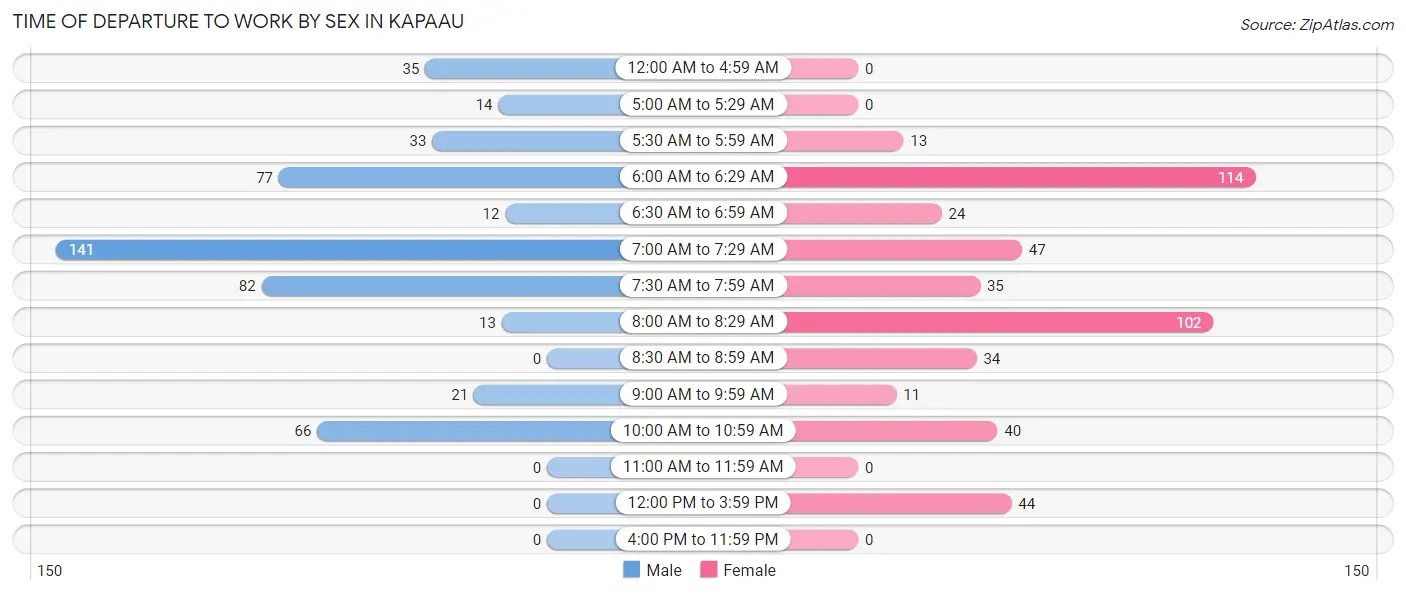
| Time of Departure | Male | Female |
| 12:00 AM to 4:59 AM | 35 (7.1%) | 0 (0.0%) |
| 5:00 AM to 5:29 AM | 14 (2.8%) | 0 (0.0%) |
| 5:30 AM to 5:59 AM | 33 (6.7%) | 13 (2.8%) |
| 6:00 AM to 6:29 AM | 77 (15.6%) | 114 (24.6%) |
| 6:30 AM to 6:59 AM | 12 (2.4%) | 24 (5.2%) |
| 7:00 AM to 7:29 AM | 141 (28.5%) | 47 (10.1%) |
| 7:30 AM to 7:59 AM | 82 (16.6%) | 35 (7.5%) |
| 8:00 AM to 8:29 AM | 13 (2.6%) | 102 (22.0%) |
| 8:30 AM to 8:59 AM | 0 (0.0%) | 34 (7.3%) |
| 9:00 AM to 9:59 AM | 21 (4.3%) | 11 (2.4%) |
| 10:00 AM to 10:59 AM | 66 (13.4%) | 40 (8.6%) |
| 11:00 AM to 11:59 AM | 0 (0.0%) | 0 (0.0%) |
| 12:00 PM to 3:59 PM | 0 (0.0%) | 44 (9.5%) |
| 4:00 PM to 11:59 PM | 0 (0.0%) | 0 (0.0%) |
| Total | 494 (100.0%) | 464 (100.0%) |
Housing Occupancy in Kapaau
Occupancy by Ownership in Kapaau
Of the total 666 dwellings in Kapaau, owner-occupied units account for 521 (78.2%), while renter-occupied units make up 145 (21.8%).
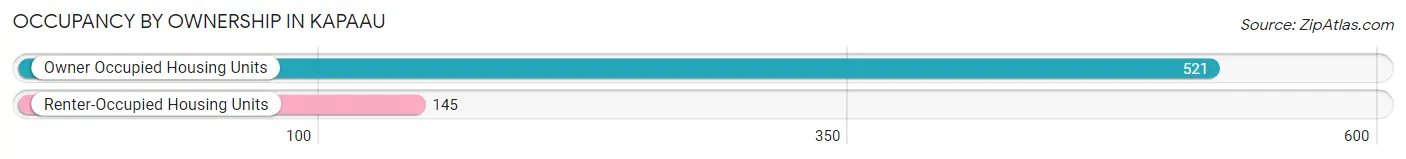
| Occupancy | # Housing Units | % Housing Units |
| Owner Occupied Housing Units | 521 | 78.2% |
| Renter-Occupied Housing Units | 145 | 21.8% |
| Total Occupied Housing Units | 666 | 100.0% |
Occupancy by Household Size in Kapaau
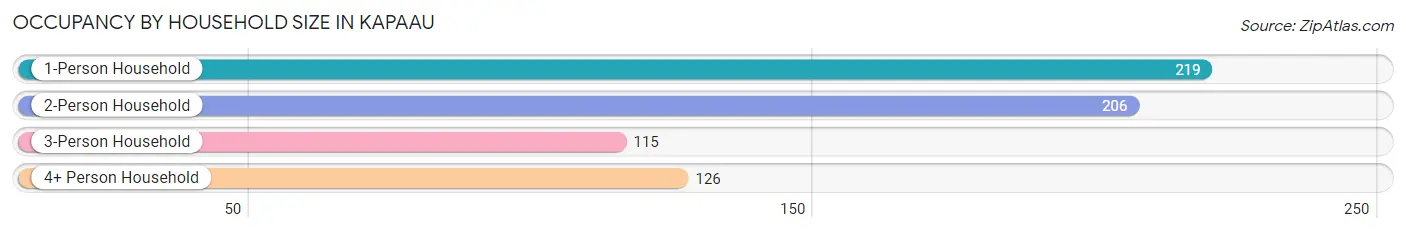
| Household Size | # Housing Units | % Housing Units |
| 1-Person Household | 219 | 32.9% |
| 2-Person Household | 206 | 30.9% |
| 3-Person Household | 115 | 17.3% |
| 4+ Person Household | 126 | 18.9% |
| Total Housing Units | 666 | 100.0% |
Occupancy by Ownership by Household Size in Kapaau
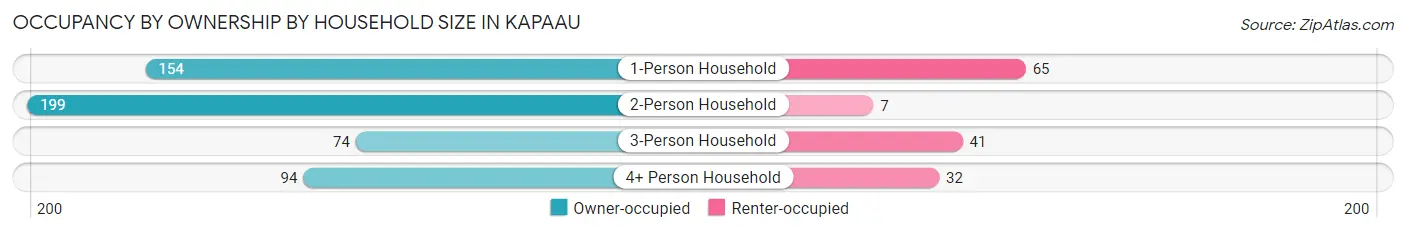
| Household Size | Owner-occupied | Renter-occupied |
| 1-Person Household | 154 (70.3%) | 65 (29.7%) |
| 2-Person Household | 199 (96.6%) | 7 (3.4%) |
| 3-Person Household | 74 (64.3%) | 41 (35.6%) |
| 4+ Person Household | 94 (74.6%) | 32 (25.4%) |
| Total Housing Units | 521 (78.2%) | 145 (21.8%) |
Occupancy by Educational Attainment in Kapaau
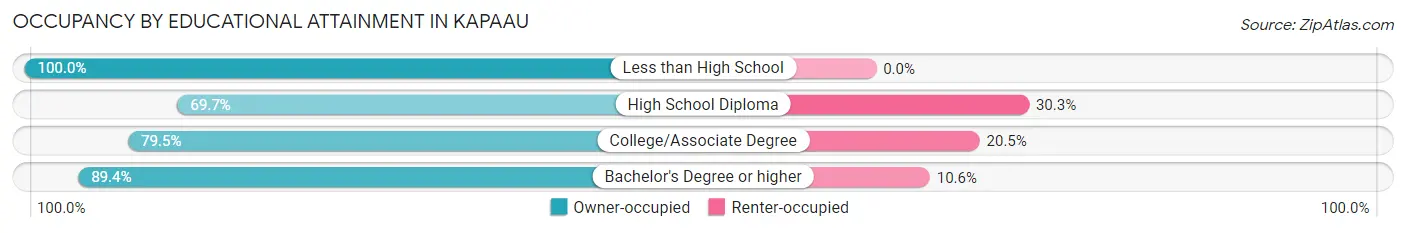
| Household Size | Owner-occupied | Renter-occupied |
| Less than High School | 33 (100.0%) | 0 (0.0%) |
| High School Diploma | 207 (69.7%) | 90 (30.3%) |
| College/Associate Degree | 155 (79.5%) | 40 (20.5%) |
| Bachelor's Degree or higher | 126 (89.4%) | 15 (10.6%) |
Occupancy by Age of Householder in Kapaau
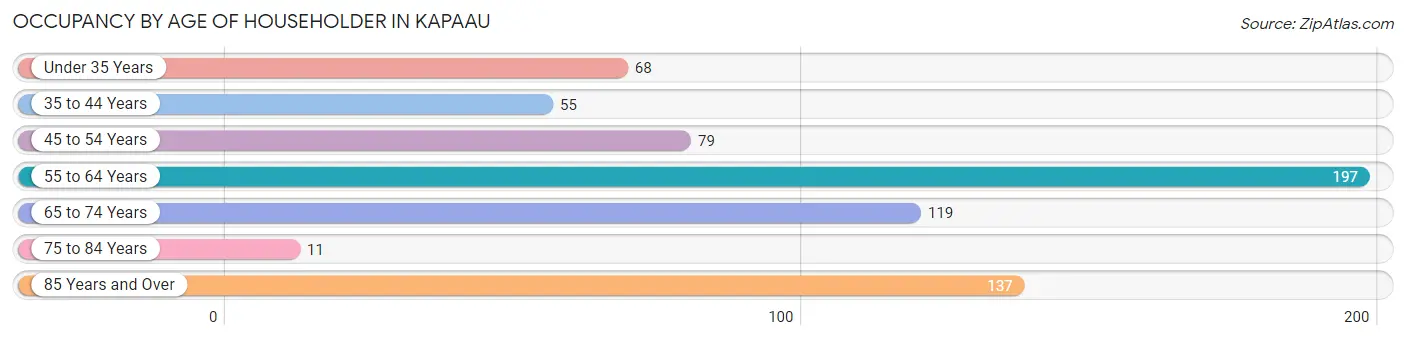
| Age Bracket | # Households | % Households |
| Under 35 Years | 68 | 10.2% |
| 35 to 44 Years | 55 | 8.3% |
| 45 to 54 Years | 79 | 11.9% |
| 55 to 64 Years | 197 | 29.6% |
| 65 to 74 Years | 119 | 17.9% |
| 75 to 84 Years | 11 | 1.7% |
| 85 Years and Over | 137 | 20.6% |
| Total | 666 | 100.0% |
Housing Finances in Kapaau
Median Income by Occupancy in Kapaau
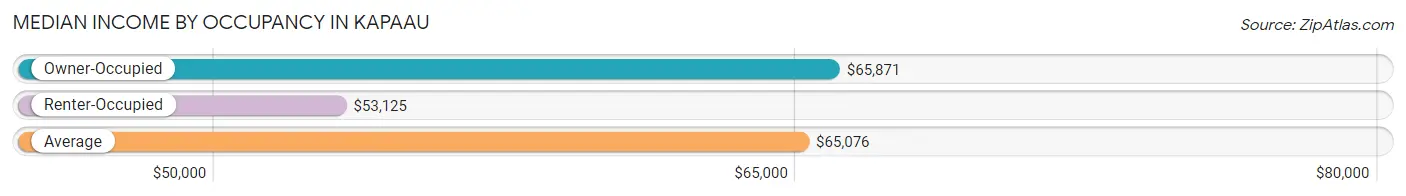
| Occupancy Type | # Households | Median Income |
| Owner-Occupied | 521 (78.2%) | $65,871 |
| Renter-Occupied | 145 (21.8%) | $53,125 |
| Average | 666 (100.0%) | $65,076 |
Occupancy by Householder Income Bracket in Kapaau
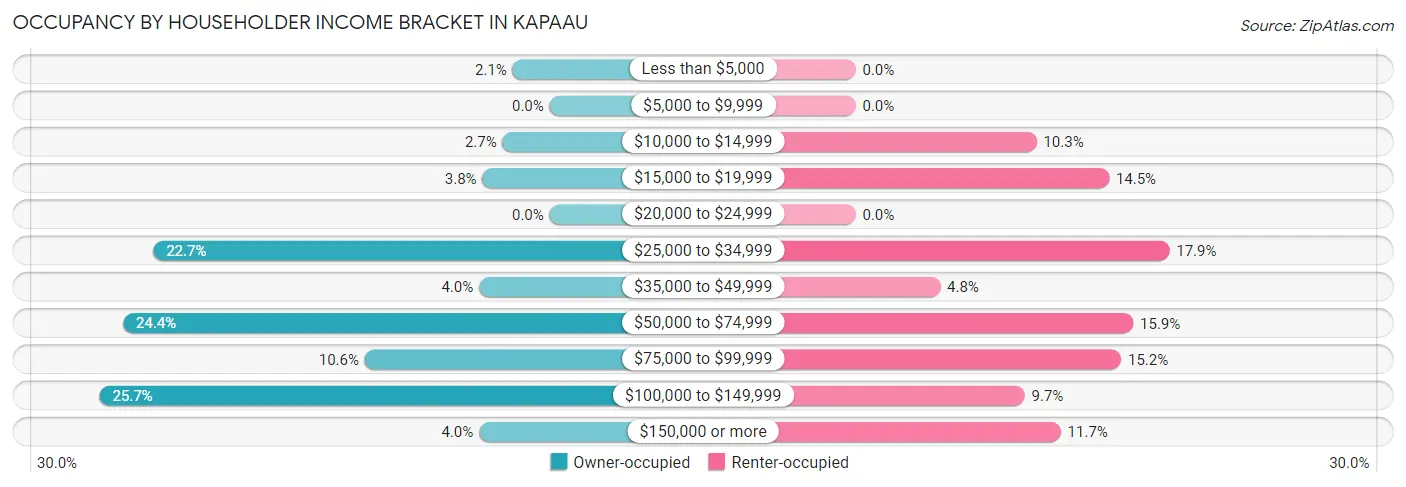
| Income Bracket | Owner-occupied | Renter-occupied |
| Less than $5,000 | 11 (2.1%) | 0 (0.0%) |
| $5,000 to $9,999 | 0 (0.0%) | 0 (0.0%) |
| $10,000 to $14,999 | 14 (2.7%) | 15 (10.3%) |
| $15,000 to $19,999 | 20 (3.8%) | 21 (14.5%) |
| $20,000 to $24,999 | 0 (0.0%) | 0 (0.0%) |
| $25,000 to $34,999 | 118 (22.7%) | 26 (17.9%) |
| $35,000 to $49,999 | 21 (4.0%) | 7 (4.8%) |
| $50,000 to $74,999 | 127 (24.4%) | 23 (15.9%) |
| $75,000 to $99,999 | 55 (10.6%) | 22 (15.2%) |
| $100,000 to $149,999 | 134 (25.7%) | 14 (9.7%) |
| $150,000 or more | 21 (4.0%) | 17 (11.7%) |
| Total | 521 (100.0%) | 145 (100.0%) |
Monthly Housing Cost Tiers in Kapaau
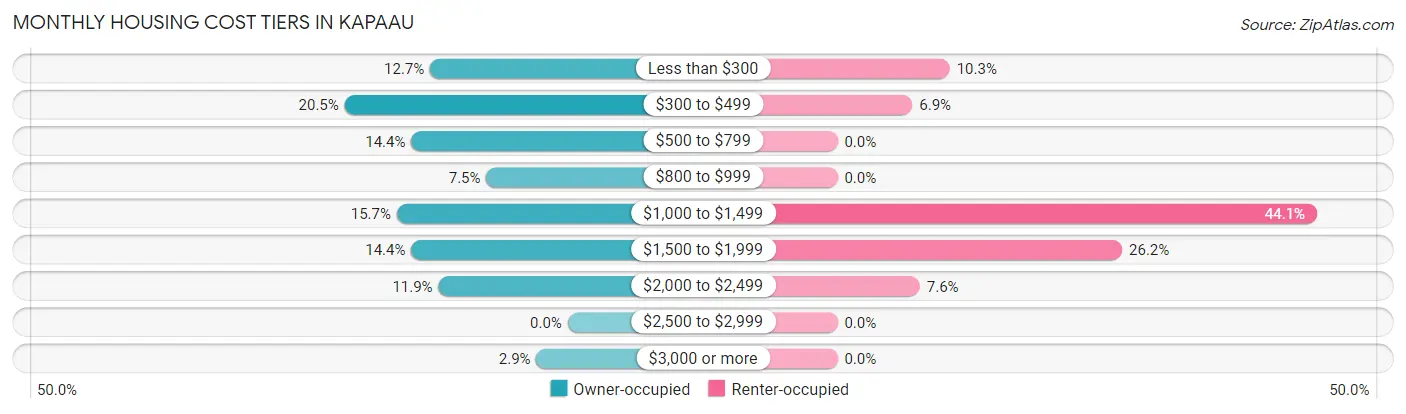
| Monthly Cost | Owner-occupied | Renter-occupied |
| Less than $300 | 66 (12.7%) | 15 (10.3%) |
| $300 to $499 | 107 (20.5%) | 10 (6.9%) |
| $500 to $799 | 75 (14.4%) | 0 (0.0%) |
| $800 to $999 | 39 (7.5%) | 0 (0.0%) |
| $1,000 to $1,499 | 82 (15.7%) | 64 (44.1%) |
| $1,500 to $1,999 | 75 (14.4%) | 38 (26.2%) |
| $2,000 to $2,499 | 62 (11.9%) | 11 (7.6%) |
| $2,500 to $2,999 | 0 (0.0%) | 0 (0.0%) |
| $3,000 or more | 15 (2.9%) | 0 (0.0%) |
| Total | 521 (100.0%) | 145 (100.0%) |
Physical Housing Characteristics in Kapaau
Housing Structures in Kapaau
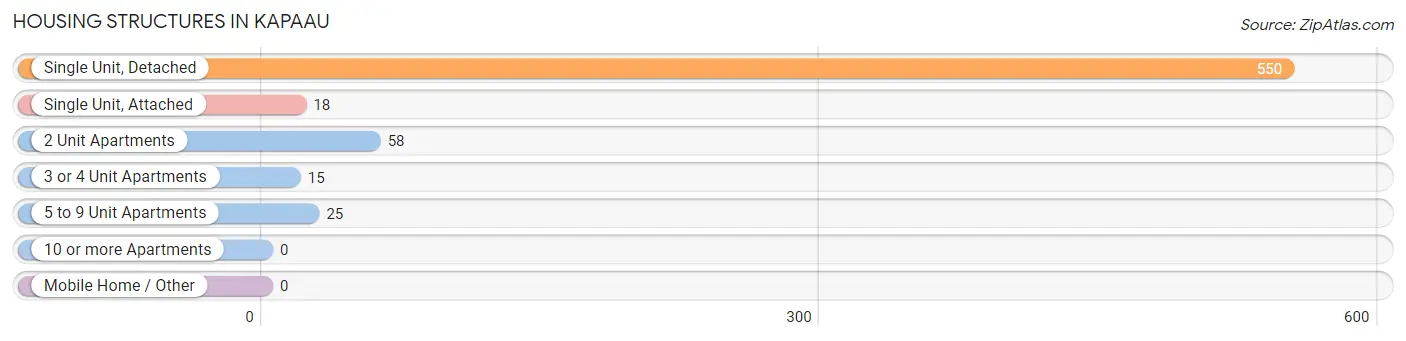
| Structure Type | # Housing Units | % Housing Units |
| Single Unit, Detached | 550 | 82.6% |
| Single Unit, Attached | 18 | 2.7% |
| 2 Unit Apartments | 58 | 8.7% |
| 3 or 4 Unit Apartments | 15 | 2.2% |
| 5 to 9 Unit Apartments | 25 | 3.7% |
| 10 or more Apartments | 0 | 0.0% |
| Mobile Home / Other | 0 | 0.0% |
| Total | 666 | 100.0% |
Housing Structures by Occupancy in Kapaau
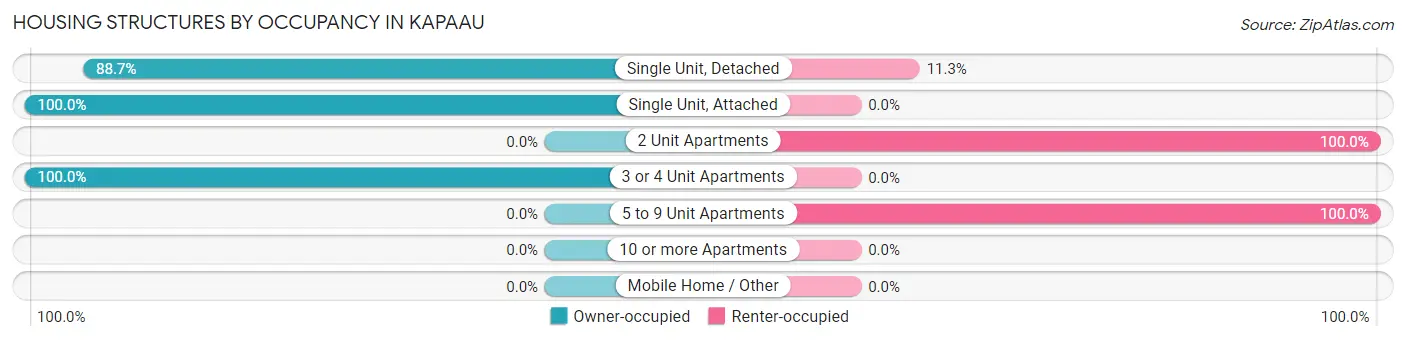
| Structure Type | Owner-occupied | Renter-occupied |
| Single Unit, Detached | 488 (88.7%) | 62 (11.3%) |
| Single Unit, Attached | 18 (100.0%) | 0 (0.0%) |
| 2 Unit Apartments | 0 (0.0%) | 58 (100.0%) |
| 3 or 4 Unit Apartments | 15 (100.0%) | 0 (0.0%) |
| 5 to 9 Unit Apartments | 0 (0.0%) | 25 (100.0%) |
| 10 or more Apartments | 0 (0.0%) | 0 (0.0%) |
| Mobile Home / Other | 0 (0.0%) | 0 (0.0%) |
| Total | 521 (78.2%) | 145 (21.8%) |
Housing Structures by Number of Rooms in Kapaau
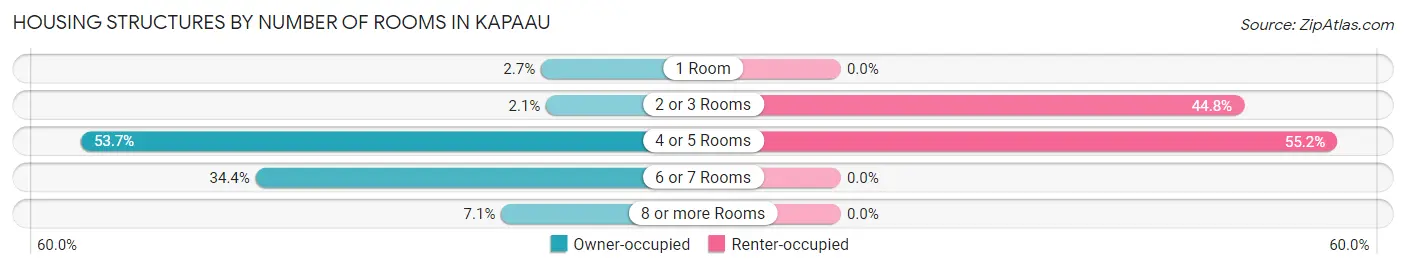
| Number of Rooms | Owner-occupied | Renter-occupied |
| 1 Room | 14 (2.7%) | 0 (0.0%) |
| 2 or 3 Rooms | 11 (2.1%) | 65 (44.8%) |
| 4 or 5 Rooms | 280 (53.7%) | 80 (55.2%) |
| 6 or 7 Rooms | 179 (34.4%) | 0 (0.0%) |
| 8 or more Rooms | 37 (7.1%) | 0 (0.0%) |
| Total | 521 (100.0%) | 145 (100.0%) |
Housing Structure by Heating Type in Kapaau
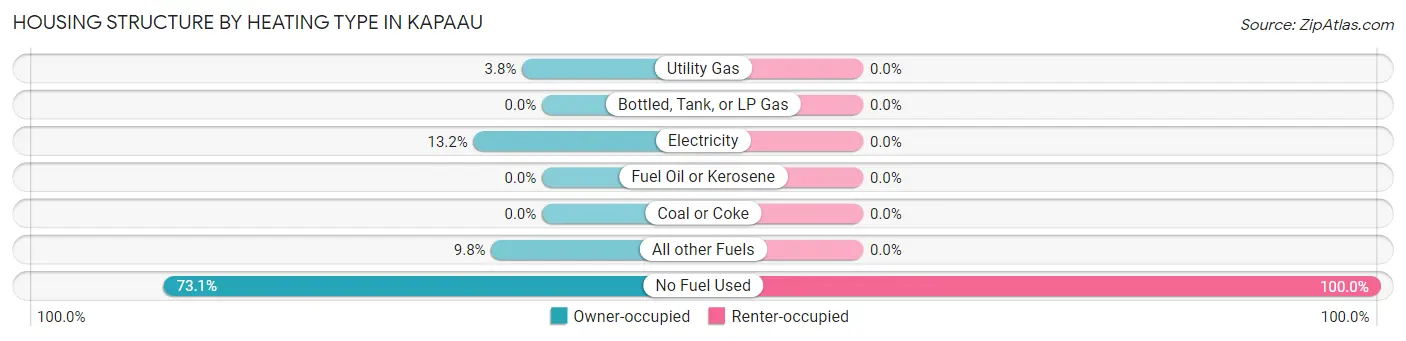
| Heating Type | Owner-occupied | Renter-occupied |
| Utility Gas | 20 (3.8%) | 0 (0.0%) |
| Bottled, Tank, or LP Gas | 0 (0.0%) | 0 (0.0%) |
| Electricity | 69 (13.2%) | 0 (0.0%) |
| Fuel Oil or Kerosene | 0 (0.0%) | 0 (0.0%) |
| Coal or Coke | 0 (0.0%) | 0 (0.0%) |
| All other Fuels | 51 (9.8%) | 0 (0.0%) |
| No Fuel Used | 381 (73.1%) | 145 (100.0%) |
| Total | 521 (100.0%) | 145 (100.0%) |
Household Vehicle Usage in Kapaau
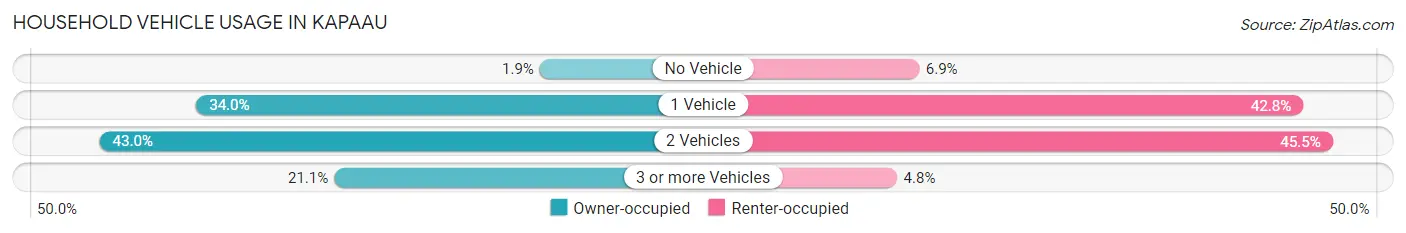
| Vehicles per Household | Owner-occupied | Renter-occupied |
| No Vehicle | 10 (1.9%) | 10 (6.9%) |
| 1 Vehicle | 177 (34.0%) | 62 (42.8%) |
| 2 Vehicles | 224 (43.0%) | 66 (45.5%) |
| 3 or more Vehicles | 110 (21.1%) | 7 (4.8%) |
| Total | 521 (100.0%) | 145 (100.0%) |
Real Estate & Mortgages in Kapaau
Real Estate and Mortgage Overview in Kapaau
| Characteristic | Without Mortgage | With Mortgage |
| Housing Units | 273 | 248 |
| Median Property Value | $459,000 | $509,500 |
| Median Household Income | - | - |
| Monthly Housing Costs | $462 | $15 |
| Real Estate Taxes | - | - |
Property Value by Mortgage Status in Kapaau
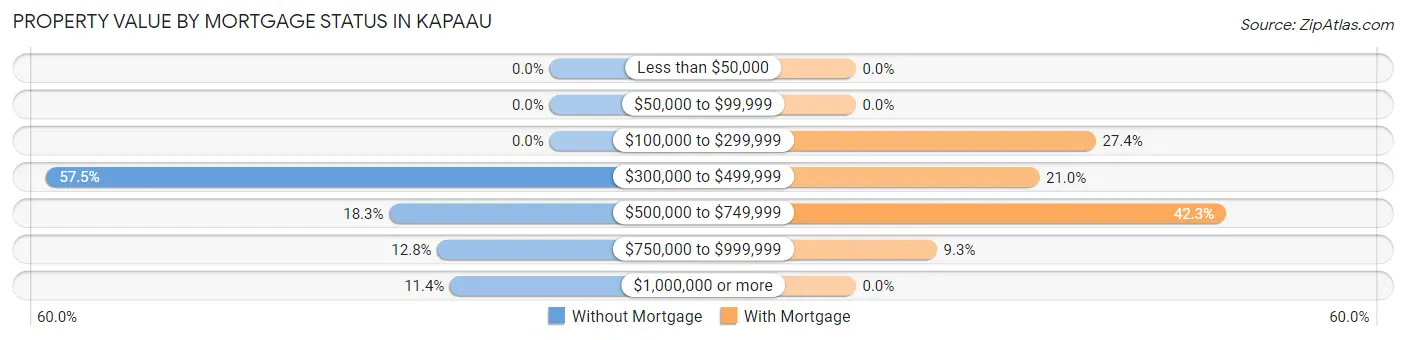
| Property Value | Without Mortgage | With Mortgage |
| Less than $50,000 | 0 (0.0%) | 0 (0.0%) |
| $50,000 to $99,999 | 0 (0.0%) | 0 (0.0%) |
| $100,000 to $299,999 | 0 (0.0%) | 68 (27.4%) |
| $300,000 to $499,999 | 157 (57.5%) | 52 (21.0%) |
| $500,000 to $749,999 | 50 (18.3%) | 105 (42.3%) |
| $750,000 to $999,999 | 35 (12.8%) | 23 (9.3%) |
| $1,000,000 or more | 31 (11.4%) | 0 (0.0%) |
| Total | 273 (100.0%) | 248 (100.0%) |
Household Income by Mortgage Status in Kapaau
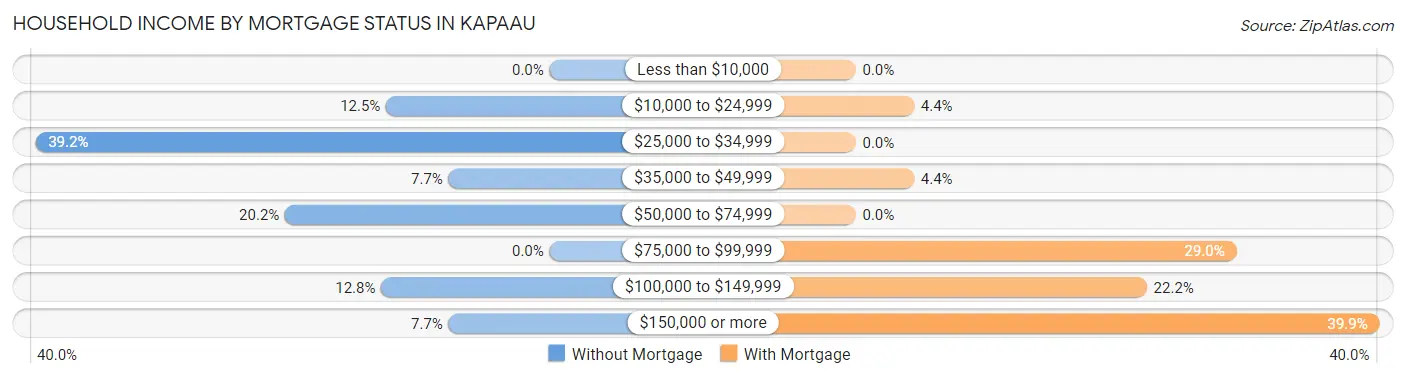
| Household Income | Without Mortgage | With Mortgage |
| Less than $10,000 | 0 (0.0%) | 0 (0.0%) |
| $10,000 to $24,999 | 34 (12.4%) | 11 (4.4%) |
| $25,000 to $34,999 | 107 (39.2%) | 0 (0.0%) |
| $35,000 to $49,999 | 21 (7.7%) | 11 (4.4%) |
| $50,000 to $74,999 | 55 (20.2%) | 0 (0.0%) |
| $75,000 to $99,999 | 0 (0.0%) | 72 (29.0%) |
| $100,000 to $149,999 | 35 (12.8%) | 55 (22.2%) |
| $150,000 or more | 21 (7.7%) | 99 (39.9%) |
| Total | 273 (100.0%) | 248 (100.0%) |
Property Value to Household Income Ratio in Kapaau
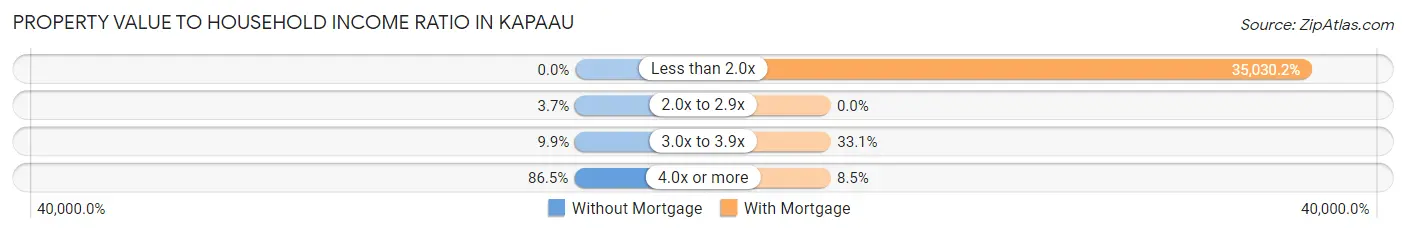
| Value-to-Income Ratio | Without Mortgage | With Mortgage |
| Less than 2.0x | 0 (0.0%) | 86,875 (35,030.2%) |
| 2.0x to 2.9x | 10 (3.7%) | 0 (0.0%) |
| 3.0x to 3.9x | 27 (9.9%) | 82 (33.1%) |
| 4.0x or more | 236 (86.5%) | 21 (8.5%) |
| Total | 273 (100.0%) | 248 (100.0%) |
Real Estate Taxes by Mortgage Status in Kapaau
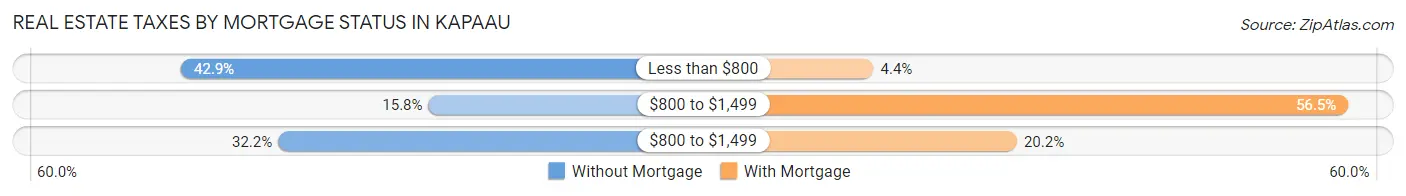
| Property Taxes | Without Mortgage | With Mortgage |
| Less than $800 | 117 (42.9%) | 11 (4.4%) |
| $800 to $1,499 | 43 (15.8%) | 140 (56.5%) |
| $800 to $1,499 | 88 (32.2%) | 50 (20.2%) |
| Total | 273 (100.0%) | 248 (100.0%) |
Health & Disability in Kapaau
Health Insurance Coverage by Age in Kapaau
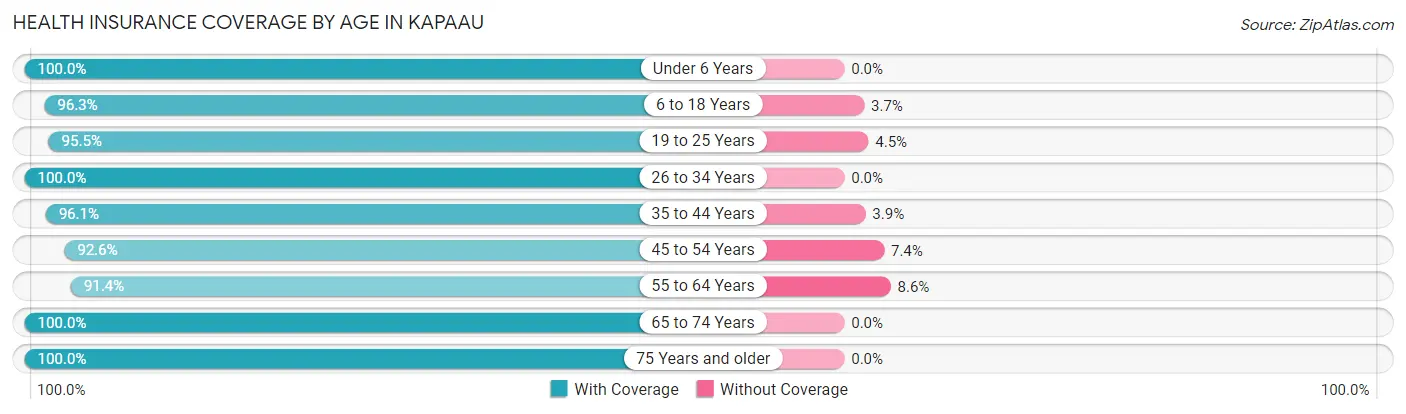
| Age Bracket | With Coverage | Without Coverage |
| Under 6 Years | 42 (100.0%) | 0 (0.0%) |
| 6 to 18 Years | 261 (96.3%) | 10 (3.7%) |
| 19 to 25 Years | 234 (95.5%) | 11 (4.5%) |
| 26 to 34 Years | 180 (100.0%) | 0 (0.0%) |
| 35 to 44 Years | 195 (96.1%) | 8 (3.9%) |
| 45 to 54 Years | 275 (92.6%) | 22 (7.4%) |
| 55 to 64 Years | 233 (91.4%) | 22 (8.6%) |
| 65 to 74 Years | 272 (100.0%) | 0 (0.0%) |
| 75 Years and older | 186 (100.0%) | 0 (0.0%) |
| Total | 1,878 (96.3%) | 73 (3.7%) |
Health Insurance Coverage by Citizenship Status in Kapaau
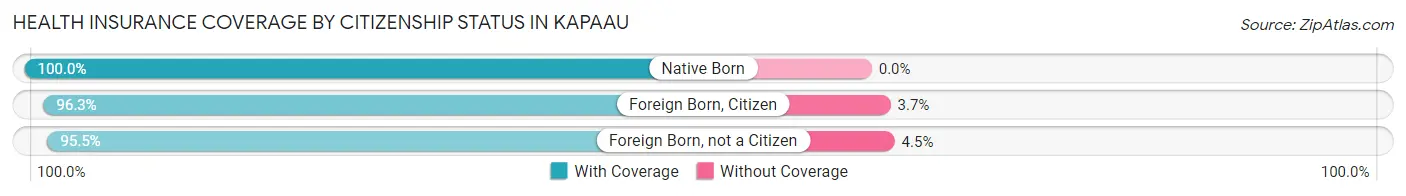
| Citizenship Status | With Coverage | Without Coverage |
| Native Born | 42 (100.0%) | 0 (0.0%) |
| Foreign Born, Citizen | 261 (96.3%) | 10 (3.7%) |
| Foreign Born, not a Citizen | 234 (95.5%) | 11 (4.5%) |
Health Insurance Coverage by Household Income in Kapaau
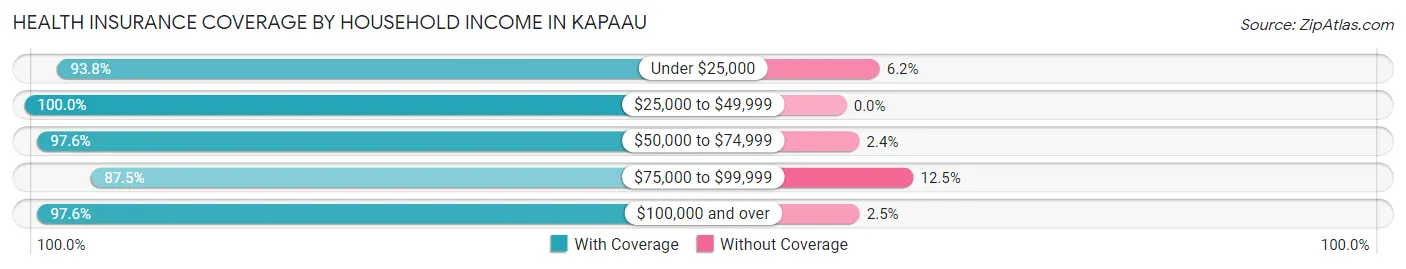
| Household Income | With Coverage | Without Coverage |
| Under $25,000 | 167 (93.8%) | 11 (6.2%) |
| $25,000 to $49,999 | 221 (100.0%) | 0 (0.0%) |
| $50,000 to $74,999 | 365 (97.6%) | 9 (2.4%) |
| $75,000 to $99,999 | 210 (87.5%) | 30 (12.5%) |
| $100,000 and over | 914 (97.6%) | 23 (2.5%) |
Public vs Private Health Insurance Coverage by Age in Kapaau
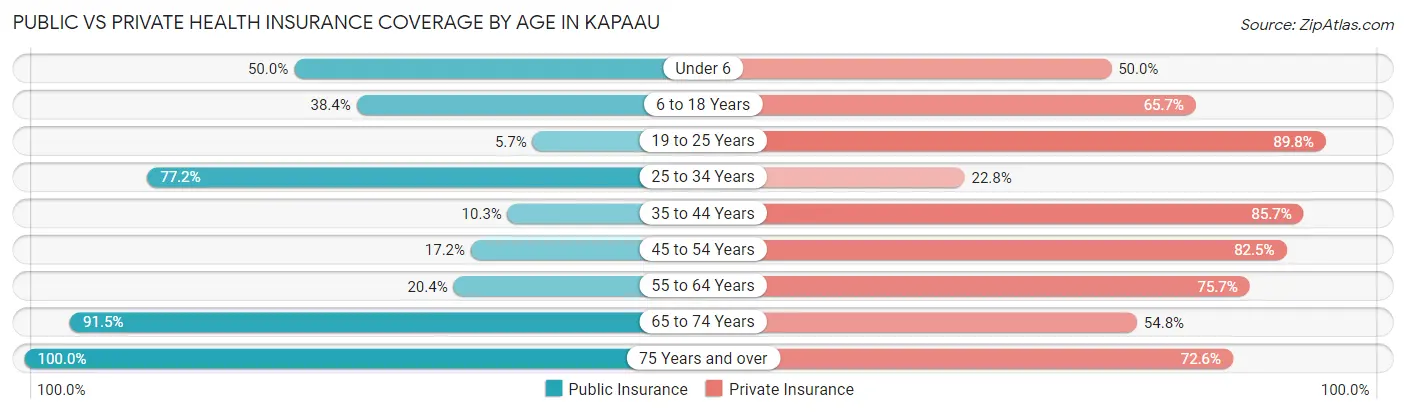
| Age Bracket | Public Insurance | Private Insurance |
| Under 6 | 21 (50.0%) | 21 (50.0%) |
| 6 to 18 Years | 104 (38.4%) | 178 (65.7%) |
| 19 to 25 Years | 14 (5.7%) | 220 (89.8%) |
| 25 to 34 Years | 139 (77.2%) | 41 (22.8%) |
| 35 to 44 Years | 21 (10.3%) | 174 (85.7%) |
| 45 to 54 Years | 51 (17.2%) | 245 (82.5%) |
| 55 to 64 Years | 52 (20.4%) | 193 (75.7%) |
| 65 to 74 Years | 249 (91.5%) | 149 (54.8%) |
| 75 Years and over | 186 (100.0%) | 135 (72.6%) |
| Total | 837 (42.9%) | 1,356 (69.5%) |
Disability Status by Sex by Age in Kapaau
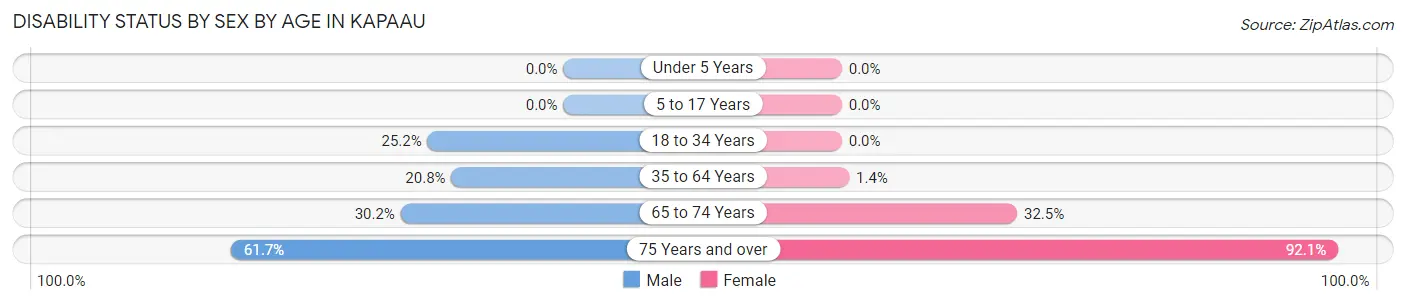
| Age Bracket | Male | Female |
| Under 5 Years | 0 (0.0%) | 0 (0.0%) |
| 5 to 17 Years | 0 (0.0%) | 0 (0.0%) |
| 18 to 34 Years | 64 (25.2%) | 0 (0.0%) |
| 35 to 64 Years | 80 (20.8%) | 5 (1.3%) |
| 65 to 74 Years | 32 (30.2%) | 54 (32.5%) |
| 75 Years and over | 29 (61.7%) | 128 (92.1%) |
Disability Class by Sex by Age in Kapaau
Disability Class: Hearing Difficulty
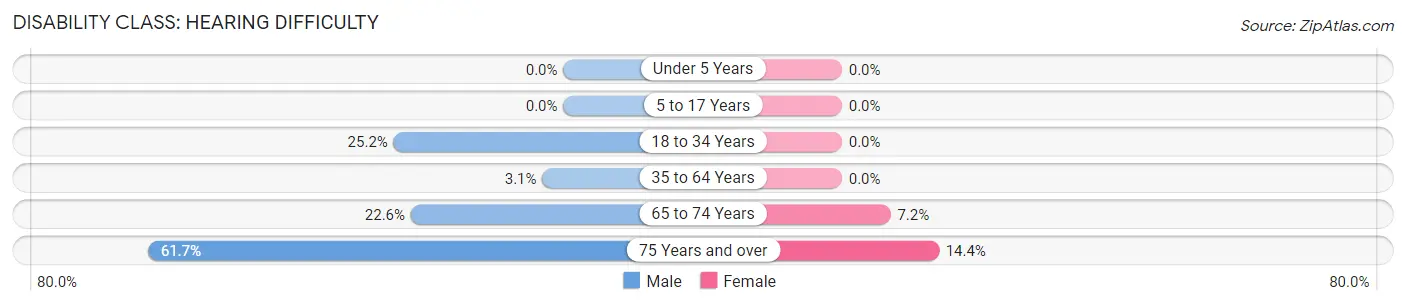
| Age Bracket | Male | Female |
| Under 5 Years | 0 (0.0%) | 0 (0.0%) |
| 5 to 17 Years | 0 (0.0%) | 0 (0.0%) |
| 18 to 34 Years | 64 (25.2%) | 0 (0.0%) |
| 35 to 64 Years | 12 (3.1%) | 0 (0.0%) |
| 65 to 74 Years | 24 (22.6%) | 12 (7.2%) |
| 75 Years and over | 29 (61.7%) | 20 (14.4%) |
Disability Class: Vision Difficulty
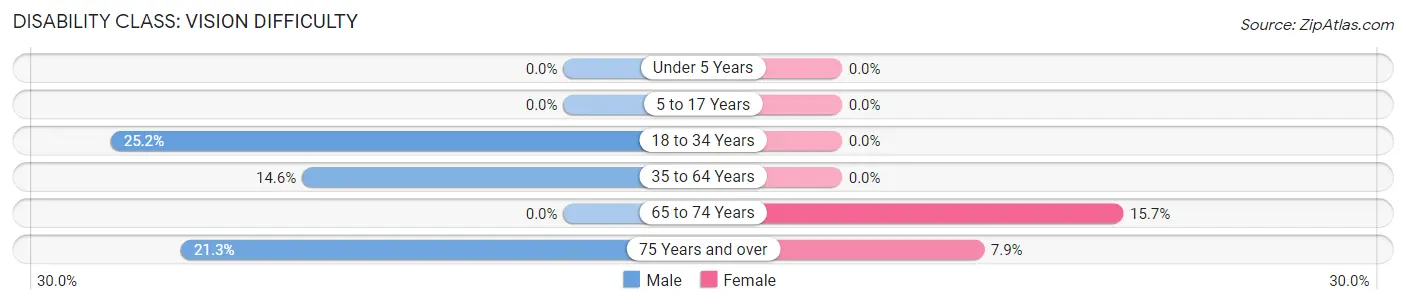
| Age Bracket | Male | Female |
| Under 5 Years | 0 (0.0%) | 0 (0.0%) |
| 5 to 17 Years | 0 (0.0%) | 0 (0.0%) |
| 18 to 34 Years | 64 (25.2%) | 0 (0.0%) |
| 35 to 64 Years | 56 (14.5%) | 0 (0.0%) |
| 65 to 74 Years | 0 (0.0%) | 26 (15.7%) |
| 75 Years and over | 10 (21.3%) | 11 (7.9%) |
Disability Class: Cognitive Difficulty
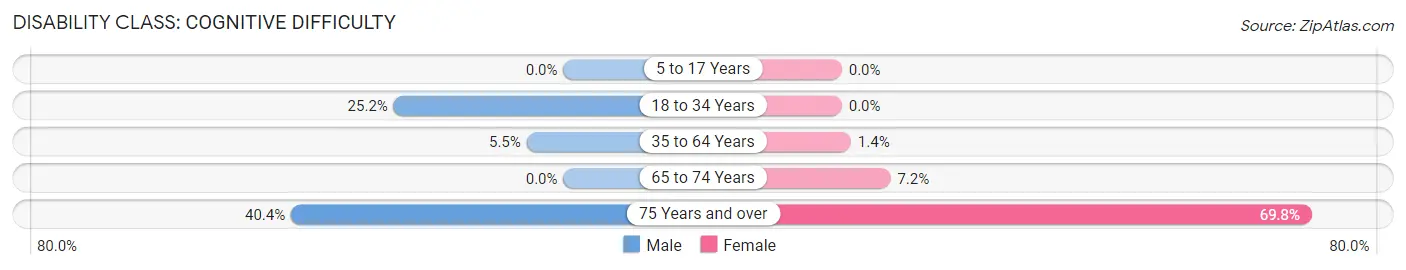
| Age Bracket | Male | Female |
| 5 to 17 Years | 0 (0.0%) | 0 (0.0%) |
| 18 to 34 Years | 64 (25.2%) | 0 (0.0%) |
| 35 to 64 Years | 21 (5.4%) | 5 (1.3%) |
| 65 to 74 Years | 0 (0.0%) | 12 (7.2%) |
| 75 Years and over | 19 (40.4%) | 97 (69.8%) |
Disability Class: Ambulatory Difficulty
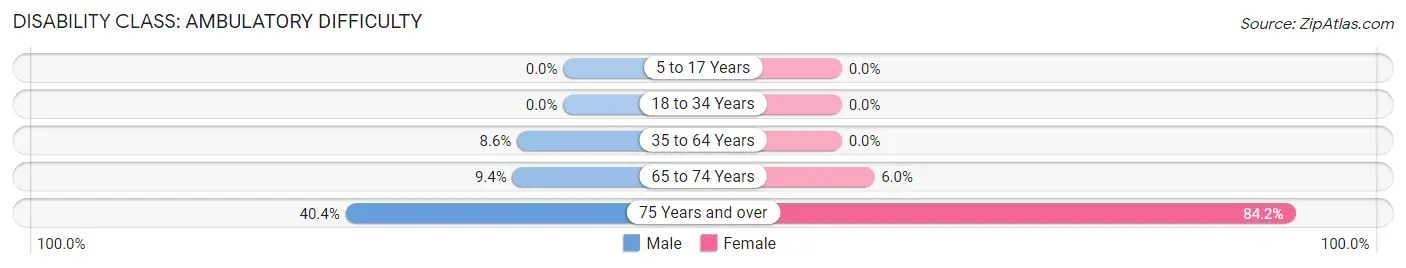
| Age Bracket | Male | Female |
| 5 to 17 Years | 0 (0.0%) | 0 (0.0%) |
| 18 to 34 Years | 0 (0.0%) | 0 (0.0%) |
| 35 to 64 Years | 33 (8.6%) | 0 (0.0%) |
| 65 to 74 Years | 10 (9.4%) | 10 (6.0%) |
| 75 Years and over | 19 (40.4%) | 117 (84.2%) |
Disability Class: Self-Care Difficulty
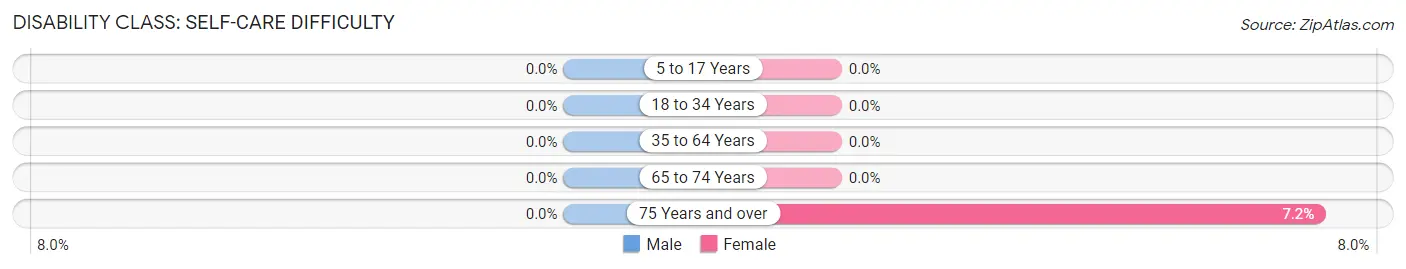
| Age Bracket | Male | Female |
| 5 to 17 Years | 0 (0.0%) | 0 (0.0%) |
| 18 to 34 Years | 0 (0.0%) | 0 (0.0%) |
| 35 to 64 Years | 0 (0.0%) | 0 (0.0%) |
| 65 to 74 Years | 0 (0.0%) | 0 (0.0%) |
| 75 Years and over | 0 (0.0%) | 10 (7.2%) |
Technology Access in Kapaau
Computing Device Access in Kapaau
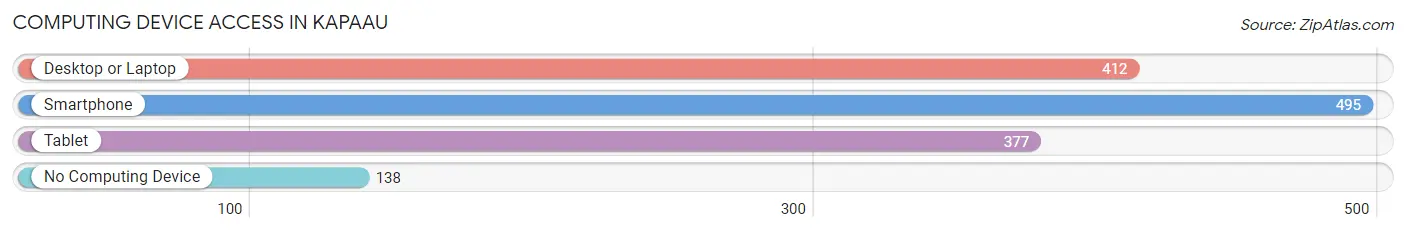
| Device Type | # Households | % Households |
| Desktop or Laptop | 412 | 61.9% |
| Smartphone | 495 | 74.3% |
| Tablet | 377 | 56.6% |
| No Computing Device | 138 | 20.7% |
| Total | 666 | 100.0% |
Internet Access in Kapaau
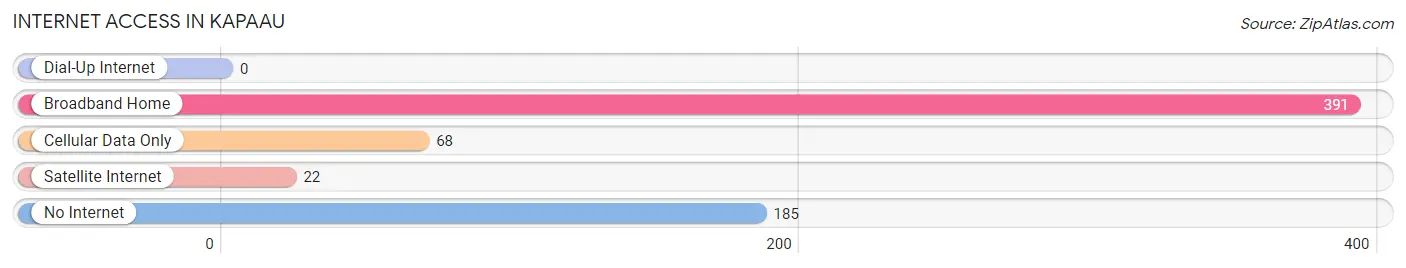
| Internet Type | # Households | % Households |
| Dial-Up Internet | 0 | 0.0% |
| Broadband Home | 391 | 58.7% |
| Cellular Data Only | 68 | 10.2% |
| Satellite Internet | 22 | 3.3% |
| No Internet | 185 | 27.8% |
| Total | 666 | 100.0% |
Kapaau Summary
Kapaau is a small town located on the northern coast of the Big Island of Hawaii. It is situated in the North Kohala district, and is the birthplace of King Kamehameha I, the first ruler of the unified Hawaiian Islands. The town is home to a population of just over 1,000 people, and is known for its rich cultural heritage and stunning natural beauty.
Geography
Kapaau is located on the northern coast of the Big Island of Hawaii, in the North Kohala district. It is situated at an elevation of about 1,000 feet, and is surrounded by lush tropical rainforest. The town is located on the slopes of the Kohala Mountains, and is bordered by the Pacific Ocean to the north and east. The climate in Kapaau is tropical, with temperatures ranging from the mid-70s to the mid-80s Fahrenheit throughout the year.
Economy
Kapaau’s economy is largely based on tourism and agriculture. The town is home to several small businesses, including restaurants, shops, and galleries. Agriculture is also an important part of the local economy, with coffee, macadamia nuts, and tropical fruits being the main crops. The town is also home to several small farms, which produce a variety of vegetables and fruits.
Demographics
As of the 2010 census, the population of Kapaau was 1,039. The racial makeup of the town was 57.3% White, 0.3% African American, 0.2% Native American, 0.2% Asian, 0.1% Pacific Islander, and 41.1% from other races. The median household income in Kapaau was $45,000, and the median age was 44.
History
Kapaau was founded in 1820 by King Kamehameha I, the first ruler of the unified Hawaiian Islands. The town was originally known as “Kapaau-a-Kamehameha”, and was the birthplace of the king. The town was an important center of commerce and culture in the early days of the Hawaiian Kingdom, and was home to several important religious and political sites.
Kapaau was also the site of the Battle of Kuamo’o in 1819, which was a major turning point in the unification of the Hawaiian Islands. The battle was fought between the forces of King Kamehameha I and the forces of the rival chief Kalanikupule. The battle ended in a decisive victory for Kamehameha, and marked the beginning of the unified Hawaiian Kingdom.
Today, Kapaau is a small town with a rich cultural heritage and stunning natural beauty. The town is home to a population of just over 1,000 people, and is known for its vibrant art and music scene. The town is also home to several important historical sites, including the birthplace of King Kamehameha I and the site of the Battle of Kuamo’o.
Common Questions
What is Per Capita Income in Kapaau?
Per Capita income in Kapaau is $29,172.
What is the Median Family Income in Kapaau?
Median Family Income in Kapaau is $83,021.
What is the Median Household income in Kapaau?
Median Household Income in Kapaau is $65,076.
What is Income or Wage Gap in Kapaau?
Income or Wage Gap in Kapaau is 13.2%.
Women in Kapaau earn 86.8 cents for every dollar earned by a man.
What is Inequality or Gini Index in Kapaau?
Inequality or Gini Index in Kapaau is 0.39.
What is the Total Population of Kapaau?
Total Population of Kapaau is 1,972.
What is the Total Male Population of Kapaau?
Total Male Population of Kapaau is 885.
What is the Total Female Population of Kapaau?
Total Female Population of Kapaau is 1,087.
What is the Ratio of Males per 100 Females in Kapaau?
There are 81.42 Males per 100 Females in Kapaau.
What is the Ratio of Females per 100 Males in Kapaau?
There are 122.82 Females per 100 Males in Kapaau.
What is the Median Population Age in Kapaau?
Median Population Age in Kapaau is 45.8 Years.
What is the Average Family Size in Kapaau
Average Family Size in Kapaau is 3.8 People.
What is the Average Household Size in Kapaau
Average Household Size in Kapaau is 2.9 People.
How Large is the Labor Force in Kapaau?
There are 1,100 People in the Labor Forcein in Kapaau.
What is the Percentage of People in the Labor Force in Kapaau?
63.5% of People are in the Labor Force in Kapaau.
What is the Unemployment Rate in Kapaau?
Unemployment Rate in Kapaau is 5.4%.