Wainiha, HI Map & Demographics
Wainiha Map
Wainiha Overview
$26,820
PER CAPITA INCOME
$146,000
AVG FAMILY INCOME
68.2%
WAGE / INCOME GAP [ % ]
31.8¢/ $1
WAGE / INCOME GAP [ $ ]
0.30
INEQUALITY / GINI INDEX
130
TOTAL POPULATION
59
MALE POPULATION
71
FEMALE POPULATION
83.10
MALES / 100 FEMALES
120.34
FEMALES / 100 MALES
43.0
MEDIAN AGE
6.6
AVG FAMILY SIZE
5.4
AVG HOUSEHOLD SIZE
61
LABOR FORCE [ PEOPLE ]
64.2%
PERCENT IN LABOR FORCE
9.8%
UNEMPLOYMENT RATE
Income in Wainiha
Income Overview in Wainiha
| Characteristic | Number | Measure |
| Per Capita Income | 130 | $26,820 |
| Median Family Income | 18 | $146,000 |
| Mean Family Income | 18 | $143,522 |
| Median Household Income | 24 | $0 |
| Mean Household Income | 24 | $117,817 |
| Income Deficit | 18 | $0 |
| Wage / Income Gap (%) | 130 | 68.23% |
| Wage / Income Gap ($) | 130 | 31.77¢ per $1 |
| Gini / Inequality Index | 130 | 0.30 |
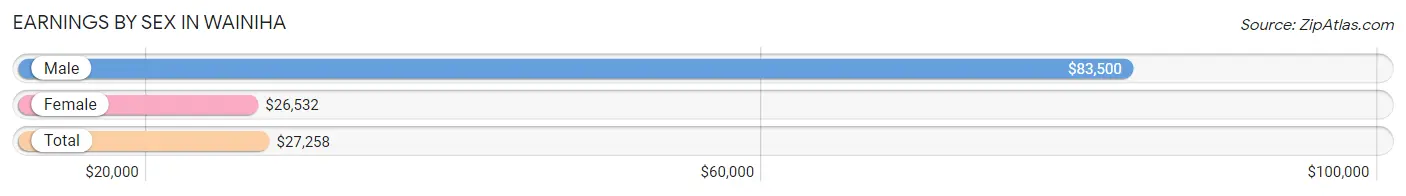
Earnings by Sex in Wainiha
Average Earnings in Wainiha are $27,258, $83,500 for men and $26,532 for women, a difference of 68.2%.
| Sex | Number | Average Earnings |
| Male | 18 (27.3%) | $83,500 |
| Female | 48 (72.7%) | $26,532 |
| Total | 66 (100.0%) | $27,258 |
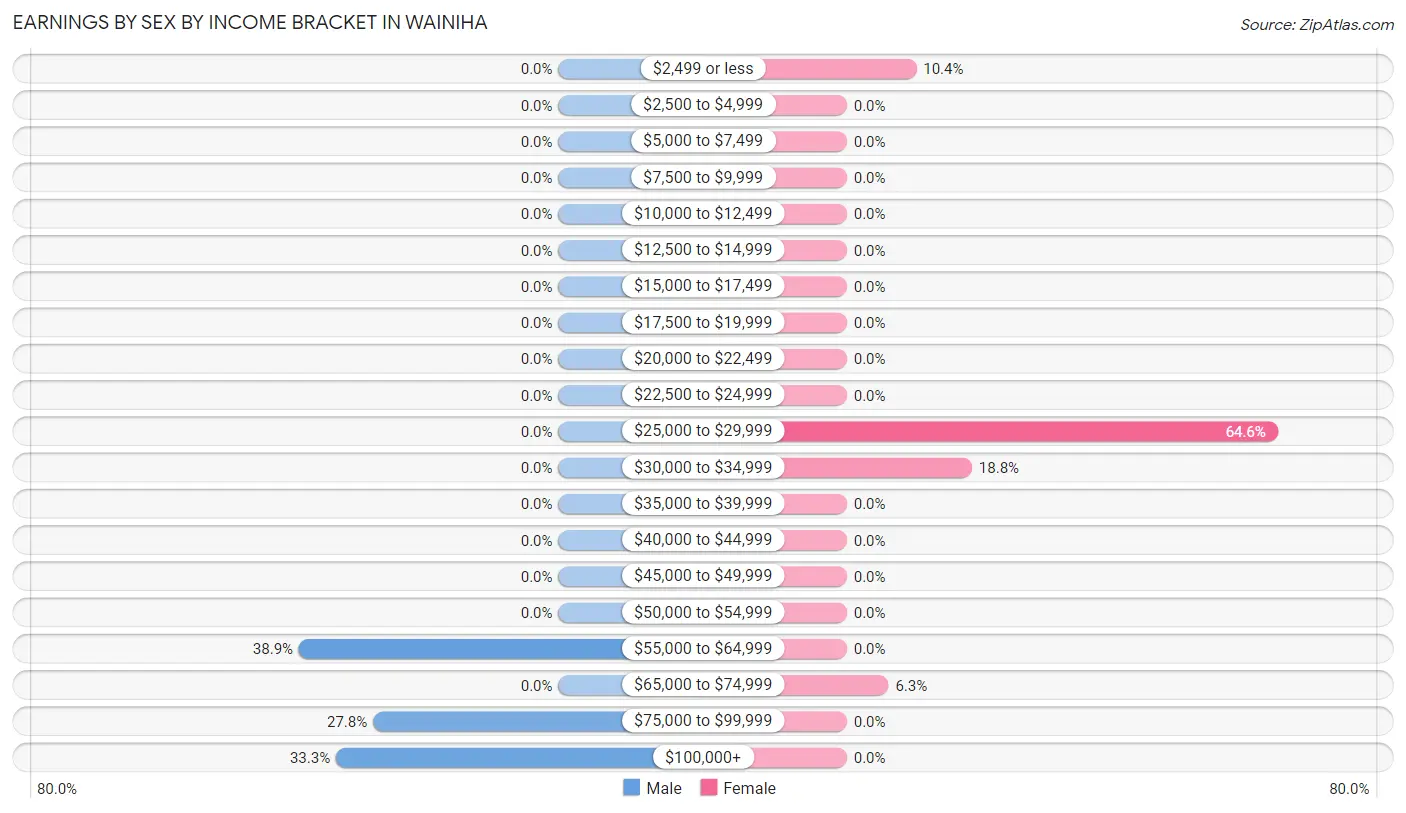
Earnings by Sex by Income Bracket in Wainiha
The most common earnings brackets in Wainiha are $55,000 to $64,999 for men (7 | 38.9%) and $25,000 to $29,999 for women (31 | 64.6%).
| Income | Male | Female |
| $2,499 or less | 0 (0.0%) | 5 (10.4%) |
| $2,500 to $4,999 | 0 (0.0%) | 0 (0.0%) |
| $5,000 to $7,499 | 0 (0.0%) | 0 (0.0%) |
| $7,500 to $9,999 | 0 (0.0%) | 0 (0.0%) |
| $10,000 to $12,499 | 0 (0.0%) | 0 (0.0%) |
| $12,500 to $14,999 | 0 (0.0%) | 0 (0.0%) |
| $15,000 to $17,499 | 0 (0.0%) | 0 (0.0%) |
| $17,500 to $19,999 | 0 (0.0%) | 0 (0.0%) |
| $20,000 to $22,499 | 0 (0.0%) | 0 (0.0%) |
| $22,500 to $24,999 | 0 (0.0%) | 0 (0.0%) |
| $25,000 to $29,999 | 0 (0.0%) | 31 (64.6%) |
| $30,000 to $34,999 | 0 (0.0%) | 9 (18.8%) |
| $35,000 to $39,999 | 0 (0.0%) | 0 (0.0%) |
| $40,000 to $44,999 | 0 (0.0%) | 0 (0.0%) |
| $45,000 to $49,999 | 0 (0.0%) | 0 (0.0%) |
| $50,000 to $54,999 | 0 (0.0%) | 0 (0.0%) |
| $55,000 to $64,999 | 7 (38.9%) | 0 (0.0%) |
| $65,000 to $74,999 | 0 (0.0%) | 3 (6.2%) |
| $75,000 to $99,999 | 5 (27.8%) | 0 (0.0%) |
| $100,000+ | 6 (33.3%) | 0 (0.0%) |
| Total | 18 (100.0%) | 48 (100.0%) |
Earnings by Sex by Educational Attainment in Wainiha
| Educational Attainment | Male Income | Female Income |
| Less than High School | - | - |
| High School Diploma | - | - |
| College or Associate's Degree | - | - |
| Bachelor's Degree | - | - |
| Graduate Degree | - | - |
| Total | $83,500 | $26,532 |
Family Income in Wainiha
Family Income Brackets in Wainiha
According to the Wainiha family income data, there are 7 families falling into the $75,000 to $99,999 income range, which is the most common income bracket and makes up 38.9% of all families.
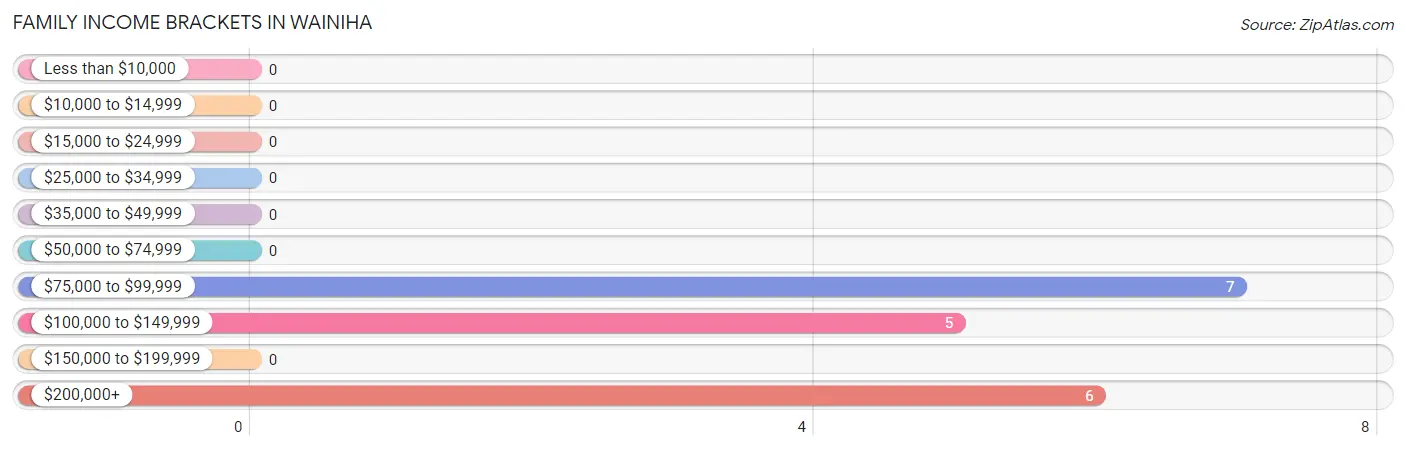
| Income Bracket | # Families | % Families |
| Less than $10,000 | 0 | 0.0% |
| $10,000 to $14,999 | 0 | 0.0% |
| $15,000 to $24,999 | 0 | 0.0% |
| $25,000 to $34,999 | 0 | 0.0% |
| $35,000 to $49,999 | 0 | 0.0% |
| $50,000 to $74,999 | 0 | 0.0% |
| $75,000 to $99,999 | 7 | 38.9% |
| $100,000 to $149,999 | 5 | 27.8% |
| $150,000 to $199,999 | 0 | 0.0% |
| $200,000+ | 6 | 33.3% |
Family Income by Famaliy Size in Wainiha
| Income Bracket | # Families | Median Income |
| 2-Person Families | 7 (38.9%) | $0 |
| 3-Person Families | 6 (33.3%) | $0 |
| 4-Person Families | 0 (0.0%) | $0 |
| 5-Person Families | 0 (0.0%) | $0 |
| 6-Person Families | 0 (0.0%) | $0 |
| 7+ Person Families | 5 (27.8%) | $0 |
| Total | 18 (100.0%) | $146,000 |
Family Income by Number of Earners in Wainiha
| Number of Earners | # Families | Median Income |
| No Earners | 0 (0.0%) | $0 |
| 1 Earner | 7 (38.9%) | $0 |
| 2 Earners | 6 (33.3%) | $0 |
| 3+ Earners | 5 (27.8%) | $0 |
| Total | 18 (100.0%) | $146,000 |
Household Income in Wainiha
Household Income Brackets in Wainiha
With 7 households falling in the category, the $75,000 to $99,999 income range is the most frequent in Wainiha, accounting for 29.2% of all households.
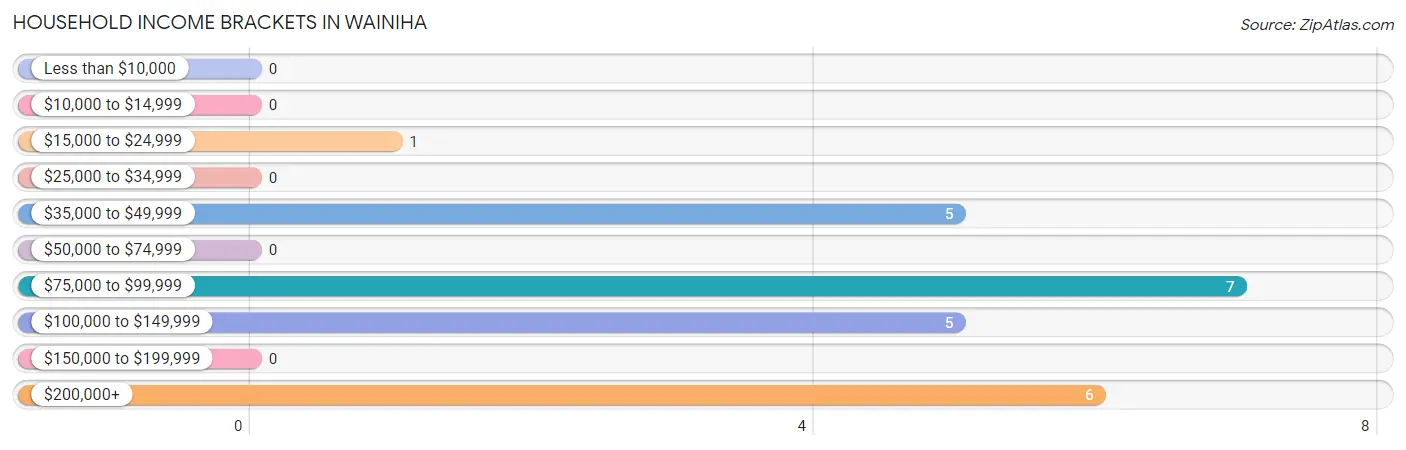
| Income Bracket | # Households | % Households |
| Less than $10,000 | 0 | 0.0% |
| $10,000 to $14,999 | 0 | 0.0% |
| $15,000 to $24,999 | 1 | 4.2% |
| $25,000 to $34,999 | 0 | 0.0% |
| $35,000 to $49,999 | 5 | 20.8% |
| $50,000 to $74,999 | 0 | 0.0% |
| $75,000 to $99,999 | 7 | 29.2% |
| $100,000 to $149,999 | 5 | 20.8% |
| $150,000 to $199,999 | 0 | 0.0% |
| $200,000+ | 6 | 25.0% |
Household Income by Householder Age in Wainiha
| Income Bracket | # Households | Median Income |
| 15 to 24 Years | 0 (0.0%) | $0 |
| 25 to 44 Years | 5 (20.8%) | $0 |
| 45 to 64 Years | 13 (54.2%) | $0 |
| 65+ Years | 6 (25.0%) | $0 |
| Total | 24 (100.0%) | $0 |
Poverty in Wainiha
Income Below Poverty by Sex and Age in Wainiha
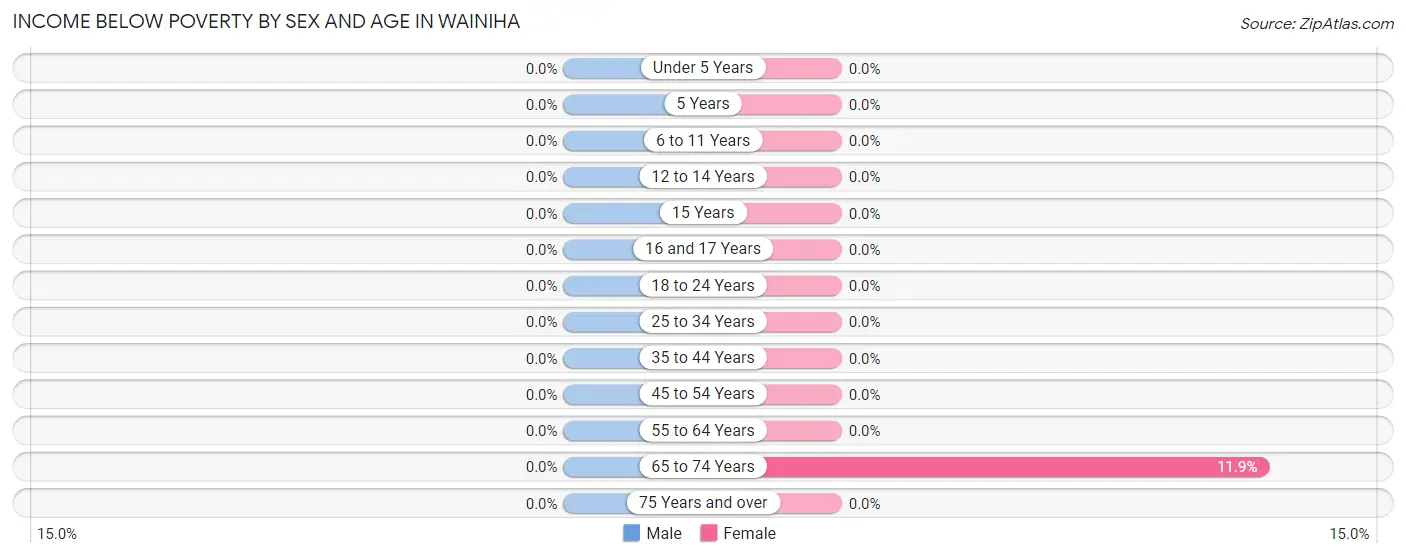
| Age Bracket | Male | Female |
| Under 5 Years | 0 (0.0%) | 0 (0.0%) |
| 5 Years | 0 (0.0%) | 0 (0.0%) |
| 6 to 11 Years | 0 (0.0%) | 0 (0.0%) |
| 12 to 14 Years | 0 (0.0%) | 0 (0.0%) |
| 15 Years | 0 (0.0%) | 0 (0.0%) |
| 16 and 17 Years | 0 (0.0%) | 0 (0.0%) |
| 18 to 24 Years | 0 (0.0%) | 0 (0.0%) |
| 25 to 34 Years | 0 (0.0%) | 0 (0.0%) |
| 35 to 44 Years | 0 (0.0%) | 0 (0.0%) |
| 45 to 54 Years | 0 (0.0%) | 0 (0.0%) |
| 55 to 64 Years | 0 (0.0%) | 0 (0.0%) |
| 65 to 74 Years | 0 (0.0%) | 5 (11.9%) |
| 75 Years and over | 0 (0.0%) | 0 (0.0%) |
| Total | 0 (0.0%) | 5 (7.0%) |
Income Above Poverty by Sex and Age in Wainiha
According to the poverty statistics in Wainiha, males aged 5 years and females aged 16 and 17 years are the age groups that are most secure financially, with 100.0% of males and 100.0% of females in these age groups living above the poverty line.
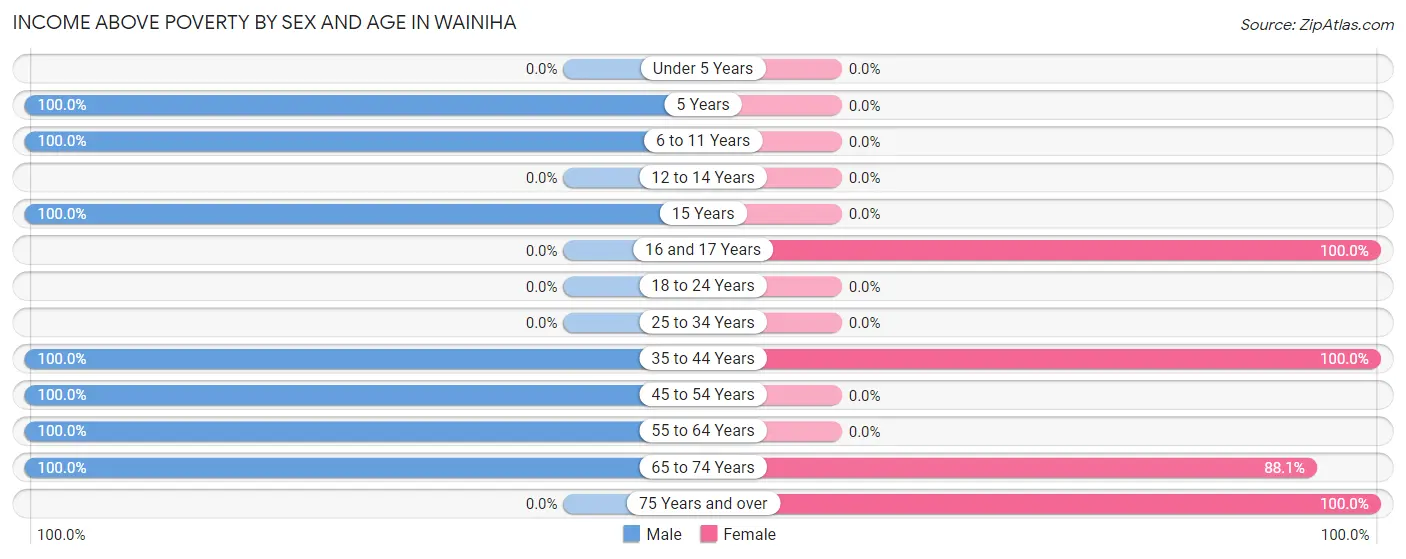
| Age Bracket | Male | Female |
| Under 5 Years | 0 (0.0%) | 0 (0.0%) |
| 5 Years | 10 (100.0%) | 0 (0.0%) |
| 6 to 11 Years | 22 (100.0%) | 0 (0.0%) |
| 12 to 14 Years | 0 (0.0%) | 0 (0.0%) |
| 15 Years | 3 (100.0%) | 0 (0.0%) |
| 16 and 17 Years | 0 (0.0%) | 16 (100.0%) |
| 18 to 24 Years | 0 (0.0%) | 0 (0.0%) |
| 25 to 34 Years | 0 (0.0%) | 0 (0.0%) |
| 35 to 44 Years | 5 (100.0%) | 12 (100.0%) |
| 45 to 54 Years | 6 (100.0%) | 0 (0.0%) |
| 55 to 64 Years | 7 (100.0%) | 0 (0.0%) |
| 65 to 74 Years | 6 (100.0%) | 37 (88.1%) |
| 75 Years and over | 0 (0.0%) | 1 (100.0%) |
| Total | 59 (100.0%) | 66 (93.0%) |
Income Below Poverty Among Married-Couple Families in Wainiha
| Children | Above Poverty | Below Poverty |
| No Children | 7 (100.0%) | 0 (0.0%) |
| 1 or 2 Children | 6 (100.0%) | 0 (0.0%) |
| 3 or 4 Children | 0 (0.0%) | 0 (0.0%) |
| 5 or more Children | 5 (100.0%) | 0 (0.0%) |
| Total | 18 (100.0%) | 0 (0.0%) |
Income Below Poverty Among Single-Parent Households in Wainiha
| Children | Single Father | Single Mother |
| No Children | 0 (0.0%) | 0 (0.0%) |
| 1 or 2 Children | 0 (0.0%) | 0 (0.0%) |
| 3 or 4 Children | 0 (0.0%) | 0 (0.0%) |
| 5 or more Children | 0 (0.0%) | 0 (0.0%) |
| Total | 0 (0.0%) | 0 (0.0%) |
Income Below Poverty Among Married-Couple vs Single-Parent Households in Wainiha
| Children | Married-Couple Families | Single-Parent Households |
| No Children | 0 (0.0%) | 0 (0.0%) |
| 1 or 2 Children | 0 (0.0%) | 0 (0.0%) |
| 3 or 4 Children | 0 (0.0%) | 0 (0.0%) |
| 5 or more Children | 0 (0.0%) | 0 (0.0%) |
| Total | 0 (0.0%) | 0 (0.0%) |
Race in Wainiha
The most populous races in Wainiha are Hawaiian / Pacific (63 | 48.5%), White / Caucasian (36 | 27.7%), and Asian (16 | 12.3%).
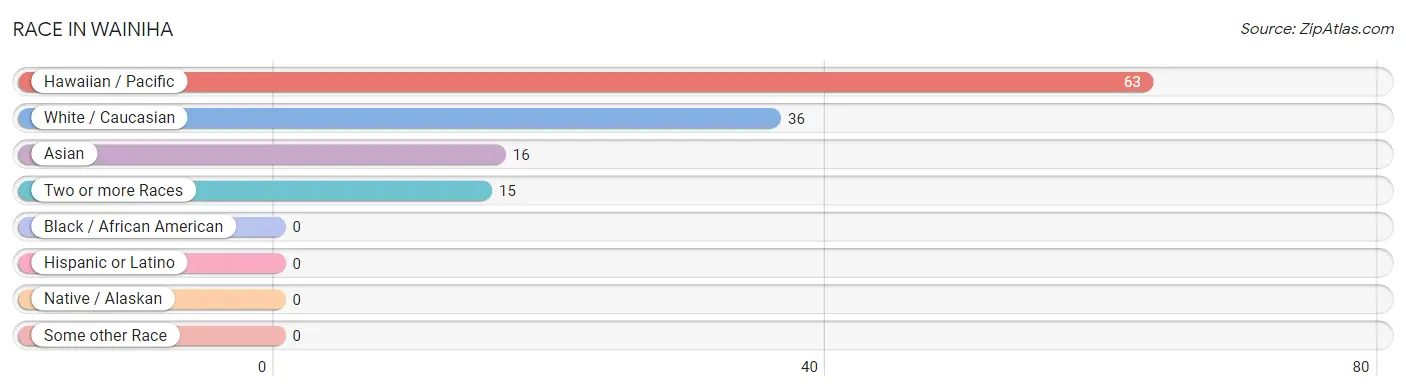
| Race | # Population | % Population |
| Asian | 16 | 12.3% |
| Black / African American | 0 | 0.0% |
| Hawaiian / Pacific | 63 | 48.5% |
| Hispanic or Latino | 0 | 0.0% |
| Native / Alaskan | 0 | 0.0% |
| White / Caucasian | 36 | 27.7% |
| Two or more Races | 15 | 11.5% |
| Some other Race | 0 | 0.0% |
| Total | 130 | 100.0% |
Ancestry in Wainiha
The most populous ancestries reported in Wainiha are Native Hawaiian (77 | 59.2%), Bhutanese (30 | 23.1%), Italian (19 | 14.6%), Northern European (12 | 9.2%), and European (11 | 8.5%), together accounting for 114.6% of all Wainiha residents.
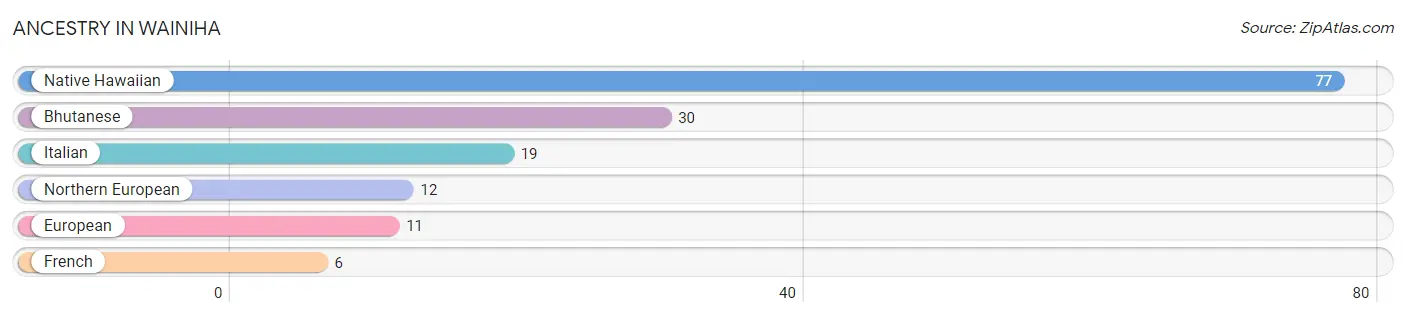
| Ancestry | # Population | % Population |
| Bhutanese | 30 | 23.1% |
| European | 11 | 8.5% |
| French | 6 | 4.6% |
| Italian | 19 | 14.6% |
| Native Hawaiian | 77 | 59.2% |
| Northern European | 12 | 9.2% | View All 6 Rows |
Immigrants in Wainiha
The most numerous immigrant groups reported in Wainiha came from , and Canada (1 | 0.8%), together accounting for 0.8% of all Wainiha residents.

| Immigration Origin | # Population | % Population |
| Canada | 1 | 0.8% | View All 1 Rows |
Sex and Age in Wainiha
Sex and Age in Wainiha
The most populous age groups in Wainiha are 10 to 14 Years (18 | 30.5%) for men and 65 to 69 Years (42 | 59.2%) for women.
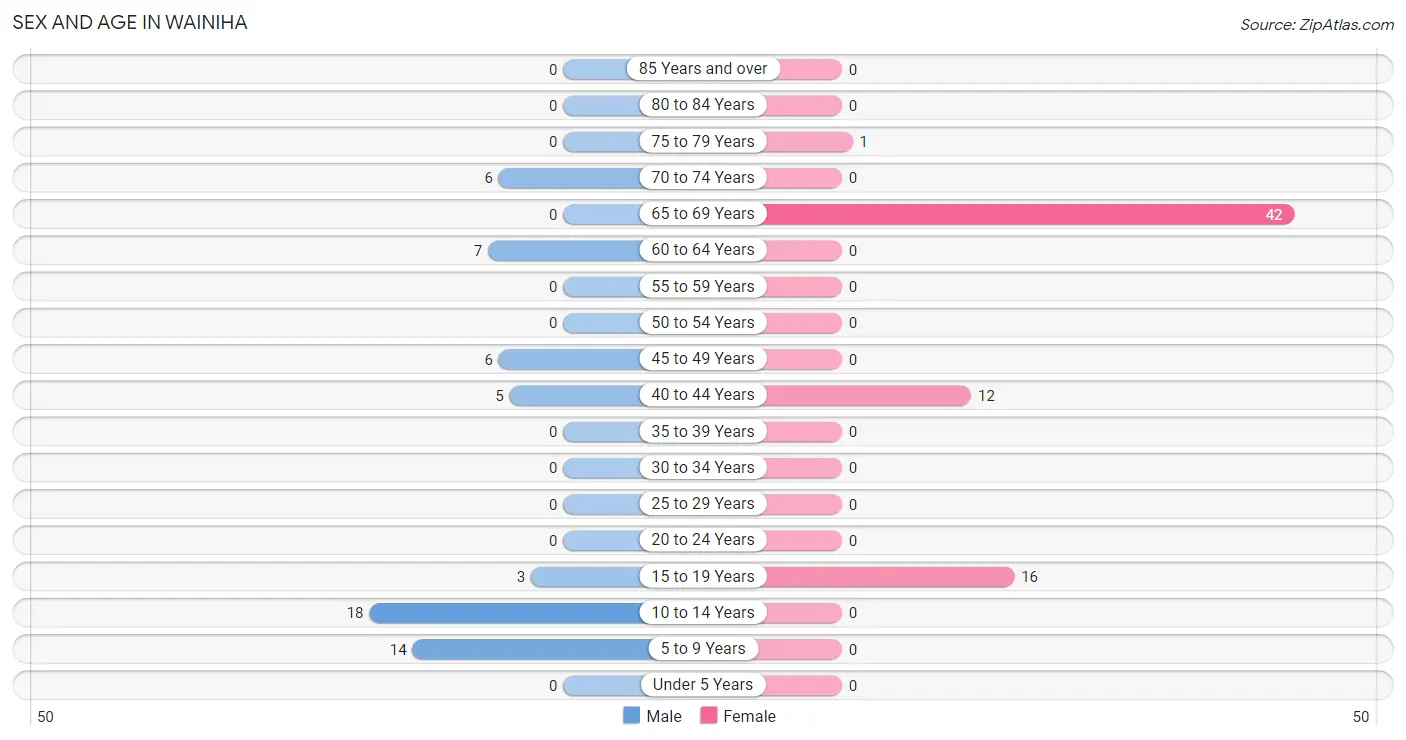
| Age Bracket | Male | Female |
| Under 5 Years | 0 (0.0%) | 0 (0.0%) |
| 5 to 9 Years | 14 (23.7%) | 0 (0.0%) |
| 10 to 14 Years | 18 (30.5%) | 0 (0.0%) |
| 15 to 19 Years | 3 (5.1%) | 16 (22.5%) |
| 20 to 24 Years | 0 (0.0%) | 0 (0.0%) |
| 25 to 29 Years | 0 (0.0%) | 0 (0.0%) |
| 30 to 34 Years | 0 (0.0%) | 0 (0.0%) |
| 35 to 39 Years | 0 (0.0%) | 0 (0.0%) |
| 40 to 44 Years | 5 (8.5%) | 12 (16.9%) |
| 45 to 49 Years | 6 (10.2%) | 0 (0.0%) |
| 50 to 54 Years | 0 (0.0%) | 0 (0.0%) |
| 55 to 59 Years | 0 (0.0%) | 0 (0.0%) |
| 60 to 64 Years | 7 (11.9%) | 0 (0.0%) |
| 65 to 69 Years | 0 (0.0%) | 42 (59.2%) |
| 70 to 74 Years | 6 (10.2%) | 0 (0.0%) |
| 75 to 79 Years | 0 (0.0%) | 1 (1.4%) |
| 80 to 84 Years | 0 (0.0%) | 0 (0.0%) |
| 85 Years and over | 0 (0.0%) | 0 (0.0%) |
| Total | 59 (100.0%) | 71 (100.0%) |
Families and Households in Wainiha
Median Family Size in Wainiha
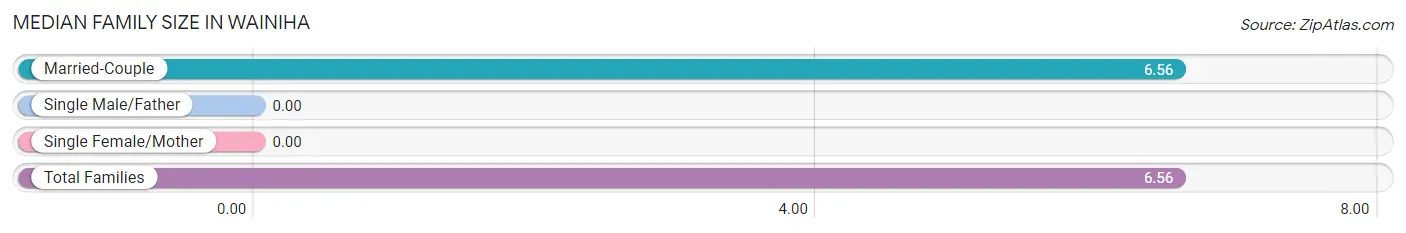
| Family Type | # Families | Family Size |
| Married-Couple | 18 (100.0%) | 6.56 |
| Single Male/Father | 0 (0.0%) | - |
| Single Female/Mother | 0 (0.0%) | - |
| Total Families | 18 (100.0%) | 6.56 |
Median Household Size in Wainiha
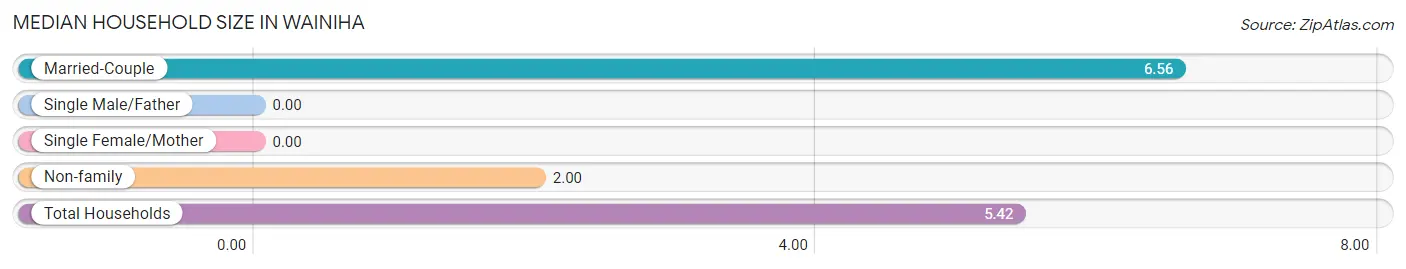
| Household Type | # Households | Household Size |
| Married-Couple | 18 (75.0%) | 6.56 |
| Single Male/Father | 0 (0.0%) | - |
| Single Female/Mother | 0 (0.0%) | - |
| Non-family | 6 (25.0%) | 2.00 |
| Total Households | 24 (100.0%) | 5.42 |
Household Size by Marriage Status in Wainiha
Out of a total of 24 households in Wainiha, 18 (75.0%) are family households, while 6 (25.0%) are nonfamily households. The most numerous type of family households are 2-person households, comprising 7, and the most common type of nonfamily households are 2-person households, comprising 5.
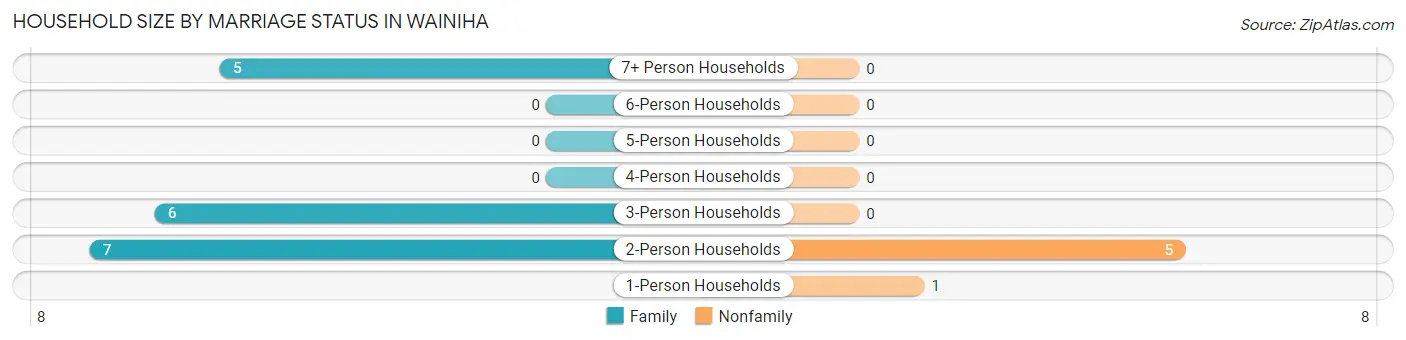
| Household Size | Family Households | Nonfamily Households |
| 1-Person Households | - | 1 (4.2%) |
| 2-Person Households | 7 (29.2%) | 5 (20.8%) |
| 3-Person Households | 6 (25.0%) | 0 (0.0%) |
| 4-Person Households | 0 (0.0%) | 0 (0.0%) |
| 5-Person Households | 0 (0.0%) | 0 (0.0%) |
| 6-Person Households | 0 (0.0%) | 0 (0.0%) |
| 7+ Person Households | 5 (20.8%) | 0 (0.0%) |
| Total | 18 (75.0%) | 6 (25.0%) |
Female Fertility in Wainiha
Fertility by Age in Wainiha
| Age Bracket | Women with Births | Births / 1,000 Women |
| 15 to 19 years | 0 (0.0%) | 0.0 |
| 20 to 34 years | 0 (0.0%) | 0.0 |
| 35 to 50 years | 0 (0.0%) | 0.0 |
| Total | 0 (0.0%) | 0.0 |
Fertility by Age by Marriage Status in Wainiha
| Age Bracket | Married | Unmarried |
| 15 to 19 years | 0 (0.0%) | 0 (0.0%) |
| 20 to 34 years | 0 (0.0%) | 0 (0.0%) |
| 35 to 50 years | 0 (0.0%) | 0 (0.0%) |
| Total | 0 (0.0%) | 0 (0.0%) |
Fertility by Education in Wainiha
| Educational Attainment | Women with Births | Births / 1,000 Women |
| Less than High School | 0 (0.0%) | 0.0 |
| High School Diploma | 0 (0.0%) | 0.0 |
| College or Associate's Degree | 0 (0.0%) | 0.0 |
| Bachelor's Degree | 0 (0.0%) | 0.0 |
| Graduate Degree | 0 (0.0%) | 0.0 |
| Total | 0 (0.0%) | 0.0 |
Fertility by Education by Marriage Status in Wainiha
| Educational Attainment | Married | Unmarried |
| Less than High School | 0 (0.0%) | 0 (0.0%) |
| High School Diploma | 0 (0.0%) | 0 (0.0%) |
| College or Associate's Degree | 0 (0.0%) | 0 (0.0%) |
| Bachelor's Degree | 0 (0.0%) | 0 (0.0%) |
| Graduate Degree | 0 (0.0%) | 0 (0.0%) |
| Total | 0 (0.0%) | 0 (0.0%) |
Employment Characteristics in Wainiha
Employment by Class of Employer in Wainiha
Among the 55 employed individuals in Wainiha, not-for-profit organizations (31 | 56.4%), private company employees (19 | 34.5%), and federal government employees (5 | 9.1%) make up the most common classes of employment.
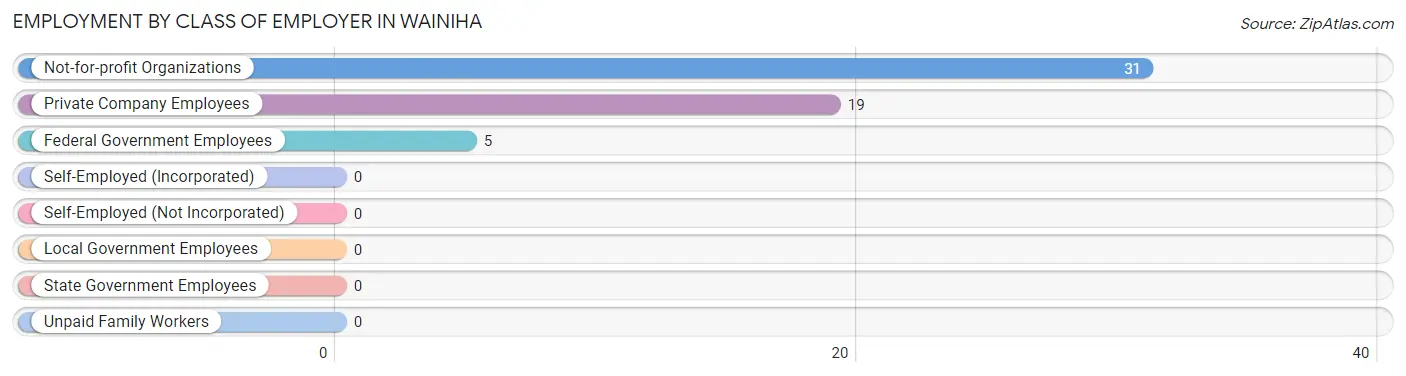
| Employer Class | # Employees | % Employees |
| Private Company Employees | 19 | 34.5% |
| Self-Employed (Incorporated) | 0 | 0.0% |
| Self-Employed (Not Incorporated) | 0 | 0.0% |
| Not-for-profit Organizations | 31 | 56.4% |
| Local Government Employees | 0 | 0.0% |
| State Government Employees | 0 | 0.0% |
| Federal Government Employees | 5 | 9.1% |
| Unpaid Family Workers | 0 | 0.0% |
| Total | 55 | 100.0% |
Employment Status by Age in Wainiha
According to the labor force statistics for Wainiha, out of the total population over 16 years of age (95), 64.2% or 61 individuals are in the labor force, with 9.8% or 6 of them unemployed. The age group with the highest labor force participation rate is 35 to 44 years, with 100.0% or 17 individuals in the labor force. Within the labor force, the 45 to 54 years age range has the highest percentage of unemployed individuals, with 100.0% or 6 of them being unemployed.
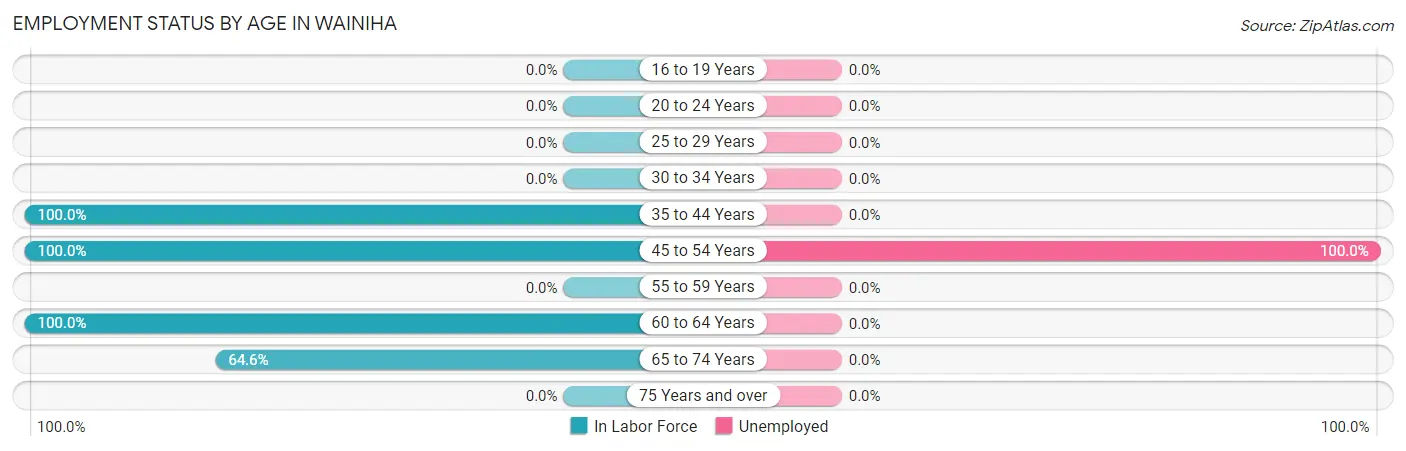
| Age Bracket | In Labor Force | Unemployed |
| 16 to 19 Years | 0 (0.0%) | 0 (0.0%) |
| 20 to 24 Years | 0 (0.0%) | 0 (0.0%) |
| 25 to 29 Years | 0 (0.0%) | 0 (0.0%) |
| 30 to 34 Years | 0 (0.0%) | 0 (0.0%) |
| 35 to 44 Years | 17 (100.0%) | 0 (0.0%) |
| 45 to 54 Years | 6 (100.0%) | 6 (100.0%) |
| 55 to 59 Years | 0 (0.0%) | 0 (0.0%) |
| 60 to 64 Years | 7 (100.0%) | 0 (0.0%) |
| 65 to 74 Years | 31 (64.6%) | 0 (0.0%) |
| 75 Years and over | 0 (0.0%) | 0 (0.0%) |
| Total | 61 (64.2%) | 6 (9.8%) |
Employment Status by Educational Attainment in Wainiha
According to labor force statistics for Wainiha, 100.0% of individuals (30) out of the total population between 25 and 64 years of age (30) are in the labor force, with 20.0% or 6 of them being unemployed. The group with the highest labor force participation rate are those with the educational attainment of high school diploma, with 100.0% or 3 individuals in the labor force. Within the labor force, individuals with bachelor's degree or higher education have the highest percentage of unemployment, with 27.3% or 6 of them being unemployed.
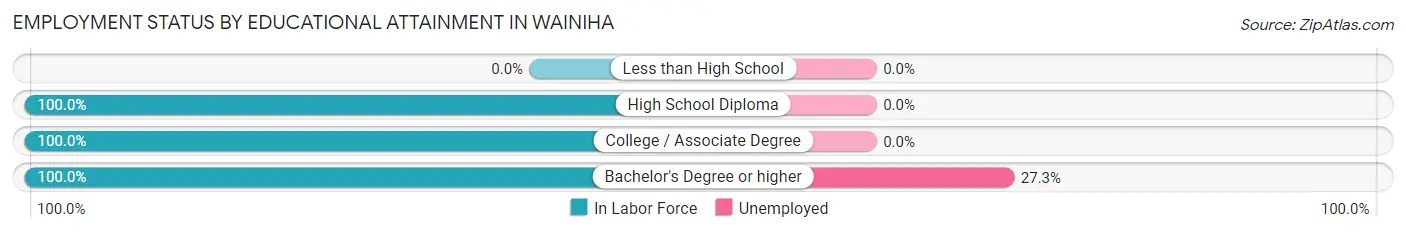
| Educational Attainment | In Labor Force | Unemployed |
| Less than High School | 0 (0.0%) | 0 (0.0%) |
| High School Diploma | 3 (100.0%) | 0 (0.0%) |
| College / Associate Degree | 5 (100.0%) | 0 (0.0%) |
| Bachelor's Degree or higher | 22 (100.0%) | 6 (27.3%) |
| Total | 30 (100.0%) | 6 (20.0%) |
Employment Occupations by Sex in Wainiha
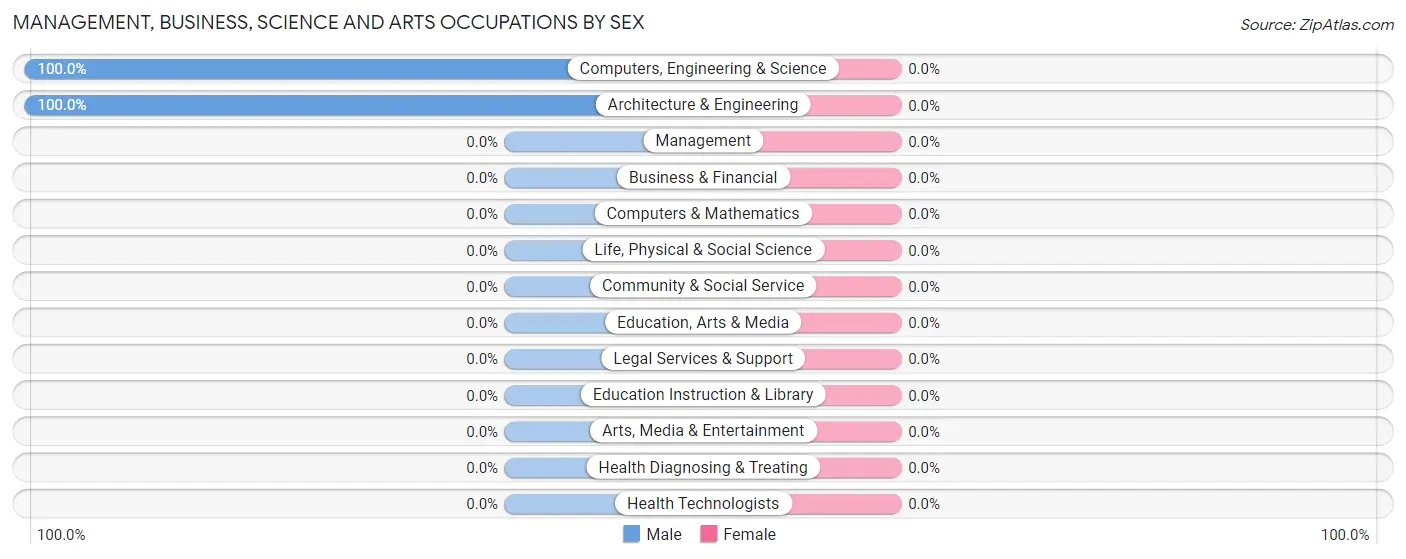
Management, Business, Science and Arts Occupations
The most common Management, Business, Science and Arts occupations in Wainiha are Computers, Engineering & Science (7 | 12.7%), and Architecture & Engineering (7 | 12.7%).
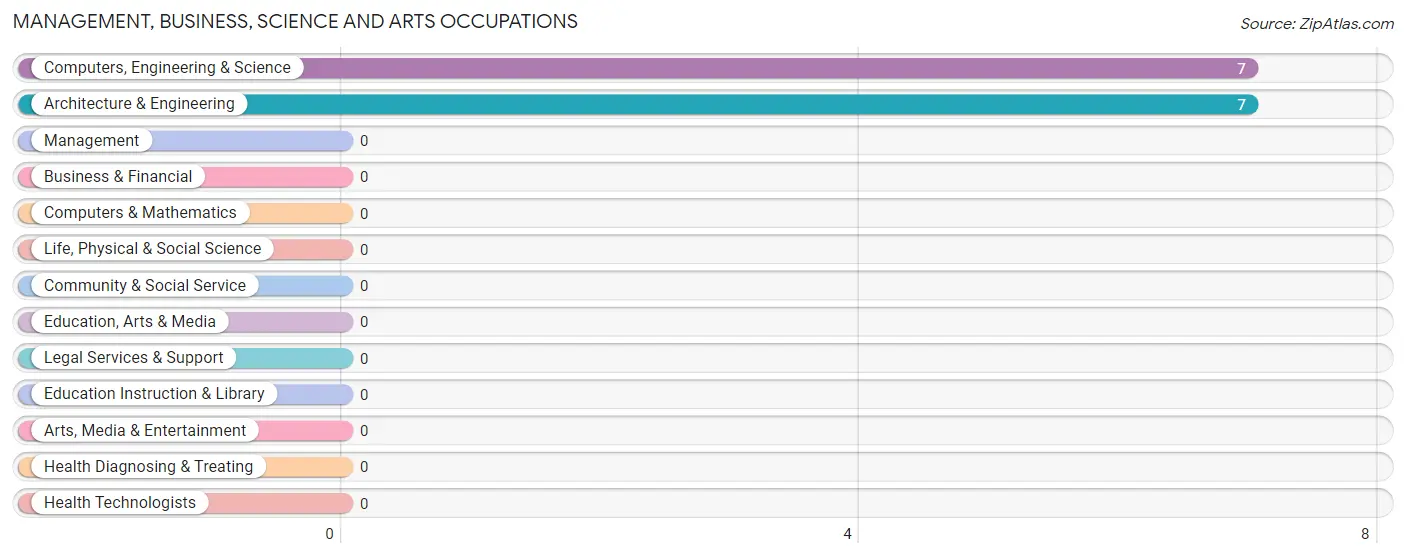
Management, Business, Science and Arts Occupations by Sex
| Occupation | Male | Female |
| Management | 0 (0.0%) | 0 (0.0%) |
| Business & Financial | 0 (0.0%) | 0 (0.0%) |
| Computers, Engineering & Science | 7 (100.0%) | 0 (0.0%) |
| Computers & Mathematics | 0 (0.0%) | 0 (0.0%) |
| Architecture & Engineering | 7 (100.0%) | 0 (0.0%) |
| Life, Physical & Social Science | 0 (0.0%) | 0 (0.0%) |
| Community & Social Service | 0 (0.0%) | 0 (0.0%) |
| Education, Arts & Media | 0 (0.0%) | 0 (0.0%) |
| Legal Services & Support | 0 (0.0%) | 0 (0.0%) |
| Education Instruction & Library | 0 (0.0%) | 0 (0.0%) |
| Arts, Media & Entertainment | 0 (0.0%) | 0 (0.0%) |
| Health Diagnosing & Treating | 0 (0.0%) | 0 (0.0%) |
| Health Technologists | 0 (0.0%) | 0 (0.0%) |
| Total (Category) | 7 (100.0%) | 0 (0.0%) |
| Total (Overall) | 12 (21.8%) | 43 (78.2%) |
Services Occupations
The most common Services occupations in Wainiha are , and Food Preparation & Serving (3 | 5.4%).
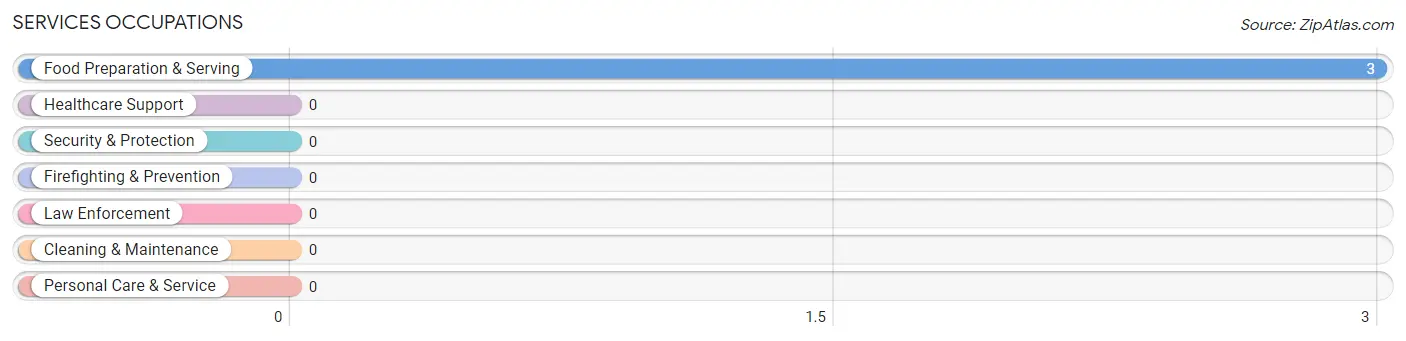
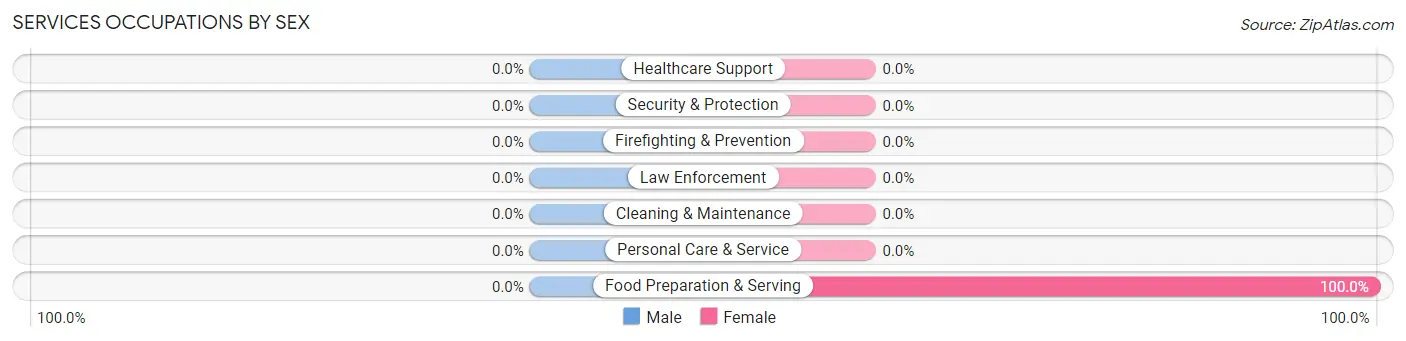
Services Occupations by Sex
| Occupation | Male | Female |
| Healthcare Support | 0 (0.0%) | 0 (0.0%) |
| Security & Protection | 0 (0.0%) | 0 (0.0%) |
| Firefighting & Prevention | 0 (0.0%) | 0 (0.0%) |
| Law Enforcement | 0 (0.0%) | 0 (0.0%) |
| Food Preparation & Serving | 0 (0.0%) | 3 (100.0%) |
| Cleaning & Maintenance | 0 (0.0%) | 0 (0.0%) |
| Personal Care & Service | 0 (0.0%) | 0 (0.0%) |
| Total (Category) | 0 (0.0%) | 3 (100.0%) |
| Total (Overall) | 12 (21.8%) | 43 (78.2%) |
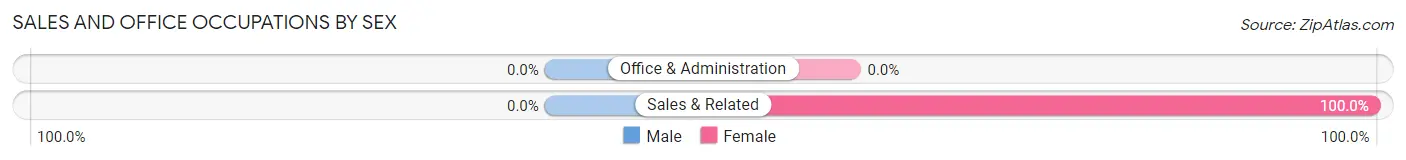
Sales and Office Occupations
The most common Sales and Office occupations in Wainiha are , and Sales & Related (9 | 16.4%).
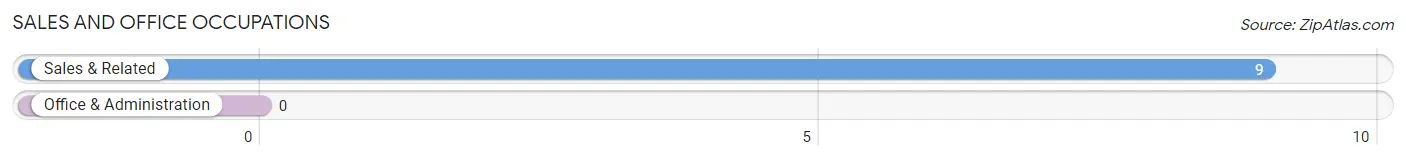
Sales and Office Occupations by Sex
| Occupation | Male | Female |
| Sales & Related | 0 (0.0%) | 9 (100.0%) |
| Office & Administration | 0 (0.0%) | 0 (0.0%) |
| Total (Category) | 0 (0.0%) | 9 (100.0%) |
| Total (Overall) | 12 (21.8%) | 43 (78.2%) |
Natural Resources, Construction and Maintenance Occupations
The most common Natural Resources, Construction and Maintenance occupations in Wainiha are , and Installation, Maintenance & Repair (5 | 9.1%).
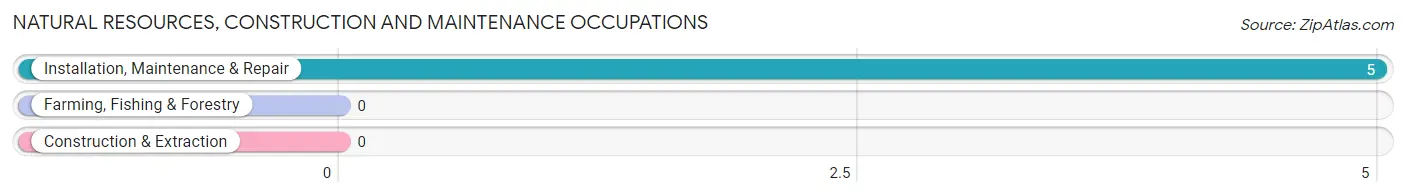
Natural Resources, Construction and Maintenance Occupations by Sex
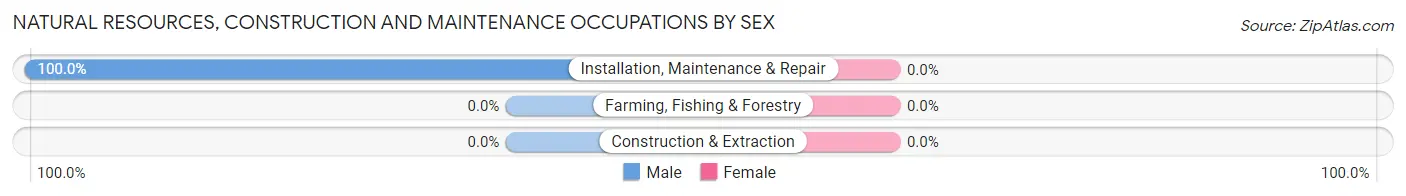
| Occupation | Male | Female |
| Farming, Fishing & Forestry | 0 (0.0%) | 0 (0.0%) |
| Construction & Extraction | 0 (0.0%) | 0 (0.0%) |
| Installation, Maintenance & Repair | 5 (100.0%) | 0 (0.0%) |
| Total (Category) | 5 (100.0%) | 0 (0.0%) |
| Total (Overall) | 12 (21.8%) | 43 (78.2%) |
Production, Transportation and Moving Occupations
The most common Production, Transportation and Moving occupations in Wainiha are , and Material Moving (31 | 56.4%).
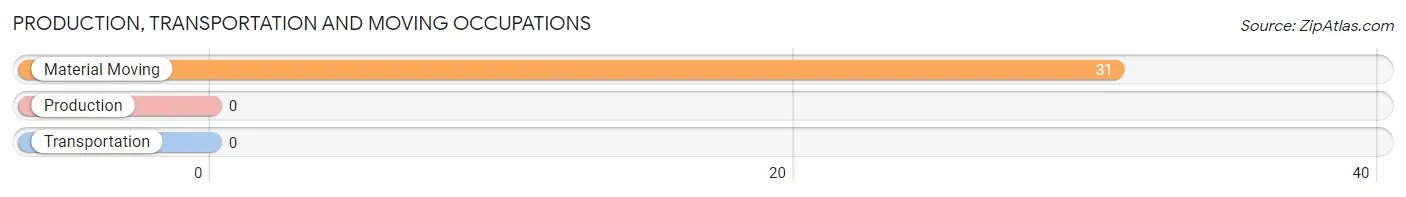
Production, Transportation and Moving Occupations by Sex
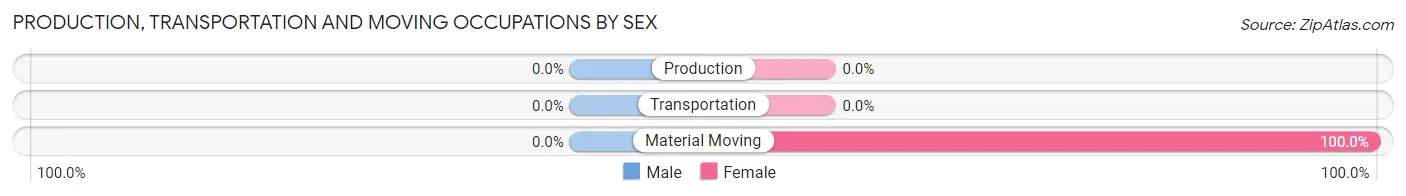
| Occupation | Male | Female |
| Production | 0 (0.0%) | 0 (0.0%) |
| Transportation | 0 (0.0%) | 0 (0.0%) |
| Material Moving | 0 (0.0%) | 31 (100.0%) |
| Total (Category) | 0 (0.0%) | 31 (100.0%) |
| Total (Overall) | 12 (21.8%) | 43 (78.2%) |
Employment Industries by Sex in Wainiha
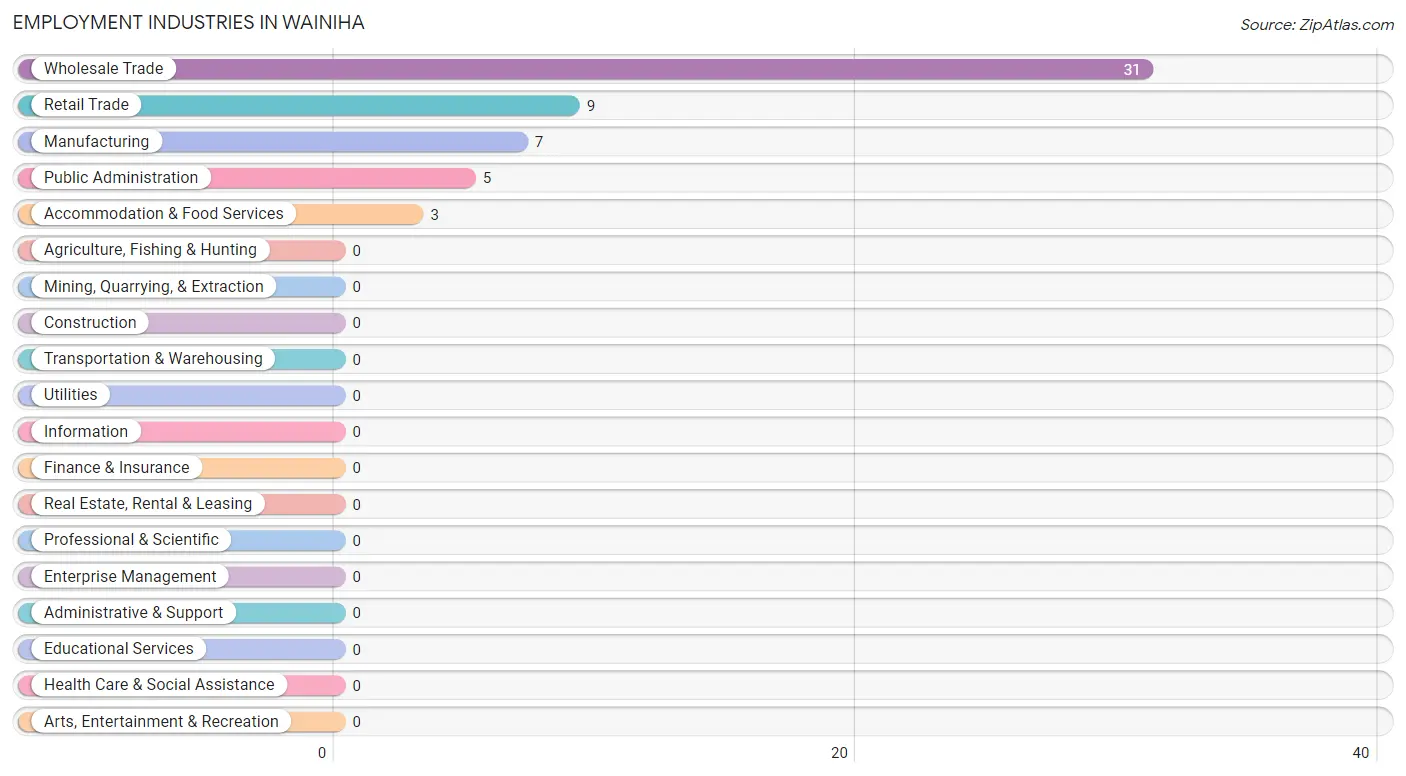
Employment Industries in Wainiha
The major employment industries in Wainiha include Wholesale Trade (31 | 56.4%), Retail Trade (9 | 16.4%), Manufacturing (7 | 12.7%), Public Administration (5 | 9.1%), and Accommodation & Food Services (3 | 5.4%).
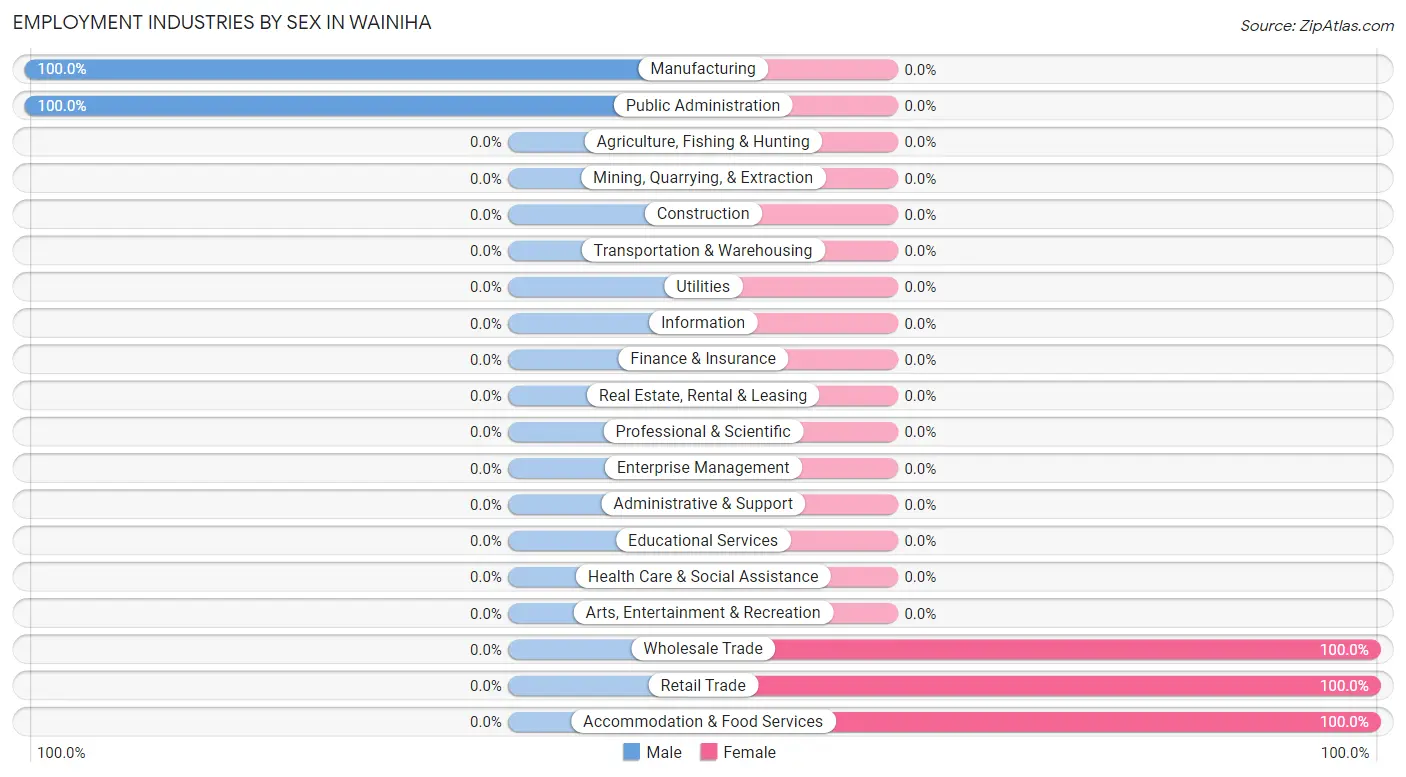
Employment Industries by Sex in Wainiha
The Wainiha industries that see more men than women are Manufacturing (100.0%), and Public Administration (100.0%), whereas the industries that tend to have a higher number of women are Wholesale Trade (100.0%), Retail Trade (100.0%), and Accommodation & Food Services (100.0%).
| Industry | Male | Female |
| Agriculture, Fishing & Hunting | 0 (0.0%) | 0 (0.0%) |
| Mining, Quarrying, & Extraction | 0 (0.0%) | 0 (0.0%) |
| Construction | 0 (0.0%) | 0 (0.0%) |
| Manufacturing | 7 (100.0%) | 0 (0.0%) |
| Wholesale Trade | 0 (0.0%) | 31 (100.0%) |
| Retail Trade | 0 (0.0%) | 9 (100.0%) |
| Transportation & Warehousing | 0 (0.0%) | 0 (0.0%) |
| Utilities | 0 (0.0%) | 0 (0.0%) |
| Information | 0 (0.0%) | 0 (0.0%) |
| Finance & Insurance | 0 (0.0%) | 0 (0.0%) |
| Real Estate, Rental & Leasing | 0 (0.0%) | 0 (0.0%) |
| Professional & Scientific | 0 (0.0%) | 0 (0.0%) |
| Enterprise Management | 0 (0.0%) | 0 (0.0%) |
| Administrative & Support | 0 (0.0%) | 0 (0.0%) |
| Educational Services | 0 (0.0%) | 0 (0.0%) |
| Health Care & Social Assistance | 0 (0.0%) | 0 (0.0%) |
| Arts, Entertainment & Recreation | 0 (0.0%) | 0 (0.0%) |
| Accommodation & Food Services | 0 (0.0%) | 3 (100.0%) |
| Public Administration | 5 (100.0%) | 0 (0.0%) |
| Total | 12 (21.8%) | 43 (78.2%) |
Education in Wainiha
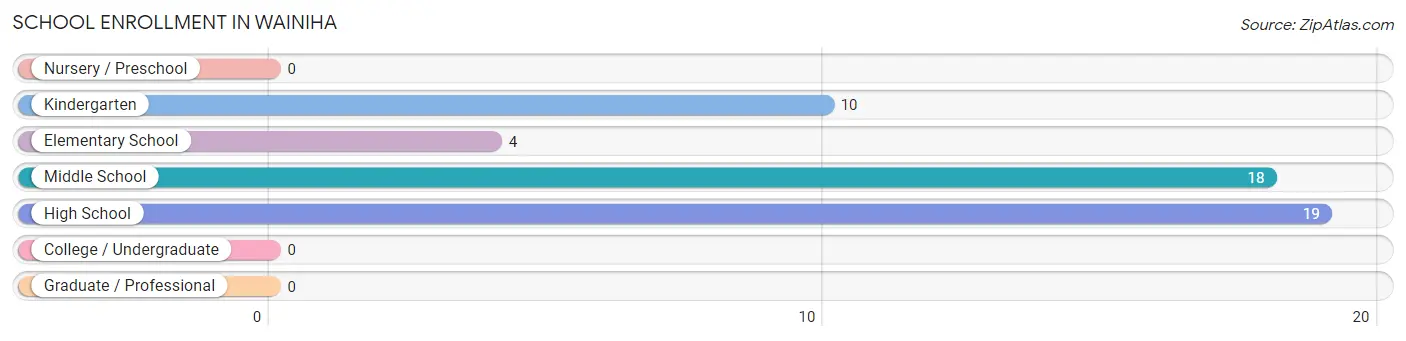
School Enrollment in Wainiha
The most common levels of schooling among the 51 students in Wainiha are high school (19 | 37.2%), middle school (18 | 35.3%), and kindergarten (10 | 19.6%).
| School Level | # Students | % Students |
| Nursery / Preschool | 0 | 0.0% |
| Kindergarten | 10 | 19.6% |
| Elementary School | 4 | 7.8% |
| Middle School | 18 | 35.3% |
| High School | 19 | 37.2% |
| College / Undergraduate | 0 | 0.0% |
| Graduate / Professional | 0 | 0.0% |
| Total | 51 | 100.0% |
School Enrollment by Age by Funding Source in Wainiha
Out of a total of 51 students who are enrolled in schools in Wainiha, 18 (35.3%) attend a private institution, while the remaining 33 (64.7%) are enrolled in public schools. The age group of 10 to 14 year olds has the highest likelihood of being enrolled in private schools, with 18 (100.0% in the age bracket) enrolled. Conversely, the age group of 5 to 9 year old has the lowest likelihood of being enrolled in a private school, with 14 (100.0% in the age bracket) attending a public institution.
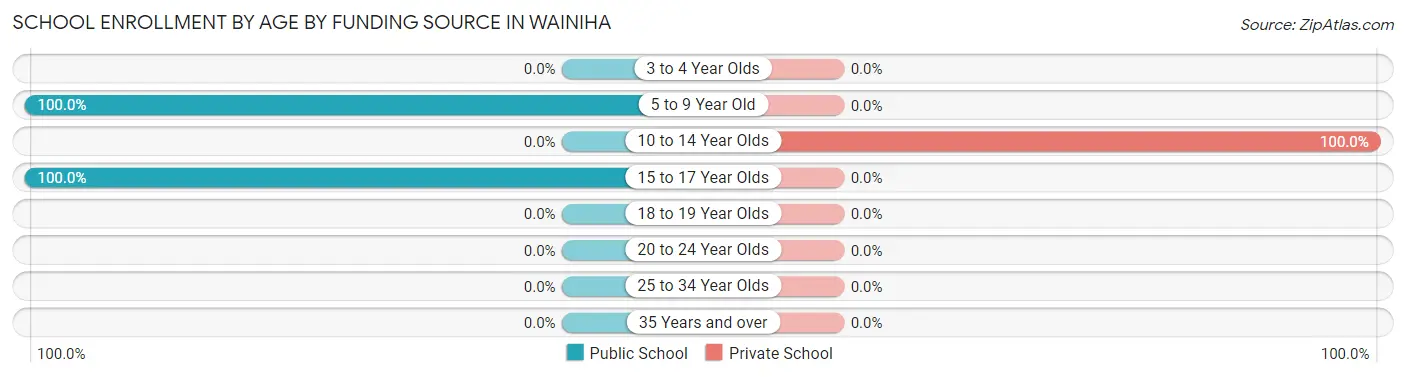
| Age Bracket | Public School | Private School |
| 3 to 4 Year Olds | 0 (0.0%) | 0 (0.0%) |
| 5 to 9 Year Old | 14 (100.0%) | 0 (0.0%) |
| 10 to 14 Year Olds | 0 (0.0%) | 18 (100.0%) |
| 15 to 17 Year Olds | 19 (100.0%) | 0 (0.0%) |
| 18 to 19 Year Olds | 0 (0.0%) | 0 (0.0%) |
| 20 to 24 Year Olds | 0 (0.0%) | 0 (0.0%) |
| 25 to 34 Year Olds | 0 (0.0%) | 0 (0.0%) |
| 35 Years and over | 0 (0.0%) | 0 (0.0%) |
| Total | 33 (64.7%) | 18 (35.3%) |
Educational Attainment by Field of Study in Wainiha
Business (9 | 20.4%), computers & mathematics (7 | 15.9%), education (6 | 13.6%), liberal arts & history (6 | 13.6%), and communications (6 | 13.6%) are the most common fields of study among 44 individuals in Wainiha who have obtained a bachelor's degree or higher.
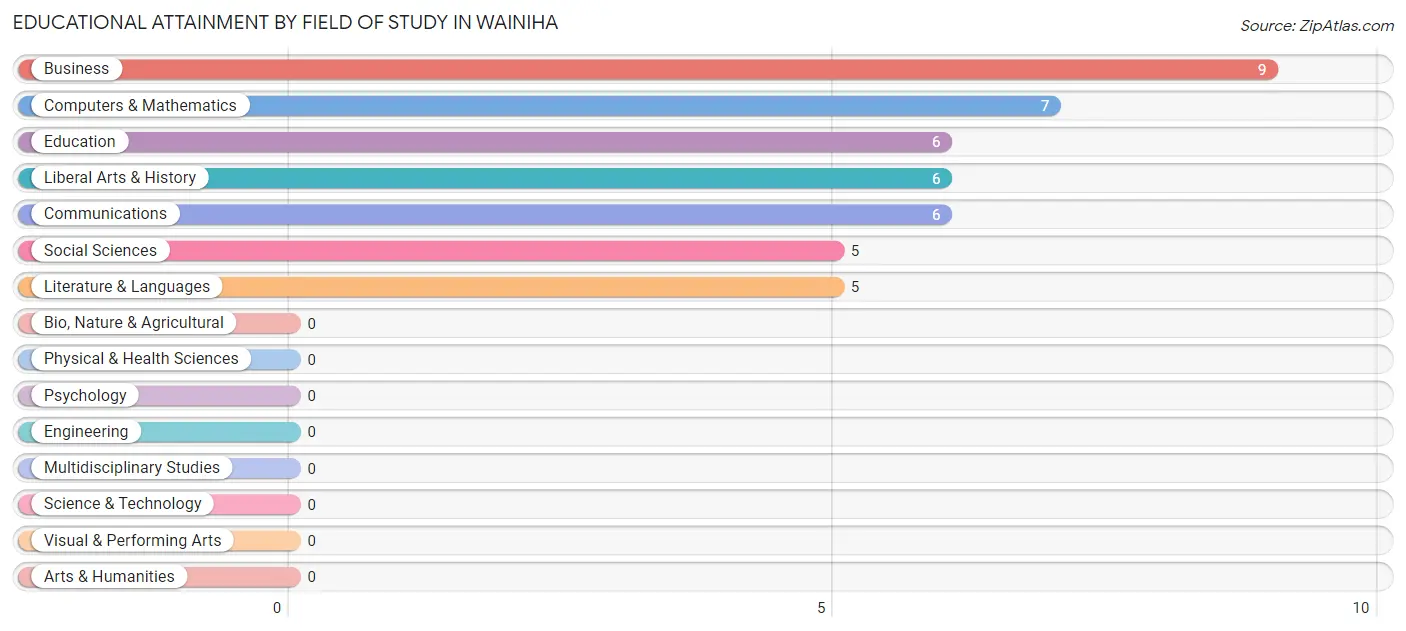
| Field of Study | # Graduates | % Graduates |
| Computers & Mathematics | 7 | 15.9% |
| Bio, Nature & Agricultural | 0 | 0.0% |
| Physical & Health Sciences | 0 | 0.0% |
| Psychology | 0 | 0.0% |
| Social Sciences | 5 | 11.4% |
| Engineering | 0 | 0.0% |
| Multidisciplinary Studies | 0 | 0.0% |
| Science & Technology | 0 | 0.0% |
| Business | 9 | 20.4% |
| Education | 6 | 13.6% |
| Literature & Languages | 5 | 11.4% |
| Liberal Arts & History | 6 | 13.6% |
| Visual & Performing Arts | 0 | 0.0% |
| Communications | 6 | 13.6% |
| Arts & Humanities | 0 | 0.0% |
| Total | 44 | 100.0% |
Transportation & Commute in Wainiha
Vehicle Availability by Sex in Wainiha
The most prevalent vehicle ownership categories in Wainiha are males with 2 vehicles (7, accounting for 58.3%) and females with 2 vehicles (0, making up 16.3%).
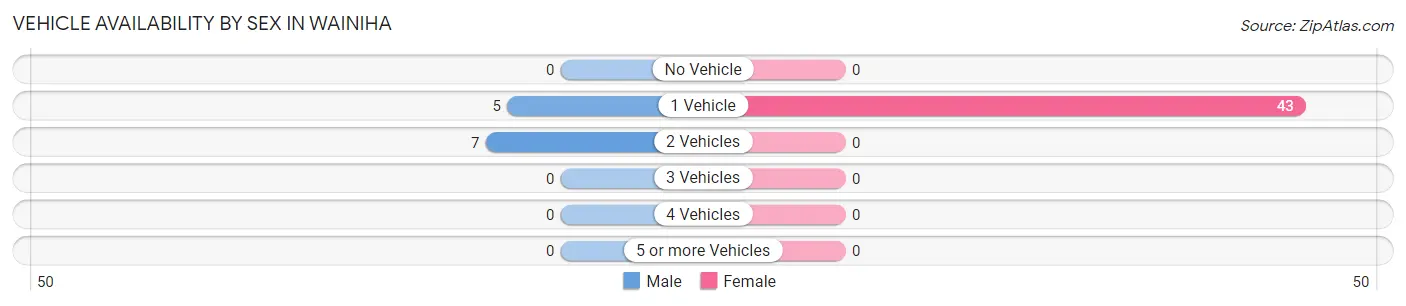
| Vehicles Available | Male | Female |
| No Vehicle | 0 (0.0%) | 0 (0.0%) |
| 1 Vehicle | 5 (41.7%) | 43 (100.0%) |
| 2 Vehicles | 7 (58.3%) | 0 (0.0%) |
| 3 Vehicles | 0 (0.0%) | 0 (0.0%) |
| 4 Vehicles | 0 (0.0%) | 0 (0.0%) |
| 5 or more Vehicles | 0 (0.0%) | 0 (0.0%) |
| Total | 12 (100.0%) | 43 (100.0%) |
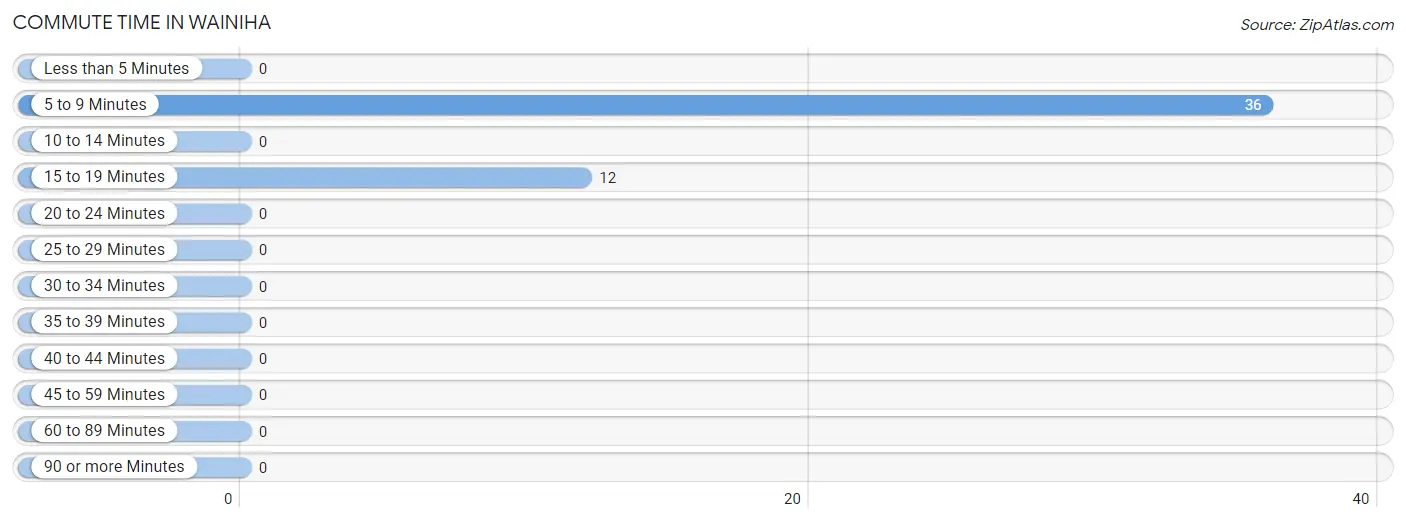
Commute Time in Wainiha
The most frequently occuring commute durations in Wainiha are 5 to 9 minutes (36 commuters, 75.0%), 15 to 19 minutes (12 commuters, 25.0%), and less than 5 minutes (0 commuters, 0.0%).
| Commute Time | # Commuters | % Commuters |
| Less than 5 Minutes | 0 | 0.0% |
| 5 to 9 Minutes | 36 | 75.0% |
| 10 to 14 Minutes | 0 | 0.0% |
| 15 to 19 Minutes | 12 | 25.0% |
| 20 to 24 Minutes | 0 | 0.0% |
| 25 to 29 Minutes | 0 | 0.0% |
| 30 to 34 Minutes | 0 | 0.0% |
| 35 to 39 Minutes | 0 | 0.0% |
| 40 to 44 Minutes | 0 | 0.0% |
| 45 to 59 Minutes | 0 | 0.0% |
| 60 to 89 Minutes | 0 | 0.0% |
| 90 or more Minutes | 0 | 0.0% |
Commute Time by Sex in Wainiha
The most common commute times in Wainiha are 5 to 9 minutes (5 commuters, 100.0%) for males and 5 to 9 minutes (31 commuters, 72.1%) for females.
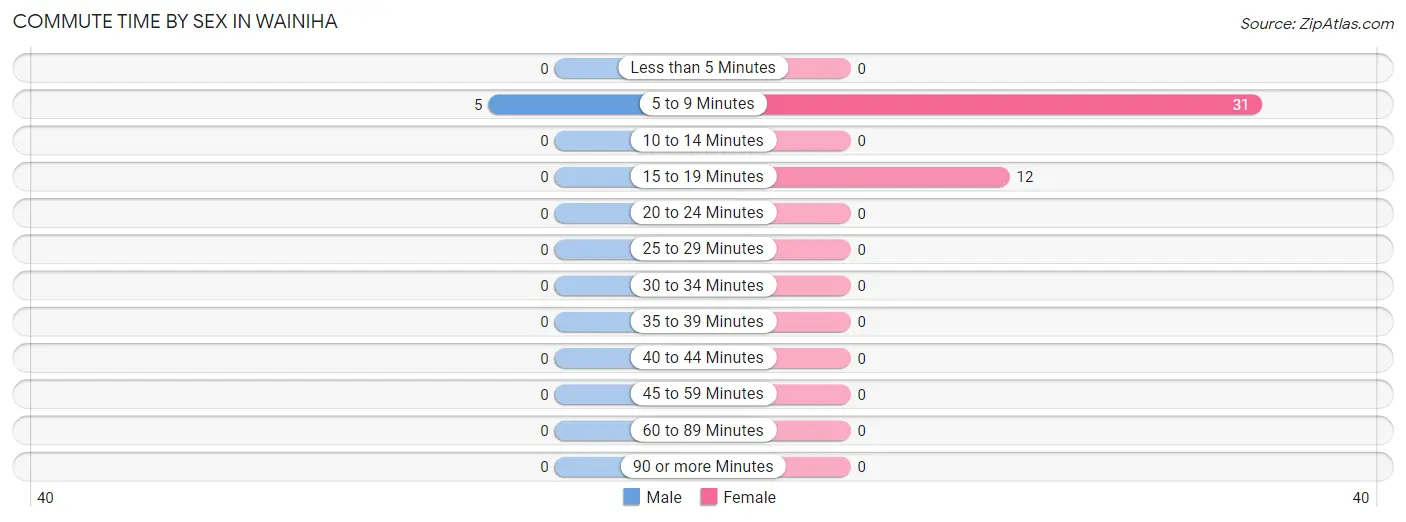
| Commute Time | Male | Female |
| Less than 5 Minutes | 0 (0.0%) | 0 (0.0%) |
| 5 to 9 Minutes | 5 (100.0%) | 31 (72.1%) |
| 10 to 14 Minutes | 0 (0.0%) | 0 (0.0%) |
| 15 to 19 Minutes | 0 (0.0%) | 12 (27.9%) |
| 20 to 24 Minutes | 0 (0.0%) | 0 (0.0%) |
| 25 to 29 Minutes | 0 (0.0%) | 0 (0.0%) |
| 30 to 34 Minutes | 0 (0.0%) | 0 (0.0%) |
| 35 to 39 Minutes | 0 (0.0%) | 0 (0.0%) |
| 40 to 44 Minutes | 0 (0.0%) | 0 (0.0%) |
| 45 to 59 Minutes | 0 (0.0%) | 0 (0.0%) |
| 60 to 89 Minutes | 0 (0.0%) | 0 (0.0%) |
| 90 or more Minutes | 0 (0.0%) | 0 (0.0%) |
Time of Departure to Work by Sex in Wainiha
The most frequent times of departure to work in Wainiha are 7:00 AM to 7:29 AM (5, 100.0%) for males and 7:00 AM to 7:29 AM (31, 72.1%) for females.
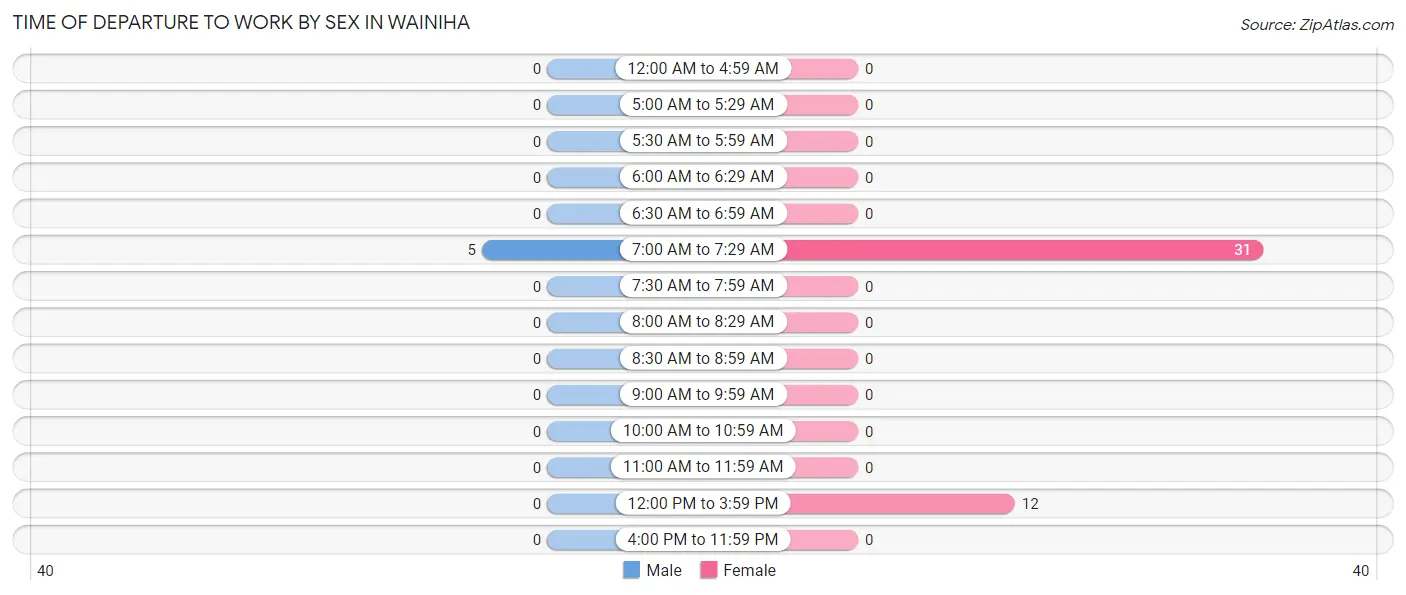
| Time of Departure | Male | Female |
| 12:00 AM to 4:59 AM | 0 (0.0%) | 0 (0.0%) |
| 5:00 AM to 5:29 AM | 0 (0.0%) | 0 (0.0%) |
| 5:30 AM to 5:59 AM | 0 (0.0%) | 0 (0.0%) |
| 6:00 AM to 6:29 AM | 0 (0.0%) | 0 (0.0%) |
| 6:30 AM to 6:59 AM | 0 (0.0%) | 0 (0.0%) |
| 7:00 AM to 7:29 AM | 5 (100.0%) | 31 (72.1%) |
| 7:30 AM to 7:59 AM | 0 (0.0%) | 0 (0.0%) |
| 8:00 AM to 8:29 AM | 0 (0.0%) | 0 (0.0%) |
| 8:30 AM to 8:59 AM | 0 (0.0%) | 0 (0.0%) |
| 9:00 AM to 9:59 AM | 0 (0.0%) | 0 (0.0%) |
| 10:00 AM to 10:59 AM | 0 (0.0%) | 0 (0.0%) |
| 11:00 AM to 11:59 AM | 0 (0.0%) | 0 (0.0%) |
| 12:00 PM to 3:59 PM | 0 (0.0%) | 12 (27.9%) |
| 4:00 PM to 11:59 PM | 0 (0.0%) | 0 (0.0%) |
| Total | 5 (100.0%) | 43 (100.0%) |
Housing Occupancy in Wainiha
Occupancy by Ownership in Wainiha
Of the total 24 dwellings in Wainiha, owner-occupied units account for 24 (100.0%), while renter-occupied units make up 0 (0.0%).
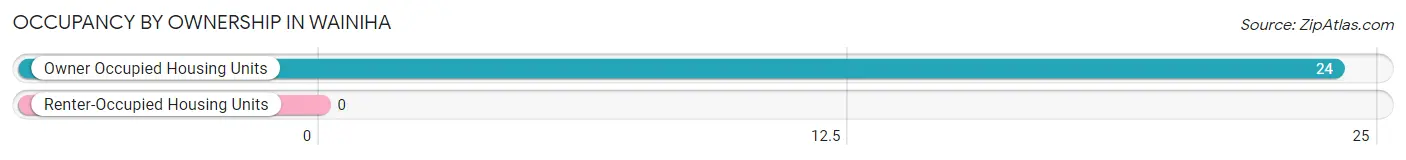
| Occupancy | # Housing Units | % Housing Units |
| Owner Occupied Housing Units | 24 | 100.0% |
| Renter-Occupied Housing Units | 0 | 0.0% |
| Total Occupied Housing Units | 24 | 100.0% |
Occupancy by Household Size in Wainiha
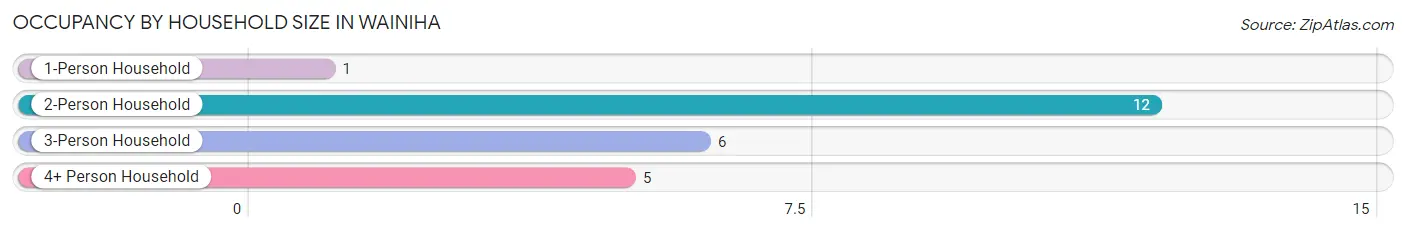
| Household Size | # Housing Units | % Housing Units |
| 1-Person Household | 1 | 4.2% |
| 2-Person Household | 12 | 50.0% |
| 3-Person Household | 6 | 25.0% |
| 4+ Person Household | 5 | 20.8% |
| Total Housing Units | 24 | 100.0% |
Occupancy by Ownership by Household Size in Wainiha
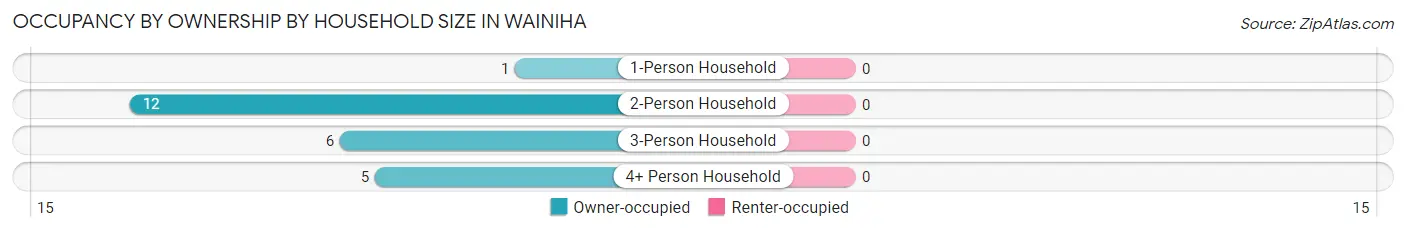
| Household Size | Owner-occupied | Renter-occupied |
| 1-Person Household | 1 (100.0%) | 0 (0.0%) |
| 2-Person Household | 12 (100.0%) | 0 (0.0%) |
| 3-Person Household | 6 (100.0%) | 0 (0.0%) |
| 4+ Person Household | 5 (100.0%) | 0 (0.0%) |
| Total Housing Units | 24 (100.0%) | 0 (0.0%) |
Occupancy by Educational Attainment in Wainiha
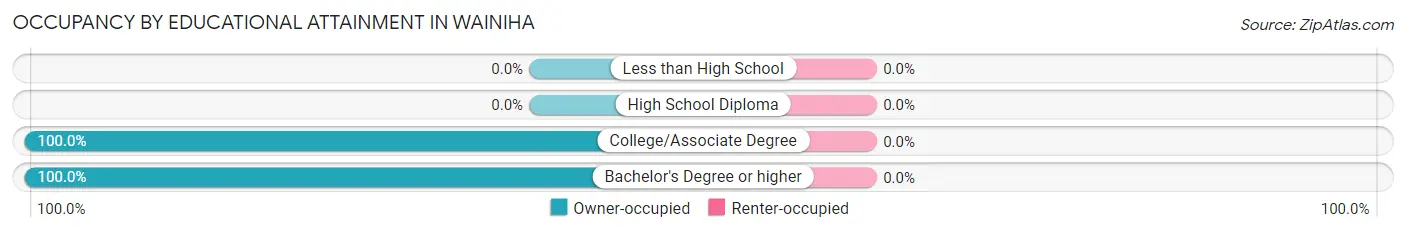
| Household Size | Owner-occupied | Renter-occupied |
| Less than High School | 0 (0.0%) | 0 (0.0%) |
| High School Diploma | 0 (0.0%) | 0 (0.0%) |
| College/Associate Degree | 6 (100.0%) | 0 (0.0%) |
| Bachelor's Degree or higher | 18 (100.0%) | 0 (0.0%) |
Occupancy by Age of Householder in Wainiha
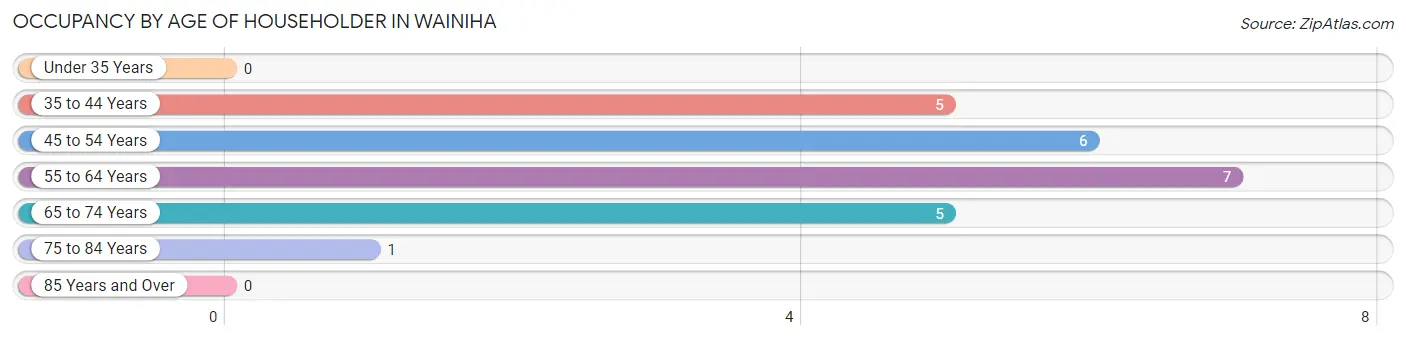
| Age Bracket | # Households | % Households |
| Under 35 Years | 0 | 0.0% |
| 35 to 44 Years | 5 | 20.8% |
| 45 to 54 Years | 6 | 25.0% |
| 55 to 64 Years | 7 | 29.2% |
| 65 to 74 Years | 5 | 20.8% |
| 75 to 84 Years | 1 | 4.2% |
| 85 Years and Over | 0 | 0.0% |
| Total | 24 | 100.0% |
Housing Finances in Wainiha
Median Income by Occupancy in Wainiha
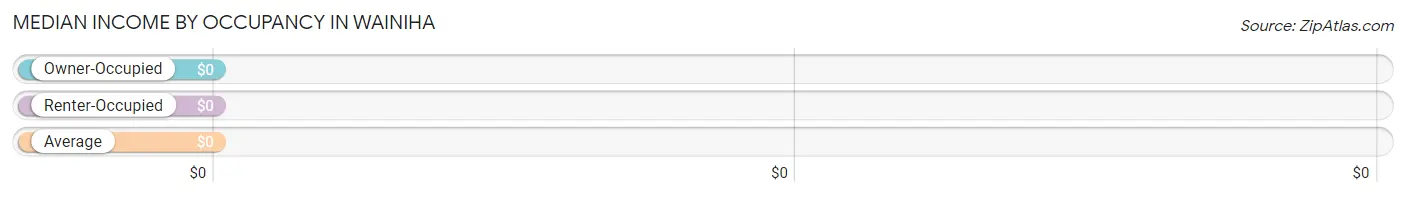
| Occupancy Type | # Households | Median Income |
| Owner-Occupied | 24 (100.0%) | $0 |
| Renter-Occupied | 0 (0.0%) | $0 |
| Average | 24 (100.0%) | $0 |
Occupancy by Householder Income Bracket in Wainiha
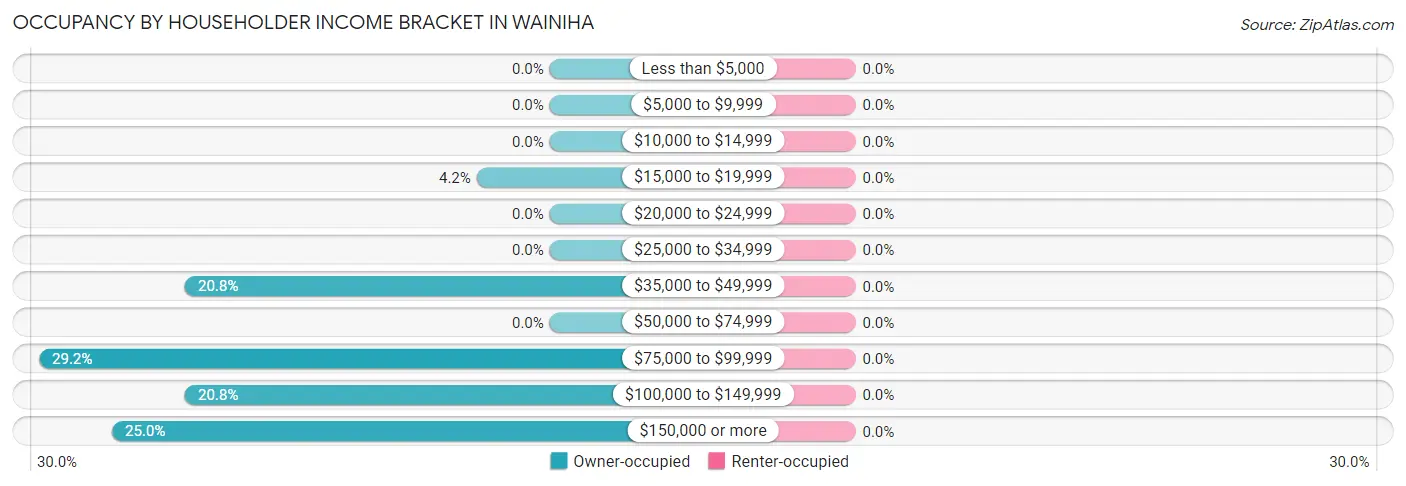
| Income Bracket | Owner-occupied | Renter-occupied |
| Less than $5,000 | 0 (0.0%) | 0 (0.0%) |
| $5,000 to $9,999 | 0 (0.0%) | 0 (0.0%) |
| $10,000 to $14,999 | 0 (0.0%) | 0 (0.0%) |
| $15,000 to $19,999 | 1 (4.2%) | 0 (0.0%) |
| $20,000 to $24,999 | 0 (0.0%) | 0 (0.0%) |
| $25,000 to $34,999 | 0 (0.0%) | 0 (0.0%) |
| $35,000 to $49,999 | 5 (20.8%) | 0 (0.0%) |
| $50,000 to $74,999 | 0 (0.0%) | 0 (0.0%) |
| $75,000 to $99,999 | 7 (29.2%) | 0 (0.0%) |
| $100,000 to $149,999 | 5 (20.8%) | 0 (0.0%) |
| $150,000 or more | 6 (25.0%) | 0 (0.0%) |
| Total | 24 (100.0%) | 0 (0.0%) |
Monthly Housing Cost Tiers in Wainiha
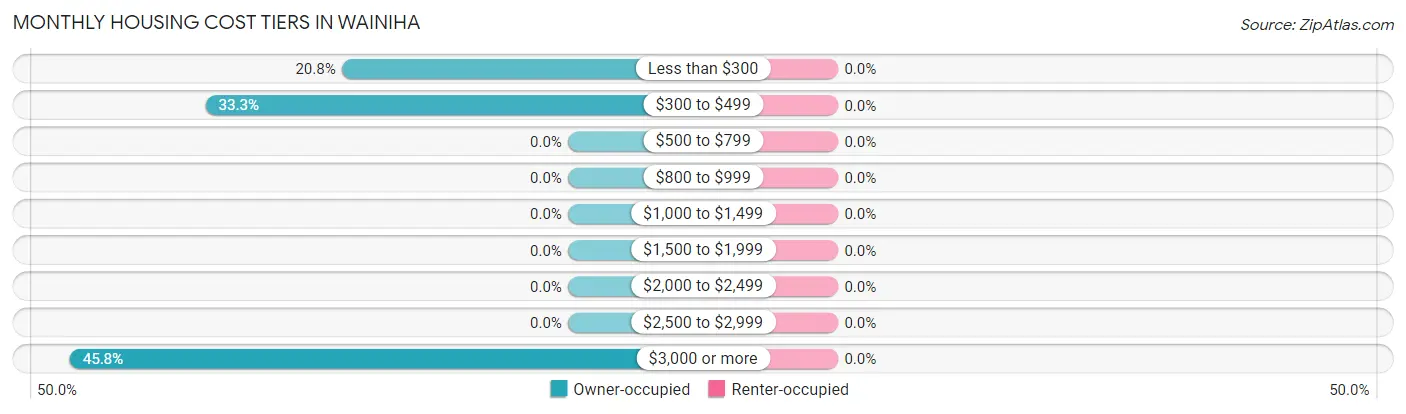
| Monthly Cost | Owner-occupied | Renter-occupied |
| Less than $300 | 5 (20.8%) | 0 (0.0%) |
| $300 to $499 | 8 (33.3%) | 0 (0.0%) |
| $500 to $799 | 0 (0.0%) | 0 (0.0%) |
| $800 to $999 | 0 (0.0%) | 0 (0.0%) |
| $1,000 to $1,499 | 0 (0.0%) | 0 (0.0%) |
| $1,500 to $1,999 | 0 (0.0%) | 0 (0.0%) |
| $2,000 to $2,499 | 0 (0.0%) | 0 (0.0%) |
| $2,500 to $2,999 | 0 (0.0%) | 0 (0.0%) |
| $3,000 or more | 11 (45.8%) | 0 (0.0%) |
| Total | 24 (100.0%) | 0 (0.0%) |
Physical Housing Characteristics in Wainiha
Housing Structures in Wainiha
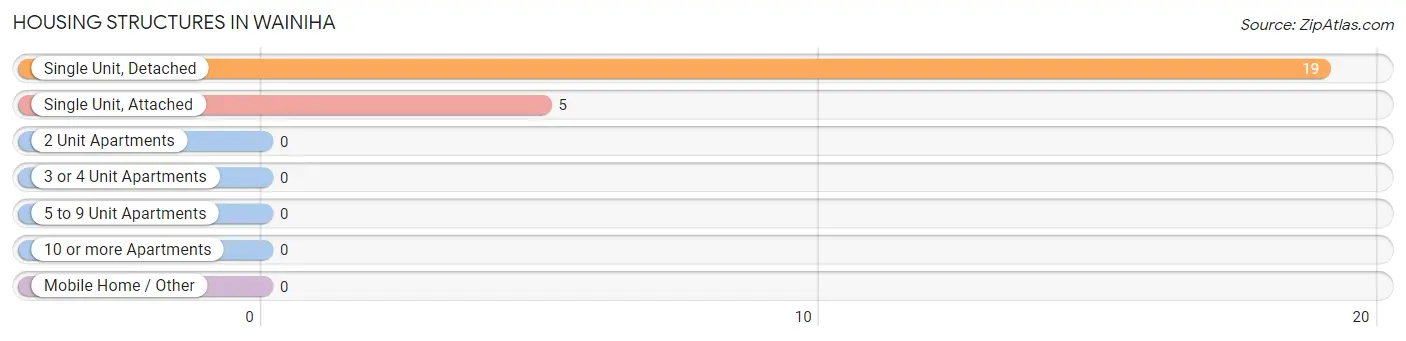
| Structure Type | # Housing Units | % Housing Units |
| Single Unit, Detached | 19 | 79.2% |
| Single Unit, Attached | 5 | 20.8% |
| 2 Unit Apartments | 0 | 0.0% |
| 3 or 4 Unit Apartments | 0 | 0.0% |
| 5 to 9 Unit Apartments | 0 | 0.0% |
| 10 or more Apartments | 0 | 0.0% |
| Mobile Home / Other | 0 | 0.0% |
| Total | 24 | 100.0% |
Housing Structures by Occupancy in Wainiha
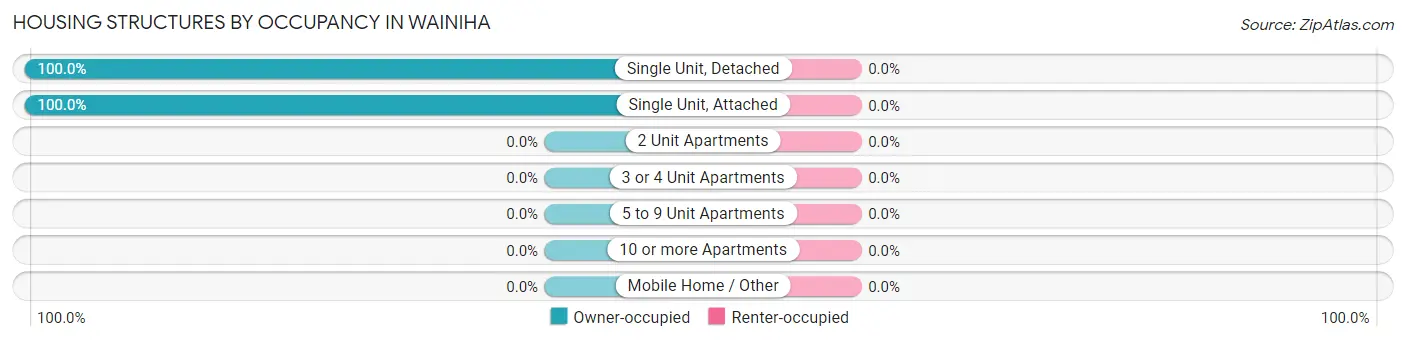
| Structure Type | Owner-occupied | Renter-occupied |
| Single Unit, Detached | 19 (100.0%) | 0 (0.0%) |
| Single Unit, Attached | 5 (100.0%) | 0 (0.0%) |
| 2 Unit Apartments | 0 (0.0%) | 0 (0.0%) |
| 3 or 4 Unit Apartments | 0 (0.0%) | 0 (0.0%) |
| 5 to 9 Unit Apartments | 0 (0.0%) | 0 (0.0%) |
| 10 or more Apartments | 0 (0.0%) | 0 (0.0%) |
| Mobile Home / Other | 0 (0.0%) | 0 (0.0%) |
| Total | 24 (100.0%) | 0 (0.0%) |
Housing Structures by Number of Rooms in Wainiha
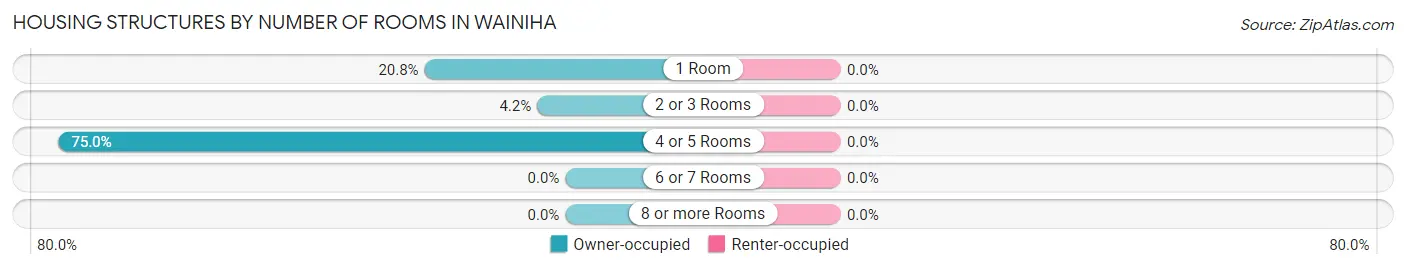
| Number of Rooms | Owner-occupied | Renter-occupied |
| 1 Room | 5 (20.8%) | 0 (0.0%) |
| 2 or 3 Rooms | 1 (4.2%) | 0 (0.0%) |
| 4 or 5 Rooms | 18 (75.0%) | 0 (0.0%) |
| 6 or 7 Rooms | 0 (0.0%) | 0 (0.0%) |
| 8 or more Rooms | 0 (0.0%) | 0 (0.0%) |
| Total | 24 (100.0%) | 0 (0.0%) |
Housing Structure by Heating Type in Wainiha
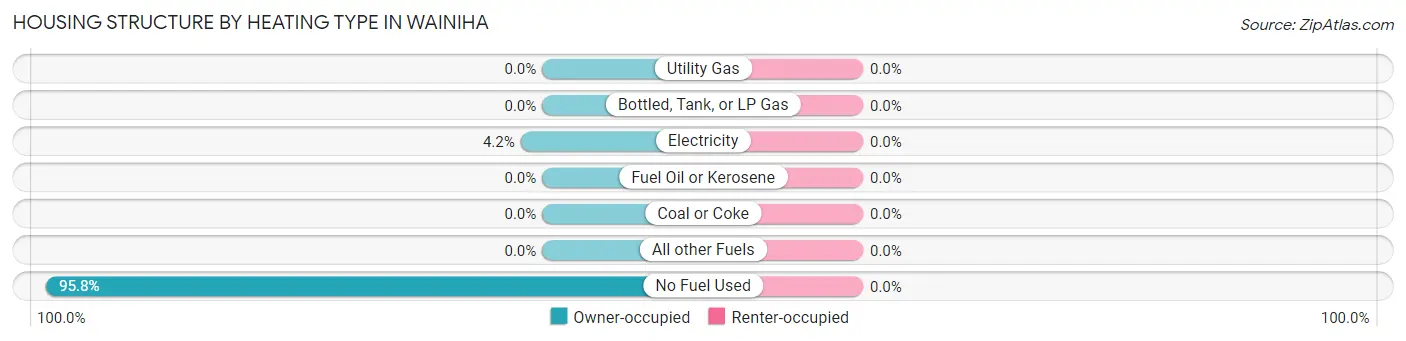
| Heating Type | Owner-occupied | Renter-occupied |
| Utility Gas | 0 (0.0%) | 0 (0.0%) |
| Bottled, Tank, or LP Gas | 0 (0.0%) | 0 (0.0%) |
| Electricity | 1 (4.2%) | 0 (0.0%) |
| Fuel Oil or Kerosene | 0 (0.0%) | 0 (0.0%) |
| Coal or Coke | 0 (0.0%) | 0 (0.0%) |
| All other Fuels | 0 (0.0%) | 0 (0.0%) |
| No Fuel Used | 23 (95.8%) | 0 (0.0%) |
| Total | 24 (100.0%) | 0 (0.0%) |
Household Vehicle Usage in Wainiha
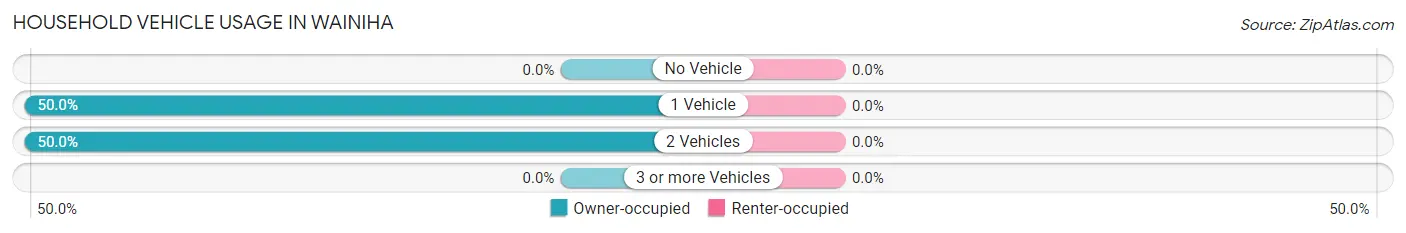
| Vehicles per Household | Owner-occupied | Renter-occupied |
| No Vehicle | 0 (0.0%) | 0 (0.0%) |
| 1 Vehicle | 12 (50.0%) | 0 (0.0%) |
| 2 Vehicles | 12 (50.0%) | 0 (0.0%) |
| 3 or more Vehicles | 0 (0.0%) | 0 (0.0%) |
| Total | 24 (100.0%) | 0 (0.0%) |
Real Estate & Mortgages in Wainiha
Real Estate and Mortgage Overview in Wainiha
| Characteristic | Without Mortgage | With Mortgage |
| Housing Units | 13 | 11 |
| Median Property Value | - | - |
| Median Household Income | $85,179 | $6 |
| Monthly Housing Costs | $361 | $11 |
| Real Estate Taxes | - | - |
Property Value by Mortgage Status in Wainiha
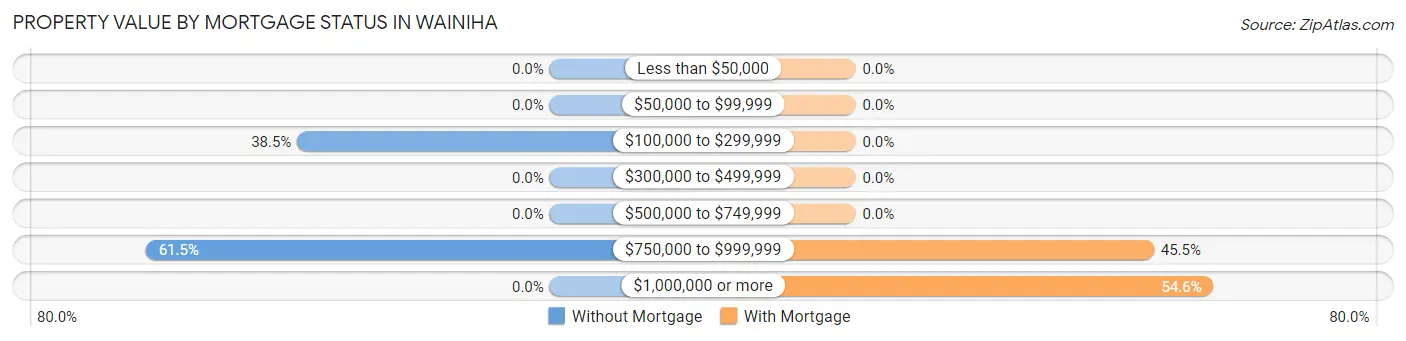
| Property Value | Without Mortgage | With Mortgage |
| Less than $50,000 | 0 (0.0%) | 0 (0.0%) |
| $50,000 to $99,999 | 0 (0.0%) | 0 (0.0%) |
| $100,000 to $299,999 | 5 (38.5%) | 0 (0.0%) |
| $300,000 to $499,999 | 0 (0.0%) | 0 (0.0%) |
| $500,000 to $749,999 | 0 (0.0%) | 0 (0.0%) |
| $750,000 to $999,999 | 8 (61.5%) | 5 (45.5%) |
| $1,000,000 or more | 0 (0.0%) | 6 (54.5%) |
| Total | 13 (100.0%) | 11 (100.0%) |
Household Income by Mortgage Status in Wainiha
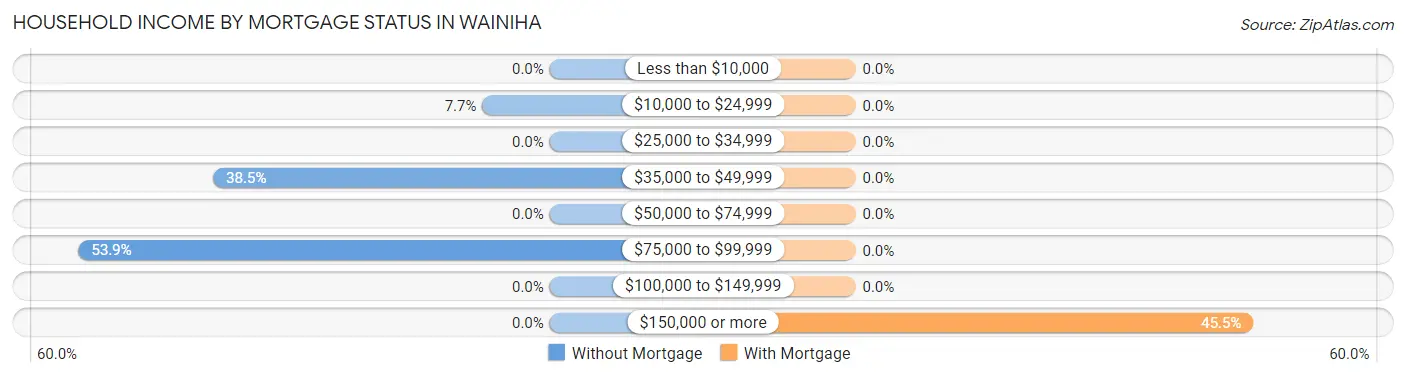
| Household Income | Without Mortgage | With Mortgage |
| Less than $10,000 | 0 (0.0%) | 0 (0.0%) |
| $10,000 to $24,999 | 1 (7.7%) | 0 (0.0%) |
| $25,000 to $34,999 | 0 (0.0%) | 0 (0.0%) |
| $35,000 to $49,999 | 5 (38.5%) | 0 (0.0%) |
| $50,000 to $74,999 | 0 (0.0%) | 0 (0.0%) |
| $75,000 to $99,999 | 7 (53.8%) | 0 (0.0%) |
| $100,000 to $149,999 | 0 (0.0%) | 0 (0.0%) |
| $150,000 or more | 0 (0.0%) | 5 (45.5%) |
| Total | 13 (100.0%) | 11 (100.0%) |
Property Value to Household Income Ratio in Wainiha
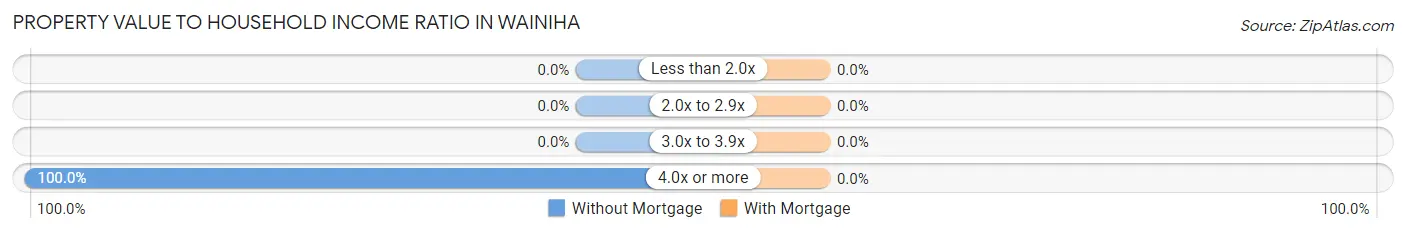
| Value-to-Income Ratio | Without Mortgage | With Mortgage |
| Less than 2.0x | 0 (0.0%) | 0 (0.0%) |
| 2.0x to 2.9x | 0 (0.0%) | 0 (0.0%) |
| 3.0x to 3.9x | 0 (0.0%) | 0 (0.0%) |
| 4.0x or more | 13 (100.0%) | 0 (0.0%) |
| Total | 13 (100.0%) | 11 (100.0%) |
Real Estate Taxes by Mortgage Status in Wainiha
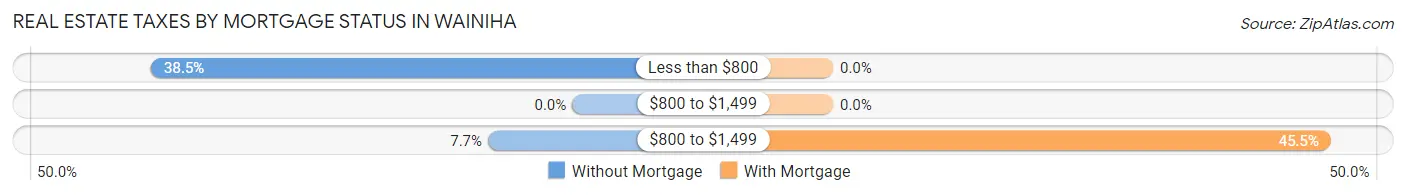
| Property Taxes | Without Mortgage | With Mortgage |
| Less than $800 | 5 (38.5%) | 0 (0.0%) |
| $800 to $1,499 | 0 (0.0%) | 0 (0.0%) |
| $800 to $1,499 | 1 (7.7%) | 5 (45.5%) |
| Total | 13 (100.0%) | 11 (100.0%) |
Health & Disability in Wainiha
Health Insurance Coverage by Age in Wainiha
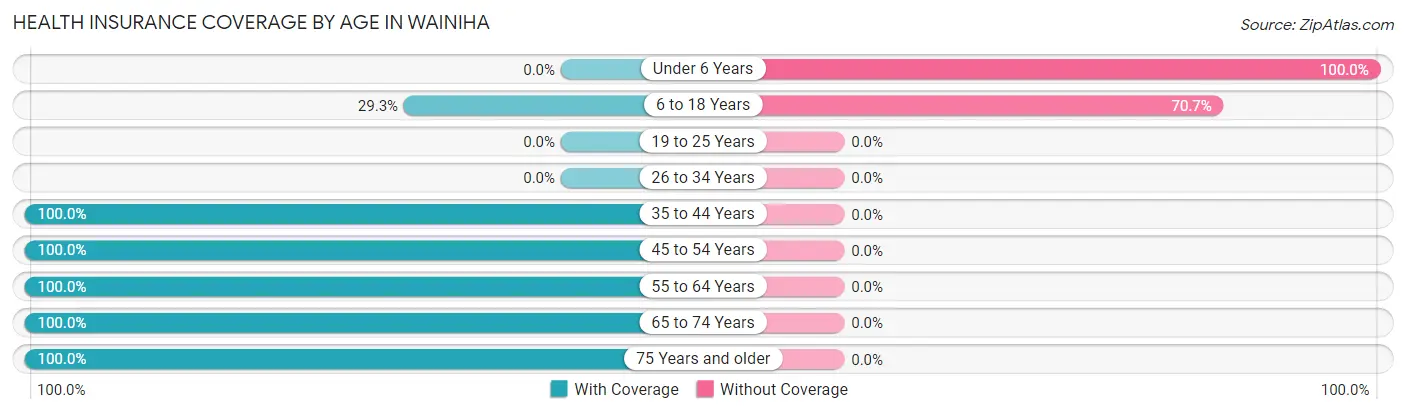
| Age Bracket | With Coverage | Without Coverage |
| Under 6 Years | 0 (0.0%) | 10 (100.0%) |
| 6 to 18 Years | 12 (29.3%) | 29 (70.7%) |
| 19 to 25 Years | 0 (0.0%) | 0 (0.0%) |
| 26 to 34 Years | 0 (0.0%) | 0 (0.0%) |
| 35 to 44 Years | 17 (100.0%) | 0 (0.0%) |
| 45 to 54 Years | 6 (100.0%) | 0 (0.0%) |
| 55 to 64 Years | 7 (100.0%) | 0 (0.0%) |
| 65 to 74 Years | 48 (100.0%) | 0 (0.0%) |
| 75 Years and older | 1 (100.0%) | 0 (0.0%) |
| Total | 91 (70.0%) | 39 (30.0%) |
Health Insurance Coverage by Citizenship Status in Wainiha
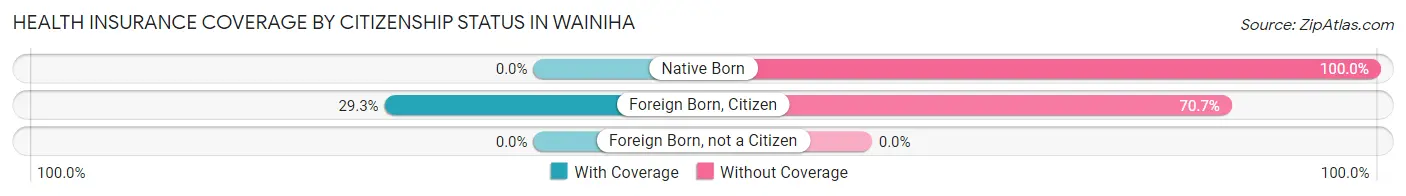
| Citizenship Status | With Coverage | Without Coverage |
| Native Born | 0 (0.0%) | 10 (100.0%) |
| Foreign Born, Citizen | 12 (29.3%) | 29 (70.7%) |
| Foreign Born, not a Citizen | 0 (0.0%) | 0 (0.0%) |
Health Insurance Coverage by Household Income in Wainiha
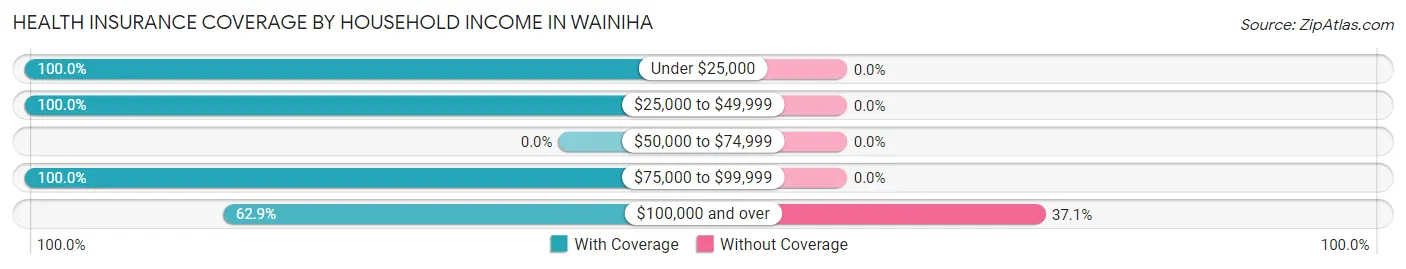
| Household Income | With Coverage | Without Coverage |
| Under $25,000 | 1 (100.0%) | 0 (0.0%) |
| $25,000 to $49,999 | 11 (100.0%) | 0 (0.0%) |
| $50,000 to $74,999 | 0 (0.0%) | 0 (0.0%) |
| $75,000 to $99,999 | 13 (100.0%) | 0 (0.0%) |
| $100,000 and over | 66 (62.9%) | 39 (37.1%) |
Public vs Private Health Insurance Coverage by Age in Wainiha
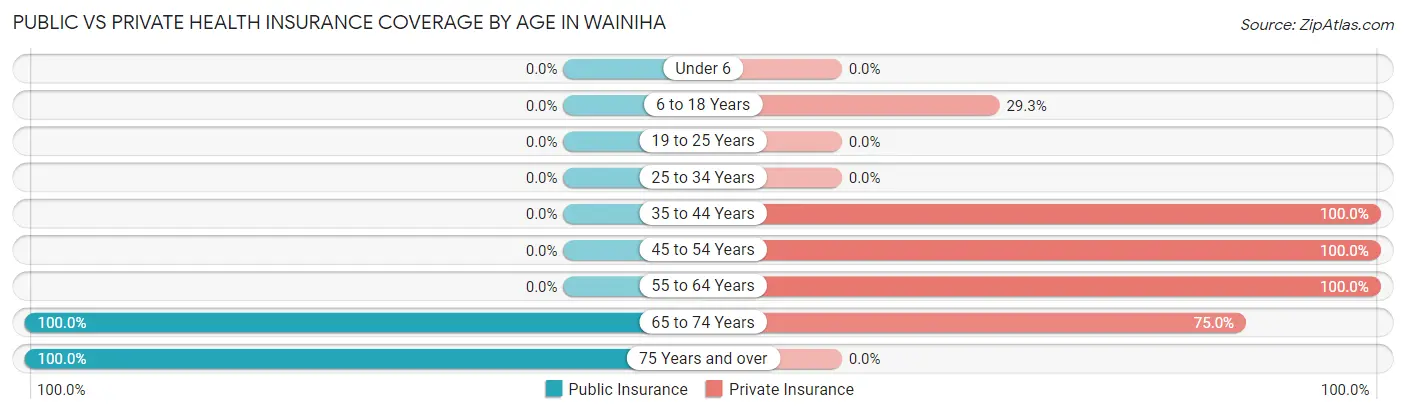
| Age Bracket | Public Insurance | Private Insurance |
| Under 6 | 0 (0.0%) | 0 (0.0%) |
| 6 to 18 Years | 0 (0.0%) | 12 (29.3%) |
| 19 to 25 Years | 0 (0.0%) | 0 (0.0%) |
| 25 to 34 Years | 0 (0.0%) | 0 (0.0%) |
| 35 to 44 Years | 0 (0.0%) | 17 (100.0%) |
| 45 to 54 Years | 0 (0.0%) | 6 (100.0%) |
| 55 to 64 Years | 0 (0.0%) | 7 (100.0%) |
| 65 to 74 Years | 48 (100.0%) | 36 (75.0%) |
| 75 Years and over | 1 (100.0%) | 0 (0.0%) |
| Total | 49 (37.7%) | 78 (60.0%) |
Disability Status by Sex by Age in Wainiha
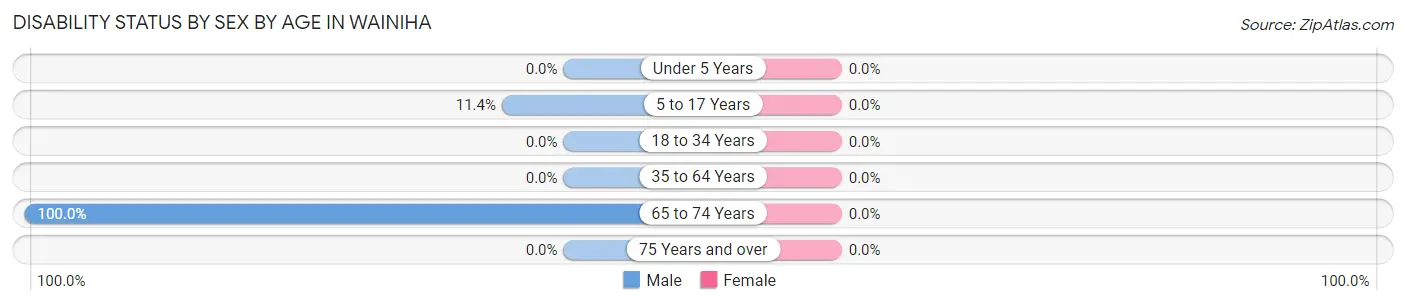
| Age Bracket | Male | Female |
| Under 5 Years | 0 (0.0%) | 0 (0.0%) |
| 5 to 17 Years | 4 (11.4%) | 0 (0.0%) |
| 18 to 34 Years | 0 (0.0%) | 0 (0.0%) |
| 35 to 64 Years | 0 (0.0%) | 0 (0.0%) |
| 65 to 74 Years | 6 (100.0%) | 0 (0.0%) |
| 75 Years and over | 0 (0.0%) | 0 (0.0%) |
Disability Class by Sex by Age in Wainiha
Disability Class: Hearing Difficulty
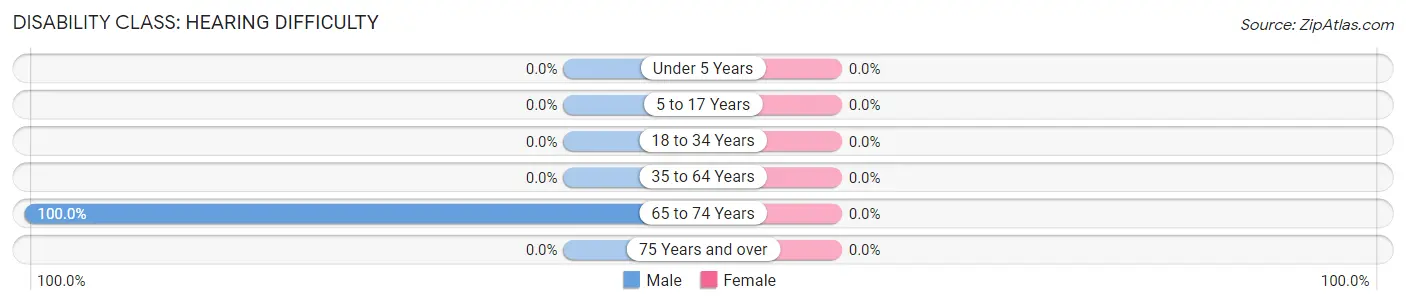
| Age Bracket | Male | Female |
| Under 5 Years | 0 (0.0%) | 0 (0.0%) |
| 5 to 17 Years | 0 (0.0%) | 0 (0.0%) |
| 18 to 34 Years | 0 (0.0%) | 0 (0.0%) |
| 35 to 64 Years | 0 (0.0%) | 0 (0.0%) |
| 65 to 74 Years | 6 (100.0%) | 0 (0.0%) |
| 75 Years and over | 0 (0.0%) | 0 (0.0%) |
Disability Class: Vision Difficulty
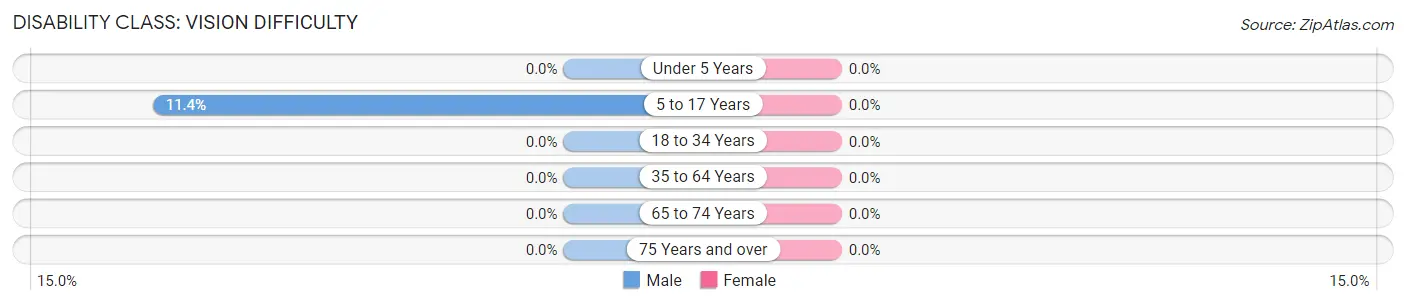
| Age Bracket | Male | Female |
| Under 5 Years | 0 (0.0%) | 0 (0.0%) |
| 5 to 17 Years | 4 (11.4%) | 0 (0.0%) |
| 18 to 34 Years | 0 (0.0%) | 0 (0.0%) |
| 35 to 64 Years | 0 (0.0%) | 0 (0.0%) |
| 65 to 74 Years | 0 (0.0%) | 0 (0.0%) |
| 75 Years and over | 0 (0.0%) | 0 (0.0%) |
Disability Class: Cognitive Difficulty

| Age Bracket | Male | Female |
| 5 to 17 Years | 0 (0.0%) | 0 (0.0%) |
| 18 to 34 Years | 0 (0.0%) | 0 (0.0%) |
| 35 to 64 Years | 0 (0.0%) | 0 (0.0%) |
| 65 to 74 Years | 0 (0.0%) | 0 (0.0%) |
| 75 Years and over | 0 (0.0%) | 0 (0.0%) |
Disability Class: Ambulatory Difficulty
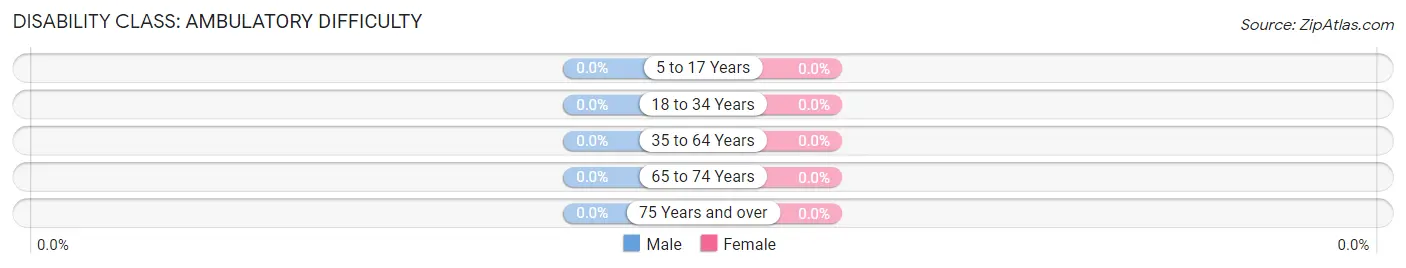
| Age Bracket | Male | Female |
| 5 to 17 Years | 0 (0.0%) | 0 (0.0%) |
| 18 to 34 Years | 0 (0.0%) | 0 (0.0%) |
| 35 to 64 Years | 0 (0.0%) | 0 (0.0%) |
| 65 to 74 Years | 0 (0.0%) | 0 (0.0%) |
| 75 Years and over | 0 (0.0%) | 0 (0.0%) |
Disability Class: Self-Care Difficulty
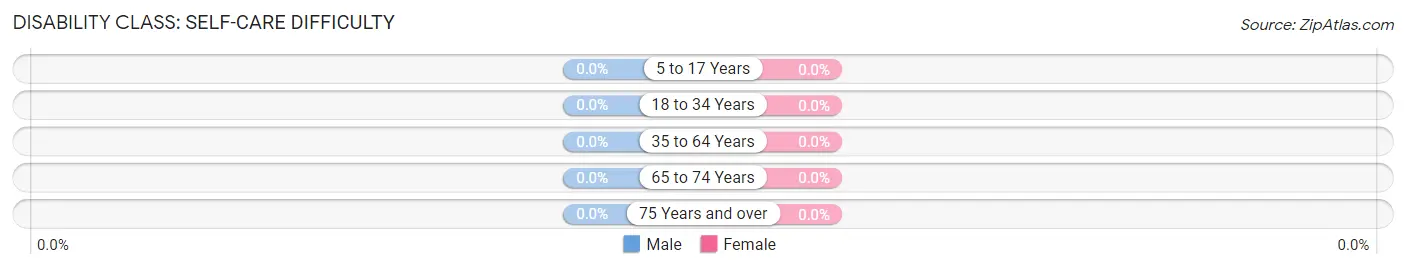
| Age Bracket | Male | Female |
| 5 to 17 Years | 0 (0.0%) | 0 (0.0%) |
| 18 to 34 Years | 0 (0.0%) | 0 (0.0%) |
| 35 to 64 Years | 0 (0.0%) | 0 (0.0%) |
| 65 to 74 Years | 0 (0.0%) | 0 (0.0%) |
| 75 Years and over | 0 (0.0%) | 0 (0.0%) |
Technology Access in Wainiha
Computing Device Access in Wainiha
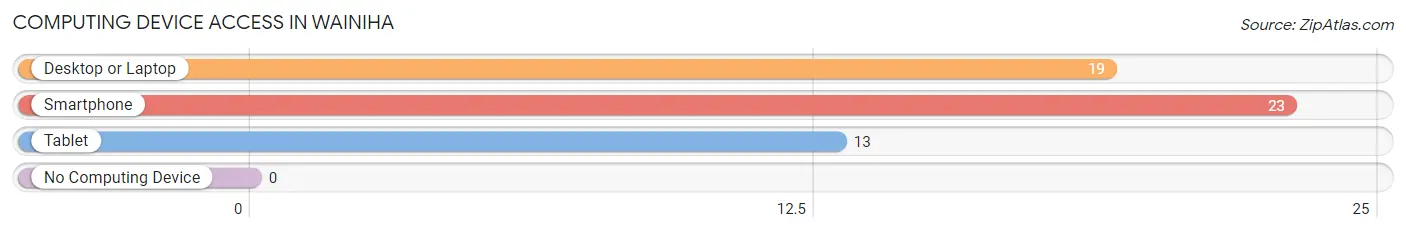
| Device Type | # Households | % Households |
| Desktop or Laptop | 19 | 79.2% |
| Smartphone | 23 | 95.8% |
| Tablet | 13 | 54.2% |
| No Computing Device | 0 | 0.0% |
| Total | 24 | 100.0% |
Internet Access in Wainiha
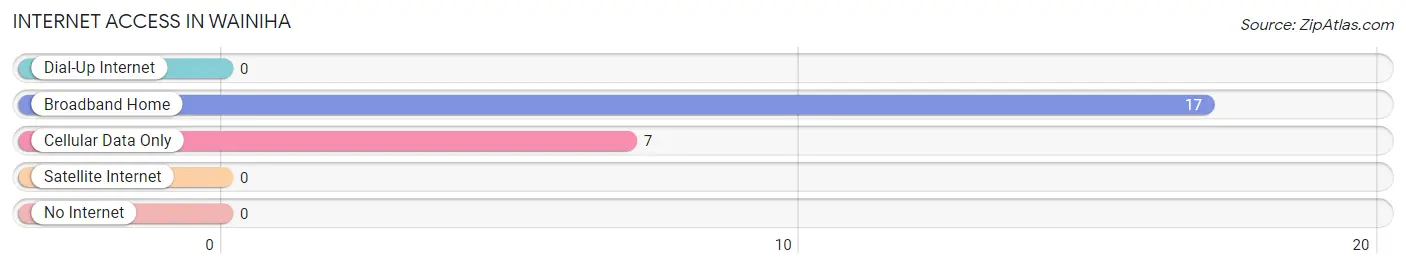
| Internet Type | # Households | % Households |
| Dial-Up Internet | 0 | 0.0% |
| Broadband Home | 17 | 70.8% |
| Cellular Data Only | 7 | 29.2% |
| Satellite Internet | 0 | 0.0% |
| No Internet | 0 | 0.0% |
| Total | 24 | 100.0% |
Wainiha Summary
Wainiha is a small unincorporated community located on the north shore of the Hawaiian island of Kauai. It is situated between the towns of Hanalei and Haena, and is part of the larger Hanalei District. The population of Wainiha was estimated to be around 500 people in 2020.
History
The area of Wainiha has been inhabited for centuries by the native Hawaiian people. The first recorded European contact with the area was in 1778, when Captain James Cook and his crew visited the area. The area was later settled by missionaries in the early 1800s, and the first sugar plantation was established in the area in 1835.
The area was later developed for tourism in the late 1800s, and the first hotel was built in the area in 1891. The area was also home to a number of small farms and ranches, and the first post office was established in the area in 1895.
Geography
Wainiha is located on the north shore of Kauai, and is situated between the towns of Hanalei and Haena. The area is surrounded by lush tropical rainforest, and is home to a number of waterfalls and streams. The area is also home to a number of beaches, including Lumahai Beach, which is a popular surfing spot.
The climate in Wainiha is tropical, with temperatures ranging from the mid-70s to the mid-80s throughout the year. The area receives an average of around 50 inches of rain per year, and is prone to occasional flooding due to its proximity to the ocean.
Economy
The economy of Wainiha is largely based on tourism, with a number of hotels, resorts, and vacation rentals located in the area. The area is also home to a number of small farms and ranches, and the local economy is supported by the sale of locally grown produce and livestock.
The area is also home to a number of small businesses, including restaurants, shops, and galleries. The area is also home to a number of artisans, who create a variety of handmade items, such as jewelry, pottery, and wood carvings.
Demographics
The population of Wainiha was estimated to be around 500 people in 2020. The majority of the population is of Native Hawaiian descent, and the area is also home to a number of other ethnicities, including Filipino, Japanese, and Chinese. The median household income in the area is around $50,000, and the median home value is around $400,000.
The area is served by a number of public schools, including Wainiha Elementary School and Hanalei High School. The area is also home to a number of private schools, including the Hanalei Christian Academy and the Wainiha Christian Academy.
Conclusion
Wainiha is a small unincorporated community located on the north shore of the Hawaiian island of Kauai. It is situated between the towns of Hanalei and Haena, and is part of the larger Hanalei District. The population of Wainiha was estimated to be around 500 people in 2020. The economy of Wainiha is largely based on tourism, with a number of hotels, resorts, and vacation rentals located in the area. The majority of the population is of Native Hawaiian descent, and the area is also home to a number of other ethnicities, including Filipino, Japanese, and Chinese. The area is served by a number of public schools, and is also home to a number of private schools.
Common Questions
What is Per Capita Income in Wainiha?
Per Capita income in Wainiha is $26,820.
What is the Median Family Income in Wainiha?
Median Family Income in Wainiha is $146,000.
What is Income or Wage Gap in Wainiha?
Income or Wage Gap in Wainiha is 68.2%.
Women in Wainiha earn 31.8 cents for every dollar earned by a man.
What is Inequality or Gini Index in Wainiha?
Inequality or Gini Index in Wainiha is 0.30.
What is the Total Population of Wainiha?
Total Population of Wainiha is 130.
What is the Total Male Population of Wainiha?
Total Male Population of Wainiha is 59.
What is the Total Female Population of Wainiha?
Total Female Population of Wainiha is 71.
What is the Ratio of Males per 100 Females in Wainiha?
There are 83.10 Males per 100 Females in Wainiha.
What is the Ratio of Females per 100 Males in Wainiha?
There are 120.34 Females per 100 Males in Wainiha.
What is the Median Population Age in Wainiha?
Median Population Age in Wainiha is 43.0 Years.
What is the Average Family Size in Wainiha
Average Family Size in Wainiha is 6.6 People.
What is the Average Household Size in Wainiha
Average Household Size in Wainiha is 5.4 People.
How Large is the Labor Force in Wainiha?
There are 61 People in the Labor Forcein in Wainiha.
What is the Percentage of People in the Labor Force in Wainiha?
64.2% of People are in the Labor Force in Wainiha.
What is the Unemployment Rate in Wainiha?
Unemployment Rate in Wainiha is 9.8%.