Maunawili, HI Map & Demographics
Maunawili Map
Maunawili Overview
$72,088
PER CAPITA INCOME
$181,500
AVG FAMILY INCOME
$169,375
AVG HOUSEHOLD INCOME
47.4%
WAGE / INCOME GAP [ % ]
52.6¢/ $1
WAGE / INCOME GAP [ $ ]
0.37
INEQUALITY / GINI INDEX
2,067
TOTAL POPULATION
1,037
MALE POPULATION
1,030
FEMALE POPULATION
100.68
MALES / 100 FEMALES
99.32
FEMALES / 100 MALES
52.6
MEDIAN AGE
3.0
AVG FAMILY SIZE
3.0
AVG HOUSEHOLD SIZE
1,142
LABOR FORCE [ PEOPLE ]
64.4%
PERCENT IN LABOR FORCE
2.1%
UNEMPLOYMENT RATE
Income in Maunawili
Income Overview in Maunawili
Per Capita Income in Maunawili is $72,088, while median incomes of families and households are $181,500 and $169,375 respectively.
| Characteristic | Number | Measure |
| Per Capita Income | 2,067 | $72,088 |
| Median Family Income | 602 | $181,500 |
| Mean Family Income | 602 | $216,514 |
| Median Household Income | 697 | $169,375 |
| Mean Household Income | 697 | $209,726 |
| Income Deficit | 602 | $0 |
| Wage / Income Gap (%) | 2,067 | 47.37% |
| Wage / Income Gap ($) | 2,067 | 52.63¢ per $1 |
| Gini / Inequality Index | 2,067 | 0.37 |
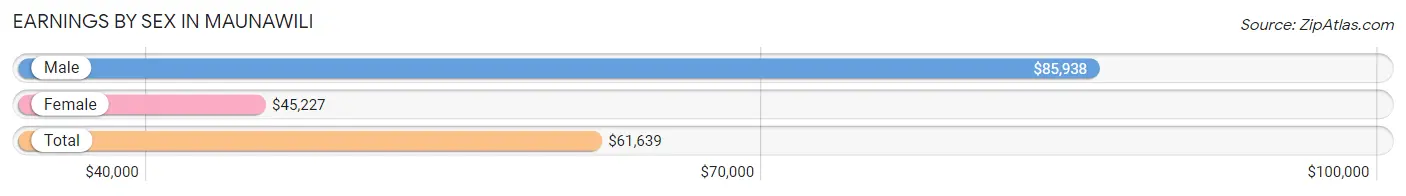
Earnings by Sex in Maunawili
Average Earnings in Maunawili are $61,639, $85,938 for men and $45,227 for women, a difference of 47.4%.
| Sex | Number | Average Earnings |
| Male | 608 (51.2%) | $85,938 |
| Female | 580 (48.8%) | $45,227 |
| Total | 1,188 (100.0%) | $61,639 |
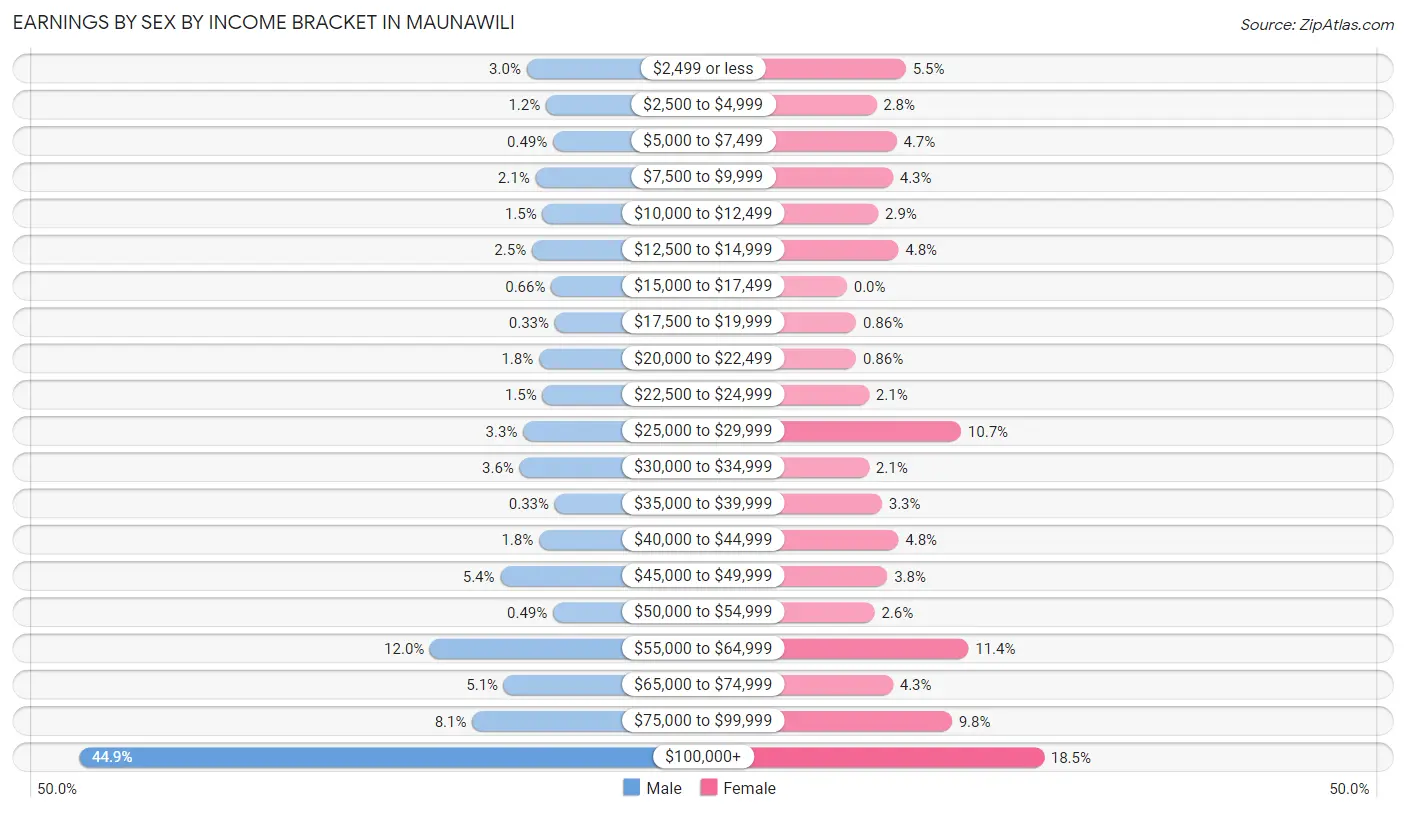
Earnings by Sex by Income Bracket in Maunawili
The most common earnings brackets in Maunawili are $100,000+ for men (273 | 44.9%) and $100,000+ for women (107 | 18.4%).
| Income | Male | Female |
| $2,499 or less | 18 (3.0%) | 32 (5.5%) |
| $2,500 to $4,999 | 7 (1.1%) | 16 (2.8%) |
| $5,000 to $7,499 | 3 (0.5%) | 27 (4.7%) |
| $7,500 to $9,999 | 13 (2.1%) | 25 (4.3%) |
| $10,000 to $12,499 | 9 (1.5%) | 17 (2.9%) |
| $12,500 to $14,999 | 15 (2.5%) | 28 (4.8%) |
| $15,000 to $17,499 | 4 (0.7%) | 0 (0.0%) |
| $17,500 to $19,999 | 2 (0.3%) | 5 (0.9%) |
| $20,000 to $22,499 | 11 (1.8%) | 5 (0.9%) |
| $22,500 to $24,999 | 9 (1.5%) | 12 (2.1%) |
| $25,000 to $29,999 | 20 (3.3%) | 62 (10.7%) |
| $30,000 to $34,999 | 22 (3.6%) | 12 (2.1%) |
| $35,000 to $39,999 | 2 (0.3%) | 19 (3.3%) |
| $40,000 to $44,999 | 11 (1.8%) | 28 (4.8%) |
| $45,000 to $49,999 | 33 (5.4%) | 22 (3.8%) |
| $50,000 to $54,999 | 3 (0.5%) | 15 (2.6%) |
| $55,000 to $64,999 | 73 (12.0%) | 66 (11.4%) |
| $65,000 to $74,999 | 31 (5.1%) | 25 (4.3%) |
| $75,000 to $99,999 | 49 (8.1%) | 57 (9.8%) |
| $100,000+ | 273 (44.9%) | 107 (18.4%) |
| Total | 608 (100.0%) | 580 (100.0%) |
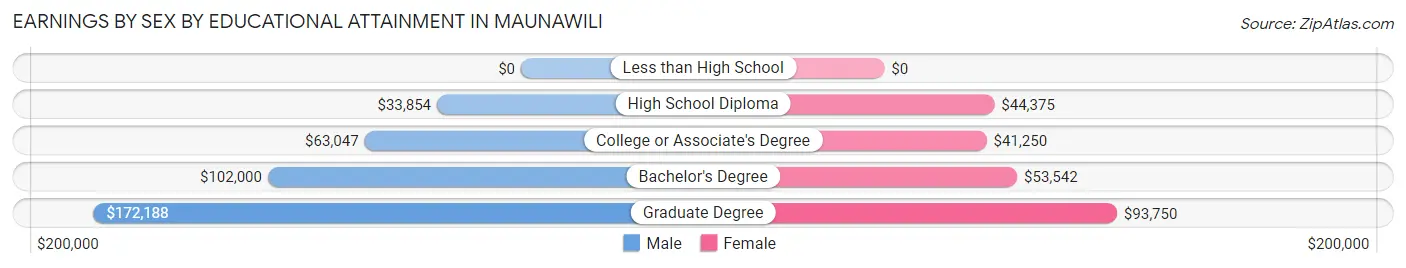
Earnings by Sex by Educational Attainment in Maunawili
Average earnings in Maunawili are $91,094 for men and $57,321 for women, a difference of 37.1%. Men with an educational attainment of graduate degree enjoy the highest average annual earnings of $172,188, while those with high school diploma education earn the least with $33,854. Women with an educational attainment of graduate degree earn the most with the average annual earnings of $93,750, while those with college or associate's degree education have the smallest earnings of $41,250.
| Educational Attainment | Male Income | Female Income |
| Less than High School | - | - |
| High School Diploma | $33,854 | $44,375 |
| College or Associate's Degree | $63,047 | $41,250 |
| Bachelor's Degree | $102,000 | $53,542 |
| Graduate Degree | $172,188 | $93,750 |
| Total | $91,094 | $57,321 |
Family Income in Maunawili
Family Income Brackets in Maunawili
According to the Maunawili family income data, there are 289 families falling into the $200,000+ income range, which is the most common income bracket and makes up 48.0% of all families.
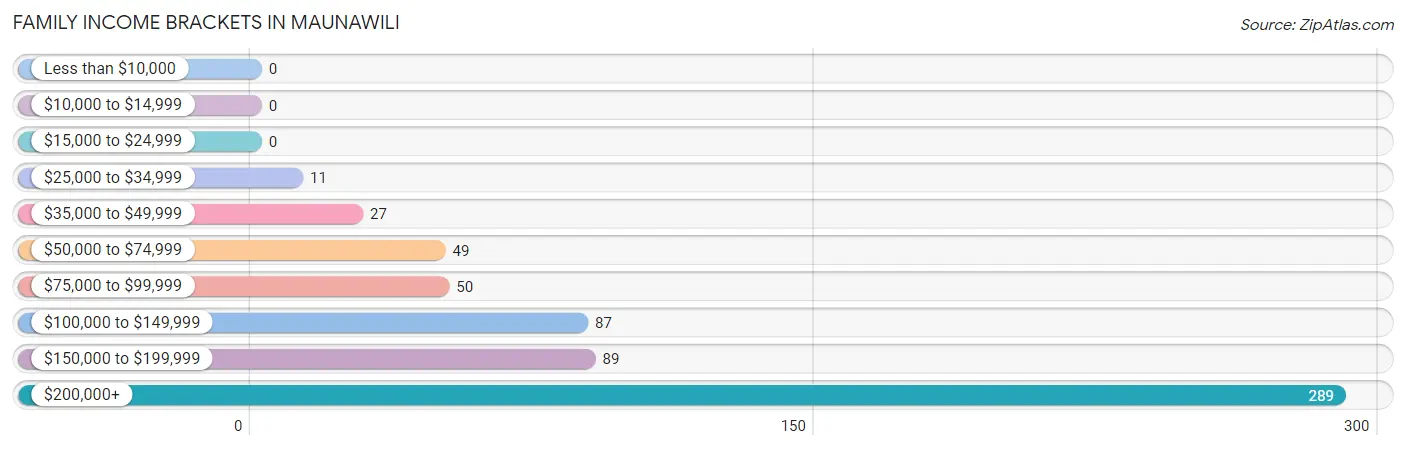
| Income Bracket | # Families | % Families |
| Less than $10,000 | 0 | 0.0% |
| $10,000 to $14,999 | 0 | 0.0% |
| $15,000 to $24,999 | 0 | 0.0% |
| $25,000 to $34,999 | 11 | 1.8% |
| $35,000 to $49,999 | 27 | 4.5% |
| $50,000 to $74,999 | 49 | 8.1% |
| $75,000 to $99,999 | 50 | 8.3% |
| $100,000 to $149,999 | 87 | 14.5% |
| $150,000 to $199,999 | 89 | 14.8% |
| $200,000+ | 289 | 48.0% |
Family Income by Famaliy Size in Maunawili
5-person families (53 | 8.8%) account for the highest median family income in Maunawili with $250,001 per family, while 2-person families (295 | 49.0%) have the highest median income of $75,104 per family member.
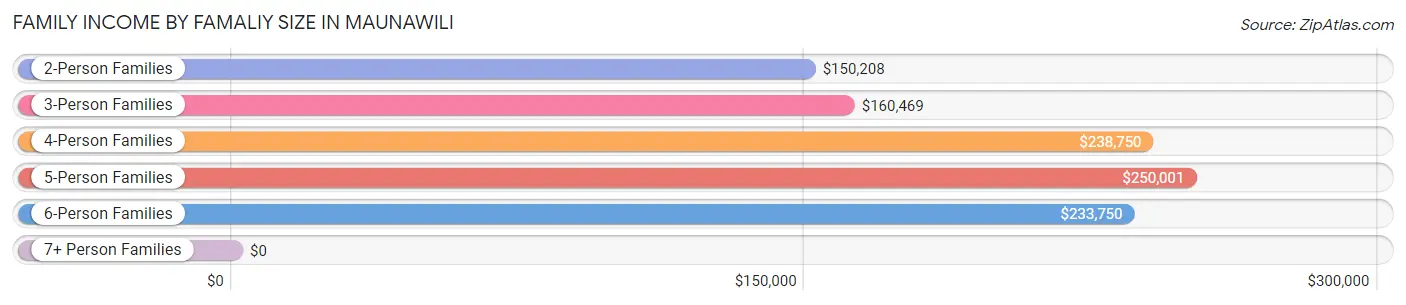
| Income Bracket | # Families | Median Income |
| 2-Person Families | 295 (49.0%) | $150,208 |
| 3-Person Families | 107 (17.8%) | $160,469 |
| 4-Person Families | 126 (20.9%) | $238,750 |
| 5-Person Families | 53 (8.8%) | $250,001 |
| 6-Person Families | 17 (2.8%) | $233,750 |
| 7+ Person Families | 4 (0.7%) | $0 |
| Total | 602 (100.0%) | $181,500 |
Family Income by Number of Earners in Maunawili
The median family income in Maunawili is $181,500, with families comprising 3+ earners (85) having the highest median family income of $250,001, while families with no earners (84) have the lowest median family income of $106,667, accounting for 14.1% and 14.0% of families, respectively.
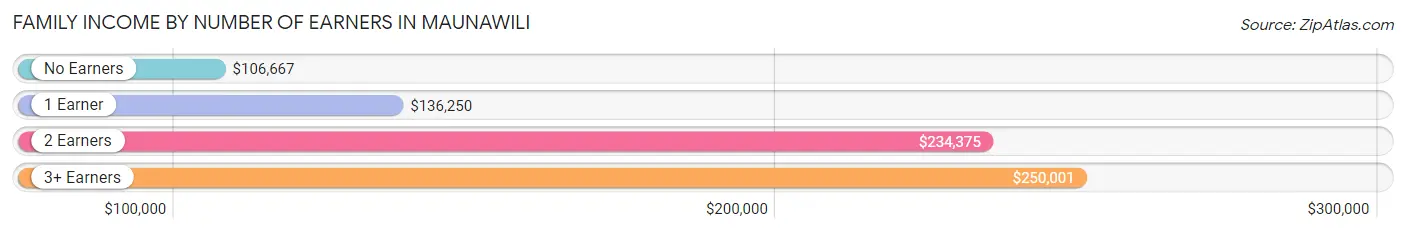
| Number of Earners | # Families | Median Income |
| No Earners | 84 (14.0%) | $106,667 |
| 1 Earner | 159 (26.4%) | $136,250 |
| 2 Earners | 274 (45.5%) | $234,375 |
| 3+ Earners | 85 (14.1%) | $250,001 |
| Total | 602 (100.0%) | $181,500 |
Household Income in Maunawili
Household Income Brackets in Maunawili
With 310 households falling in the category, the $200,000+ income range is the most frequent in Maunawili, accounting for 44.5% of all households.
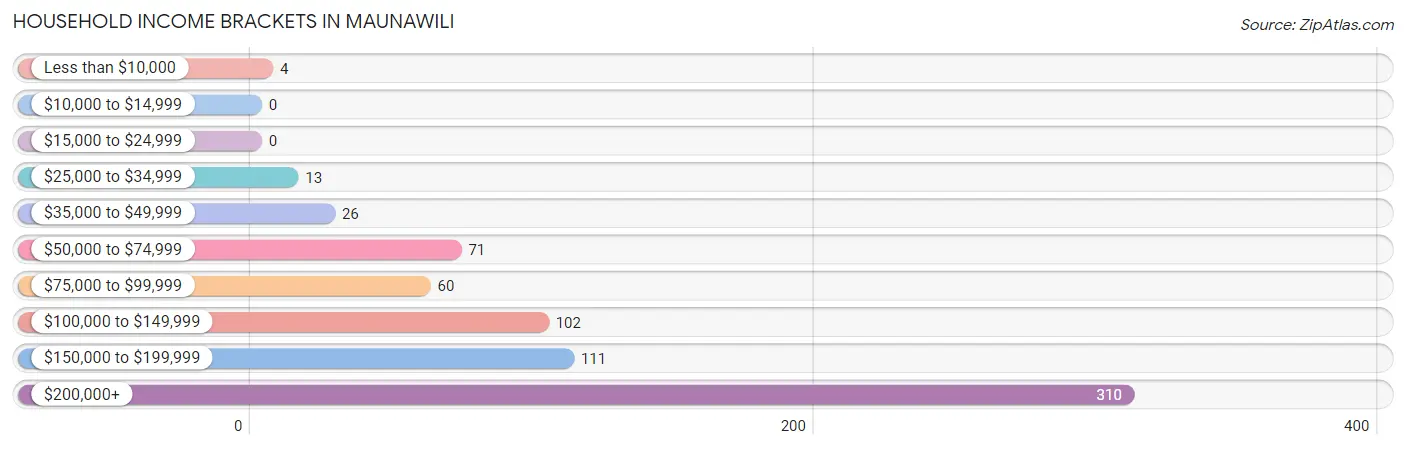
| Income Bracket | # Households | % Households |
| Less than $10,000 | 4 | 0.6% |
| $10,000 to $14,999 | 0 | 0.0% |
| $15,000 to $24,999 | 0 | 0.0% |
| $25,000 to $34,999 | 13 | 1.9% |
| $35,000 to $49,999 | 26 | 3.7% |
| $50,000 to $74,999 | 71 | 10.2% |
| $75,000 to $99,999 | 60 | 8.6% |
| $100,000 to $149,999 | 102 | 14.6% |
| $150,000 to $199,999 | 111 | 15.9% |
| $200,000+ | 310 | 44.5% |
Household Income by Householder Age in Maunawili
The median household income in Maunawili is $169,375, with the highest median household income of $250,001 found in the 45 to 64 years age bracket for the primary householder. A total of 247 households (35.4%) fall into this category.
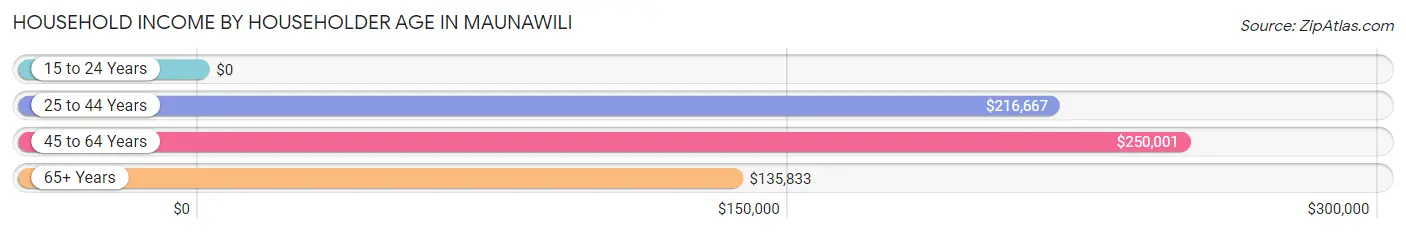
| Income Bracket | # Households | Median Income |
| 15 to 24 Years | 0 (0.0%) | $0 |
| 25 to 44 Years | 112 (16.1%) | $216,667 |
| 45 to 64 Years | 247 (35.4%) | $250,001 |
| 65+ Years | 338 (48.5%) | $135,833 |
| Total | 697 (100.0%) | $169,375 |
Poverty in Maunawili
Income Below Poverty by Sex and Age in Maunawili
With 1.2% poverty level for males and 3.3% for females among the residents of Maunawili, 16 and 17 year old males and 25 to 34 year old females are the most vulnerable to poverty, with 3 males (15.8%) and 17 females (22.1%) in their respective age groups living below the poverty level.
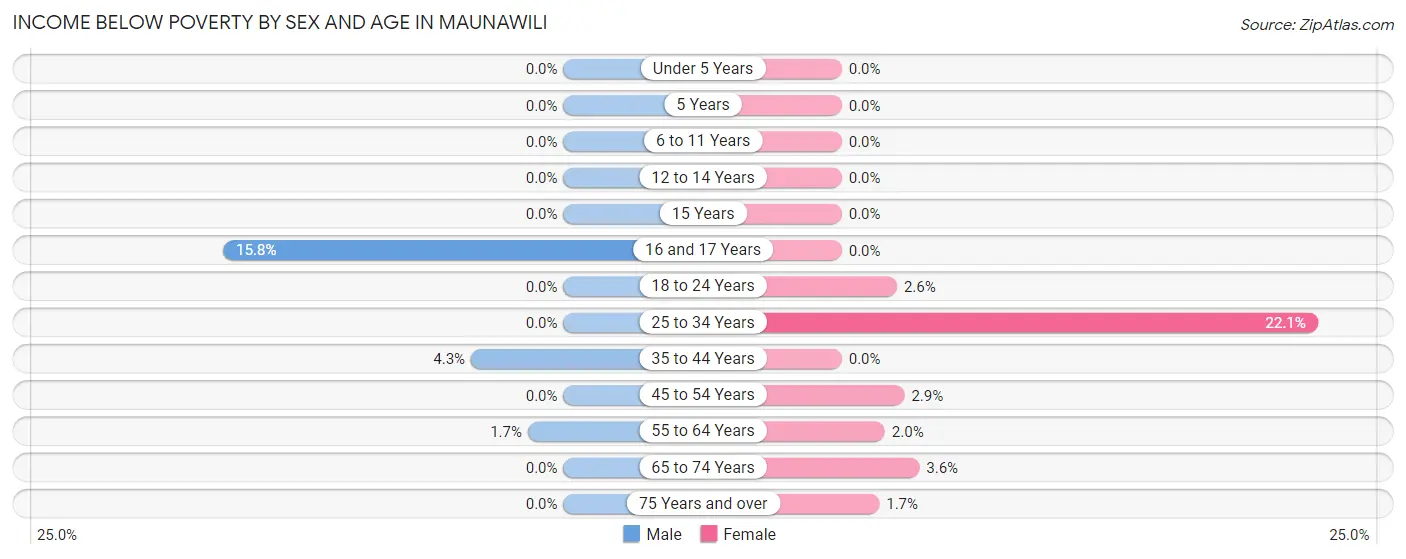
| Age Bracket | Male | Female |
| Under 5 Years | 0 (0.0%) | 0 (0.0%) |
| 5 Years | 0 (0.0%) | 0 (0.0%) |
| 6 to 11 Years | 0 (0.0%) | 0 (0.0%) |
| 12 to 14 Years | 0 (0.0%) | 0 (0.0%) |
| 15 Years | 0 (0.0%) | 0 (0.0%) |
| 16 and 17 Years | 3 (15.8%) | 0 (0.0%) |
| 18 to 24 Years | 0 (0.0%) | 2 (2.6%) |
| 25 to 34 Years | 0 (0.0%) | 17 (22.1%) |
| 35 to 44 Years | 6 (4.3%) | 0 (0.0%) |
| 45 to 54 Years | 0 (0.0%) | 3 (2.9%) |
| 55 to 64 Years | 3 (1.7%) | 4 (2.0%) |
| 65 to 74 Years | 0 (0.0%) | 5 (3.6%) |
| 75 Years and over | 0 (0.0%) | 3 (1.7%) |
| Total | 12 (1.2%) | 34 (3.3%) |
Income Above Poverty by Sex and Age in Maunawili
According to the poverty statistics in Maunawili, males aged under 5 years and females aged under 5 years are the age groups that are most secure financially, with 100.0% of males and 100.0% of females in these age groups living above the poverty line.
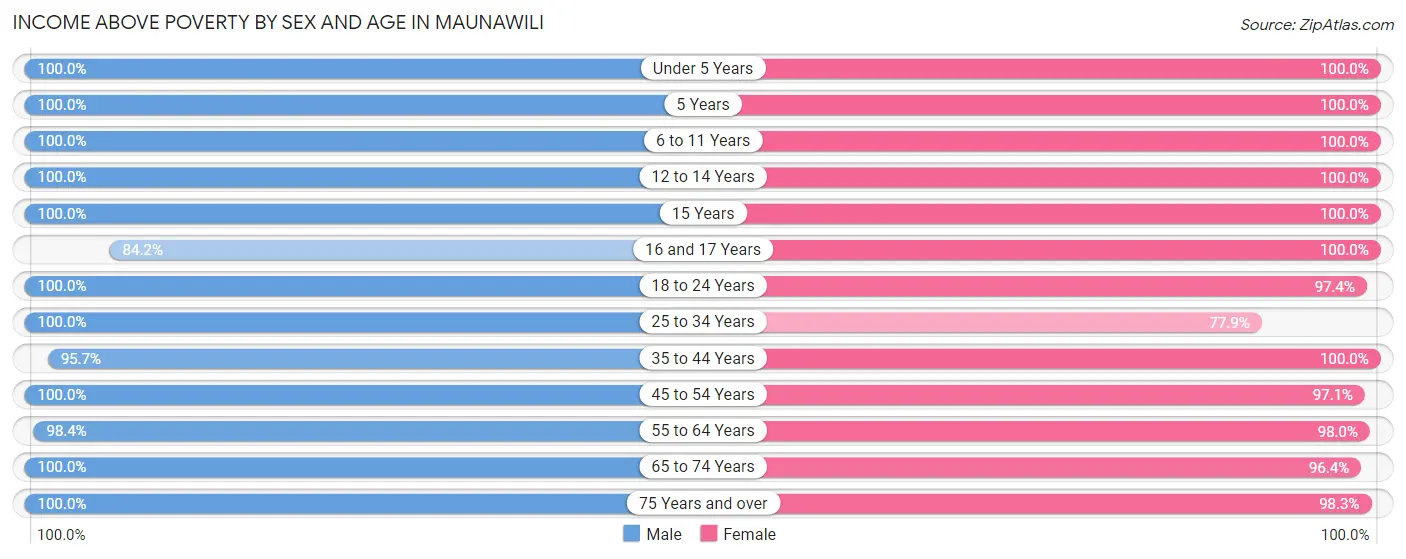
| Age Bracket | Male | Female |
| Under 5 Years | 48 (100.0%) | 21 (100.0%) |
| 5 Years | 22 (100.0%) | 4 (100.0%) |
| 6 to 11 Years | 67 (100.0%) | 41 (100.0%) |
| 12 to 14 Years | 26 (100.0%) | 23 (100.0%) |
| 15 Years | 11 (100.0%) | 26 (100.0%) |
| 16 and 17 Years | 16 (84.2%) | 14 (100.0%) |
| 18 to 24 Years | 37 (100.0%) | 76 (97.4%) |
| 25 to 34 Years | 79 (100.0%) | 60 (77.9%) |
| 35 to 44 Years | 134 (95.7%) | 130 (100.0%) |
| 45 to 54 Years | 119 (100.0%) | 100 (97.1%) |
| 55 to 64 Years | 179 (98.4%) | 196 (98.0%) |
| 65 to 74 Years | 161 (100.0%) | 134 (96.4%) |
| 75 Years and over | 123 (100.0%) | 169 (98.3%) |
| Total | 1,022 (98.8%) | 994 (96.7%) |
Income Below Poverty Among Married-Couple Families in Maunawili
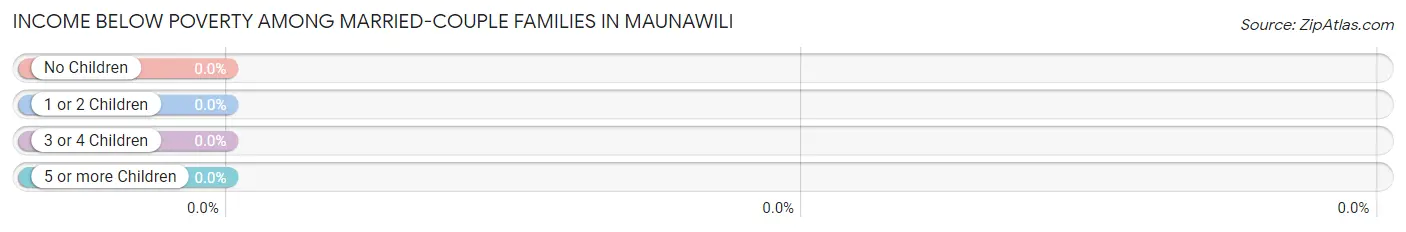
| Children | Above Poverty | Below Poverty |
| No Children | 362 (100.0%) | 0 (0.0%) |
| 1 or 2 Children | 125 (100.0%) | 0 (0.0%) |
| 3 or 4 Children | 30 (100.0%) | 0 (0.0%) |
| 5 or more Children | 0 (0.0%) | 0 (0.0%) |
| Total | 517 (100.0%) | 0 (0.0%) |
Income Below Poverty Among Single-Parent Households in Maunawili
| Children | Single Father | Single Mother |
| No Children | 0 (0.0%) | 0 (0.0%) |
| 1 or 2 Children | 0 (0.0%) | 0 (0.0%) |
| 3 or 4 Children | 0 (0.0%) | 0 (0.0%) |
| 5 or more Children | 0 (0.0%) | 0 (0.0%) |
| Total | 0 (0.0%) | 0 (0.0%) |
Income Below Poverty Among Married-Couple vs Single-Parent Households in Maunawili
| Children | Married-Couple Families | Single-Parent Households |
| No Children | 0 (0.0%) | 0 (0.0%) |
| 1 or 2 Children | 0 (0.0%) | 0 (0.0%) |
| 3 or 4 Children | 0 (0.0%) | 0 (0.0%) |
| 5 or more Children | 0 (0.0%) | 0 (0.0%) |
| Total | 0 (0.0%) | 0 (0.0%) |
Race in Maunawili
The most populous races in Maunawili are Asian (763 | 36.9%), Two or more Races (608 | 29.4%), and White / Caucasian (573 | 27.7%).
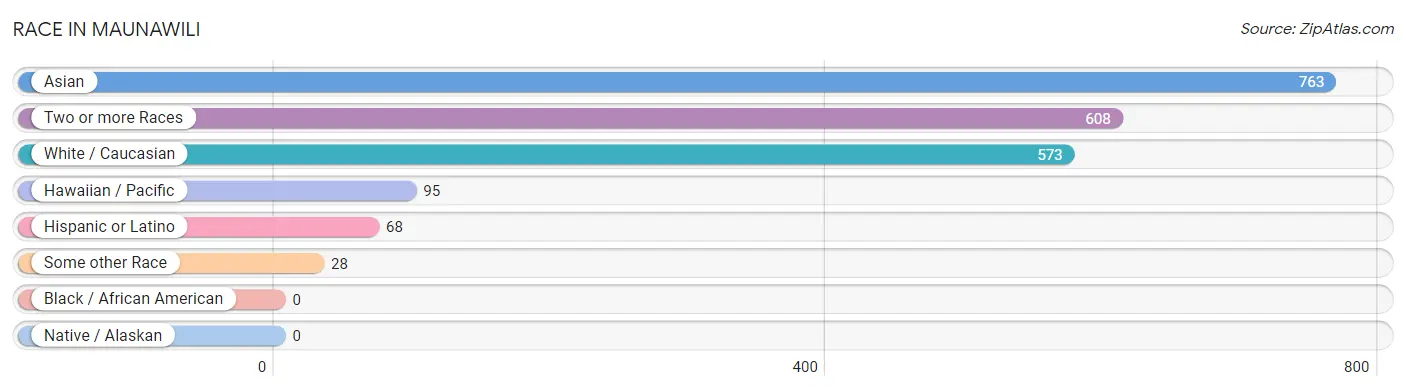
| Race | # Population | % Population |
| Asian | 763 | 36.9% |
| Black / African American | 0 | 0.0% |
| Hawaiian / Pacific | 95 | 4.6% |
| Hispanic or Latino | 68 | 3.3% |
| Native / Alaskan | 0 | 0.0% |
| White / Caucasian | 573 | 27.7% |
| Two or more Races | 608 | 29.4% |
| Some other Race | 28 | 1.3% |
| Total | 2,067 | 100.0% |
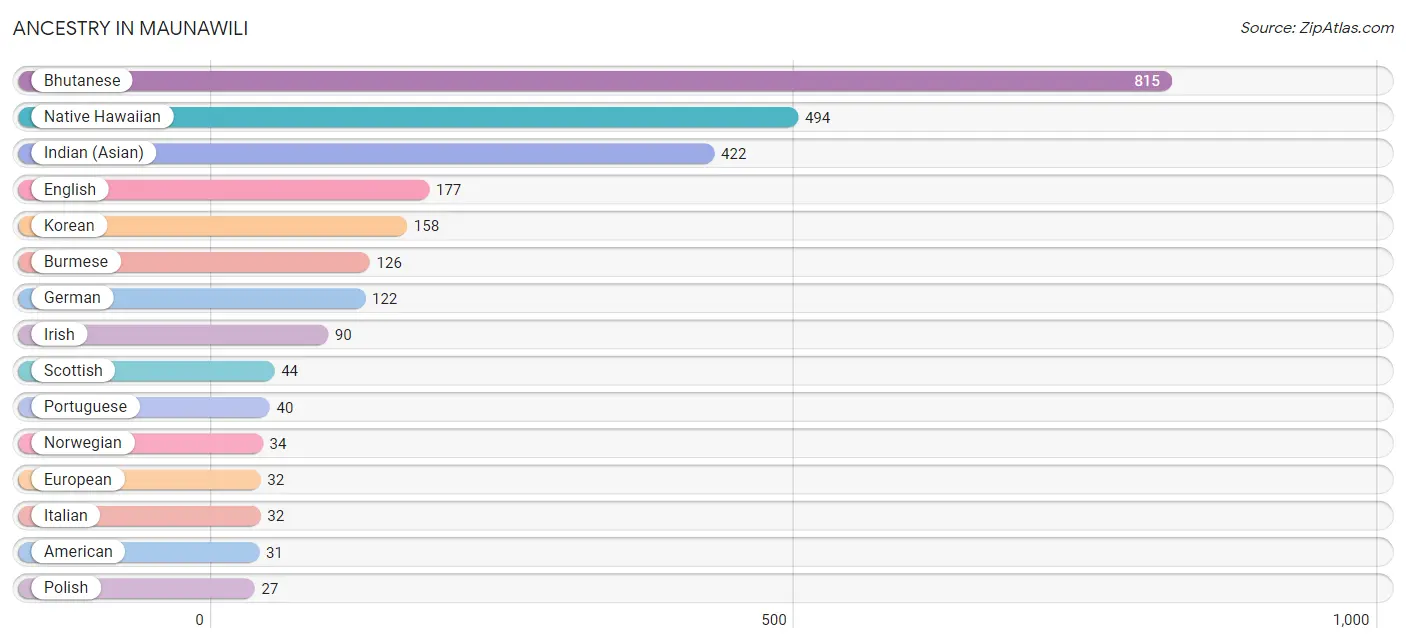
Ancestry in Maunawili
The most populous ancestries reported in Maunawili are Bhutanese (815 | 39.4%), Native Hawaiian (494 | 23.9%), Indian (Asian) (422 | 20.4%), English (177 | 8.6%), and Korean (158 | 7.6%), together accounting for 99.9% of all Maunawili residents.
| Ancestry | # Population | % Population |
| American | 31 | 1.5% |
| Australian | 2 | 0.1% |
| Bangladeshi | 7 | 0.3% |
| Bhutanese | 815 | 39.4% |
| Burmese | 126 | 6.1% |
| Cajun | 3 | 0.2% |
| Canadian | 15 | 0.7% |
| Cherokee | 9 | 0.4% |
| Chinese | 8 | 0.4% |
| Croatian | 1 | 0.1% |
| Danish | 9 | 0.4% |
| Dutch | 3 | 0.2% |
| English | 177 | 8.6% |
| European | 32 | 1.5% |
| Fijian | 10 | 0.5% |
| French | 26 | 1.3% |
| French Canadian | 8 | 0.4% |
| German | 122 | 5.9% |
| Hungarian | 22 | 1.1% |
| Indian (Asian) | 422 | 20.4% |
| Iranian | 9 | 0.4% |
| Irish | 90 | 4.3% |
| Iroquois | 2 | 0.1% |
| Italian | 32 | 1.5% |
| Korean | 158 | 7.6% |
| Lithuanian | 7 | 0.3% |
| Mexican | 11 | 0.5% |
| Native Hawaiian | 494 | 23.9% |
| Northern European | 11 | 0.5% |
| Norwegian | 34 | 1.6% |
| Pakistani | 5 | 0.2% |
| Polish | 27 | 1.3% |
| Portuguese | 40 | 1.9% |
| Puerto Rican | 10 | 0.5% |
| Russian | 12 | 0.6% |
| Samoan | 23 | 1.1% |
| Scotch-Irish | 6 | 0.3% |
| Scottish | 44 | 2.1% |
| Slovak | 2 | 0.1% |
| South American | 27 | 1.3% |
| Soviet Union | 19 | 0.9% |
| Spaniard | 14 | 0.7% |
| Spanish | 5 | 0.2% |
| Sri Lankan | 2 | 0.1% |
| Swedish | 2 | 0.1% |
| Thai | 13 | 0.6% |
| Tongan | 19 | 0.9% |
| Ukrainian | 2 | 0.1% |
| Venezuelan | 27 | 1.3% |
| Welsh | 17 | 0.8% | View All 50 Rows |
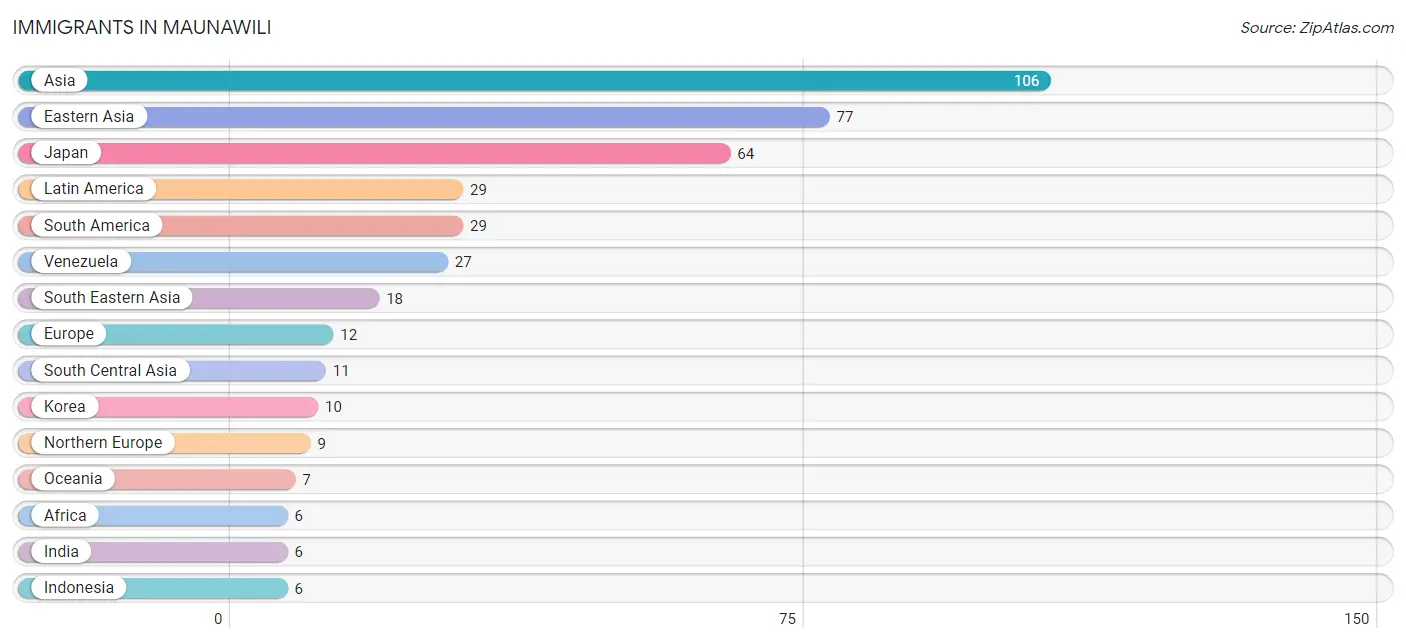
Immigrants in Maunawili
The most numerous immigrant groups reported in Maunawili came from Asia (106 | 5.1%), Eastern Asia (77 | 3.7%), Japan (64 | 3.1%), Latin America (29 | 1.4%), and South America (29 | 1.4%), together accounting for 14.8% of all Maunawili residents.
| Immigration Origin | # Population | % Population |
| Africa | 6 | 0.3% |
| Argentina | 2 | 0.1% |
| Asia | 106 | 5.1% |
| Australia | 2 | 0.1% |
| Canada | 3 | 0.2% |
| China | 3 | 0.2% |
| Croatia | 1 | 0.1% |
| Eastern Asia | 77 | 3.7% |
| Eastern Europe | 3 | 0.2% |
| Europe | 12 | 0.6% |
| India | 6 | 0.3% |
| Indonesia | 6 | 0.3% |
| Iran | 5 | 0.2% |
| Ireland | 5 | 0.2% |
| Japan | 64 | 3.1% |
| Korea | 10 | 0.5% |
| Latin America | 29 | 1.4% |
| Northern Europe | 9 | 0.4% |
| Oceania | 7 | 0.3% |
| Philippines | 3 | 0.2% |
| South Africa | 6 | 0.3% |
| South America | 29 | 1.4% |
| South Central Asia | 11 | 0.5% |
| South Eastern Asia | 18 | 0.9% |
| Taiwan | 3 | 0.2% |
| Thailand | 5 | 0.2% |
| Ukraine | 2 | 0.1% |
| Venezuela | 27 | 1.3% |
| Vietnam | 4 | 0.2% | View All 29 Rows |
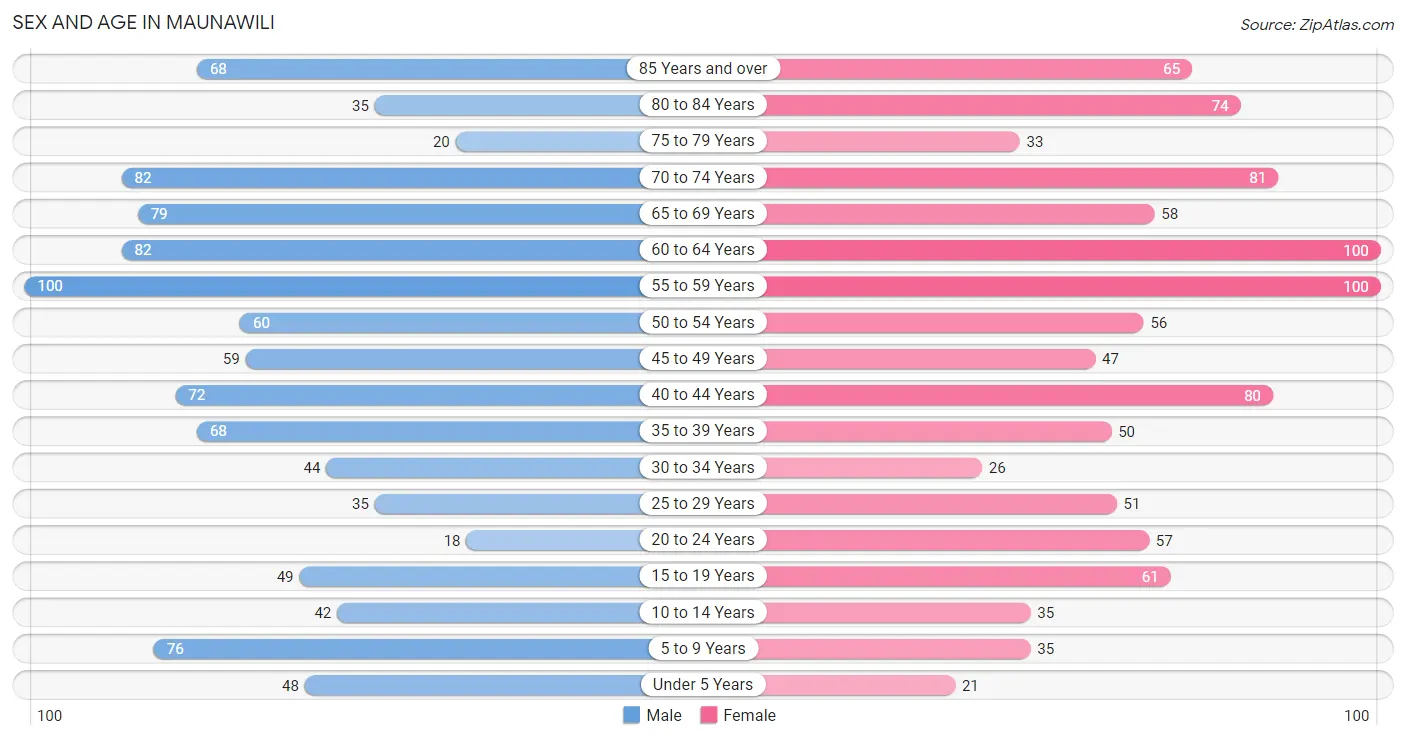
Sex and Age in Maunawili
Sex and Age in Maunawili
The most populous age groups in Maunawili are 55 to 59 Years (100 | 9.6%) for men and 55 to 59 Years (100 | 9.7%) for women.
| Age Bracket | Male | Female |
| Under 5 Years | 48 (4.6%) | 21 (2.0%) |
| 5 to 9 Years | 76 (7.3%) | 35 (3.4%) |
| 10 to 14 Years | 42 (4.1%) | 35 (3.4%) |
| 15 to 19 Years | 49 (4.7%) | 61 (5.9%) |
| 20 to 24 Years | 18 (1.7%) | 57 (5.5%) |
| 25 to 29 Years | 35 (3.4%) | 51 (5.0%) |
| 30 to 34 Years | 44 (4.2%) | 26 (2.5%) |
| 35 to 39 Years | 68 (6.6%) | 50 (4.9%) |
| 40 to 44 Years | 72 (6.9%) | 80 (7.8%) |
| 45 to 49 Years | 59 (5.7%) | 47 (4.6%) |
| 50 to 54 Years | 60 (5.8%) | 56 (5.4%) |
| 55 to 59 Years | 100 (9.6%) | 100 (9.7%) |
| 60 to 64 Years | 82 (7.9%) | 100 (9.7%) |
| 65 to 69 Years | 79 (7.6%) | 58 (5.6%) |
| 70 to 74 Years | 82 (7.9%) | 81 (7.9%) |
| 75 to 79 Years | 20 (1.9%) | 33 (3.2%) |
| 80 to 84 Years | 35 (3.4%) | 74 (7.2%) |
| 85 Years and over | 68 (6.6%) | 65 (6.3%) |
| Total | 1,037 (100.0%) | 1,030 (100.0%) |
Families and Households in Maunawili
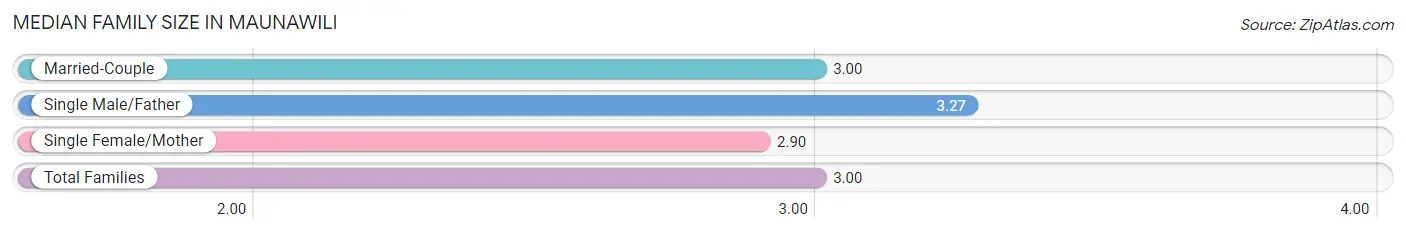
Median Family Size in Maunawili
The median family size in Maunawili is 3.00 persons per family, with single male/father families (33 | 5.5%) accounting for the largest median family size of 3.27 persons per family. On the other hand, single female/mother families (52 | 8.6%) represent the smallest median family size with 2.90 persons per family.
| Family Type | # Families | Family Size |
| Married-Couple | 517 (85.9%) | 3.00 |
| Single Male/Father | 33 (5.5%) | 3.27 |
| Single Female/Mother | 52 (8.6%) | 2.90 |
| Total Families | 602 (100.0%) | 3.00 |
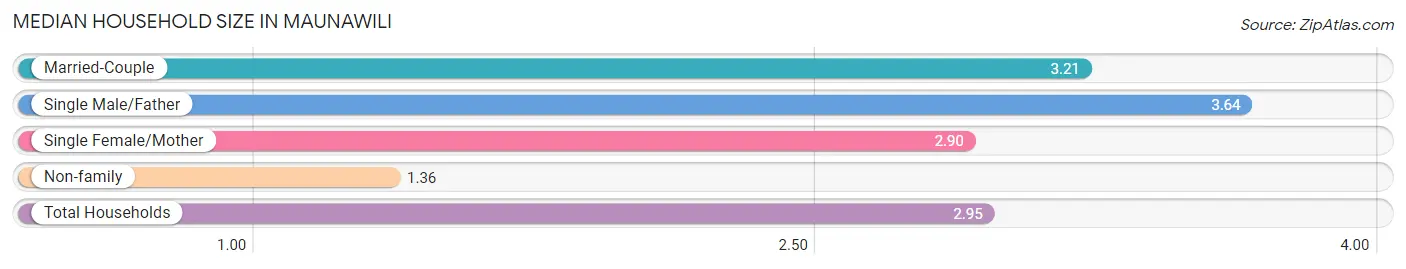
Median Household Size in Maunawili
The median household size in Maunawili is 2.95 persons per household, with single male/father households (33 | 4.7%) accounting for the largest median household size of 3.64 persons per household. non-family households (95 | 13.6%) represent the smallest median household size with 1.36 persons per household.
| Household Type | # Households | Household Size |
| Married-Couple | 517 (74.2%) | 3.21 |
| Single Male/Father | 33 (4.7%) | 3.64 |
| Single Female/Mother | 52 (7.5%) | 2.90 |
| Non-family | 95 (13.6%) | 1.36 |
| Total Households | 697 (100.0%) | 2.95 |
Household Size by Marriage Status in Maunawili
Out of a total of 697 households in Maunawili, 602 (86.4%) are family households, while 95 (13.6%) are nonfamily households. The most numerous type of family households are 2-person households, comprising 281, and the most common type of nonfamily households are 1-person households, comprising 71.
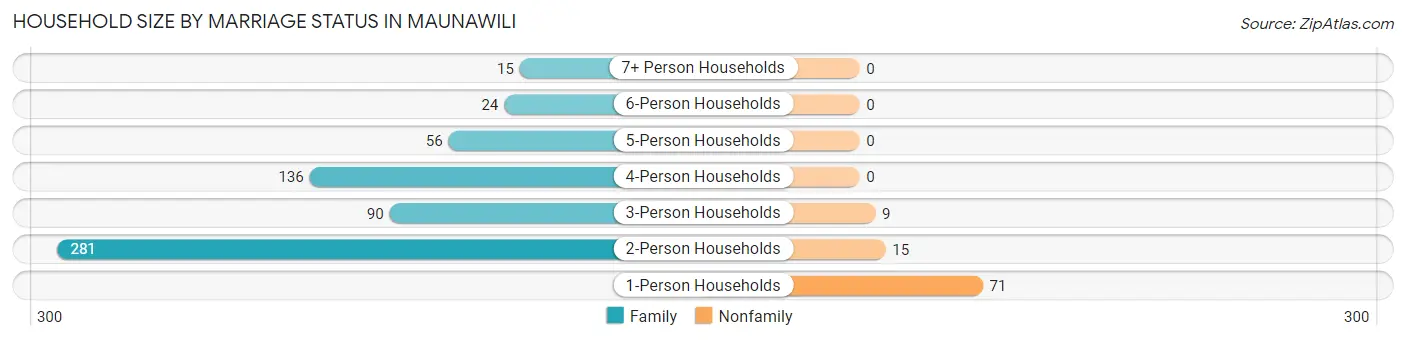
| Household Size | Family Households | Nonfamily Households |
| 1-Person Households | - | 71 (10.2%) |
| 2-Person Households | 281 (40.3%) | 15 (2.1%) |
| 3-Person Households | 90 (12.9%) | 9 (1.3%) |
| 4-Person Households | 136 (19.5%) | 0 (0.0%) |
| 5-Person Households | 56 (8.0%) | 0 (0.0%) |
| 6-Person Households | 24 (3.4%) | 0 (0.0%) |
| 7+ Person Households | 15 (2.1%) | 0 (0.0%) |
| Total | 602 (86.4%) | 95 (13.6%) |
Female Fertility in Maunawili
Fertility by Age in Maunawili
| Age Bracket | Women with Births | Births / 1,000 Women |
| 15 to 19 years | 0 (0.0%) | 0.0 |
| 20 to 34 years | 0 (0.0%) | 0.0 |
| 35 to 50 years | 0 (0.0%) | 0.0 |
| Total | 0 (0.0%) | 0.0 |
Fertility by Age by Marriage Status in Maunawili
| Age Bracket | Married | Unmarried |
| 15 to 19 years | 0 (0.0%) | 0 (0.0%) |
| 20 to 34 years | 0 (0.0%) | 0 (0.0%) |
| 35 to 50 years | 0 (0.0%) | 0 (0.0%) |
| Total | 0 (0.0%) | 0 (0.0%) |
Fertility by Education in Maunawili
| Educational Attainment | Women with Births | Births / 1,000 Women |
| Less than High School | 0 (0.0%) | 0.0 |
| High School Diploma | 0 (0.0%) | 0.0 |
| College or Associate's Degree | 0 (0.0%) | 0.0 |
| Bachelor's Degree | 0 (0.0%) | 0.0 |
| Graduate Degree | 0 (0.0%) | 0.0 |
| Total | 0 (0.0%) | 0.0 |
Fertility by Education by Marriage Status in Maunawili
| Educational Attainment | Married | Unmarried |
| Less than High School | 0 (0.0%) | 0 (0.0%) |
| High School Diploma | 0 (0.0%) | 0 (0.0%) |
| College or Associate's Degree | 0 (0.0%) | 0 (0.0%) |
| Bachelor's Degree | 0 (0.0%) | 0 (0.0%) |
| Graduate Degree | 0 (0.0%) | 0 (0.0%) |
| Total | 0 (0.0%) | 0 (0.0%) |
Employment Characteristics in Maunawili
Employment by Class of Employer in Maunawili
Among the 1,110 employed individuals in Maunawili, private company employees (553 | 49.8%), not-for-profit organizations (133 | 12.0%), and federal government employees (130 | 11.7%) make up the most common classes of employment.
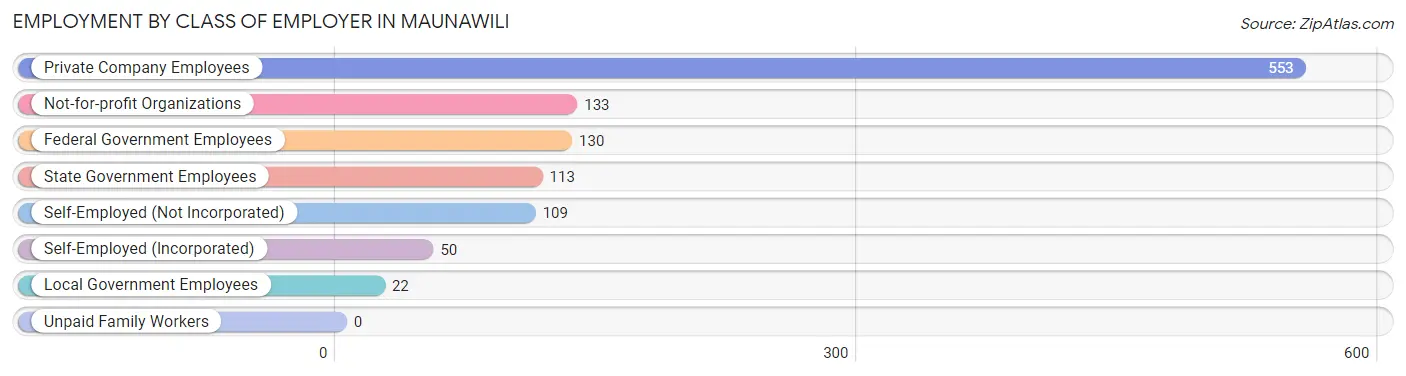
| Employer Class | # Employees | % Employees |
| Private Company Employees | 553 | 49.8% |
| Self-Employed (Incorporated) | 50 | 4.5% |
| Self-Employed (Not Incorporated) | 109 | 9.8% |
| Not-for-profit Organizations | 133 | 12.0% |
| Local Government Employees | 22 | 2.0% |
| State Government Employees | 113 | 10.2% |
| Federal Government Employees | 130 | 11.7% |
| Unpaid Family Workers | 0 | 0.0% |
| Total | 1,110 | 100.0% |
Employment Status by Age in Maunawili
According to the labor force statistics for Maunawili, out of the total population over 16 years of age (1,773), 64.4% or 1,142 individuals are in the labor force, with 2.1% or 24 of them unemployed. The age group with the highest labor force participation rate is 25 to 29 years, with 95.3% or 82 individuals in the labor force. Within the labor force, the 75 years and over age range has the highest percentage of unemployed individuals, with 8.3% or 3 of them being unemployed.
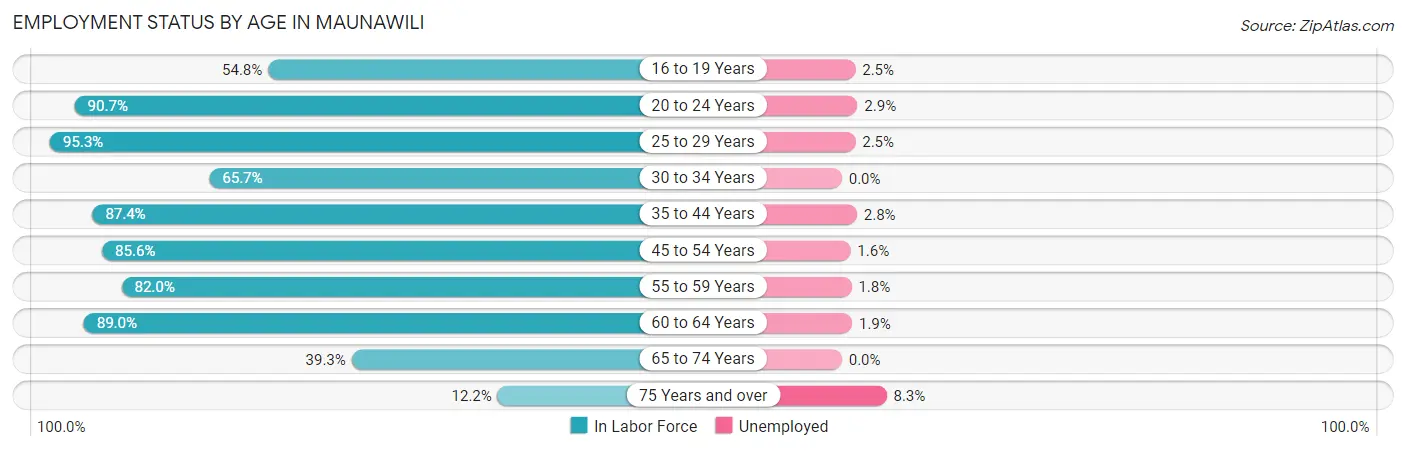
| Age Bracket | In Labor Force | Unemployed |
| 16 to 19 Years | 40 (54.8%) | 1 (2.5%) |
| 20 to 24 Years | 68 (90.7%) | 2 (2.9%) |
| 25 to 29 Years | 82 (95.3%) | 2 (2.5%) |
| 30 to 34 Years | 46 (65.7%) | 0 (0.0%) |
| 35 to 44 Years | 236 (87.4%) | 7 (2.8%) |
| 45 to 54 Years | 190 (85.6%) | 3 (1.6%) |
| 55 to 59 Years | 164 (82.0%) | 3 (1.8%) |
| 60 to 64 Years | 162 (89.0%) | 3 (1.9%) |
| 65 to 74 Years | 118 (39.3%) | 0 (0.0%) |
| 75 Years and over | 36 (12.2%) | 3 (8.3%) |
| Total | 1,142 (64.4%) | 24 (2.1%) |
Employment Status by Educational Attainment in Maunawili
According to labor force statistics for Maunawili, 85.4% of individuals (880) out of the total population between 25 and 64 years of age (1,030) are in the labor force, with 2.0% or 18 of them being unemployed. The group with the highest labor force participation rate are those with the educational attainment of bachelor's degree or higher, with 90.0% or 627 individuals in the labor force. Within the labor force, individuals with college / associate degree education have the highest percentage of unemployment, with 5.1% or 9 of them being unemployed.
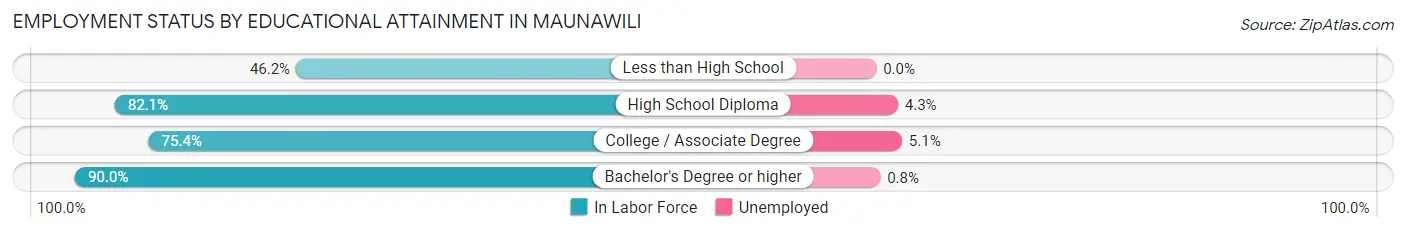
| Educational Attainment | In Labor Force | Unemployed |
| Less than High School | 6 (46.2%) | 0 (0.0%) |
| High School Diploma | 69 (82.1%) | 4 (4.3%) |
| College / Associate Degree | 178 (75.4%) | 12 (5.1%) |
| Bachelor's Degree or higher | 627 (90.0%) | 6 (0.8%) |
| Total | 880 (85.4%) | 21 (2.0%) |
Employment Occupations by Sex in Maunawili
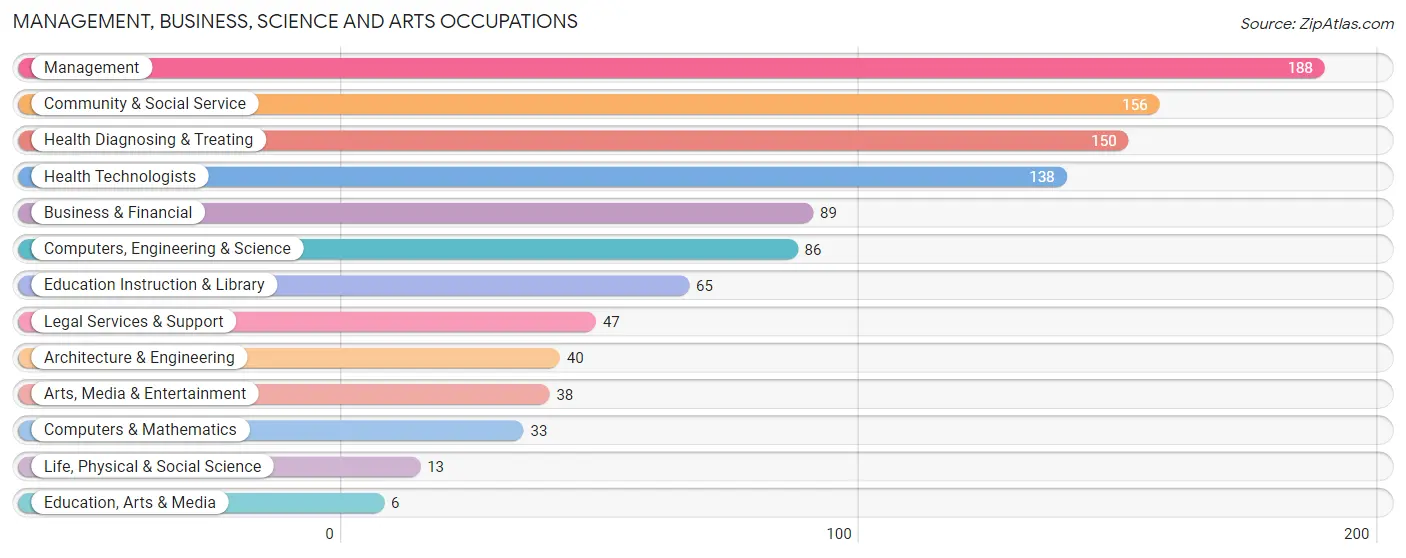
Management, Business, Science and Arts Occupations
The most common Management, Business, Science and Arts occupations in Maunawili are Management (188 | 17.2%), Community & Social Service (156 | 14.3%), Health Diagnosing & Treating (150 | 13.7%), Health Technologists (138 | 12.6%), and Business & Financial (89 | 8.2%).
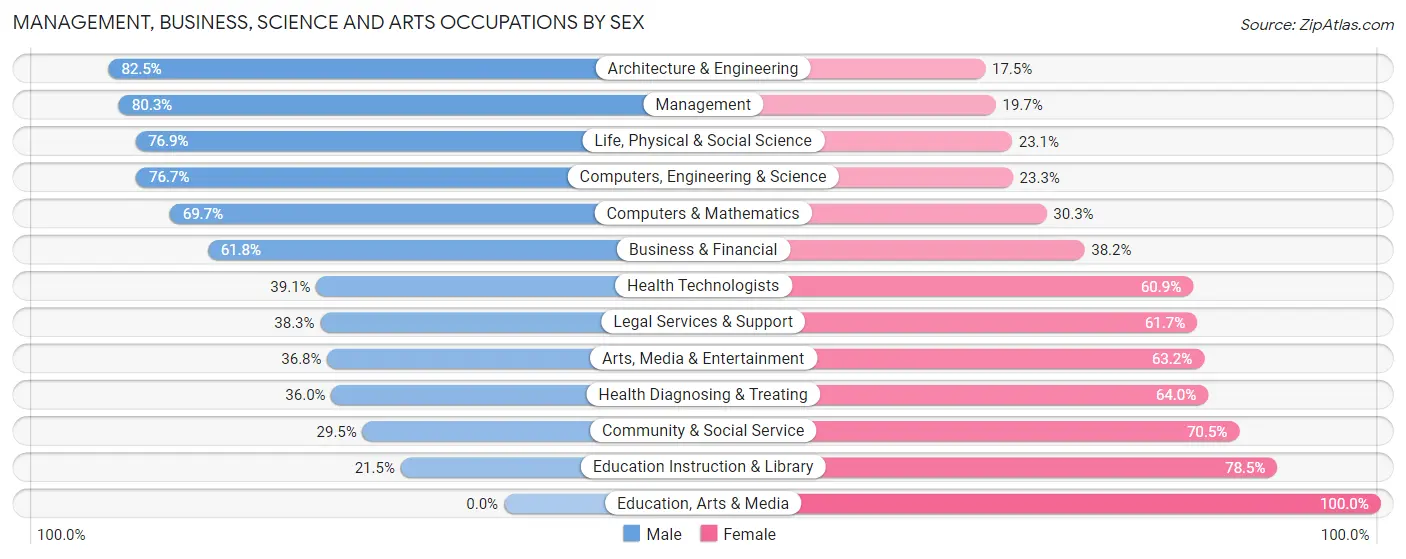
Management, Business, Science and Arts Occupations by Sex
Within the Management, Business, Science and Arts occupations in Maunawili, the most male-oriented occupations are Architecture & Engineering (82.5%), Management (80.3%), and Life, Physical & Social Science (76.9%), while the most female-oriented occupations are Education, Arts & Media (100.0%), Education Instruction & Library (78.5%), and Community & Social Service (70.5%).
| Occupation | Male | Female |
| Management | 151 (80.3%) | 37 (19.7%) |
| Business & Financial | 55 (61.8%) | 34 (38.2%) |
| Computers, Engineering & Science | 66 (76.7%) | 20 (23.3%) |
| Computers & Mathematics | 23 (69.7%) | 10 (30.3%) |
| Architecture & Engineering | 33 (82.5%) | 7 (17.5%) |
| Life, Physical & Social Science | 10 (76.9%) | 3 (23.1%) |
| Community & Social Service | 46 (29.5%) | 110 (70.5%) |
| Education, Arts & Media | 0 (0.0%) | 6 (100.0%) |
| Legal Services & Support | 18 (38.3%) | 29 (61.7%) |
| Education Instruction & Library | 14 (21.5%) | 51 (78.5%) |
| Arts, Media & Entertainment | 14 (36.8%) | 24 (63.2%) |
| Health Diagnosing & Treating | 54 (36.0%) | 96 (64.0%) |
| Health Technologists | 54 (39.1%) | 84 (60.9%) |
| Total (Category) | 372 (55.6%) | 297 (44.4%) |
| Total (Overall) | 576 (52.7%) | 516 (47.2%) |
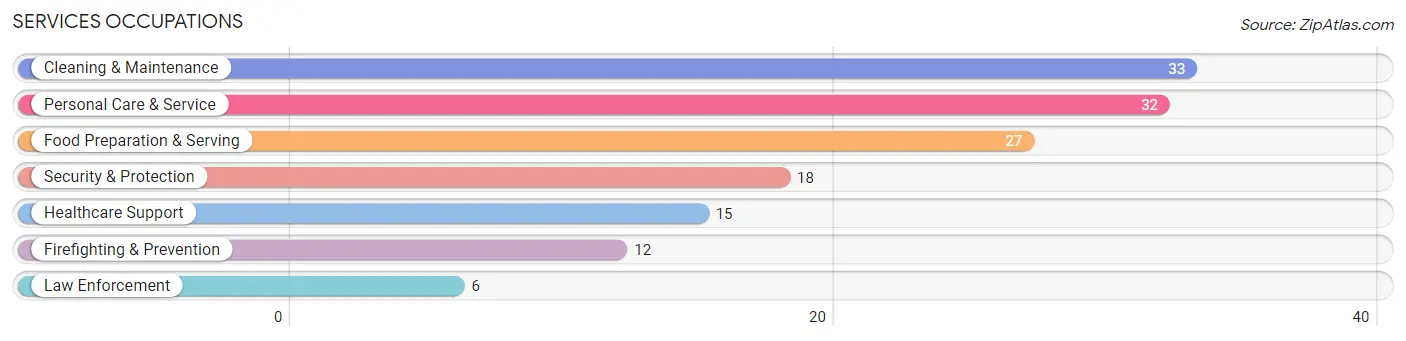
Services Occupations
The most common Services occupations in Maunawili are Cleaning & Maintenance (33 | 3.0%), Personal Care & Service (32 | 2.9%), Food Preparation & Serving (27 | 2.5%), Security & Protection (18 | 1.7%), and Healthcare Support (15 | 1.4%).
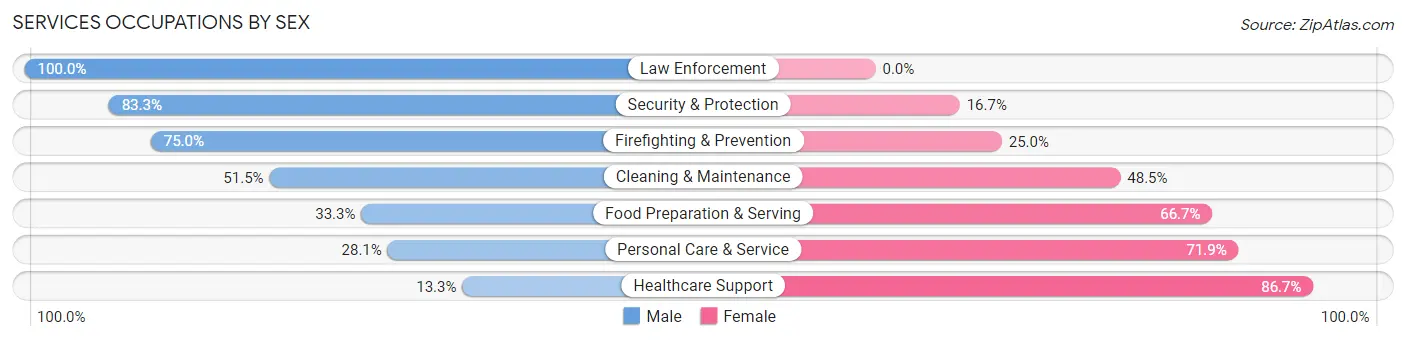
Services Occupations by Sex
Within the Services occupations in Maunawili, the most male-oriented occupations are Law Enforcement (100.0%), Security & Protection (83.3%), and Firefighting & Prevention (75.0%), while the most female-oriented occupations are Healthcare Support (86.7%), Personal Care & Service (71.9%), and Food Preparation & Serving (66.7%).
| Occupation | Male | Female |
| Healthcare Support | 2 (13.3%) | 13 (86.7%) |
| Security & Protection | 15 (83.3%) | 3 (16.7%) |
| Firefighting & Prevention | 9 (75.0%) | 3 (25.0%) |
| Law Enforcement | 6 (100.0%) | 0 (0.0%) |
| Food Preparation & Serving | 9 (33.3%) | 18 (66.7%) |
| Cleaning & Maintenance | 17 (51.5%) | 16 (48.5%) |
| Personal Care & Service | 9 (28.1%) | 23 (71.9%) |
| Total (Category) | 52 (41.6%) | 73 (58.4%) |
| Total (Overall) | 576 (52.7%) | 516 (47.2%) |
Sales and Office Occupations
The most common Sales and Office occupations in Maunawili are Office & Administration (107 | 9.8%), and Sales & Related (92 | 8.4%).
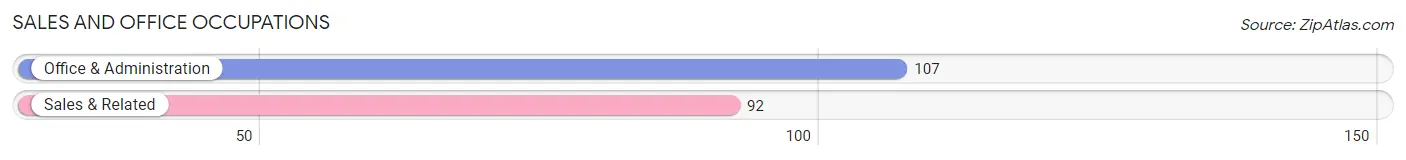
Sales and Office Occupations by Sex
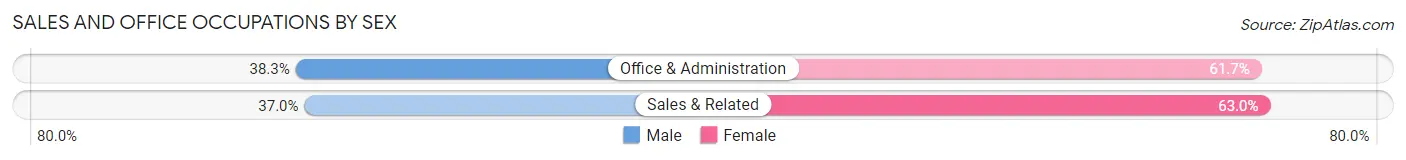
| Occupation | Male | Female |
| Sales & Related | 34 (37.0%) | 58 (63.0%) |
| Office & Administration | 41 (38.3%) | 66 (61.7%) |
| Total (Category) | 75 (37.7%) | 124 (62.3%) |
| Total (Overall) | 576 (52.7%) | 516 (47.2%) |
Natural Resources, Construction and Maintenance Occupations
The most common Natural Resources, Construction and Maintenance occupations in Maunawili are Construction & Extraction (22 | 2.0%), and Installation, Maintenance & Repair (16 | 1.5%).
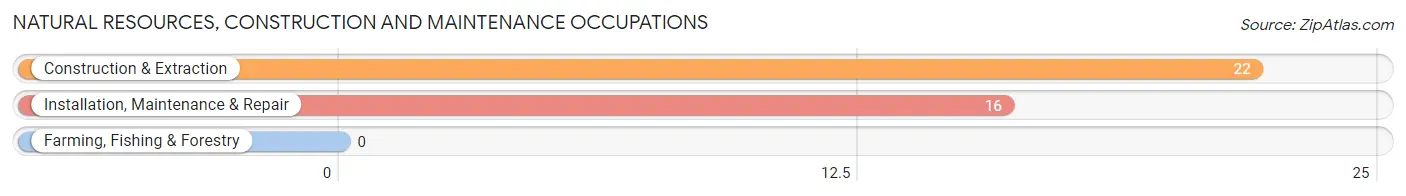
Natural Resources, Construction and Maintenance Occupations by Sex
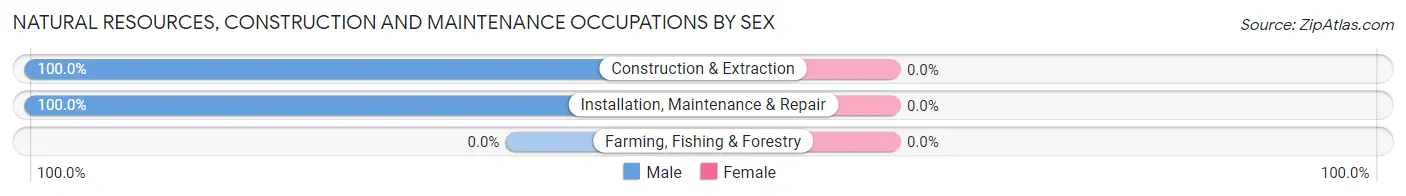
| Occupation | Male | Female |
| Farming, Fishing & Forestry | 0 (0.0%) | 0 (0.0%) |
| Construction & Extraction | 22 (100.0%) | 0 (0.0%) |
| Installation, Maintenance & Repair | 16 (100.0%) | 0 (0.0%) |
| Total (Category) | 38 (100.0%) | 0 (0.0%) |
| Total (Overall) | 576 (52.7%) | 516 (47.2%) |
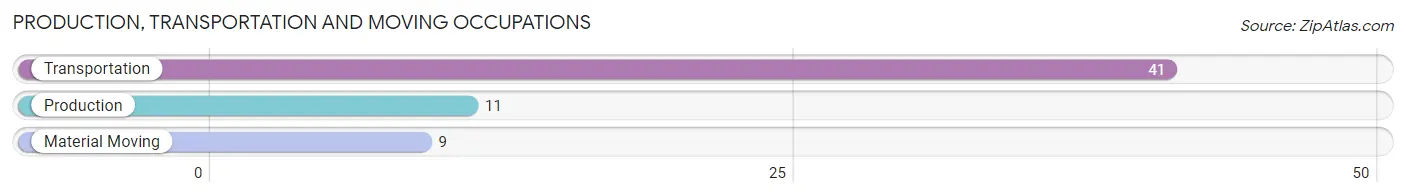
Production, Transportation and Moving Occupations
The most common Production, Transportation and Moving occupations in Maunawili are Transportation (41 | 3.7%), Production (11 | 1.0%), and Material Moving (9 | 0.8%).
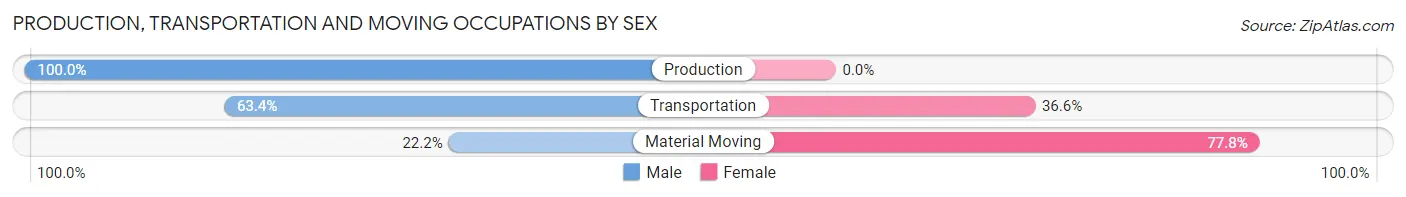
Production, Transportation and Moving Occupations by Sex
| Occupation | Male | Female |
| Production | 11 (100.0%) | 0 (0.0%) |
| Transportation | 26 (63.4%) | 15 (36.6%) |
| Material Moving | 2 (22.2%) | 7 (77.8%) |
| Total (Category) | 39 (63.9%) | 22 (36.1%) |
| Total (Overall) | 576 (52.7%) | 516 (47.2%) |
Employment Industries by Sex in Maunawili
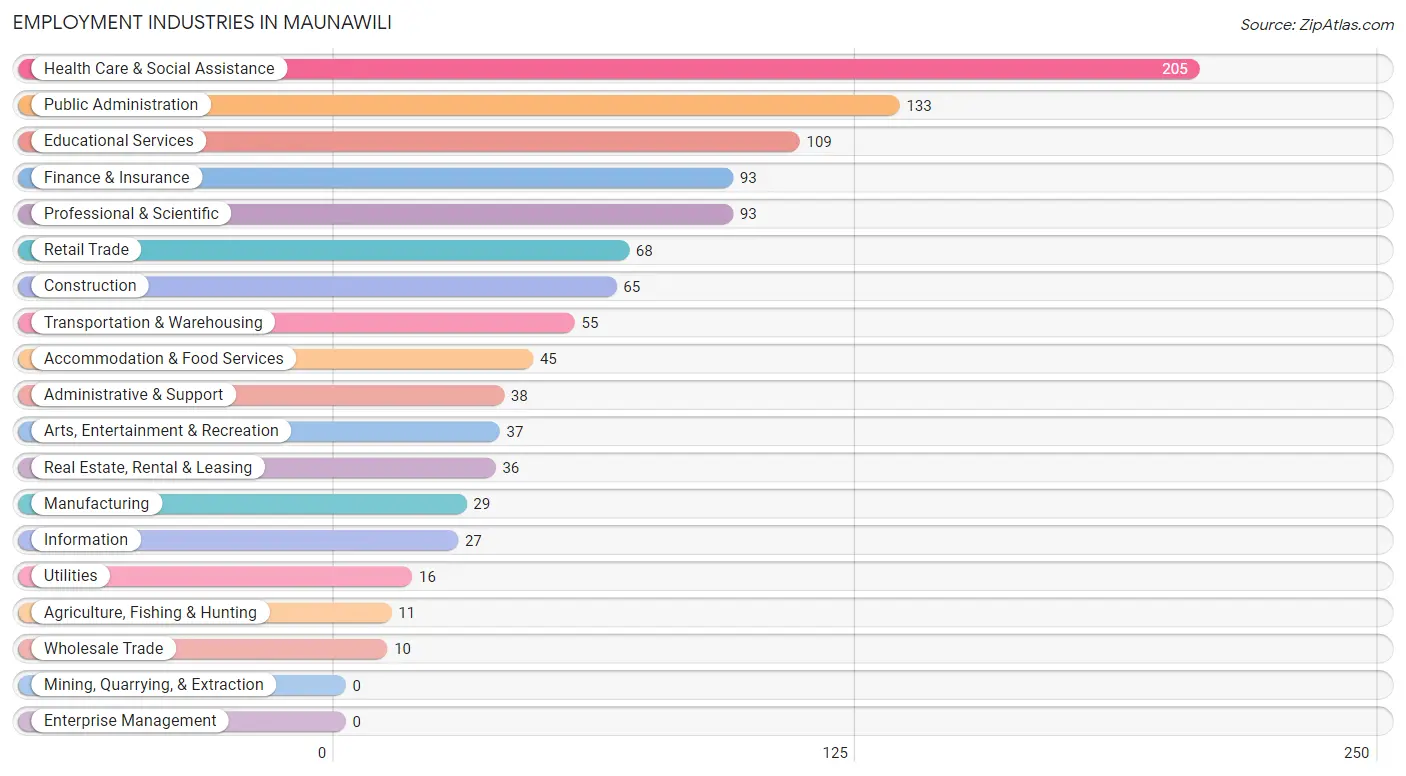
Employment Industries in Maunawili
The major employment industries in Maunawili include Health Care & Social Assistance (205 | 18.8%), Public Administration (133 | 12.2%), Educational Services (109 | 10.0%), Finance & Insurance (93 | 8.5%), and Professional & Scientific (93 | 8.5%).
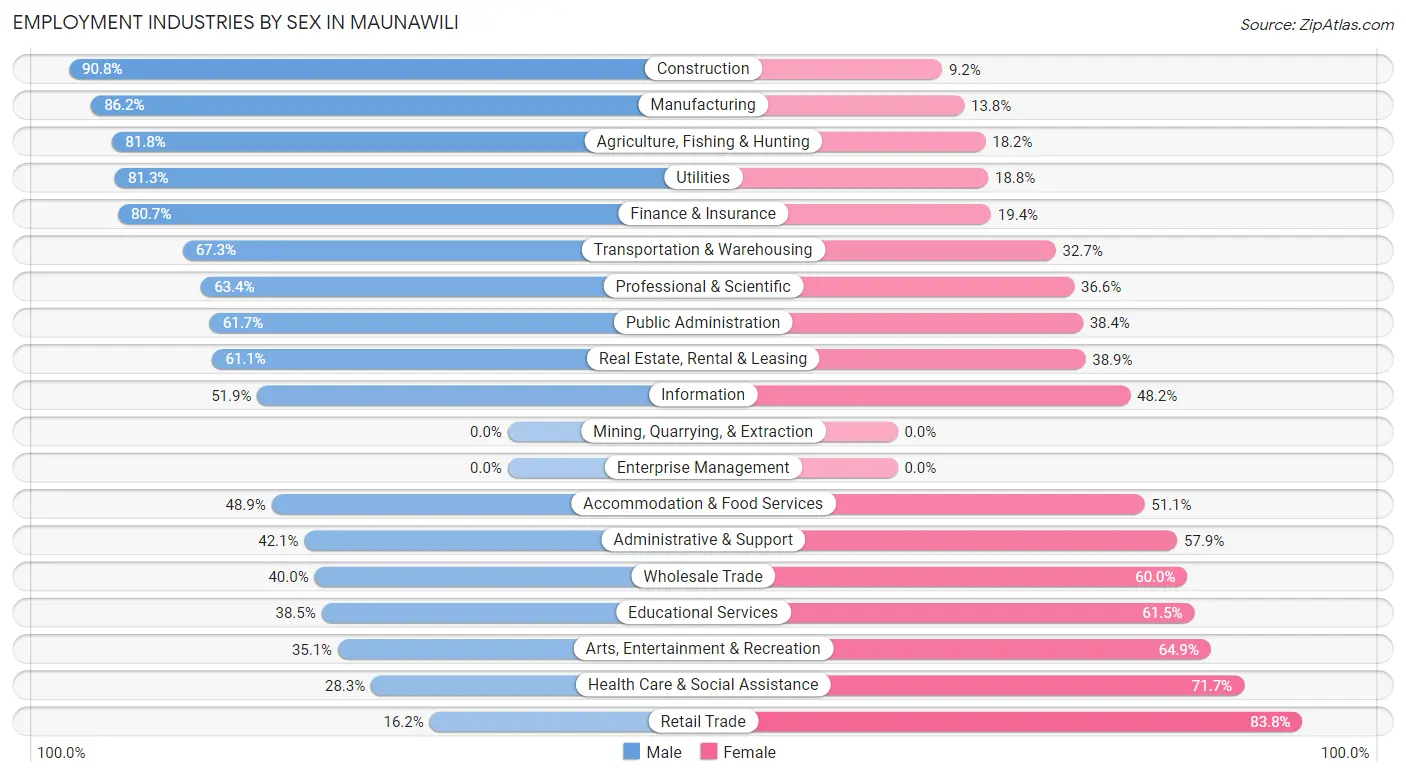
Employment Industries by Sex in Maunawili
The Maunawili industries that see more men than women are Construction (90.8%), Manufacturing (86.2%), and Agriculture, Fishing & Hunting (81.8%), whereas the industries that tend to have a higher number of women are Retail Trade (83.8%), Health Care & Social Assistance (71.7%), and Arts, Entertainment & Recreation (64.9%).
| Industry | Male | Female |
| Agriculture, Fishing & Hunting | 9 (81.8%) | 2 (18.2%) |
| Mining, Quarrying, & Extraction | 0 (0.0%) | 0 (0.0%) |
| Construction | 59 (90.8%) | 6 (9.2%) |
| Manufacturing | 25 (86.2%) | 4 (13.8%) |
| Wholesale Trade | 4 (40.0%) | 6 (60.0%) |
| Retail Trade | 11 (16.2%) | 57 (83.8%) |
| Transportation & Warehousing | 37 (67.3%) | 18 (32.7%) |
| Utilities | 13 (81.2%) | 3 (18.8%) |
| Information | 14 (51.8%) | 13 (48.1%) |
| Finance & Insurance | 75 (80.6%) | 18 (19.4%) |
| Real Estate, Rental & Leasing | 22 (61.1%) | 14 (38.9%) |
| Professional & Scientific | 59 (63.4%) | 34 (36.6%) |
| Enterprise Management | 0 (0.0%) | 0 (0.0%) |
| Administrative & Support | 16 (42.1%) | 22 (57.9%) |
| Educational Services | 42 (38.5%) | 67 (61.5%) |
| Health Care & Social Assistance | 58 (28.3%) | 147 (71.7%) |
| Arts, Entertainment & Recreation | 13 (35.1%) | 24 (64.9%) |
| Accommodation & Food Services | 22 (48.9%) | 23 (51.1%) |
| Public Administration | 82 (61.7%) | 51 (38.4%) |
| Total | 576 (52.7%) | 516 (47.2%) |
Education in Maunawili
School Enrollment in Maunawili
The most common levels of schooling among the 412 students in Maunawili are high school (109 | 26.5%), elementary school (79 | 19.2%), and college / undergraduate (72 | 17.5%).
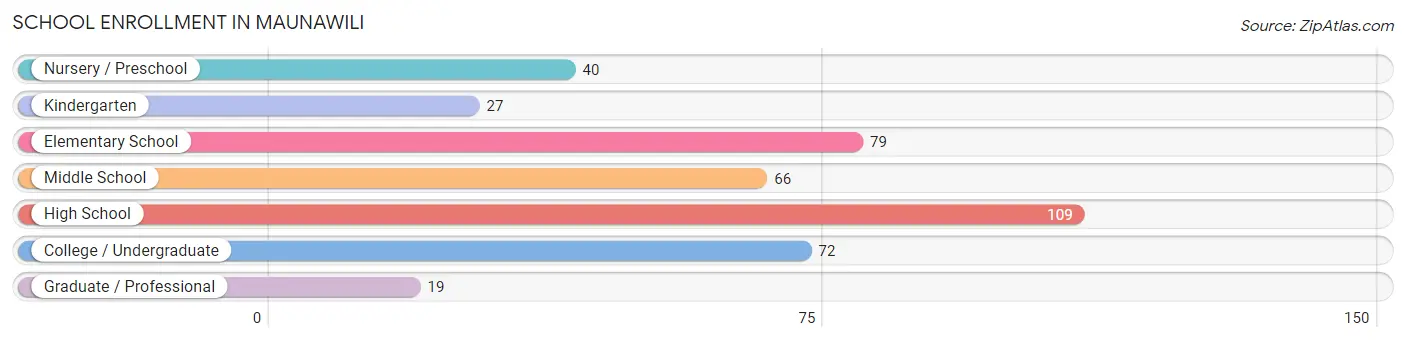
| School Level | # Students | % Students |
| Nursery / Preschool | 40 | 9.7% |
| Kindergarten | 27 | 6.6% |
| Elementary School | 79 | 19.2% |
| Middle School | 66 | 16.0% |
| High School | 109 | 26.5% |
| College / Undergraduate | 72 | 17.5% |
| Graduate / Professional | 19 | 4.6% |
| Total | 412 | 100.0% |
School Enrollment by Age by Funding Source in Maunawili
Out of a total of 412 students who are enrolled in schools in Maunawili, 217 (52.7%) attend a private institution, while the remaining 195 (47.3%) are enrolled in public schools. The age group of 18 to 19 year olds has the highest likelihood of being enrolled in private schools, with 31 (83.8% in the age bracket) enrolled. Conversely, the age group of 25 to 34 year olds has the lowest likelihood of being enrolled in a private school, with 30 (100.0% in the age bracket) attending a public institution.
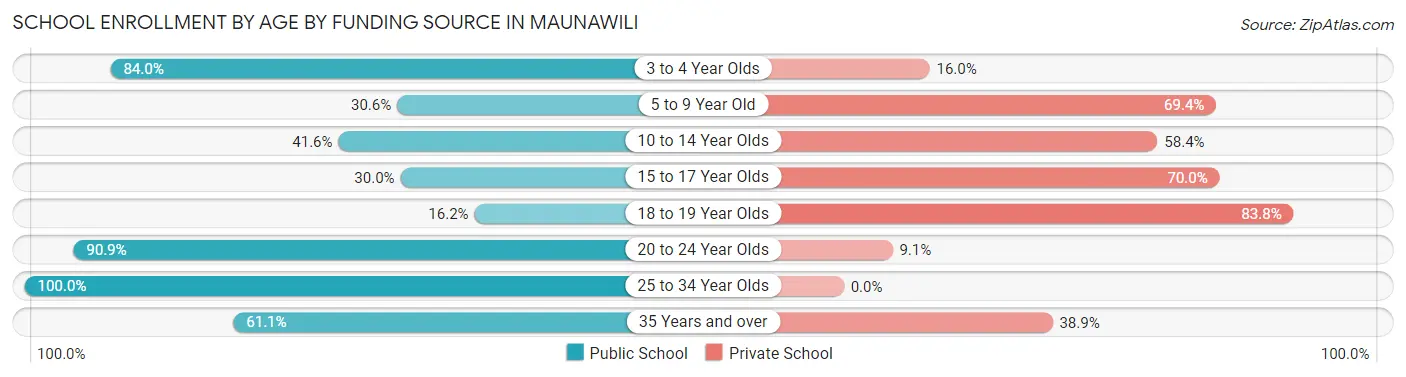
| Age Bracket | Public School | Private School |
| 3 to 4 Year Olds | 21 (84.0%) | 4 (16.0%) |
| 5 to 9 Year Old | 34 (30.6%) | 77 (69.4%) |
| 10 to 14 Year Olds | 32 (41.6%) | 45 (58.4%) |
| 15 to 17 Year Olds | 21 (30.0%) | 49 (70.0%) |
| 18 to 19 Year Olds | 6 (16.2%) | 31 (83.8%) |
| 20 to 24 Year Olds | 40 (90.9%) | 4 (9.1%) |
| 25 to 34 Year Olds | 30 (100.0%) | 0 (0.0%) |
| 35 Years and over | 11 (61.1%) | 7 (38.9%) |
| Total | 195 (47.3%) | 217 (52.7%) |
Educational Attainment by Field of Study in Maunawili
Business (278 | 24.3%), education (150 | 13.1%), social sciences (127 | 11.1%), bio, nature & agricultural (91 | 8.0%), and arts & humanities (81 | 7.1%) are the most common fields of study among 1,143 individuals in Maunawili who have obtained a bachelor's degree or higher.
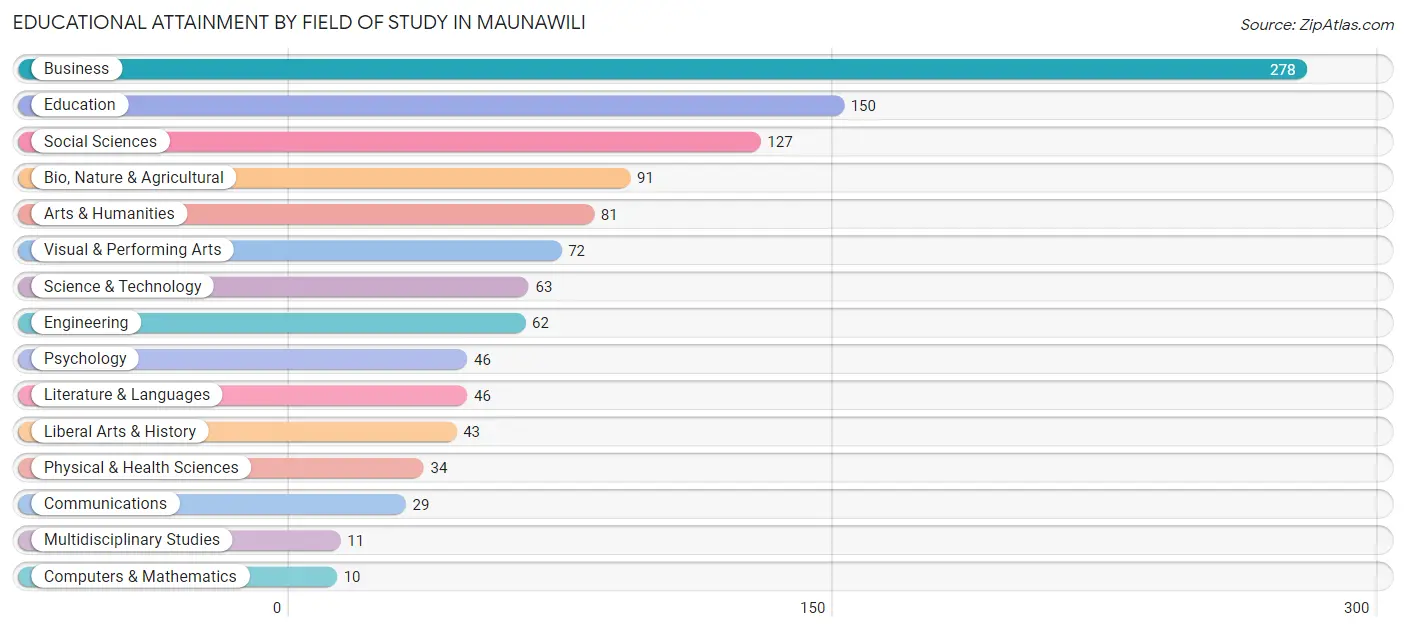
| Field of Study | # Graduates | % Graduates |
| Computers & Mathematics | 10 | 0.9% |
| Bio, Nature & Agricultural | 91 | 8.0% |
| Physical & Health Sciences | 34 | 3.0% |
| Psychology | 46 | 4.0% |
| Social Sciences | 127 | 11.1% |
| Engineering | 62 | 5.4% |
| Multidisciplinary Studies | 11 | 1.0% |
| Science & Technology | 63 | 5.5% |
| Business | 278 | 24.3% |
| Education | 150 | 13.1% |
| Literature & Languages | 46 | 4.0% |
| Liberal Arts & History | 43 | 3.8% |
| Visual & Performing Arts | 72 | 6.3% |
| Communications | 29 | 2.5% |
| Arts & Humanities | 81 | 7.1% |
| Total | 1,143 | 100.0% |
Transportation & Commute in Maunawili
Vehicle Availability by Sex in Maunawili
The most prevalent vehicle ownership categories in Maunawili are males with 2 vehicles (209, accounting for 35.8%) and females with 2 vehicles (194, making up 40.4%).
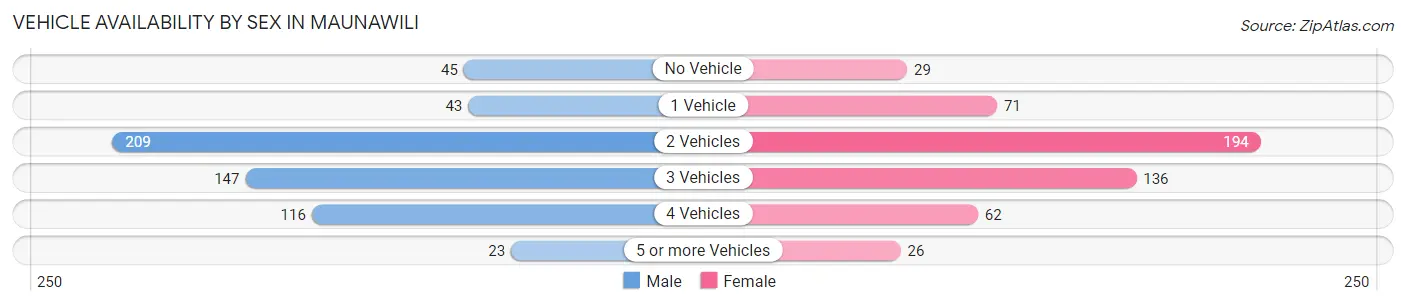
| Vehicles Available | Male | Female |
| No Vehicle | 45 (7.7%) | 29 (5.6%) |
| 1 Vehicle | 43 (7.4%) | 71 (13.7%) |
| 2 Vehicles | 209 (35.8%) | 194 (37.4%) |
| 3 Vehicles | 147 (25.2%) | 136 (26.3%) |
| 4 Vehicles | 116 (19.9%) | 62 (12.0%) |
| 5 or more Vehicles | 23 (4.0%) | 26 (5.0%) |
| Total | 583 (100.0%) | 518 (100.0%) |
Commute Time in Maunawili
The most frequently occuring commute durations in Maunawili are 30 to 34 minutes (318 commuters, 33.1%), 20 to 24 minutes (154 commuters, 16.0%), and 25 to 29 minutes (103 commuters, 10.7%).
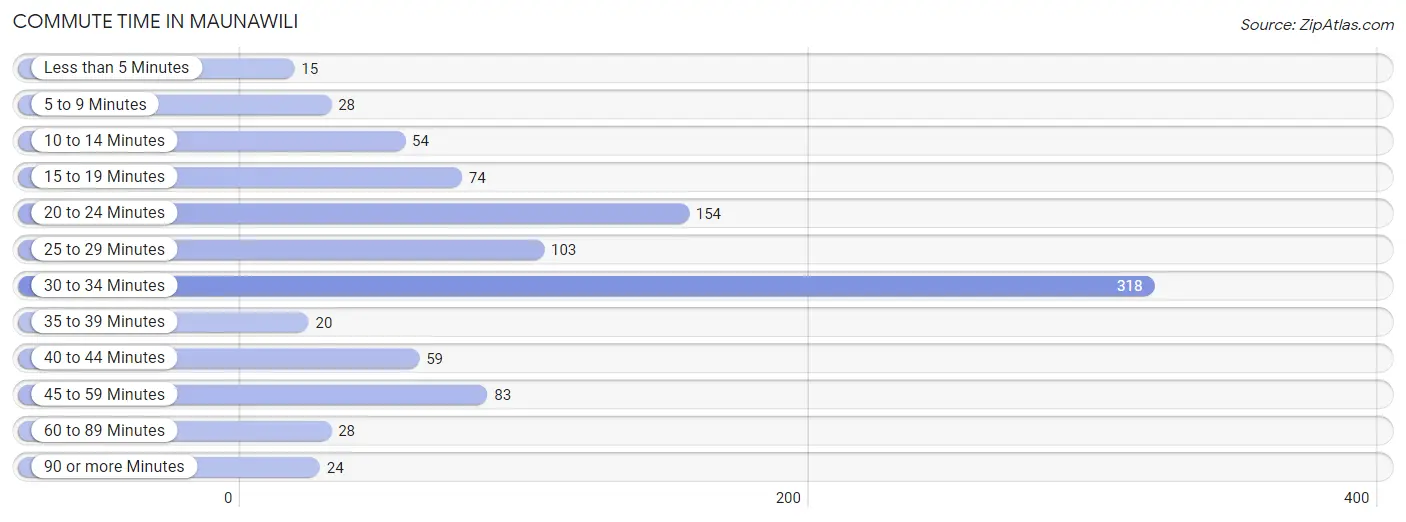
| Commute Time | # Commuters | % Commuters |
| Less than 5 Minutes | 15 | 1.6% |
| 5 to 9 Minutes | 28 | 2.9% |
| 10 to 14 Minutes | 54 | 5.6% |
| 15 to 19 Minutes | 74 | 7.7% |
| 20 to 24 Minutes | 154 | 16.0% |
| 25 to 29 Minutes | 103 | 10.7% |
| 30 to 34 Minutes | 318 | 33.1% |
| 35 to 39 Minutes | 20 | 2.1% |
| 40 to 44 Minutes | 59 | 6.1% |
| 45 to 59 Minutes | 83 | 8.6% |
| 60 to 89 Minutes | 28 | 2.9% |
| 90 or more Minutes | 24 | 2.5% |
Commute Time by Sex in Maunawili
The most common commute times in Maunawili are 30 to 34 minutes (200 commuters, 38.5%) for males and 30 to 34 minutes (118 commuters, 26.8%) for females.
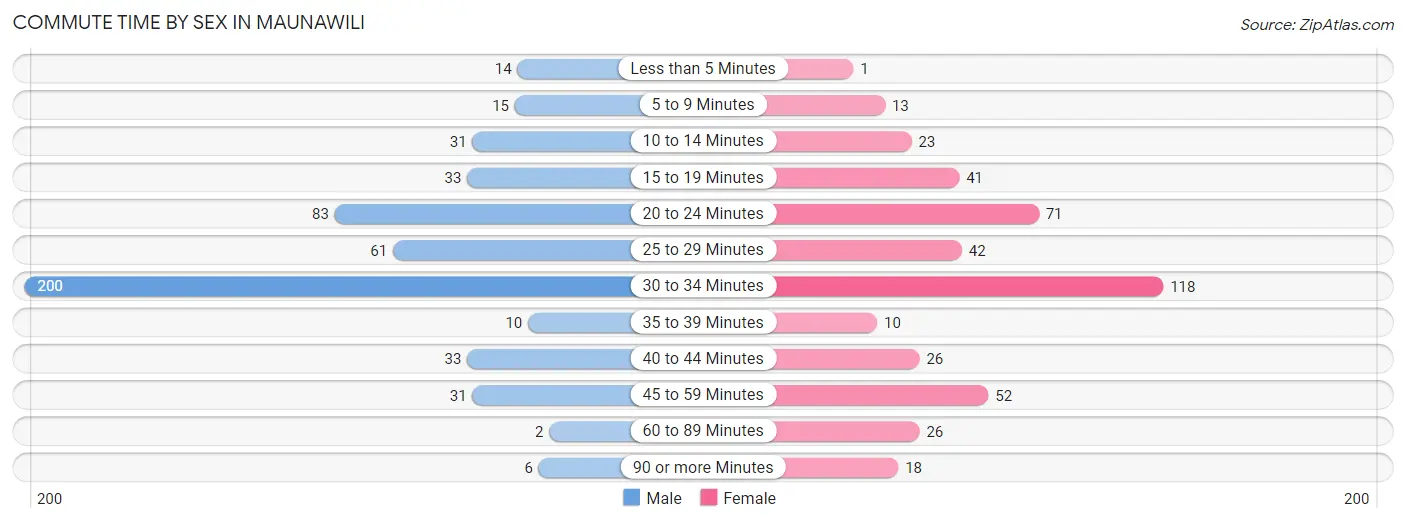
| Commute Time | Male | Female |
| Less than 5 Minutes | 14 (2.7%) | 1 (0.2%) |
| 5 to 9 Minutes | 15 (2.9%) | 13 (2.9%) |
| 10 to 14 Minutes | 31 (6.0%) | 23 (5.2%) |
| 15 to 19 Minutes | 33 (6.4%) | 41 (9.3%) |
| 20 to 24 Minutes | 83 (16.0%) | 71 (16.1%) |
| 25 to 29 Minutes | 61 (11.7%) | 42 (9.5%) |
| 30 to 34 Minutes | 200 (38.5%) | 118 (26.8%) |
| 35 to 39 Minutes | 10 (1.9%) | 10 (2.3%) |
| 40 to 44 Minutes | 33 (6.4%) | 26 (5.9%) |
| 45 to 59 Minutes | 31 (6.0%) | 52 (11.8%) |
| 60 to 89 Minutes | 2 (0.4%) | 26 (5.9%) |
| 90 or more Minutes | 6 (1.2%) | 18 (4.1%) |
Time of Departure to Work by Sex in Maunawili
The most frequent times of departure to work in Maunawili are 7:00 AM to 7:29 AM (92, 17.7%) for males and 7:00 AM to 7:29 AM (102, 23.1%) for females.
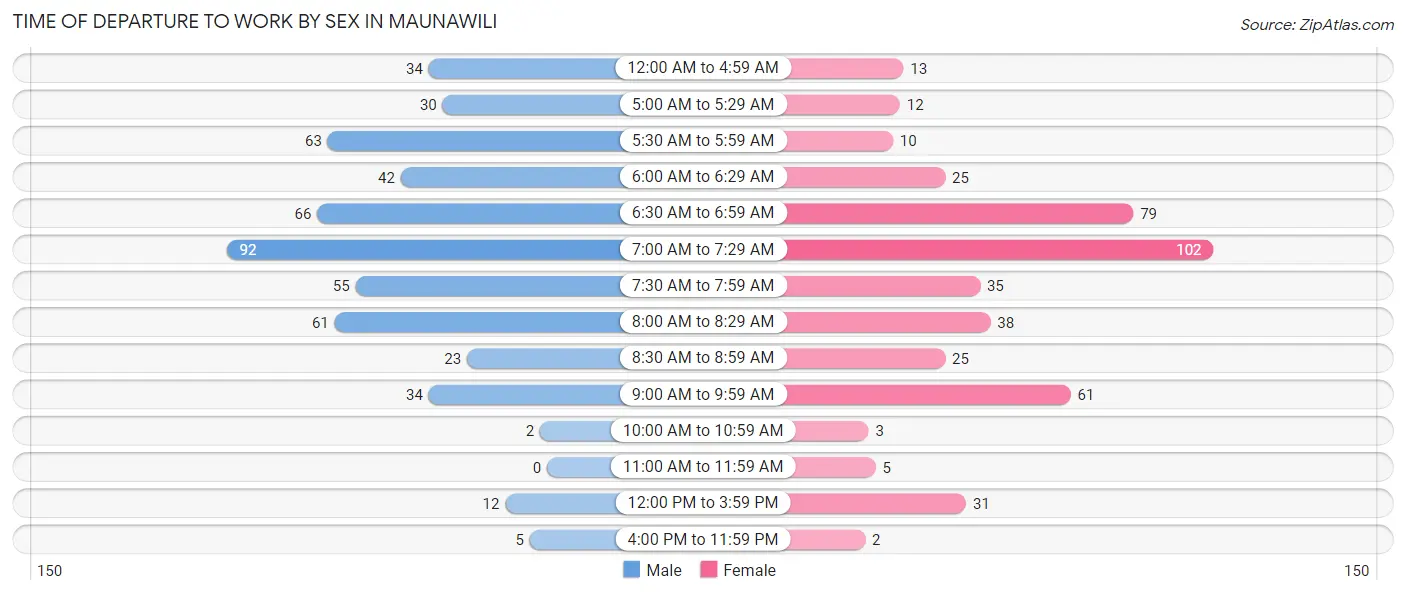
| Time of Departure | Male | Female |
| 12:00 AM to 4:59 AM | 34 (6.6%) | 13 (2.9%) |
| 5:00 AM to 5:29 AM | 30 (5.8%) | 12 (2.7%) |
| 5:30 AM to 5:59 AM | 63 (12.1%) | 10 (2.3%) |
| 6:00 AM to 6:29 AM | 42 (8.1%) | 25 (5.7%) |
| 6:30 AM to 6:59 AM | 66 (12.7%) | 79 (17.9%) |
| 7:00 AM to 7:29 AM | 92 (17.7%) | 102 (23.1%) |
| 7:30 AM to 7:59 AM | 55 (10.6%) | 35 (7.9%) |
| 8:00 AM to 8:29 AM | 61 (11.7%) | 38 (8.6%) |
| 8:30 AM to 8:59 AM | 23 (4.4%) | 25 (5.7%) |
| 9:00 AM to 9:59 AM | 34 (6.6%) | 61 (13.8%) |
| 10:00 AM to 10:59 AM | 2 (0.4%) | 3 (0.7%) |
| 11:00 AM to 11:59 AM | 0 (0.0%) | 5 (1.1%) |
| 12:00 PM to 3:59 PM | 12 (2.3%) | 31 (7.0%) |
| 4:00 PM to 11:59 PM | 5 (1.0%) | 2 (0.4%) |
| Total | 519 (100.0%) | 441 (100.0%) |
Housing Occupancy in Maunawili
Occupancy by Ownership in Maunawili
Of the total 697 dwellings in Maunawili, owner-occupied units account for 623 (89.4%), while renter-occupied units make up 74 (10.6%).
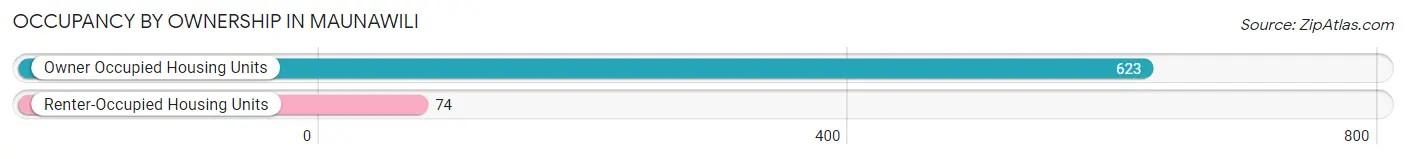
| Occupancy | # Housing Units | % Housing Units |
| Owner Occupied Housing Units | 623 | 89.4% |
| Renter-Occupied Housing Units | 74 | 10.6% |
| Total Occupied Housing Units | 697 | 100.0% |
Occupancy by Household Size in Maunawili
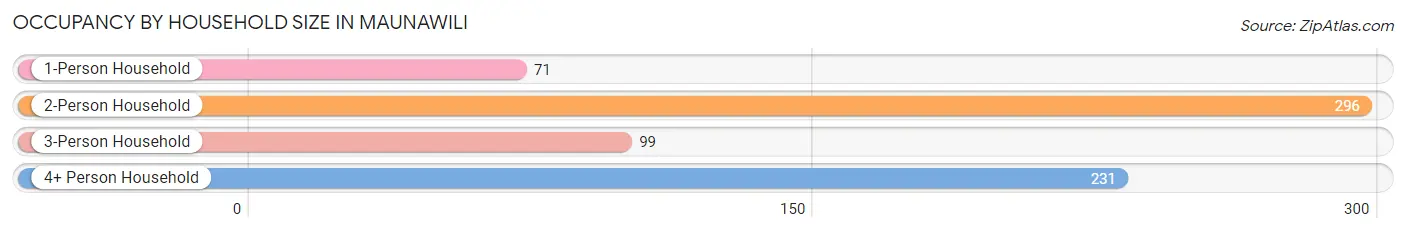
| Household Size | # Housing Units | % Housing Units |
| 1-Person Household | 71 | 10.2% |
| 2-Person Household | 296 | 42.5% |
| 3-Person Household | 99 | 14.2% |
| 4+ Person Household | 231 | 33.1% |
| Total Housing Units | 697 | 100.0% |
Occupancy by Ownership by Household Size in Maunawili
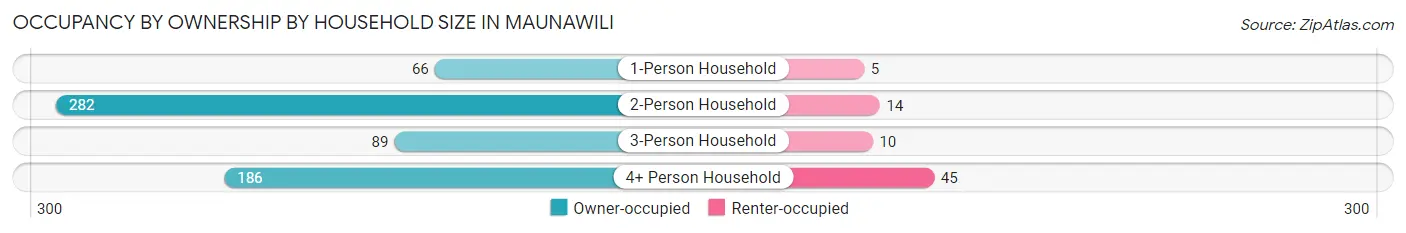
| Household Size | Owner-occupied | Renter-occupied |
| 1-Person Household | 66 (93.0%) | 5 (7.0%) |
| 2-Person Household | 282 (95.3%) | 14 (4.7%) |
| 3-Person Household | 89 (89.9%) | 10 (10.1%) |
| 4+ Person Household | 186 (80.5%) | 45 (19.5%) |
| Total Housing Units | 623 (89.4%) | 74 (10.6%) |
Occupancy by Educational Attainment in Maunawili
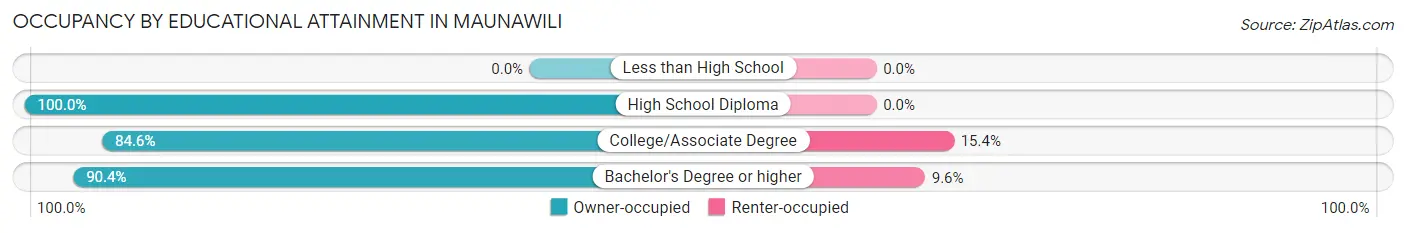
| Household Size | Owner-occupied | Renter-occupied |
| Less than High School | 0 (0.0%) | 0 (0.0%) |
| High School Diploma | 30 (100.0%) | 0 (0.0%) |
| College/Associate Degree | 143 (84.6%) | 26 (15.4%) |
| Bachelor's Degree or higher | 450 (90.4%) | 48 (9.6%) |
Occupancy by Age of Householder in Maunawili
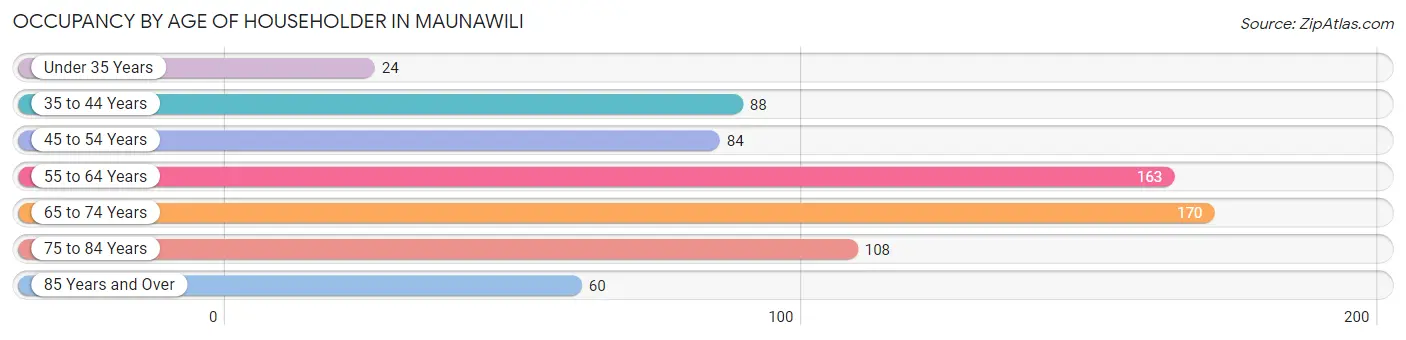
| Age Bracket | # Households | % Households |
| Under 35 Years | 24 | 3.4% |
| 35 to 44 Years | 88 | 12.6% |
| 45 to 54 Years | 84 | 12.0% |
| 55 to 64 Years | 163 | 23.4% |
| 65 to 74 Years | 170 | 24.4% |
| 75 to 84 Years | 108 | 15.5% |
| 85 Years and Over | 60 | 8.6% |
| Total | 697 | 100.0% |
Housing Finances in Maunawili
Median Income by Occupancy in Maunawili
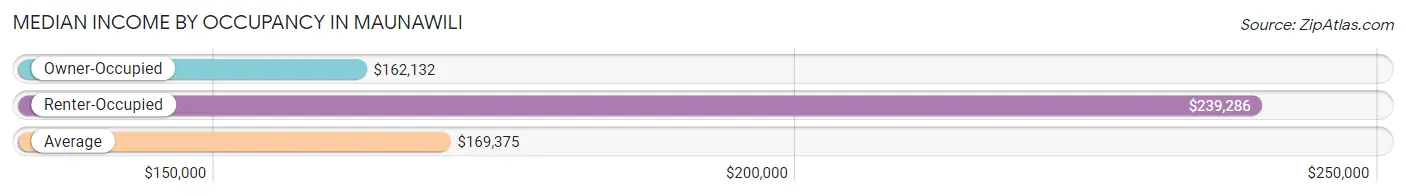
| Occupancy Type | # Households | Median Income |
| Owner-Occupied | 623 (89.4%) | $162,132 |
| Renter-Occupied | 74 (10.6%) | $239,286 |
| Average | 697 (100.0%) | $169,375 |
Occupancy by Householder Income Bracket in Maunawili
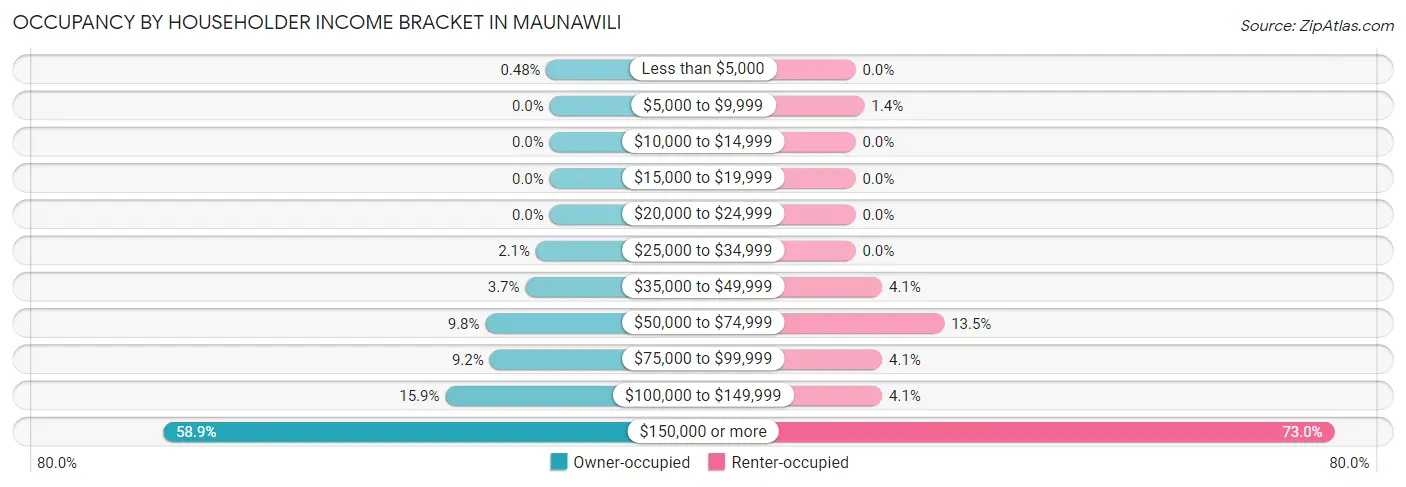
| Income Bracket | Owner-occupied | Renter-occupied |
| Less than $5,000 | 3 (0.5%) | 0 (0.0%) |
| $5,000 to $9,999 | 0 (0.0%) | 1 (1.3%) |
| $10,000 to $14,999 | 0 (0.0%) | 0 (0.0%) |
| $15,000 to $19,999 | 0 (0.0%) | 0 (0.0%) |
| $20,000 to $24,999 | 0 (0.0%) | 0 (0.0%) |
| $25,000 to $34,999 | 13 (2.1%) | 0 (0.0%) |
| $35,000 to $49,999 | 23 (3.7%) | 3 (4.1%) |
| $50,000 to $74,999 | 61 (9.8%) | 10 (13.5%) |
| $75,000 to $99,999 | 57 (9.1%) | 3 (4.1%) |
| $100,000 to $149,999 | 99 (15.9%) | 3 (4.1%) |
| $150,000 or more | 367 (58.9%) | 54 (73.0%) |
| Total | 623 (100.0%) | 74 (100.0%) |
Monthly Housing Cost Tiers in Maunawili
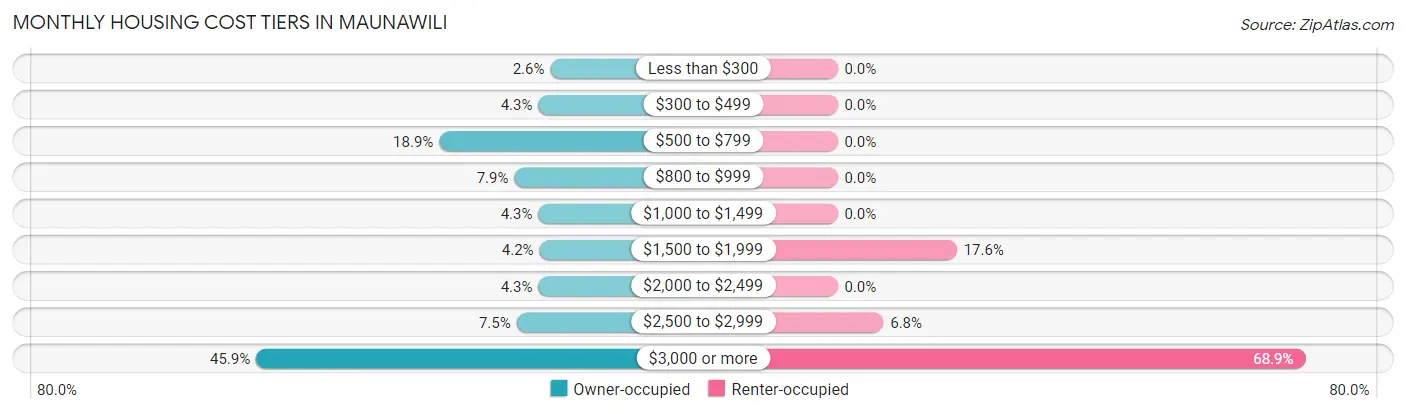
| Monthly Cost | Owner-occupied | Renter-occupied |
| Less than $300 | 16 (2.6%) | 0 (0.0%) |
| $300 to $499 | 27 (4.3%) | 0 (0.0%) |
| $500 to $799 | 118 (18.9%) | 0 (0.0%) |
| $800 to $999 | 49 (7.9%) | 0 (0.0%) |
| $1,000 to $1,499 | 27 (4.3%) | 0 (0.0%) |
| $1,500 to $1,999 | 26 (4.2%) | 13 (17.6%) |
| $2,000 to $2,499 | 27 (4.3%) | 0 (0.0%) |
| $2,500 to $2,999 | 47 (7.5%) | 5 (6.8%) |
| $3,000 or more | 286 (45.9%) | 51 (68.9%) |
| Total | 623 (100.0%) | 74 (100.0%) |
Physical Housing Characteristics in Maunawili
Housing Structures in Maunawili
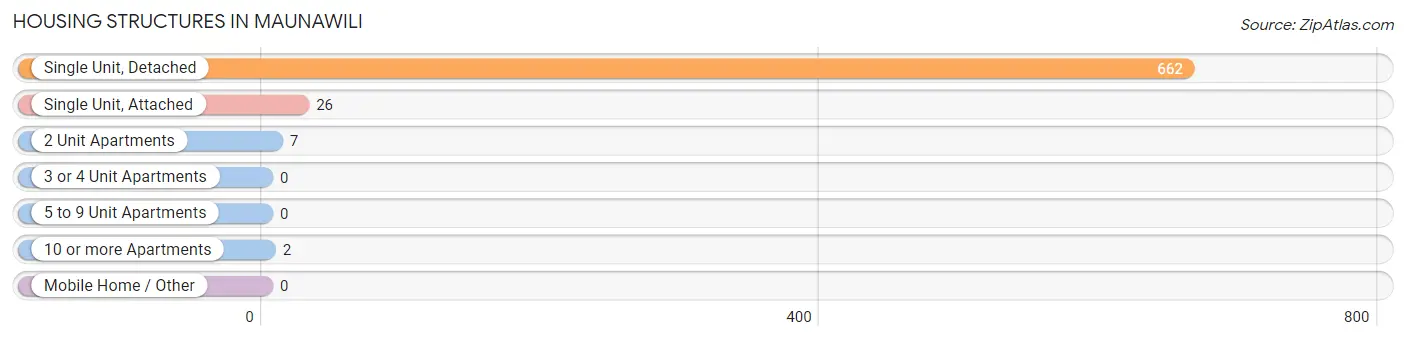
| Structure Type | # Housing Units | % Housing Units |
| Single Unit, Detached | 662 | 95.0% |
| Single Unit, Attached | 26 | 3.7% |
| 2 Unit Apartments | 7 | 1.0% |
| 3 or 4 Unit Apartments | 0 | 0.0% |
| 5 to 9 Unit Apartments | 0 | 0.0% |
| 10 or more Apartments | 2 | 0.3% |
| Mobile Home / Other | 0 | 0.0% |
| Total | 697 | 100.0% |
Housing Structures by Occupancy in Maunawili
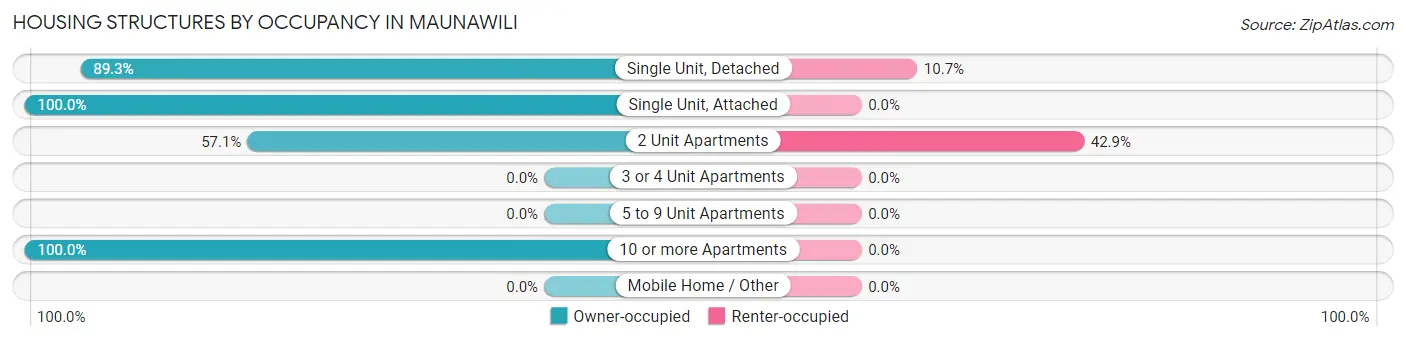
| Structure Type | Owner-occupied | Renter-occupied |
| Single Unit, Detached | 591 (89.3%) | 71 (10.7%) |
| Single Unit, Attached | 26 (100.0%) | 0 (0.0%) |
| 2 Unit Apartments | 4 (57.1%) | 3 (42.9%) |
| 3 or 4 Unit Apartments | 0 (0.0%) | 0 (0.0%) |
| 5 to 9 Unit Apartments | 0 (0.0%) | 0 (0.0%) |
| 10 or more Apartments | 2 (100.0%) | 0 (0.0%) |
| Mobile Home / Other | 0 (0.0%) | 0 (0.0%) |
| Total | 623 (89.4%) | 74 (10.6%) |
Housing Structures by Number of Rooms in Maunawili
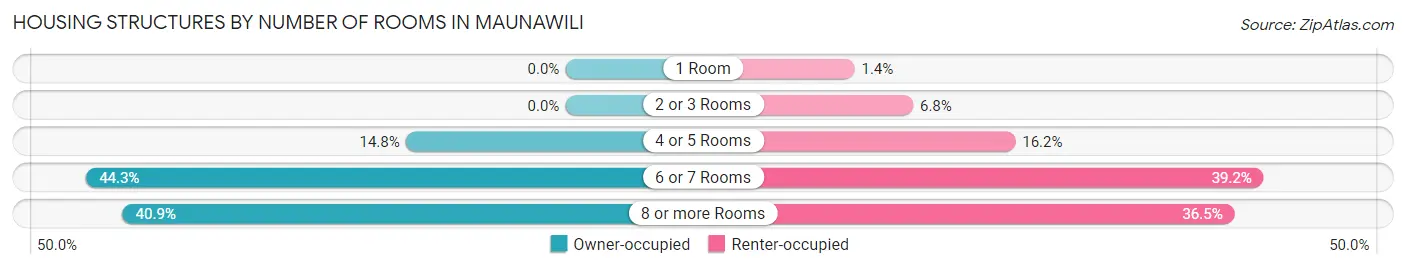
| Number of Rooms | Owner-occupied | Renter-occupied |
| 1 Room | 0 (0.0%) | 1 (1.3%) |
| 2 or 3 Rooms | 0 (0.0%) | 5 (6.8%) |
| 4 or 5 Rooms | 92 (14.8%) | 12 (16.2%) |
| 6 or 7 Rooms | 276 (44.3%) | 29 (39.2%) |
| 8 or more Rooms | 255 (40.9%) | 27 (36.5%) |
| Total | 623 (100.0%) | 74 (100.0%) |
Housing Structure by Heating Type in Maunawili
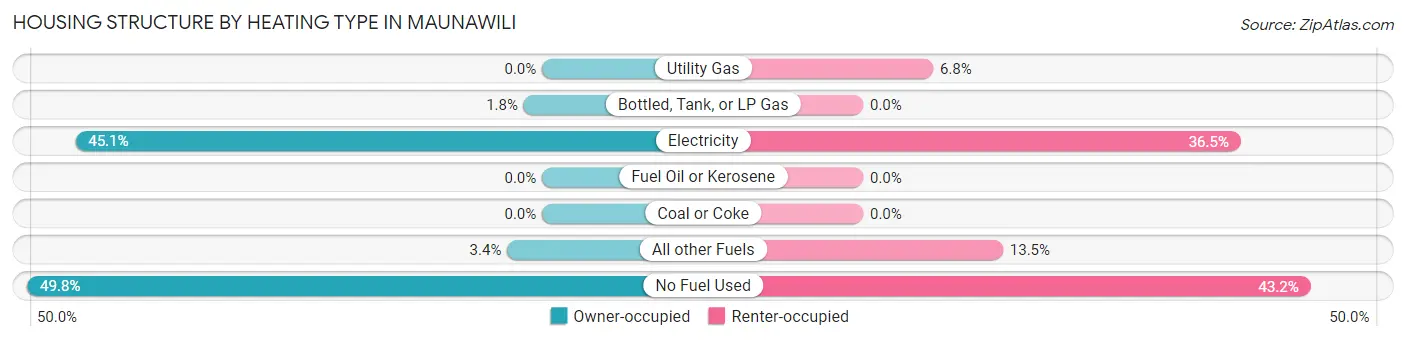
| Heating Type | Owner-occupied | Renter-occupied |
| Utility Gas | 0 (0.0%) | 5 (6.8%) |
| Bottled, Tank, or LP Gas | 11 (1.8%) | 0 (0.0%) |
| Electricity | 281 (45.1%) | 27 (36.5%) |
| Fuel Oil or Kerosene | 0 (0.0%) | 0 (0.0%) |
| Coal or Coke | 0 (0.0%) | 0 (0.0%) |
| All other Fuels | 21 (3.4%) | 10 (13.5%) |
| No Fuel Used | 310 (49.8%) | 32 (43.2%) |
| Total | 623 (100.0%) | 74 (100.0%) |
Household Vehicle Usage in Maunawili
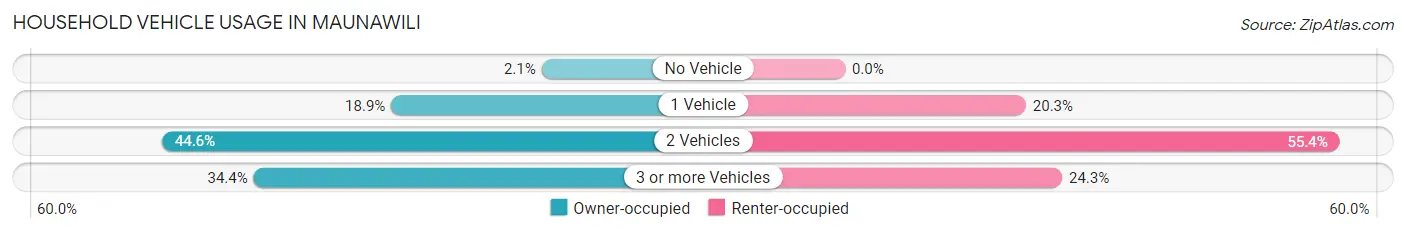
| Vehicles per Household | Owner-occupied | Renter-occupied |
| No Vehicle | 13 (2.1%) | 0 (0.0%) |
| 1 Vehicle | 118 (18.9%) | 15 (20.3%) |
| 2 Vehicles | 278 (44.6%) | 41 (55.4%) |
| 3 or more Vehicles | 214 (34.4%) | 18 (24.3%) |
| Total | 623 (100.0%) | 74 (100.0%) |
Real Estate & Mortgages in Maunawili
Real Estate and Mortgage Overview in Maunawili
| Characteristic | Without Mortgage | With Mortgage |
| Housing Units | 229 | 394 |
| Median Property Value | $1,188,600 | $1,356,800 |
| Median Household Income | $150,125 | $252 |
| Monthly Housing Costs | $741 | $286 |
| Real Estate Taxes | $3,571 | $4 |
Property Value by Mortgage Status in Maunawili
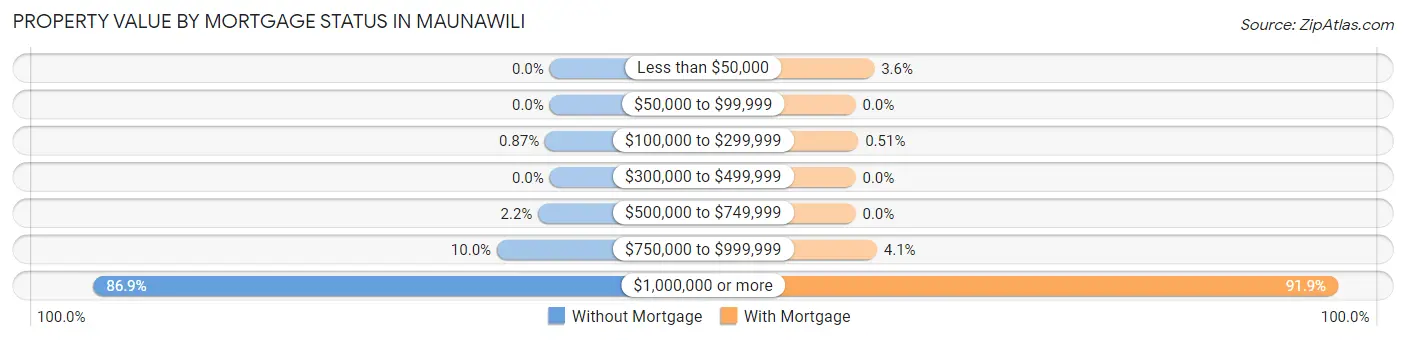
| Property Value | Without Mortgage | With Mortgage |
| Less than $50,000 | 0 (0.0%) | 14 (3.5%) |
| $50,000 to $99,999 | 0 (0.0%) | 0 (0.0%) |
| $100,000 to $299,999 | 2 (0.9%) | 2 (0.5%) |
| $300,000 to $499,999 | 0 (0.0%) | 0 (0.0%) |
| $500,000 to $749,999 | 5 (2.2%) | 0 (0.0%) |
| $750,000 to $999,999 | 23 (10.0%) | 16 (4.1%) |
| $1,000,000 or more | 199 (86.9%) | 362 (91.9%) |
| Total | 229 (100.0%) | 394 (100.0%) |
Household Income by Mortgage Status in Maunawili
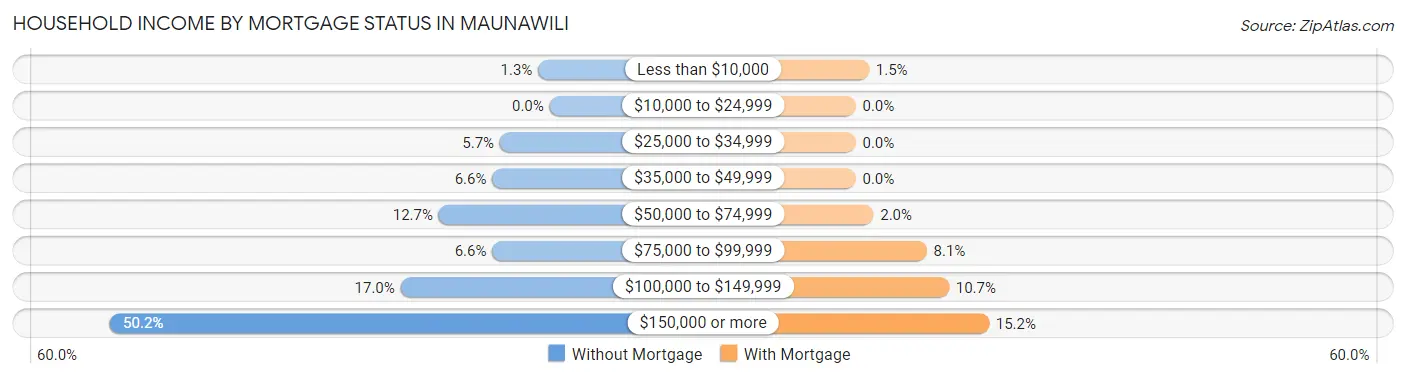
| Household Income | Without Mortgage | With Mortgage |
| Less than $10,000 | 3 (1.3%) | 6 (1.5%) |
| $10,000 to $24,999 | 0 (0.0%) | 0 (0.0%) |
| $25,000 to $34,999 | 13 (5.7%) | 0 (0.0%) |
| $35,000 to $49,999 | 15 (6.6%) | 0 (0.0%) |
| $50,000 to $74,999 | 29 (12.7%) | 8 (2.0%) |
| $75,000 to $99,999 | 15 (6.6%) | 32 (8.1%) |
| $100,000 to $149,999 | 39 (17.0%) | 42 (10.7%) |
| $150,000 or more | 115 (50.2%) | 60 (15.2%) |
| Total | 229 (100.0%) | 394 (100.0%) |
Property Value to Household Income Ratio in Maunawili
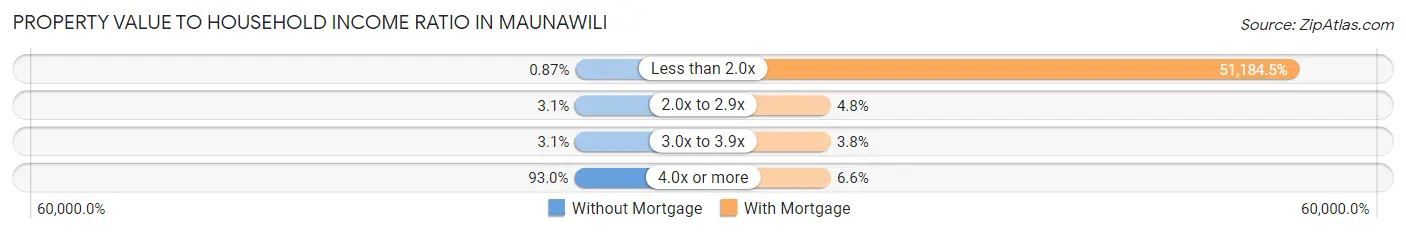
| Value-to-Income Ratio | Without Mortgage | With Mortgage |
| Less than 2.0x | 2 (0.9%) | 201,667 (51,184.5%) |
| 2.0x to 2.9x | 7 (3.1%) | 19 (4.8%) |
| 3.0x to 3.9x | 7 (3.1%) | 15 (3.8%) |
| 4.0x or more | 213 (93.0%) | 26 (6.6%) |
| Total | 229 (100.0%) | 394 (100.0%) |
Real Estate Taxes by Mortgage Status in Maunawili
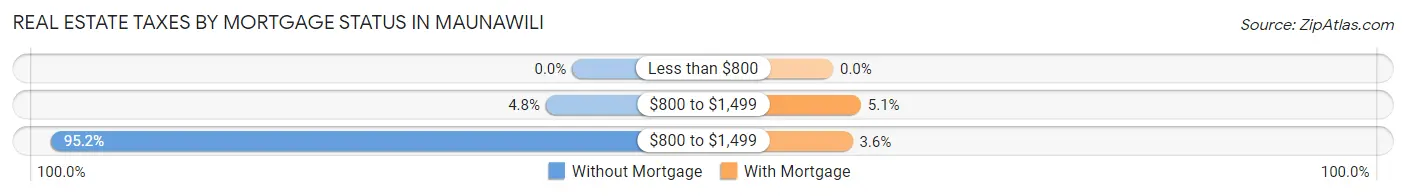
| Property Taxes | Without Mortgage | With Mortgage |
| Less than $800 | 0 (0.0%) | 0 (0.0%) |
| $800 to $1,499 | 11 (4.8%) | 20 (5.1%) |
| $800 to $1,499 | 218 (95.2%) | 14 (3.5%) |
| Total | 229 (100.0%) | 394 (100.0%) |
Health & Disability in Maunawili
Health Insurance Coverage by Age in Maunawili
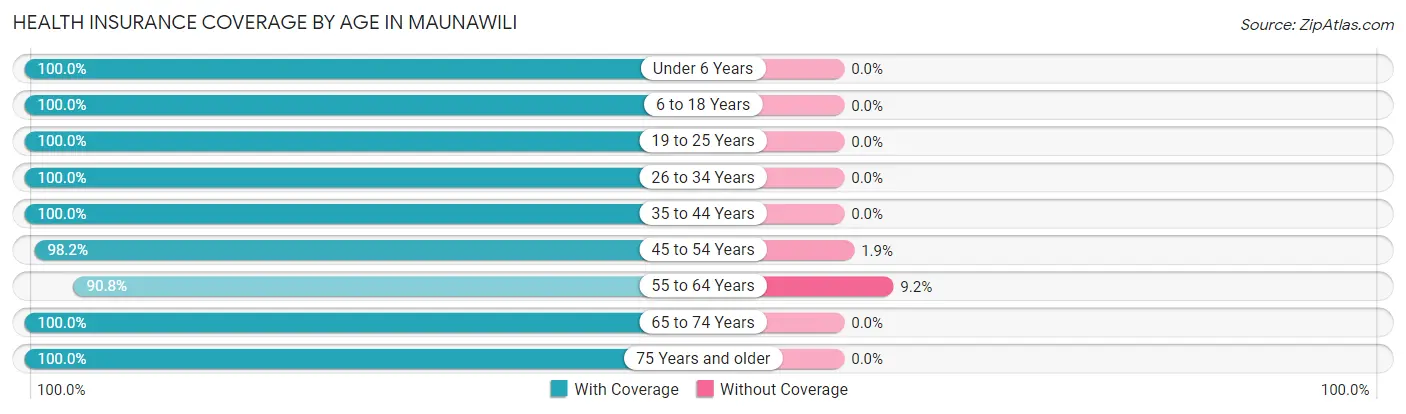
| Age Bracket | With Coverage | Without Coverage |
| Under 6 Years | 95 (100.0%) | 0 (0.0%) |
| 6 to 18 Years | 267 (100.0%) | 0 (0.0%) |
| 19 to 25 Years | 99 (100.0%) | 0 (0.0%) |
| 26 to 34 Years | 134 (100.0%) | 0 (0.0%) |
| 35 to 44 Years | 252 (100.0%) | 0 (0.0%) |
| 45 to 54 Years | 212 (98.2%) | 4 (1.8%) |
| 55 to 64 Years | 347 (90.8%) | 35 (9.2%) |
| 65 to 74 Years | 300 (100.0%) | 0 (0.0%) |
| 75 Years and older | 295 (100.0%) | 0 (0.0%) |
| Total | 2,001 (98.1%) | 39 (1.9%) |
Health Insurance Coverage by Citizenship Status in Maunawili
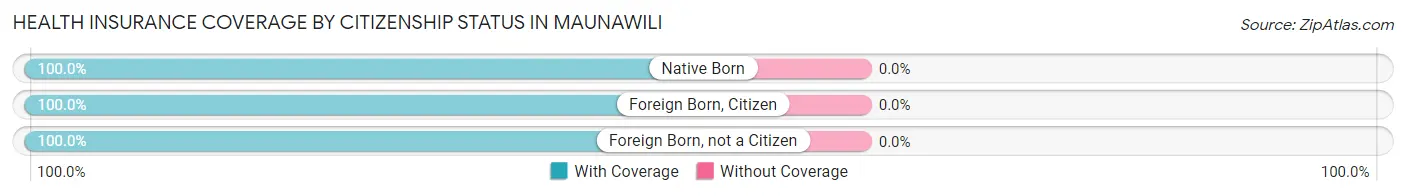
| Citizenship Status | With Coverage | Without Coverage |
| Native Born | 95 (100.0%) | 0 (0.0%) |
| Foreign Born, Citizen | 267 (100.0%) | 0 (0.0%) |
| Foreign Born, not a Citizen | 99 (100.0%) | 0 (0.0%) |
Health Insurance Coverage by Household Income in Maunawili
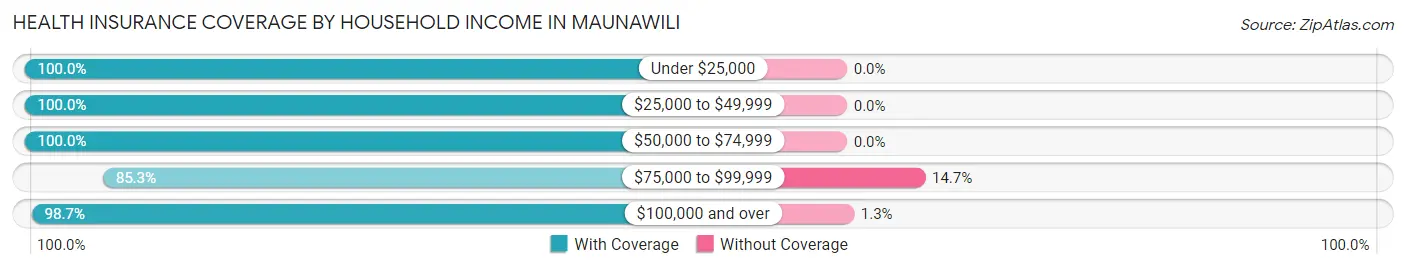
| Household Income | With Coverage | Without Coverage |
| Under $25,000 | 4 (100.0%) | 0 (0.0%) |
| $25,000 to $49,999 | 87 (100.0%) | 0 (0.0%) |
| $50,000 to $74,999 | 153 (100.0%) | 0 (0.0%) |
| $75,000 to $99,999 | 99 (85.3%) | 17 (14.7%) |
| $100,000 and over | 1,649 (98.7%) | 22 (1.3%) |
Public vs Private Health Insurance Coverage by Age in Maunawili
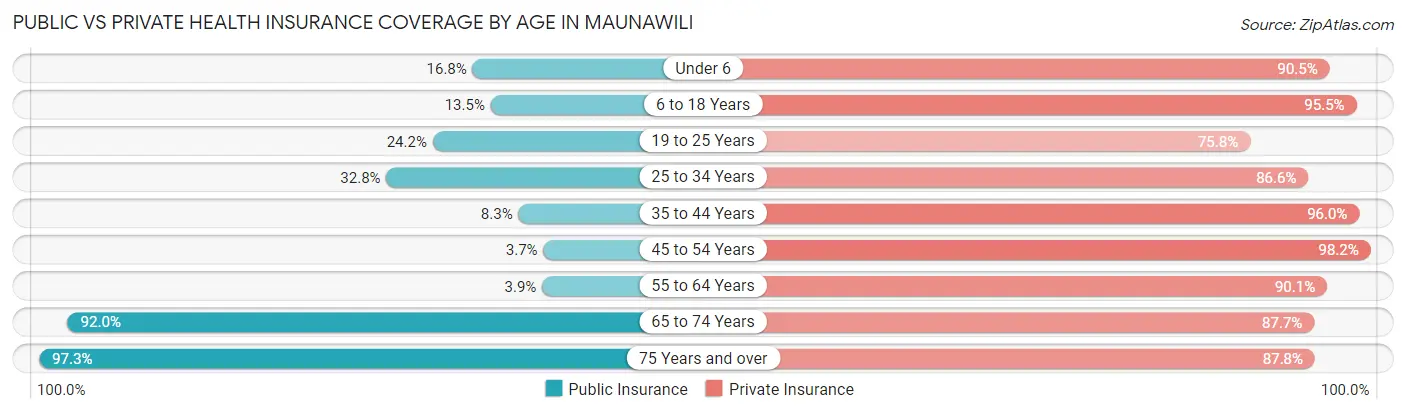
| Age Bracket | Public Insurance | Private Insurance |
| Under 6 | 16 (16.8%) | 86 (90.5%) |
| 6 to 18 Years | 36 (13.5%) | 255 (95.5%) |
| 19 to 25 Years | 24 (24.2%) | 75 (75.8%) |
| 25 to 34 Years | 44 (32.8%) | 116 (86.6%) |
| 35 to 44 Years | 21 (8.3%) | 242 (96.0%) |
| 45 to 54 Years | 8 (3.7%) | 212 (98.2%) |
| 55 to 64 Years | 15 (3.9%) | 344 (90.0%) |
| 65 to 74 Years | 276 (92.0%) | 263 (87.7%) |
| 75 Years and over | 287 (97.3%) | 259 (87.8%) |
| Total | 727 (35.6%) | 1,852 (90.8%) |
Disability Status by Sex by Age in Maunawili
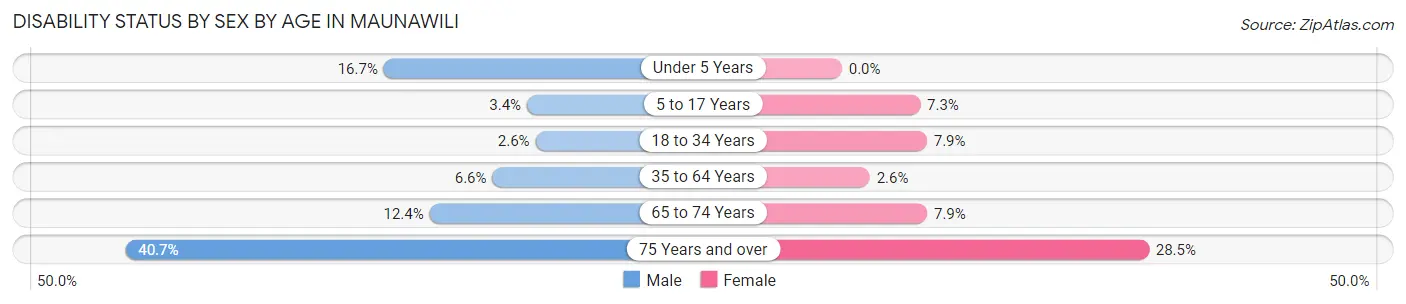
| Age Bracket | Male | Female |
| Under 5 Years | 8 (16.7%) | 0 (0.0%) |
| 5 to 17 Years | 5 (3.4%) | 8 (7.3%) |
| 18 to 34 Years | 3 (2.6%) | 12 (7.9%) |
| 35 to 64 Years | 28 (6.6%) | 11 (2.6%) |
| 65 to 74 Years | 20 (12.4%) | 11 (7.9%) |
| 75 Years and over | 50 (40.6%) | 49 (28.5%) |
Disability Class by Sex by Age in Maunawili
Disability Class: Hearing Difficulty
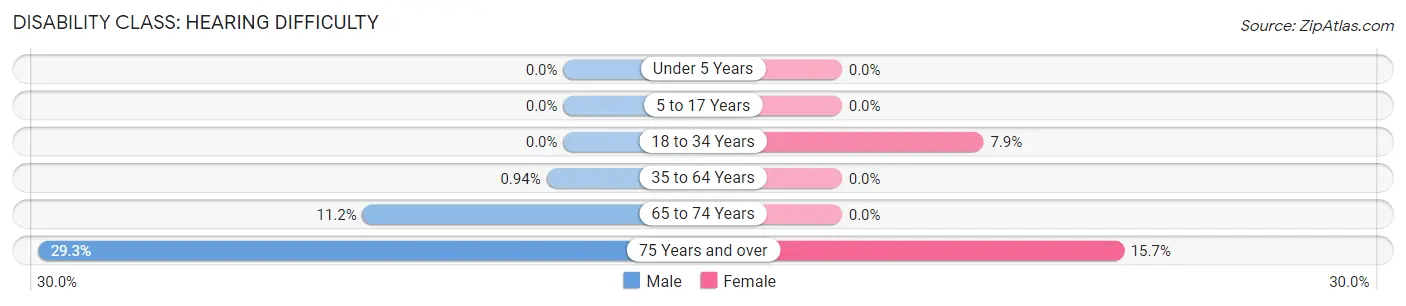
| Age Bracket | Male | Female |
| Under 5 Years | 0 (0.0%) | 0 (0.0%) |
| 5 to 17 Years | 0 (0.0%) | 0 (0.0%) |
| 18 to 34 Years | 0 (0.0%) | 12 (7.9%) |
| 35 to 64 Years | 4 (0.9%) | 0 (0.0%) |
| 65 to 74 Years | 18 (11.2%) | 0 (0.0%) |
| 75 Years and over | 36 (29.3%) | 27 (15.7%) |
Disability Class: Vision Difficulty
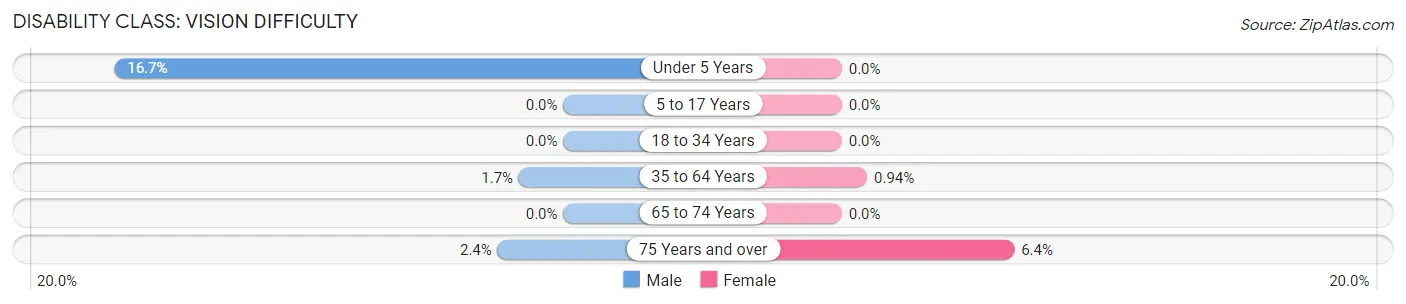
| Age Bracket | Male | Female |
| Under 5 Years | 8 (16.7%) | 0 (0.0%) |
| 5 to 17 Years | 0 (0.0%) | 0 (0.0%) |
| 18 to 34 Years | 0 (0.0%) | 0 (0.0%) |
| 35 to 64 Years | 7 (1.7%) | 4 (0.9%) |
| 65 to 74 Years | 0 (0.0%) | 0 (0.0%) |
| 75 Years and over | 3 (2.4%) | 11 (6.4%) |
Disability Class: Cognitive Difficulty
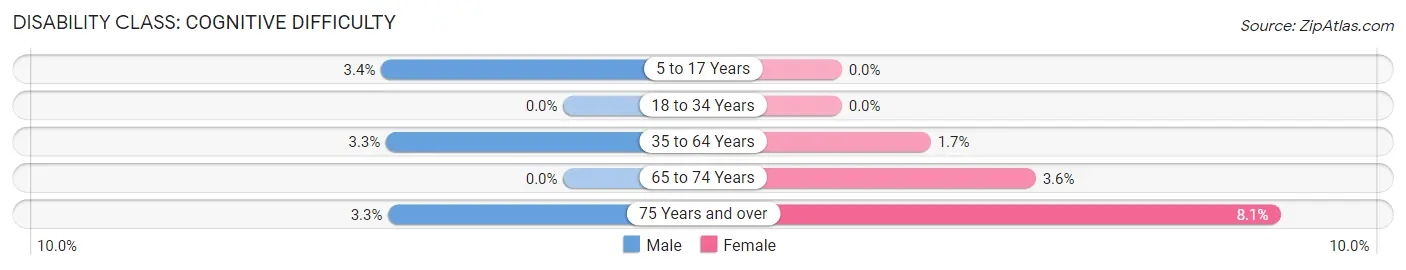
| Age Bracket | Male | Female |
| 5 to 17 Years | 5 (3.4%) | 0 (0.0%) |
| 18 to 34 Years | 0 (0.0%) | 0 (0.0%) |
| 35 to 64 Years | 14 (3.3%) | 7 (1.7%) |
| 65 to 74 Years | 0 (0.0%) | 5 (3.6%) |
| 75 Years and over | 4 (3.3%) | 14 (8.1%) |
Disability Class: Ambulatory Difficulty
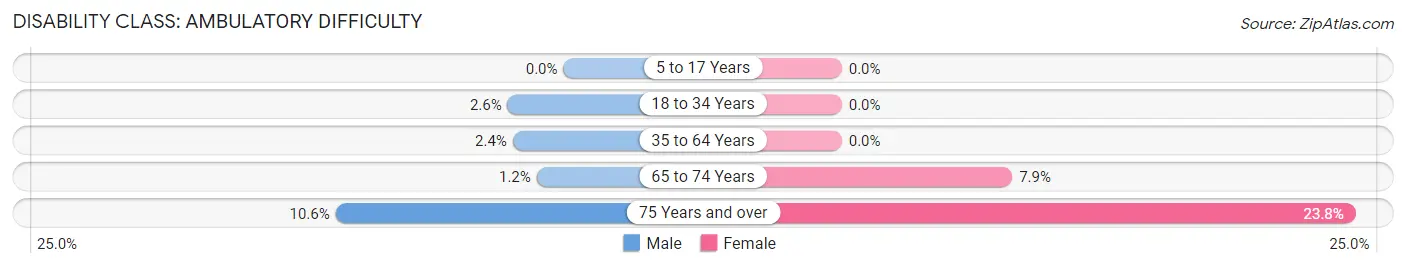
| Age Bracket | Male | Female |
| 5 to 17 Years | 0 (0.0%) | 0 (0.0%) |
| 18 to 34 Years | 3 (2.6%) | 0 (0.0%) |
| 35 to 64 Years | 10 (2.4%) | 0 (0.0%) |
| 65 to 74 Years | 2 (1.2%) | 11 (7.9%) |
| 75 Years and over | 13 (10.6%) | 41 (23.8%) |
Disability Class: Self-Care Difficulty
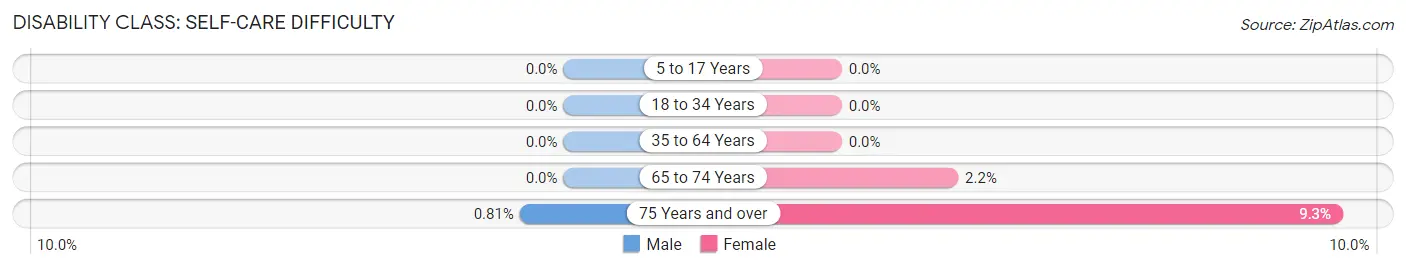
| Age Bracket | Male | Female |
| 5 to 17 Years | 0 (0.0%) | 0 (0.0%) |
| 18 to 34 Years | 0 (0.0%) | 0 (0.0%) |
| 35 to 64 Years | 0 (0.0%) | 0 (0.0%) |
| 65 to 74 Years | 0 (0.0%) | 3 (2.2%) |
| 75 Years and over | 1 (0.8%) | 16 (9.3%) |
Technology Access in Maunawili
Computing Device Access in Maunawili
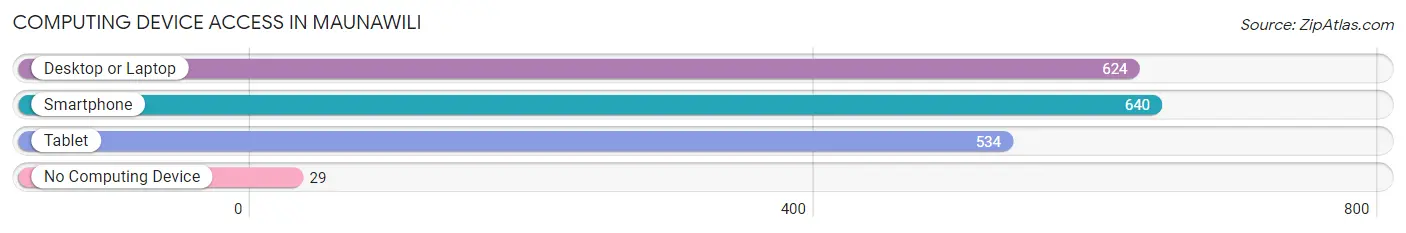
| Device Type | # Households | % Households |
| Desktop or Laptop | 624 | 89.5% |
| Smartphone | 640 | 91.8% |
| Tablet | 534 | 76.6% |
| No Computing Device | 29 | 4.2% |
| Total | 697 | 100.0% |
Internet Access in Maunawili
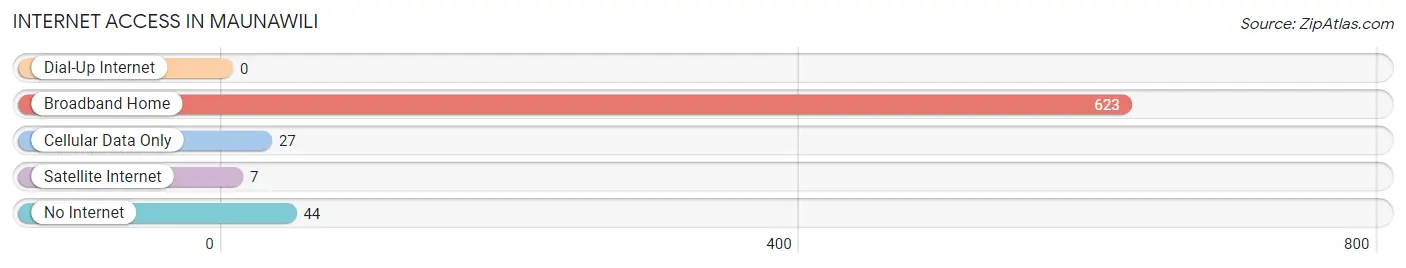
| Internet Type | # Households | % Households |
| Dial-Up Internet | 0 | 0.0% |
| Broadband Home | 623 | 89.4% |
| Cellular Data Only | 27 | 3.9% |
| Satellite Internet | 7 | 1.0% |
| No Internet | 44 | 6.3% |
| Total | 697 | 100.0% |
Maunawili Summary
Maunawili is a small, unincorporated community located in the Koʻolaupoko District of the island of Oʻahu in the U.S. state of Hawaiʻi. It is located in the ahupuaʻa of Maunawili, which is part of the larger Koʻolaupoko District of Oʻahu. The community is located in the foothills of the Koʻolau Mountains, and is bordered by the communities of Kailua and Waimanalo.
History
Maunawili was originally settled by Native Hawaiians in the late 1700s. The ahupuaʻa of Maunawili was part of the larger ahupuaʻa of Kailua, which was divided into two parts in 1845. The ahupuaʻa of Maunawili was then established as its own district.
In the late 1800s, Maunawili was home to a large sugar plantation, which was owned by the Maunawili Plantation Company. The plantation was established in 1883 and operated until the early 1900s. The plantation was eventually sold to the Maunawili Development Company, which developed the area into a residential community.
Geography
Maunawili is located in the Koʻolaupoko District of Oʻahu, in the foothills of the Koʻolau Mountains. The community is bordered by the communities of Kailua and Waimanalo. The area is characterized by its lush, tropical vegetation and its rolling hills.
The climate in Maunawili is tropical, with temperatures ranging from the mid-70s to the mid-80s Fahrenheit. The area receives an average of about 20 inches of rain per year.
Economy
The economy of Maunawili is largely based on tourism and agriculture. The area is home to several small farms, which produce a variety of fruits and vegetables. The area is also home to several small businesses, including restaurants, shops, and other services.
Demographics
As of the 2010 census, the population of Maunawili was 2,845. The population is largely made up of Native Hawaiians and other Pacific Islanders. The median household income in Maunawili is $76,944, and the median home value is $717,000.
Conclusion
Maunawili is a small, unincorporated community located in the Koʻolaupoko District of the island of Oʻahu in the U.S. state of Hawaiʻi. It is located in the ahupuaʻa of Maunawili, which is part of the larger Koʻolaupoko District of Oʻahu. The community is characterized by its lush, tropical vegetation and its rolling hills. The economy of Maunawili is largely based on tourism and agriculture, and the population is largely made up of Native Hawaiians and other Pacific Islanders.
Common Questions
What is Per Capita Income in Maunawili?
Per Capita income in Maunawili is $72,088.
What is the Median Family Income in Maunawili?
Median Family Income in Maunawili is $181,500.
What is the Median Household income in Maunawili?
Median Household Income in Maunawili is $169,375.
What is Income or Wage Gap in Maunawili?
Income or Wage Gap in Maunawili is 47.4%.
Women in Maunawili earn 52.6 cents for every dollar earned by a man.
What is Inequality or Gini Index in Maunawili?
Inequality or Gini Index in Maunawili is 0.37.
What is the Total Population of Maunawili?
Total Population of Maunawili is 2,067.
What is the Total Male Population of Maunawili?
Total Male Population of Maunawili is 1,037.
What is the Total Female Population of Maunawili?
Total Female Population of Maunawili is 1,030.
What is the Ratio of Males per 100 Females in Maunawili?
There are 100.68 Males per 100 Females in Maunawili.
What is the Ratio of Females per 100 Males in Maunawili?
There are 99.32 Females per 100 Males in Maunawili.
What is the Median Population Age in Maunawili?
Median Population Age in Maunawili is 52.6 Years.
What is the Average Family Size in Maunawili
Average Family Size in Maunawili is 3.0 People.
What is the Average Household Size in Maunawili
Average Household Size in Maunawili is 3.0 People.
How Large is the Labor Force in Maunawili?
There are 1,142 People in the Labor Forcein in Maunawili.
What is the Percentage of People in the Labor Force in Maunawili?
64.4% of People are in the Labor Force in Maunawili.
What is the Unemployment Rate in Maunawili?
Unemployment Rate in Maunawili is 2.1%.