Kaanapali, HI Map & Demographics
Kaanapali Map
Kaanapali Overview
$87,814
PER CAPITA INCOME
$146,111
AVG FAMILY INCOME
$119,044
AVG HOUSEHOLD INCOME
12.7%
WAGE / INCOME GAP [ % ]
87.3¢/ $1
WAGE / INCOME GAP [ $ ]
0.54
INEQUALITY / GINI INDEX
1,227
TOTAL POPULATION
666
MALE POPULATION
561
FEMALE POPULATION
118.72
MALES / 100 FEMALES
84.23
FEMALES / 100 MALES
61.2
MEDIAN AGE
2.6
AVG FAMILY SIZE
2.2
AVG HOUSEHOLD SIZE
457
LABOR FORCE [ PEOPLE ]
42.5%
PERCENT IN LABOR FORCE
21.4%
UNEMPLOYMENT RATE
Income in Kaanapali
Income Overview in Kaanapali
Per Capita Income in Kaanapali is $87,814, while median incomes of families and households are $146,111 and $119,044 respectively.
| Characteristic | Number | Measure |
| Per Capita Income | 1,227 | $87,814 |
| Median Family Income | 366 | $146,111 |
| Mean Family Income | 366 | $232,736 |
| Median Household Income | 549 | $119,044 |
| Mean Household Income | 549 | $200,284 |
| Income Deficit | 366 | $0 |
| Wage / Income Gap (%) | 1,227 | 12.68% |
| Wage / Income Gap ($) | 1,227 | 87.32¢ per $1 |
| Gini / Inequality Index | 1,227 | 0.54 |
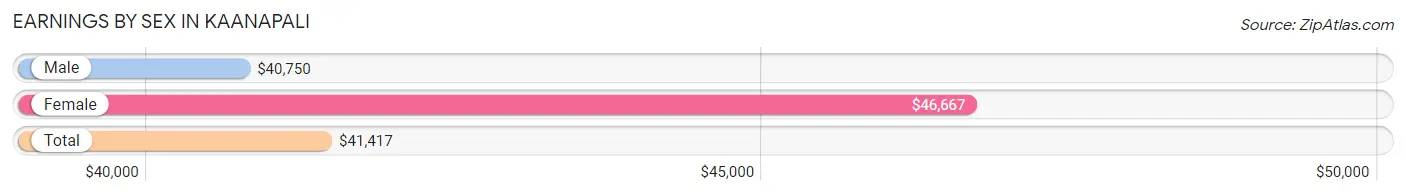
Earnings by Sex in Kaanapali
Average Earnings in Kaanapali are $41,417, $40,750 for men and $46,667 for women, a difference of 12.7%.
| Sex | Number | Average Earnings |
| Male | 317 (65.4%) | $40,750 |
| Female | 168 (34.6%) | $46,667 |
| Total | 485 (100.0%) | $41,417 |
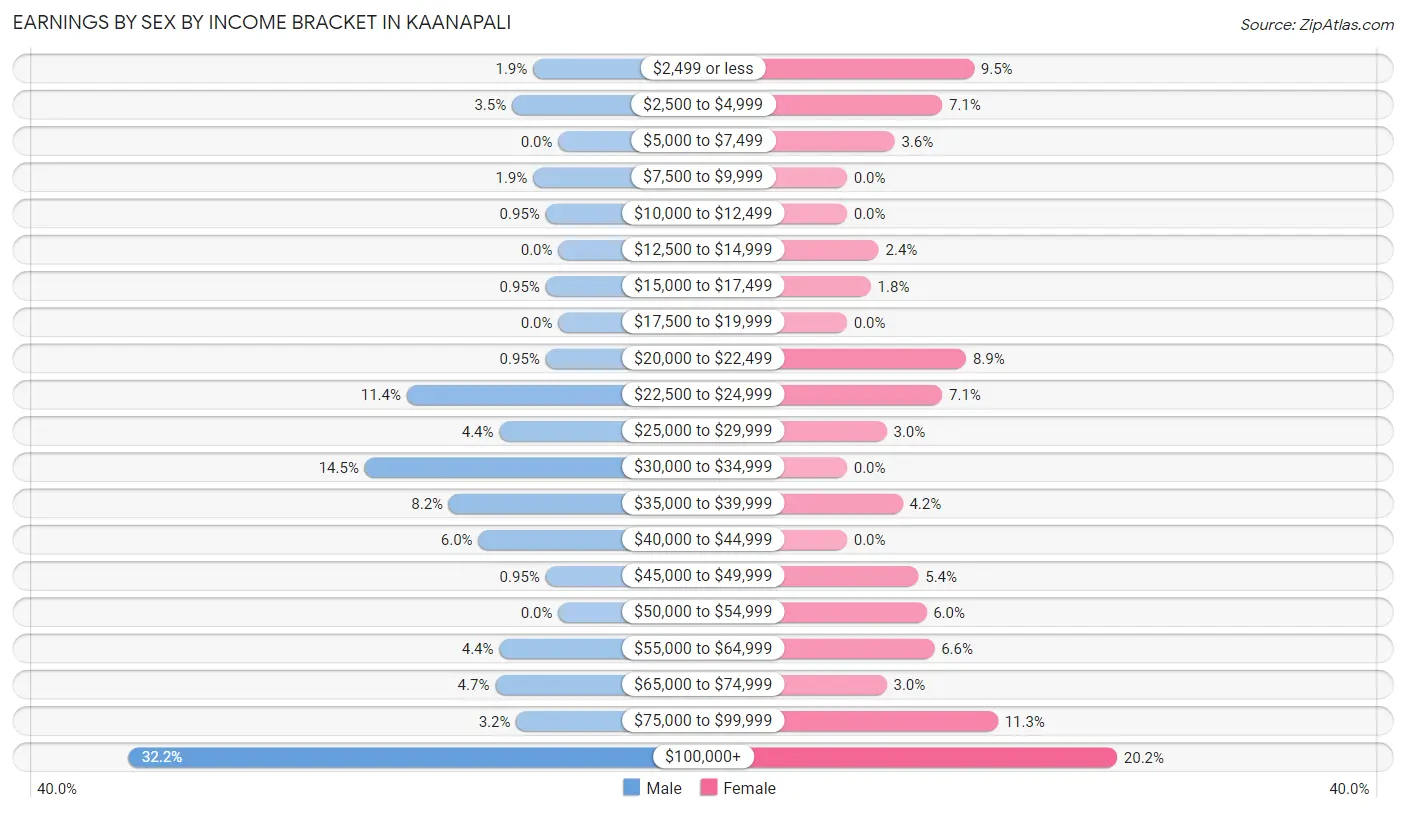
Earnings by Sex by Income Bracket in Kaanapali
The most common earnings brackets in Kaanapali are $100,000+ for men (102 | 32.2%) and $100,000+ for women (34 | 20.2%).
| Income | Male | Female |
| $2,499 or less | 6 (1.9%) | 16 (9.5%) |
| $2,500 to $4,999 | 11 (3.5%) | 12 (7.1%) |
| $5,000 to $7,499 | 0 (0.0%) | 6 (3.6%) |
| $7,500 to $9,999 | 6 (1.9%) | 0 (0.0%) |
| $10,000 to $12,499 | 3 (0.9%) | 0 (0.0%) |
| $12,500 to $14,999 | 0 (0.0%) | 4 (2.4%) |
| $15,000 to $17,499 | 3 (0.9%) | 3 (1.8%) |
| $17,500 to $19,999 | 0 (0.0%) | 0 (0.0%) |
| $20,000 to $22,499 | 3 (0.9%) | 15 (8.9%) |
| $22,500 to $24,999 | 36 (11.4%) | 12 (7.1%) |
| $25,000 to $29,999 | 14 (4.4%) | 5 (3.0%) |
| $30,000 to $34,999 | 46 (14.5%) | 0 (0.0%) |
| $35,000 to $39,999 | 26 (8.2%) | 7 (4.2%) |
| $40,000 to $44,999 | 19 (6.0%) | 0 (0.0%) |
| $45,000 to $49,999 | 3 (0.9%) | 9 (5.4%) |
| $50,000 to $54,999 | 0 (0.0%) | 10 (5.9%) |
| $55,000 to $64,999 | 14 (4.4%) | 11 (6.6%) |
| $65,000 to $74,999 | 15 (4.7%) | 5 (3.0%) |
| $75,000 to $99,999 | 10 (3.2%) | 19 (11.3%) |
| $100,000+ | 102 (32.2%) | 34 (20.2%) |
| Total | 317 (100.0%) | 168 (100.0%) |
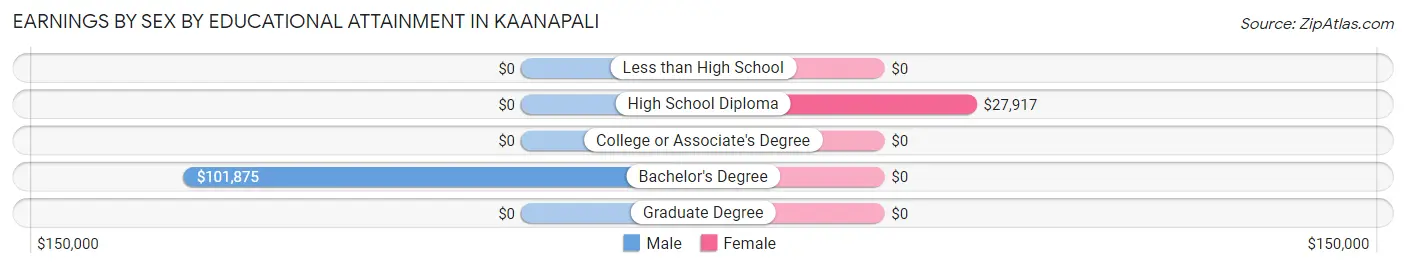
Earnings by Sex by Educational Attainment in Kaanapali
| Educational Attainment | Male Income | Female Income |
| Less than High School | - | - |
| High School Diploma | - | - |
| College or Associate's Degree | - | - |
| Bachelor's Degree | $101,875 | $0 |
| Graduate Degree | - | - |
| Total | - | - |
Family Income in Kaanapali
Family Income Brackets in Kaanapali
According to the Kaanapali family income data, there are 141 families falling into the $200,000+ income range, which is the most common income bracket and makes up 38.5% of all families. Conversely, the $10,000 to $14,999 income bracket is the least frequent group with only 3 families (0.8%) belonging to this category.
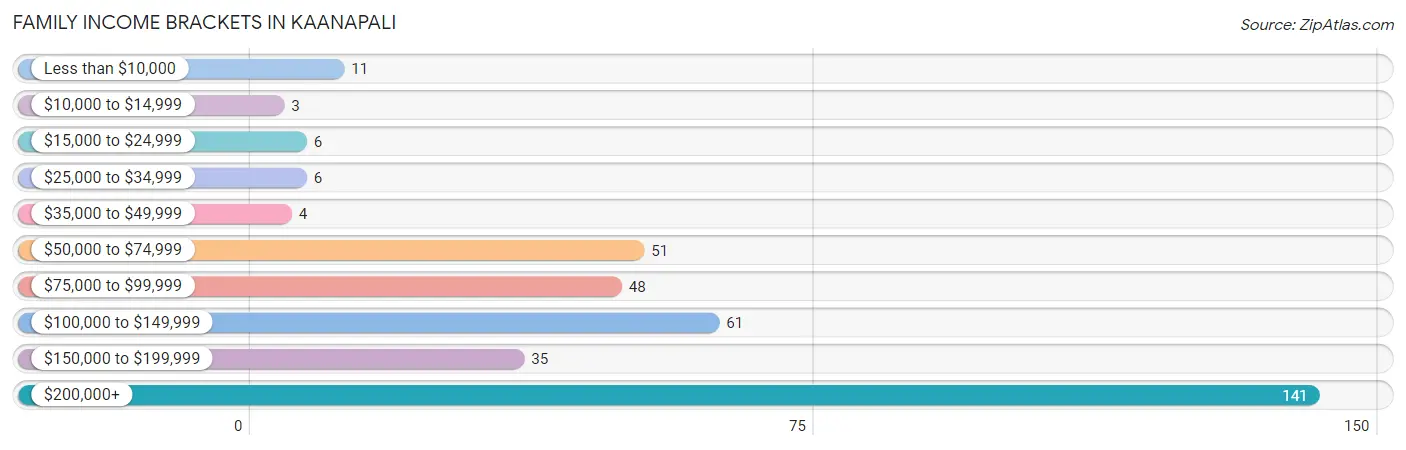
| Income Bracket | # Families | % Families |
| Less than $10,000 | 11 | 3.0% |
| $10,000 to $14,999 | 3 | 0.8% |
| $15,000 to $24,999 | 6 | 1.6% |
| $25,000 to $34,999 | 6 | 1.6% |
| $35,000 to $49,999 | 4 | 1.1% |
| $50,000 to $74,999 | 51 | 13.9% |
| $75,000 to $99,999 | 48 | 13.1% |
| $100,000 to $149,999 | 61 | 16.7% |
| $150,000 to $199,999 | 35 | 9.6% |
| $200,000+ | 141 | 38.5% |
Family Income by Famaliy Size in Kaanapali
4-person families (13 | 3.5%) account for the highest median family income in Kaanapali with $250,001 per family, while 2-person families (276 | 75.4%) have the highest median income of $66,250 per family member.
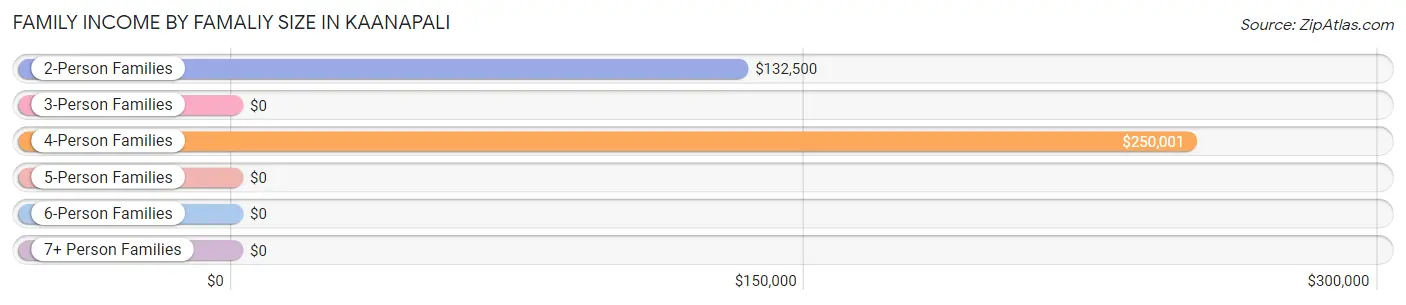
| Income Bracket | # Families | Median Income |
| 2-Person Families | 276 (75.4%) | $132,500 |
| 3-Person Families | 36 (9.8%) | $0 |
| 4-Person Families | 13 (3.5%) | $250,001 |
| 5-Person Families | 33 (9.0%) | $0 |
| 6-Person Families | 0 (0.0%) | $0 |
| 7+ Person Families | 8 (2.2%) | $0 |
| Total | 366 (100.0%) | $146,111 |
Family Income by Number of Earners in Kaanapali
The median family income in Kaanapali is $146,111, with families comprising 3+ earners (12) having the highest median family income of $250,001, while families with 1 earner (85) have the lowest median family income of $132,083, accounting for 3.3% and 23.2% of families, respectively.
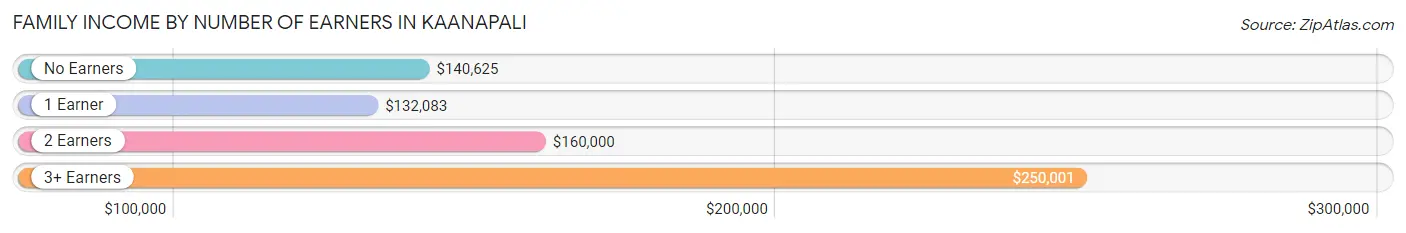
| Number of Earners | # Families | Median Income |
| No Earners | 165 (45.1%) | $140,625 |
| 1 Earner | 85 (23.2%) | $132,083 |
| 2 Earners | 104 (28.4%) | $160,000 |
| 3+ Earners | 12 (3.3%) | $250,001 |
| Total | 366 (100.0%) | $146,111 |
Household Income in Kaanapali
Household Income Brackets in Kaanapali
With 168 households falling in the category, the $200,000+ income range is the most frequent in Kaanapali, accounting for 30.6% of all households. In contrast, only 4 households (0.7%) fall into the $35,000 to $49,999 income bracket, making it the least populous group.
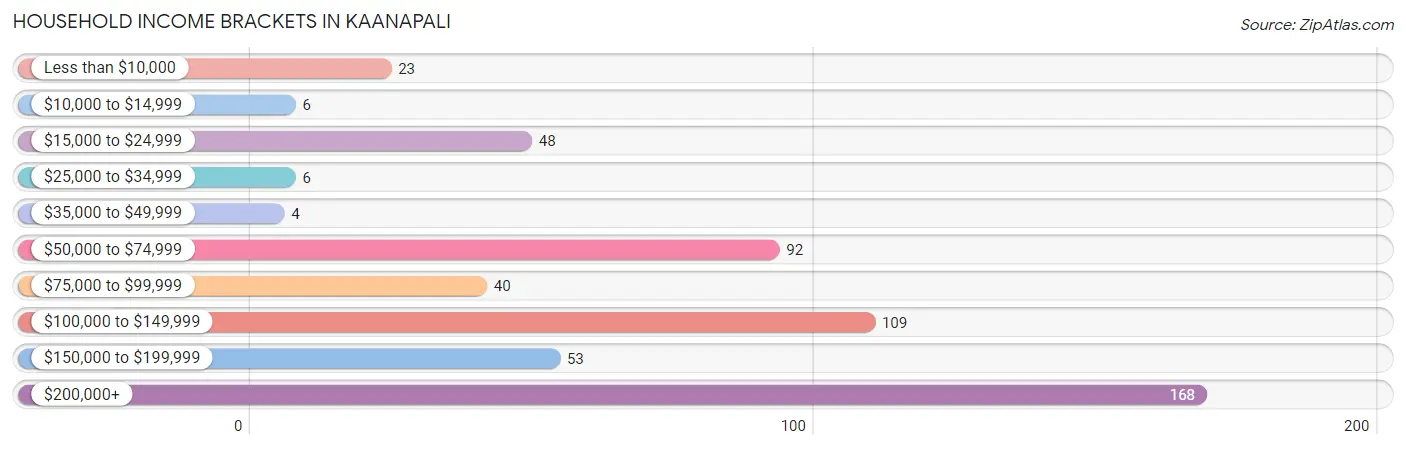
| Income Bracket | # Households | % Households |
| Less than $10,000 | 23 | 4.2% |
| $10,000 to $14,999 | 6 | 1.1% |
| $15,000 to $24,999 | 48 | 8.7% |
| $25,000 to $34,999 | 6 | 1.1% |
| $35,000 to $49,999 | 4 | 0.7% |
| $50,000 to $74,999 | 92 | 16.8% |
| $75,000 to $99,999 | 40 | 7.3% |
| $100,000 to $149,999 | 109 | 19.9% |
| $150,000 to $199,999 | 53 | 9.7% |
| $200,000+ | 168 | 30.6% |
Household Income by Householder Age in Kaanapali
The median household income in Kaanapali is $119,044, with the highest median household income of $128,750 found in the 45 to 64 years age bracket for the primary householder. A total of 143 households (26.1%) fall into this category.
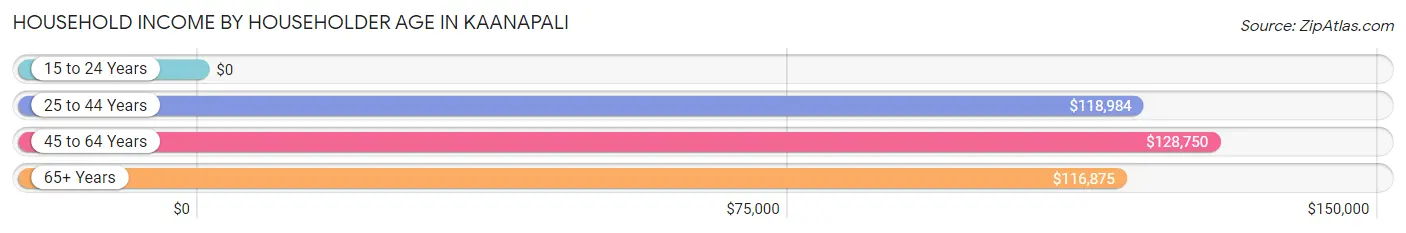
| Income Bracket | # Households | Median Income |
| 15 to 24 Years | 0 (0.0%) | $0 |
| 25 to 44 Years | 71 (12.9%) | $118,984 |
| 45 to 64 Years | 143 (26.1%) | $128,750 |
| 65+ Years | 335 (61.0%) | $116,875 |
| Total | 549 (100.0%) | $119,044 |
Poverty in Kaanapali
Income Below Poverty by Sex and Age in Kaanapali
With 3.7% poverty level for males and 10.2% for females among the residents of Kaanapali, 55 to 64 year old males and 75 year old and over females are the most vulnerable to poverty, with 13 males (10.2%) and 17 females (22.1%) in their respective age groups living below the poverty level.
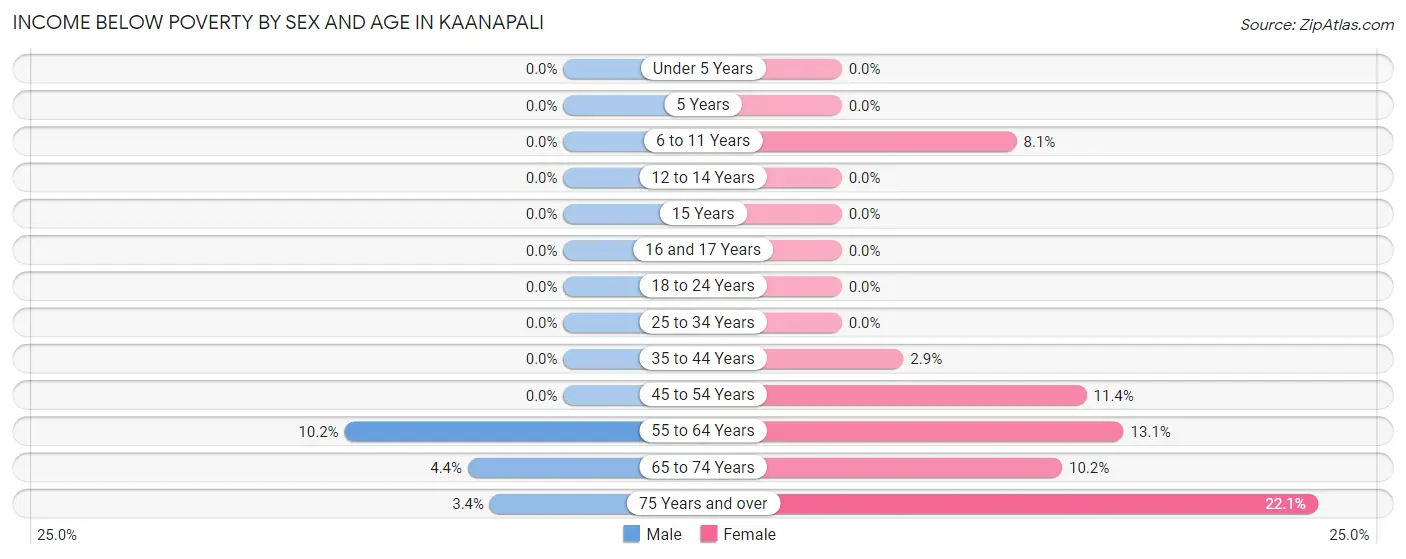
| Age Bracket | Male | Female |
| Under 5 Years | 0 (0.0%) | 0 (0.0%) |
| 5 Years | 0 (0.0%) | 0 (0.0%) |
| 6 to 11 Years | 0 (0.0%) | 3 (8.1%) |
| 12 to 14 Years | 0 (0.0%) | 0 (0.0%) |
| 15 Years | 0 (0.0%) | 0 (0.0%) |
| 16 and 17 Years | 0 (0.0%) | 0 (0.0%) |
| 18 to 24 Years | 0 (0.0%) | 0 (0.0%) |
| 25 to 34 Years | 0 (0.0%) | 0 (0.0%) |
| 35 to 44 Years | 0 (0.0%) | 1 (2.9%) |
| 45 to 54 Years | 0 (0.0%) | 5 (11.4%) |
| 55 to 64 Years | 13 (10.2%) | 17 (13.1%) |
| 65 to 74 Years | 9 (4.4%) | 14 (10.2%) |
| 75 Years and over | 3 (3.4%) | 17 (22.1%) |
| Total | 25 (3.7%) | 57 (10.2%) |
Income Above Poverty by Sex and Age in Kaanapali
According to the poverty statistics in Kaanapali, males aged under 5 years and females aged under 5 years are the age groups that are most secure financially, with 100.0% of males and 100.0% of females in these age groups living above the poverty line.
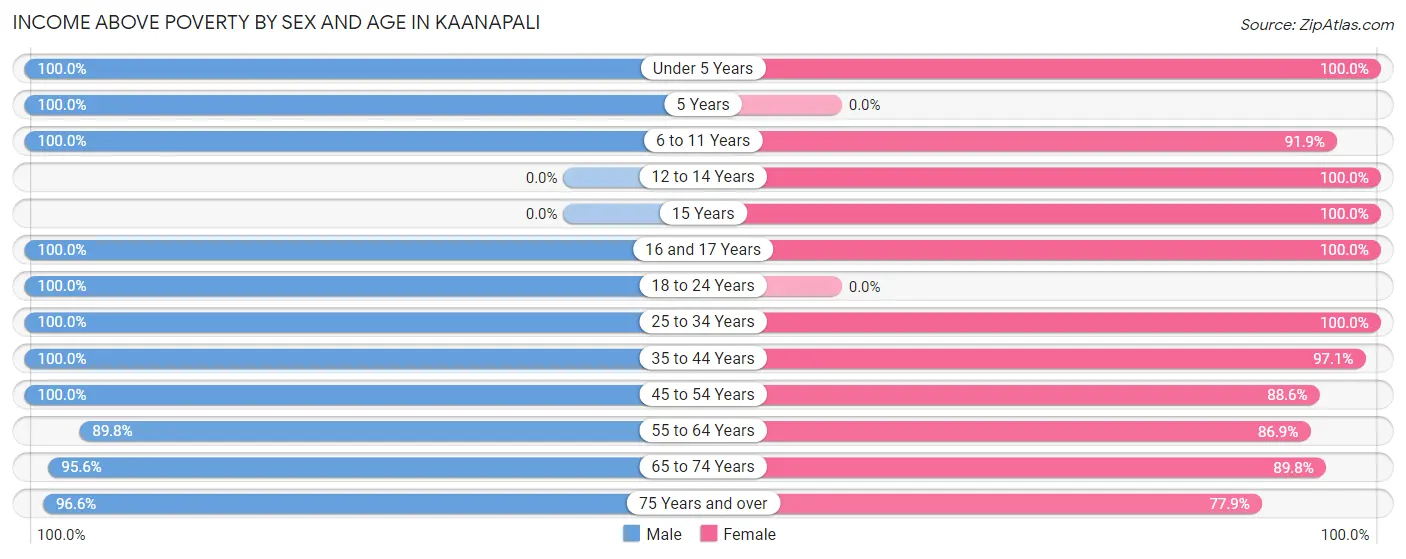
| Age Bracket | Male | Female |
| Under 5 Years | 63 (100.0%) | 16 (100.0%) |
| 5 Years | 9 (100.0%) | 0 (0.0%) |
| 6 to 11 Years | 6 (100.0%) | 34 (91.9%) |
| 12 to 14 Years | 0 (0.0%) | 18 (100.0%) |
| 15 Years | 0 (0.0%) | 3 (100.0%) |
| 16 and 17 Years | 11 (100.0%) | 2 (100.0%) |
| 18 to 24 Years | 17 (100.0%) | 0 (0.0%) |
| 25 to 34 Years | 94 (100.0%) | 62 (100.0%) |
| 35 to 44 Years | 18 (100.0%) | 34 (97.1%) |
| 45 to 54 Years | 29 (100.0%) | 39 (88.6%) |
| 55 to 64 Years | 115 (89.8%) | 113 (86.9%) |
| 65 to 74 Years | 194 (95.6%) | 123 (89.8%) |
| 75 Years and over | 85 (96.6%) | 60 (77.9%) |
| Total | 641 (96.3%) | 504 (89.8%) |
Income Below Poverty Among Married-Couple Families in Kaanapali
The poverty statistics for married-couple families in Kaanapali show that 5.7% or 19 of the total 331 families live below the poverty line. Families with no children have the highest poverty rate of 7.2%, comprising of 19 families. On the other hand, families with 1 or 2 children have the lowest poverty rate of 0.0%, which includes 0 families.
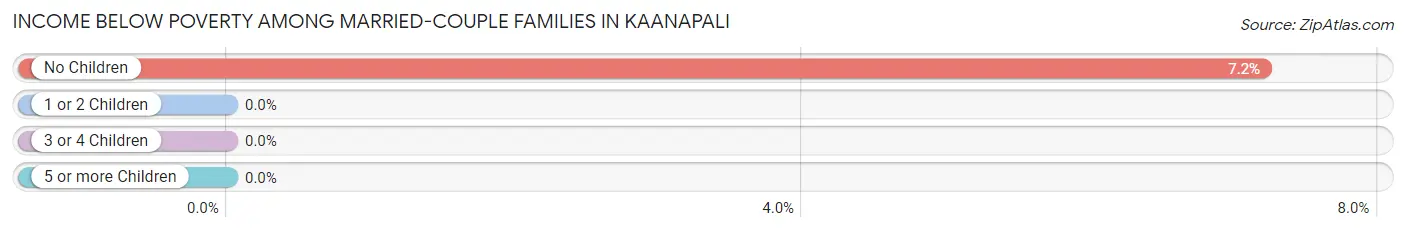
| Children | Above Poverty | Below Poverty |
| No Children | 245 (92.8%) | 19 (7.2%) |
| 1 or 2 Children | 34 (100.0%) | 0 (0.0%) |
| 3 or 4 Children | 33 (100.0%) | 0 (0.0%) |
| 5 or more Children | 0 (0.0%) | 0 (0.0%) |
| Total | 312 (94.3%) | 19 (5.7%) |
Income Below Poverty Among Single-Parent Households in Kaanapali
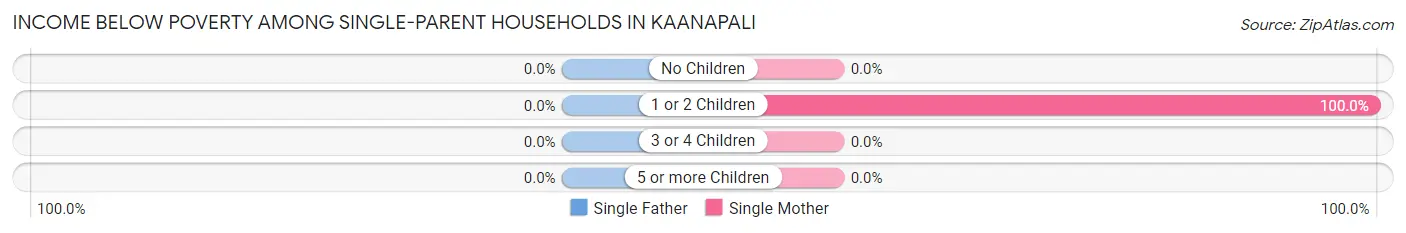
| Children | Single Father | Single Mother |
| No Children | 0 (0.0%) | 0 (0.0%) |
| 1 or 2 Children | 0 (0.0%) | 1 (100.0%) |
| 3 or 4 Children | 0 (0.0%) | 0 (0.0%) |
| 5 or more Children | 0 (0.0%) | 0 (0.0%) |
| Total | 0 (0.0%) | 1 (5.3%) |
Income Below Poverty Among Married-Couple vs Single-Parent Households in Kaanapali
The poverty data for Kaanapali shows that 19 of the married-couple family households (5.7%) and 1 of the single-parent households (2.9%) are living below the poverty level. Within the married-couple family households, those with no children have the highest poverty rate, with 19 households (7.2%) falling below the poverty line. Among the single-parent households, those with 1 or 2 children have the highest poverty rate, with 1 household (100.0%) living below poverty.
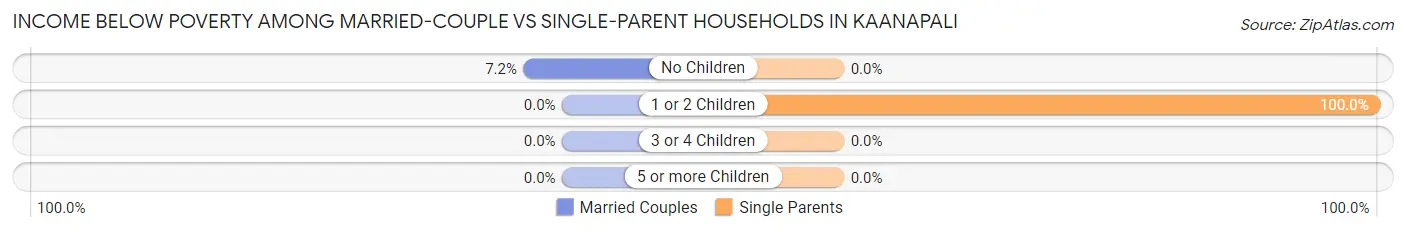
| Children | Married-Couple Families | Single-Parent Households |
| No Children | 19 (7.2%) | 0 (0.0%) |
| 1 or 2 Children | 0 (0.0%) | 1 (100.0%) |
| 3 or 4 Children | 0 (0.0%) | 0 (0.0%) |
| 5 or more Children | 0 (0.0%) | 0 (0.0%) |
| Total | 19 (5.7%) | 1 (2.9%) |
Race in Kaanapali
The most populous races in Kaanapali are White / Caucasian (921 | 75.1%), Two or more Races (212 | 17.3%), and Hispanic or Latino (157 | 12.8%).
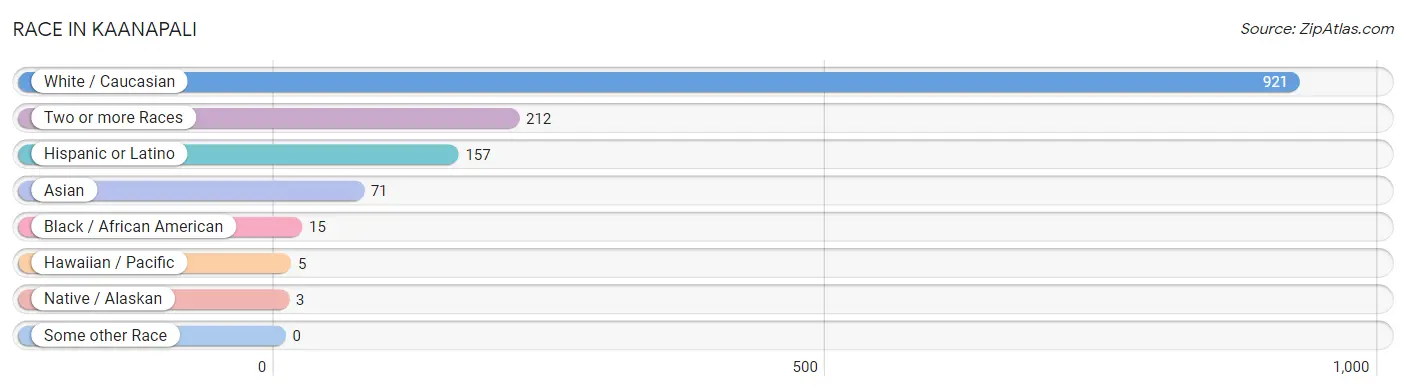
| Race | # Population | % Population |
| Asian | 71 | 5.8% |
| Black / African American | 15 | 1.2% |
| Hawaiian / Pacific | 5 | 0.4% |
| Hispanic or Latino | 157 | 12.8% |
| Native / Alaskan | 3 | 0.2% |
| White / Caucasian | 921 | 75.1% |
| Two or more Races | 212 | 17.3% |
| Some other Race | 0 | 0.0% |
| Total | 1,227 | 100.0% |
Ancestry in Kaanapali
The most populous ancestries reported in Kaanapali are English (170 | 13.9%), German (141 | 11.5%), Irish (105 | 8.6%), Portuguese (92 | 7.5%), and Korean (89 | 7.2%), together accounting for 48.7% of all Kaanapali residents.
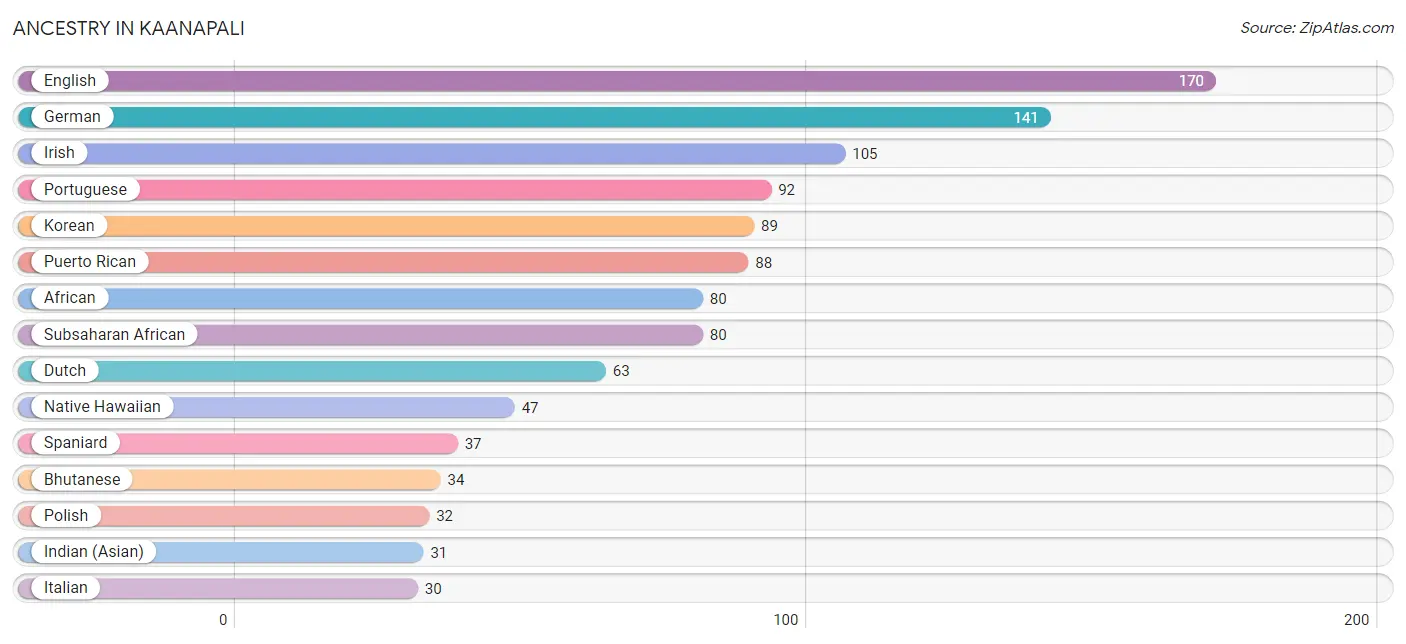
| Ancestry | # Population | % Population |
| African | 80 | 6.5% |
| American | 23 | 1.9% |
| Arab | 4 | 0.3% |
| Austrian | 3 | 0.2% |
| Bhutanese | 34 | 2.8% |
| British | 13 | 1.1% |
| Burmese | 5 | 0.4% |
| Central American Indian | 3 | 0.2% |
| Danish | 3 | 0.2% |
| Dutch | 63 | 5.1% |
| Eastern European | 9 | 0.7% |
| English | 170 | 13.9% |
| European | 10 | 0.8% |
| French | 18 | 1.5% |
| French Canadian | 5 | 0.4% |
| German | 141 | 11.5% |
| Hungarian | 16 | 1.3% |
| Indian (Asian) | 31 | 2.5% |
| Irish | 105 | 8.6% |
| Italian | 30 | 2.4% |
| Korean | 89 | 7.2% |
| Lebanese | 4 | 0.3% |
| Luxembourger | 3 | 0.2% |
| Mexican | 22 | 1.8% |
| Native Hawaiian | 47 | 3.8% |
| Norwegian | 19 | 1.5% |
| Pakistani | 6 | 0.5% |
| Polish | 32 | 2.6% |
| Portuguese | 92 | 7.5% |
| Puerto Rican | 88 | 7.2% |
| Russian | 18 | 1.5% |
| Samoan | 2 | 0.2% |
| Scotch-Irish | 15 | 1.2% |
| Scottish | 24 | 2.0% |
| Serbian | 6 | 0.5% |
| Slovene | 1 | 0.1% |
| Spaniard | 37 | 3.0% |
| Spanish | 6 | 0.5% |
| Sri Lankan | 9 | 0.7% |
| Subsaharan African | 80 | 6.5% |
| Swedish | 24 | 2.0% |
| Swiss | 28 | 2.3% |
| Thai | 7 | 0.6% |
| Welsh | 5 | 0.4% | View All 44 Rows |
Immigrants in Kaanapali
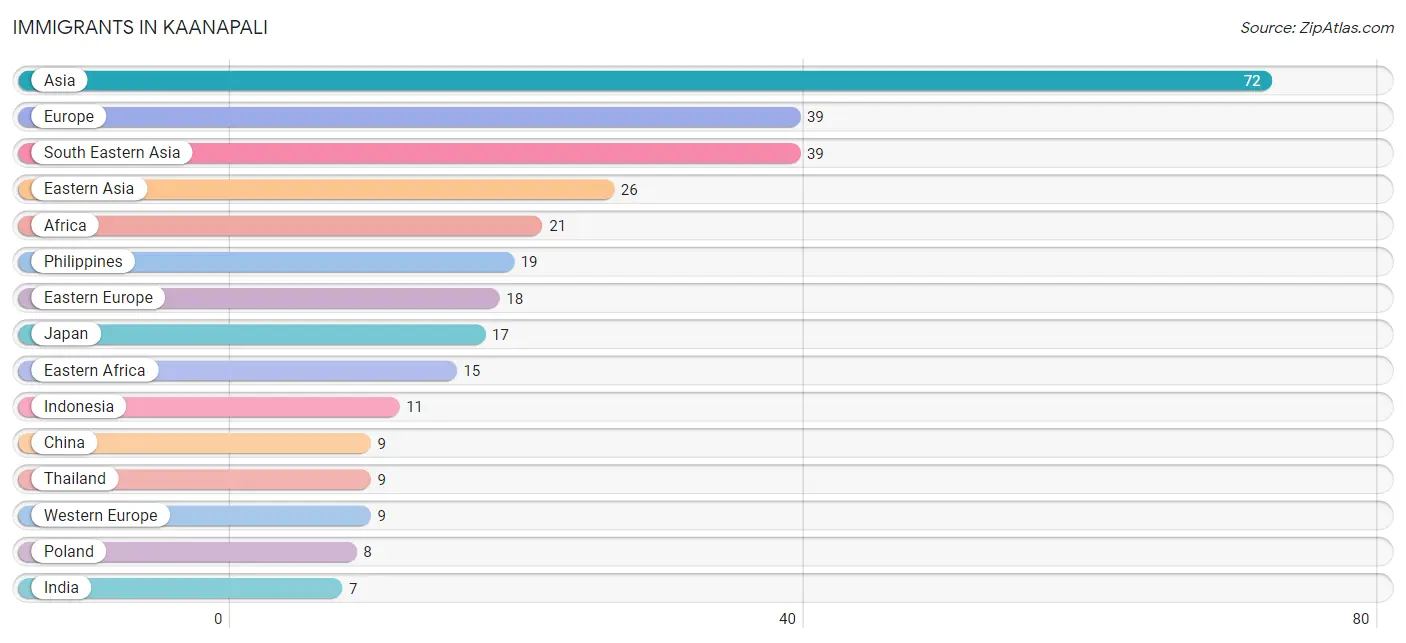
The most numerous immigrant groups reported in Kaanapali came from Asia (72 | 5.9%), Europe (39 | 3.2%), South Eastern Asia (39 | 3.2%), Eastern Asia (26 | 2.1%), and Africa (21 | 1.7%), together accounting for 16.1% of all Kaanapali residents.
| Immigration Origin | # Population | % Population |
| Africa | 21 | 1.7% |
| Asia | 72 | 5.9% |
| Austria | 1 | 0.1% |
| Canada | 1 | 0.1% |
| China | 9 | 0.7% |
| Denmark | 3 | 0.2% |
| Eastern Africa | 15 | 1.2% |
| Eastern Asia | 26 | 2.1% |
| Eastern Europe | 18 | 1.5% |
| Europe | 39 | 3.2% |
| Germany | 3 | 0.2% |
| Hungary | 6 | 0.5% |
| India | 7 | 0.6% |
| Indonesia | 11 | 0.9% |
| Japan | 17 | 1.4% |
| Netherlands | 2 | 0.2% |
| Northern Europe | 6 | 0.5% |
| Oceania | 7 | 0.6% |
| Philippines | 19 | 1.5% |
| Poland | 8 | 0.6% |
| Serbia | 4 | 0.3% |
| South Africa | 6 | 0.5% |
| South Central Asia | 7 | 0.6% |
| South Eastern Asia | 39 | 3.2% |
| Southern Europe | 6 | 0.5% |
| Spain | 6 | 0.5% |
| Sweden | 2 | 0.2% |
| Switzerland | 3 | 0.2% |
| Taiwan | 6 | 0.5% |
| Thailand | 9 | 0.7% |
| Western Europe | 9 | 0.7% | View All 31 Rows |
Sex and Age in Kaanapali
Sex and Age in Kaanapali
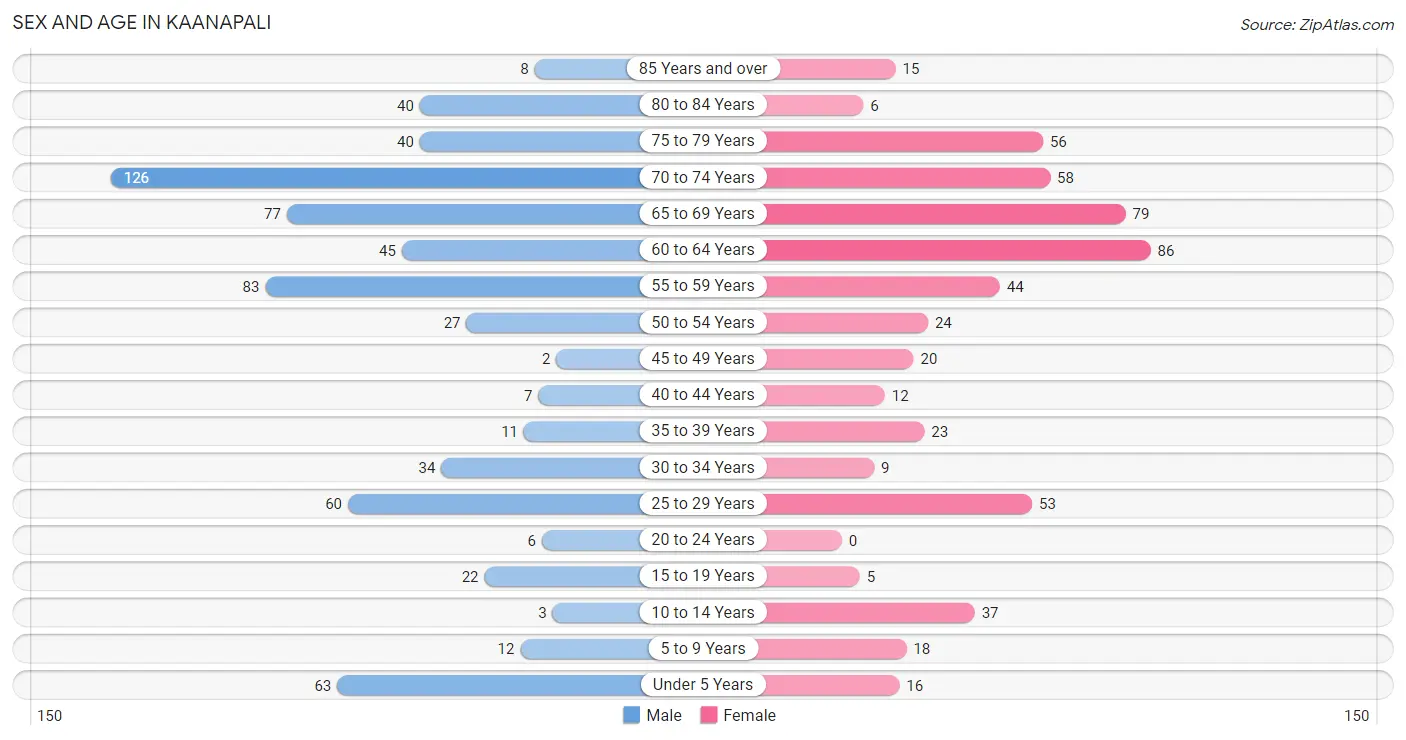
The most populous age groups in Kaanapali are 70 to 74 Years (126 | 18.9%) for men and 60 to 64 Years (86 | 15.3%) for women.
| Age Bracket | Male | Female |
| Under 5 Years | 63 (9.5%) | 16 (2.9%) |
| 5 to 9 Years | 12 (1.8%) | 18 (3.2%) |
| 10 to 14 Years | 3 (0.4%) | 37 (6.6%) |
| 15 to 19 Years | 22 (3.3%) | 5 (0.9%) |
| 20 to 24 Years | 6 (0.9%) | 0 (0.0%) |
| 25 to 29 Years | 60 (9.0%) | 53 (9.5%) |
| 30 to 34 Years | 34 (5.1%) | 9 (1.6%) |
| 35 to 39 Years | 11 (1.7%) | 23 (4.1%) |
| 40 to 44 Years | 7 (1.1%) | 12 (2.1%) |
| 45 to 49 Years | 2 (0.3%) | 20 (3.6%) |
| 50 to 54 Years | 27 (4.1%) | 24 (4.3%) |
| 55 to 59 Years | 83 (12.5%) | 44 (7.8%) |
| 60 to 64 Years | 45 (6.8%) | 86 (15.3%) |
| 65 to 69 Years | 77 (11.6%) | 79 (14.1%) |
| 70 to 74 Years | 126 (18.9%) | 58 (10.3%) |
| 75 to 79 Years | 40 (6.0%) | 56 (10.0%) |
| 80 to 84 Years | 40 (6.0%) | 6 (1.1%) |
| 85 Years and over | 8 (1.2%) | 15 (2.7%) |
| Total | 666 (100.0%) | 561 (100.0%) |
Families and Households in Kaanapali
Median Family Size in Kaanapali
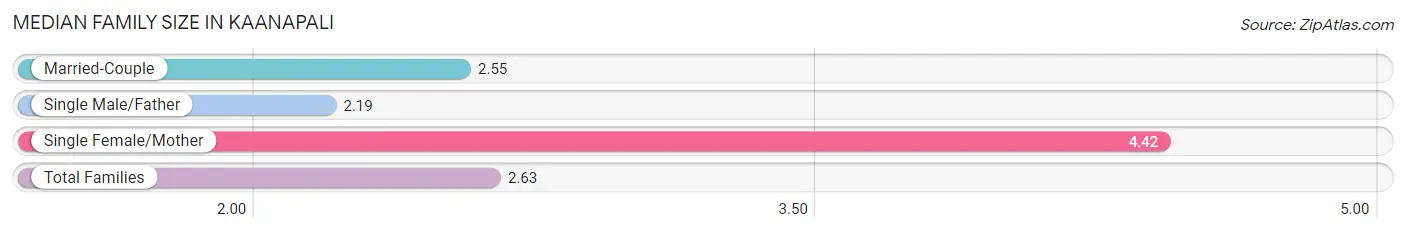
The median family size in Kaanapali is 2.63 persons per family, with single female/mother families (19 | 5.2%) accounting for the largest median family size of 4.42 persons per family. On the other hand, single male/father families (16 | 4.4%) represent the smallest median family size with 2.19 persons per family.
| Family Type | # Families | Family Size |
| Married-Couple | 331 (90.4%) | 2.55 |
| Single Male/Father | 16 (4.4%) | 2.19 |
| Single Female/Mother | 19 (5.2%) | 4.42 |
| Total Families | 366 (100.0%) | 2.63 |
Median Household Size in Kaanapali
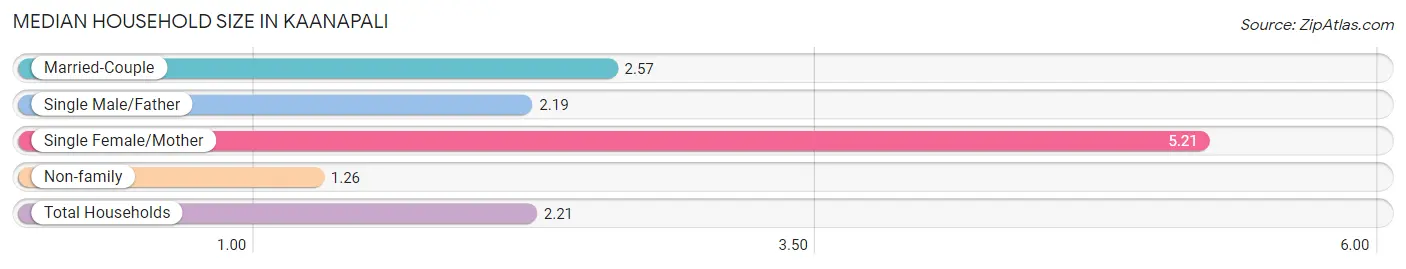
The median household size in Kaanapali is 2.21 persons per household, with single female/mother households (19 | 3.5%) accounting for the largest median household size of 5.21 persons per household. non-family households (183 | 33.3%) represent the smallest median household size with 1.26 persons per household.
| Household Type | # Households | Household Size |
| Married-Couple | 331 (60.3%) | 2.57 |
| Single Male/Father | 16 (2.9%) | 2.19 |
| Single Female/Mother | 19 (3.5%) | 5.21 |
| Non-family | 183 (33.3%) | 1.26 |
| Total Households | 549 (100.0%) | 2.21 |
Household Size by Marriage Status in Kaanapali
Out of a total of 549 households in Kaanapali, 366 (66.7%) are family households, while 183 (33.3%) are nonfamily households. The most numerous type of family households are 2-person households, comprising 276, and the most common type of nonfamily households are 1-person households, comprising 145.
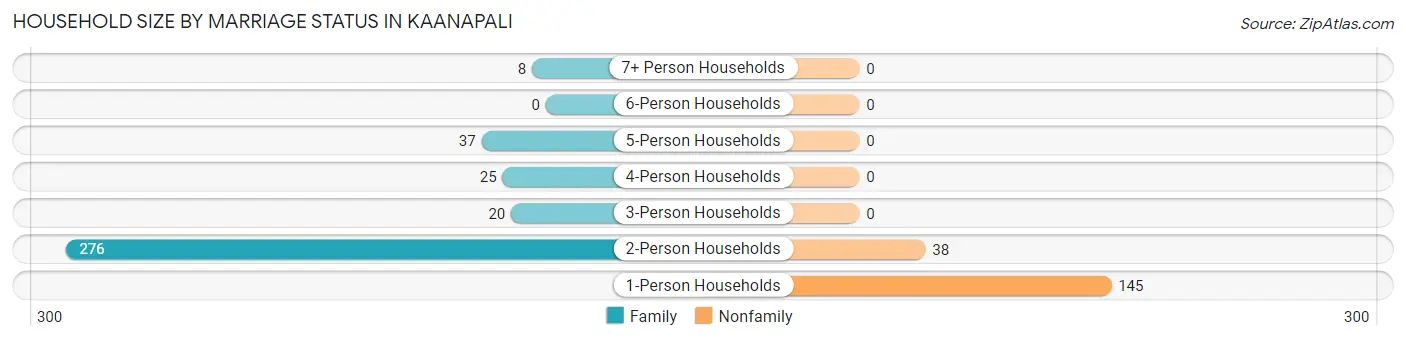
| Household Size | Family Households | Nonfamily Households |
| 1-Person Households | - | 145 (26.4%) |
| 2-Person Households | 276 (50.3%) | 38 (6.9%) |
| 3-Person Households | 20 (3.6%) | 0 (0.0%) |
| 4-Person Households | 25 (4.5%) | 0 (0.0%) |
| 5-Person Households | 37 (6.7%) | 0 (0.0%) |
| 6-Person Households | 0 (0.0%) | 0 (0.0%) |
| 7+ Person Households | 8 (1.5%) | 0 (0.0%) |
| Total | 366 (66.7%) | 183 (33.3%) |
Female Fertility in Kaanapali
Fertility by Age in Kaanapali
| Age Bracket | Women with Births | Births / 1,000 Women |
| 15 to 19 years | 0 (0.0%) | 0.0 |
| 20 to 34 years | 0 (0.0%) | 0.0 |
| 35 to 50 years | 0 (0.0%) | 0.0 |
| Total | 0 (0.0%) | 0.0 |
Fertility by Age by Marriage Status in Kaanapali
| Age Bracket | Married | Unmarried |
| 15 to 19 years | 0 (0.0%) | 0 (0.0%) |
| 20 to 34 years | 0 (0.0%) | 0 (0.0%) |
| 35 to 50 years | 0 (0.0%) | 0 (0.0%) |
| Total | 0 (0.0%) | 0 (0.0%) |
Fertility by Education in Kaanapali
| Educational Attainment | Women with Births | Births / 1,000 Women |
| Less than High School | 0 (0.0%) | 0.0 |
| High School Diploma | 0 (0.0%) | 0.0 |
| College or Associate's Degree | 0 (0.0%) | 0.0 |
| Bachelor's Degree | 0 (0.0%) | 0.0 |
| Graduate Degree | 0 (0.0%) | 0.0 |
| Total | 0 (0.0%) | 0.0 |
Fertility by Education by Marriage Status in Kaanapali
| Educational Attainment | Married | Unmarried |
| Less than High School | 0 (0.0%) | 0 (0.0%) |
| High School Diploma | 0 (0.0%) | 0 (0.0%) |
| College or Associate's Degree | 0 (0.0%) | 0 (0.0%) |
| Bachelor's Degree | 0 (0.0%) | 0 (0.0%) |
| Graduate Degree | 0 (0.0%) | 0 (0.0%) |
| Total | 0 (0.0%) | 0 (0.0%) |
Employment Characteristics in Kaanapali
Employment by Class of Employer in Kaanapali
Among the 359 employed individuals in Kaanapali, private company employees (191 | 53.2%), self-employed (incorporated) (58 | 16.2%), and self-employed (not incorporated) (46 | 12.8%) make up the most common classes of employment.
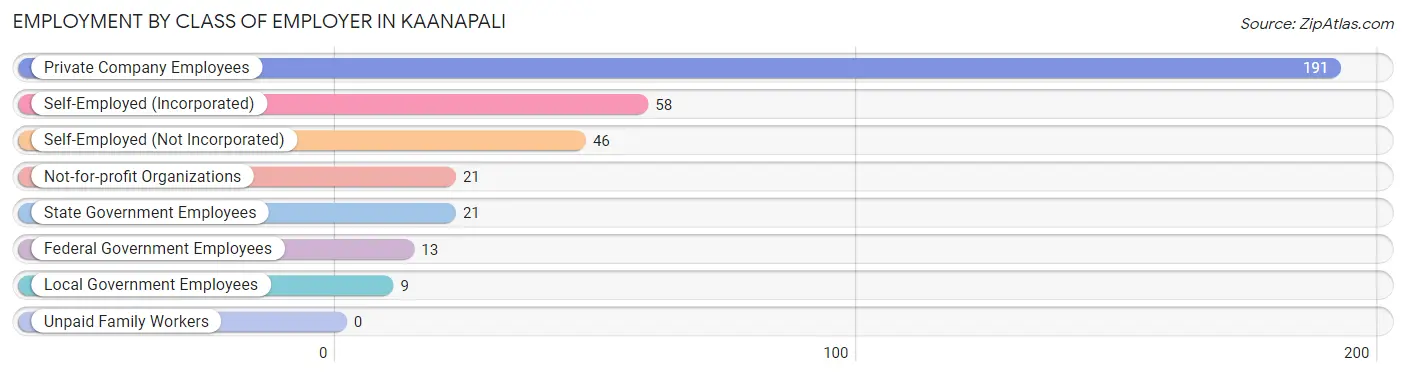
| Employer Class | # Employees | % Employees |
| Private Company Employees | 191 | 53.2% |
| Self-Employed (Incorporated) | 58 | 16.2% |
| Self-Employed (Not Incorporated) | 46 | 12.8% |
| Not-for-profit Organizations | 21 | 5.9% |
| Local Government Employees | 9 | 2.5% |
| State Government Employees | 21 | 5.9% |
| Federal Government Employees | 13 | 3.6% |
| Unpaid Family Workers | 0 | 0.0% |
| Total | 359 | 100.0% |
Employment Status by Age in Kaanapali
According to the labor force statistics for Kaanapali, out of the total population over 16 years of age (1,075), 42.5% or 457 individuals are in the labor force, with 21.4% or 98 of them unemployed. The age group with the highest labor force participation rate is 20 to 24 years, with 100.0% or 6 individuals in the labor force. Within the labor force, the 25 to 29 years age range has the highest percentage of unemployed individuals, with 56.3% or 49 of them being unemployed.
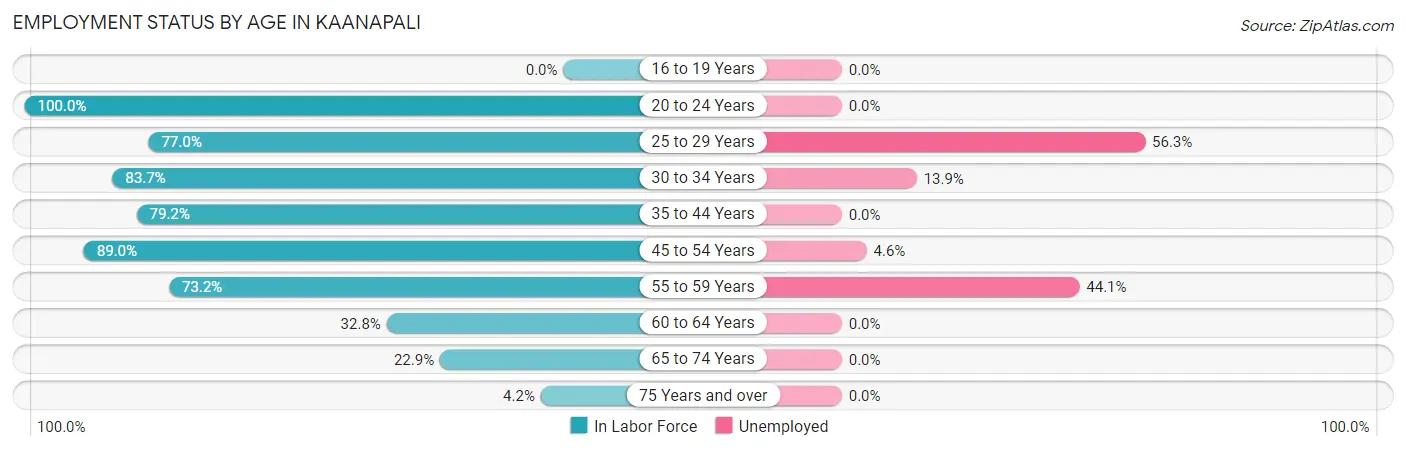
| Age Bracket | In Labor Force | Unemployed |
| 16 to 19 Years | 0 (0.0%) | 0 (0.0%) |
| 20 to 24 Years | 6 (100.0%) | 0 (0.0%) |
| 25 to 29 Years | 87 (77.0%) | 49 (56.3%) |
| 30 to 34 Years | 36 (83.7%) | 5 (13.9%) |
| 35 to 44 Years | 42 (79.2%) | 0 (0.0%) |
| 45 to 54 Years | 65 (89.0%) | 3 (4.6%) |
| 55 to 59 Years | 93 (73.2%) | 41 (44.1%) |
| 60 to 64 Years | 43 (32.8%) | 0 (0.0%) |
| 65 to 74 Years | 78 (22.9%) | 0 (0.0%) |
| 75 Years and over | 7 (4.2%) | 0 (0.0%) |
| Total | 457 (42.5%) | 98 (21.4%) |
Employment Status by Educational Attainment in Kaanapali
According to labor force statistics for Kaanapali, 67.8% of individuals (366) out of the total population between 25 and 64 years of age (540) are in the labor force, with 26.8% or 98 of them being unemployed. The group with the highest labor force participation rate are those with the educational attainment of college / associate degree, with 82.3% or 121 individuals in the labor force. Within the labor force, individuals with less than high school education have the highest percentage of unemployment, with 78.9% or 15 of them being unemployed.
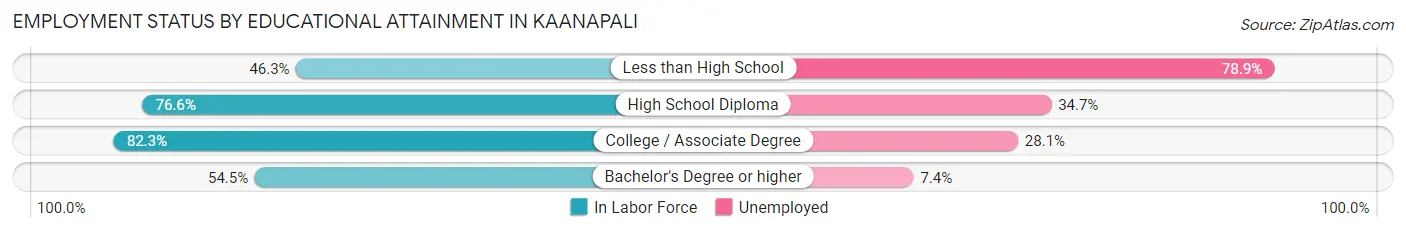
| Educational Attainment | In Labor Force | Unemployed |
| Less than High School | 19 (46.3%) | 32 (78.9%) |
| High School Diploma | 118 (76.6%) | 53 (34.7%) |
| College / Associate Degree | 121 (82.3%) | 41 (28.1%) |
| Bachelor's Degree or higher | 108 (54.5%) | 15 (7.4%) |
| Total | 366 (67.8%) | 145 (26.8%) |
Employment Occupations by Sex in Kaanapali
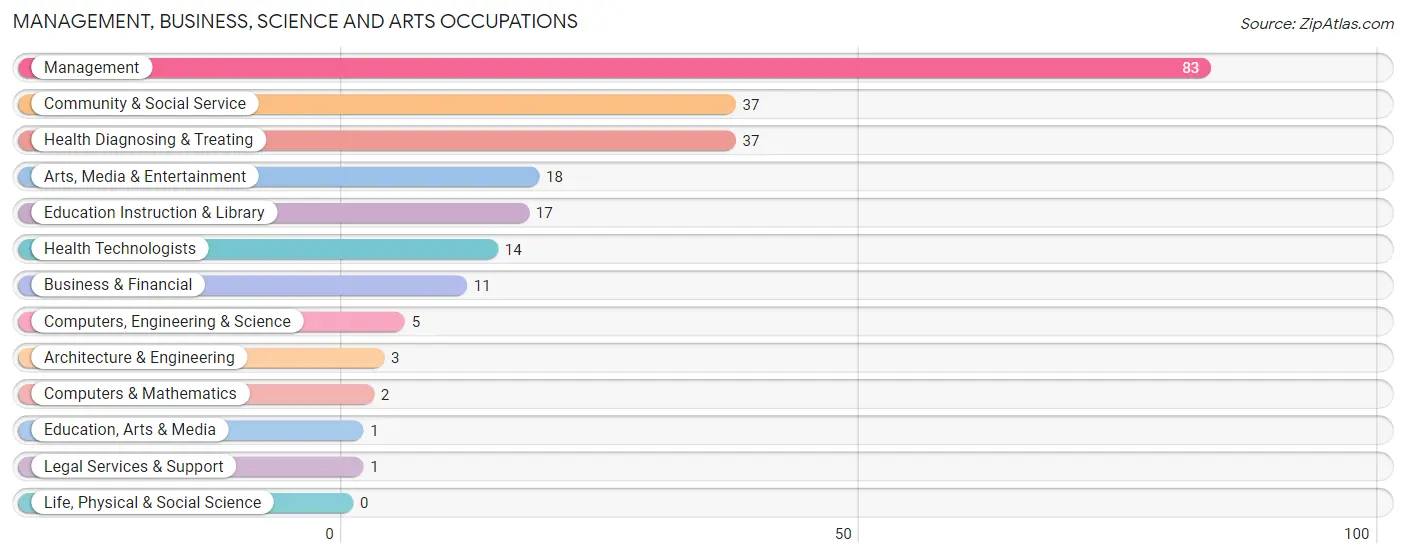
Management, Business, Science and Arts Occupations
The most common Management, Business, Science and Arts occupations in Kaanapali are Management (83 | 23.1%), Community & Social Service (37 | 10.3%), Health Diagnosing & Treating (37 | 10.3%), Arts, Media & Entertainment (18 | 5.0%), and Education Instruction & Library (17 | 4.7%).
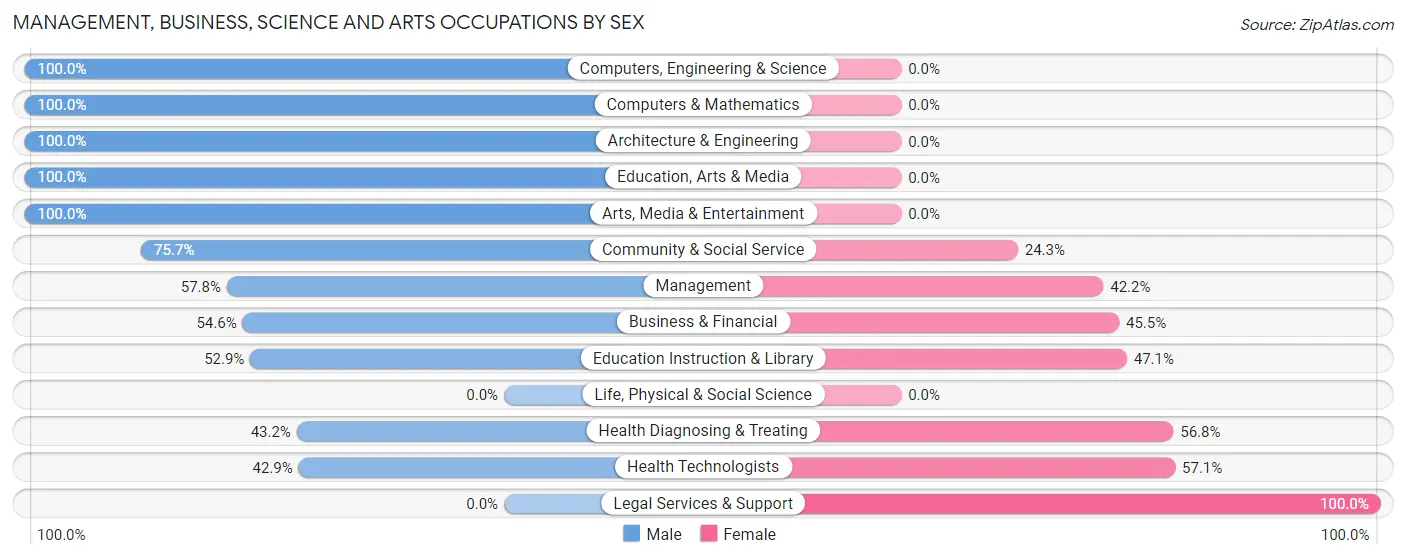
Management, Business, Science and Arts Occupations by Sex
Within the Management, Business, Science and Arts occupations in Kaanapali, the most male-oriented occupations are Computers, Engineering & Science (100.0%), Computers & Mathematics (100.0%), and Architecture & Engineering (100.0%), while the most female-oriented occupations are Legal Services & Support (100.0%), Health Technologists (57.1%), and Health Diagnosing & Treating (56.8%).
| Occupation | Male | Female |
| Management | 48 (57.8%) | 35 (42.2%) |
| Business & Financial | 6 (54.5%) | 5 (45.5%) |
| Computers, Engineering & Science | 5 (100.0%) | 0 (0.0%) |
| Computers & Mathematics | 2 (100.0%) | 0 (0.0%) |
| Architecture & Engineering | 3 (100.0%) | 0 (0.0%) |
| Life, Physical & Social Science | 0 (0.0%) | 0 (0.0%) |
| Community & Social Service | 28 (75.7%) | 9 (24.3%) |
| Education, Arts & Media | 1 (100.0%) | 0 (0.0%) |
| Legal Services & Support | 0 (0.0%) | 1 (100.0%) |
| Education Instruction & Library | 9 (52.9%) | 8 (47.1%) |
| Arts, Media & Entertainment | 18 (100.0%) | 0 (0.0%) |
| Health Diagnosing & Treating | 16 (43.2%) | 21 (56.8%) |
| Health Technologists | 6 (42.9%) | 8 (57.1%) |
| Total (Category) | 103 (59.5%) | 70 (40.5%) |
| Total (Overall) | 217 (60.5%) | 142 (39.6%) |
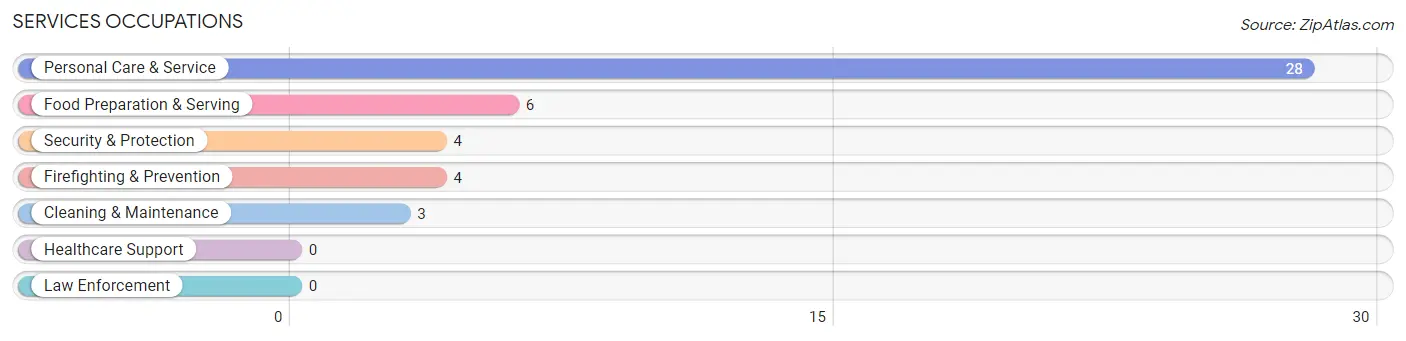
Services Occupations
The most common Services occupations in Kaanapali are Personal Care & Service (28 | 7.8%), Food Preparation & Serving (6 | 1.7%), Security & Protection (4 | 1.1%), Firefighting & Prevention (4 | 1.1%), and Cleaning & Maintenance (3 | 0.8%).
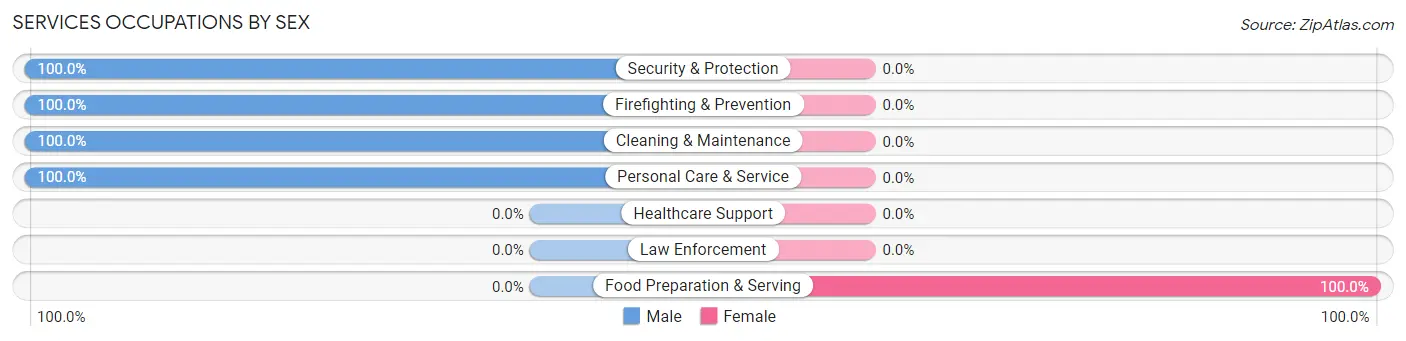
Services Occupations by Sex
| Occupation | Male | Female |
| Healthcare Support | 0 (0.0%) | 0 (0.0%) |
| Security & Protection | 4 (100.0%) | 0 (0.0%) |
| Firefighting & Prevention | 4 (100.0%) | 0 (0.0%) |
| Law Enforcement | 0 (0.0%) | 0 (0.0%) |
| Food Preparation & Serving | 0 (0.0%) | 6 (100.0%) |
| Cleaning & Maintenance | 3 (100.0%) | 0 (0.0%) |
| Personal Care & Service | 28 (100.0%) | 0 (0.0%) |
| Total (Category) | 35 (85.4%) | 6 (14.6%) |
| Total (Overall) | 217 (60.5%) | 142 (39.6%) |
Sales and Office Occupations
The most common Sales and Office occupations in Kaanapali are Sales & Related (63 | 17.5%), and Office & Administration (29 | 8.1%).
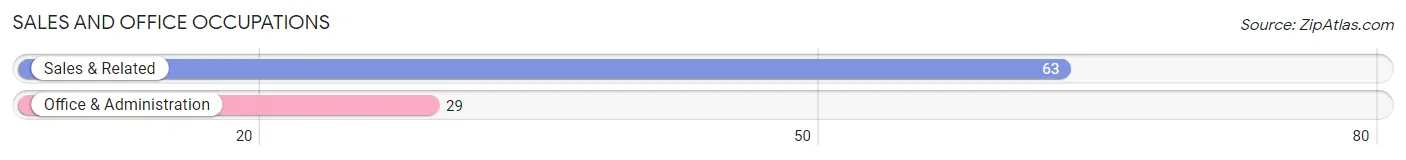
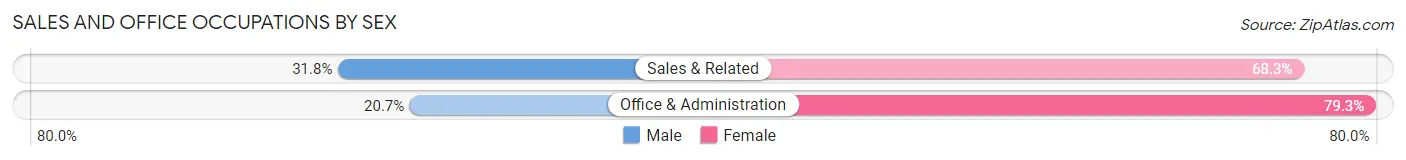
Sales and Office Occupations by Sex
| Occupation | Male | Female |
| Sales & Related | 20 (31.8%) | 43 (68.2%) |
| Office & Administration | 6 (20.7%) | 23 (79.3%) |
| Total (Category) | 26 (28.3%) | 66 (71.7%) |
| Total (Overall) | 217 (60.5%) | 142 (39.6%) |
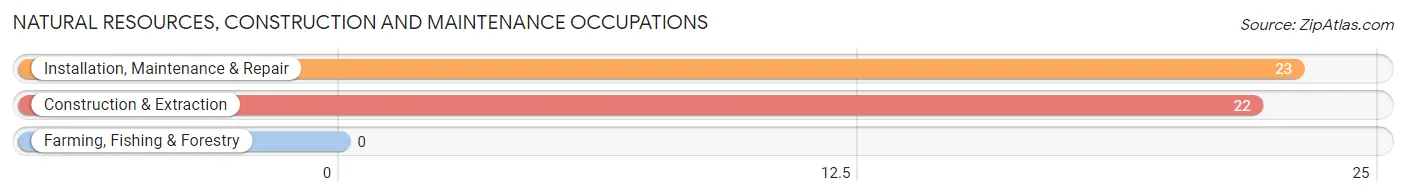
Natural Resources, Construction and Maintenance Occupations
The most common Natural Resources, Construction and Maintenance occupations in Kaanapali are Installation, Maintenance & Repair (23 | 6.4%), and Construction & Extraction (22 | 6.1%).
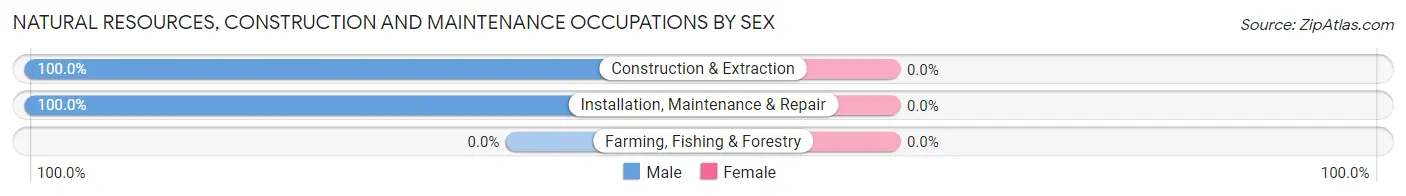
Natural Resources, Construction and Maintenance Occupations by Sex
| Occupation | Male | Female |
| Farming, Fishing & Forestry | 0 (0.0%) | 0 (0.0%) |
| Construction & Extraction | 22 (100.0%) | 0 (0.0%) |
| Installation, Maintenance & Repair | 23 (100.0%) | 0 (0.0%) |
| Total (Category) | 45 (100.0%) | 0 (0.0%) |
| Total (Overall) | 217 (60.5%) | 142 (39.6%) |
Production, Transportation and Moving Occupations
The most common Production, Transportation and Moving occupations in Kaanapali are , and Transportation (8 | 2.2%).
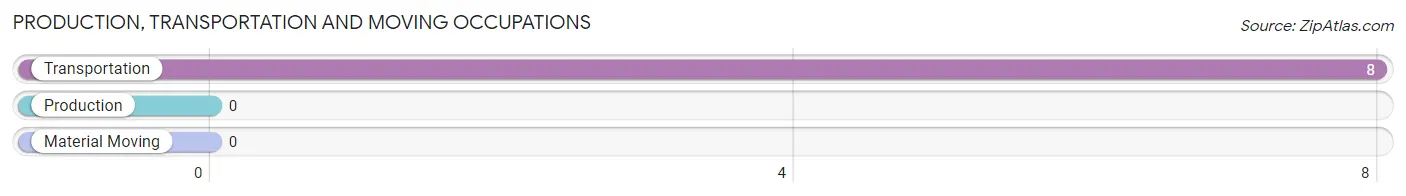
Production, Transportation and Moving Occupations by Sex
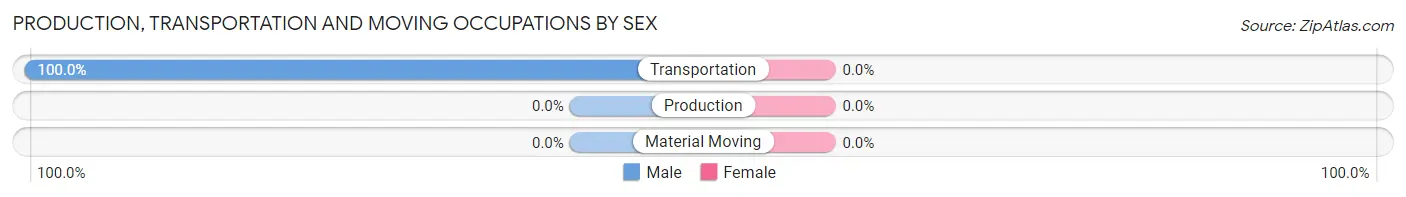
| Occupation | Male | Female |
| Production | 0 (0.0%) | 0 (0.0%) |
| Transportation | 8 (100.0%) | 0 (0.0%) |
| Material Moving | 0 (0.0%) | 0 (0.0%) |
| Total (Category) | 8 (100.0%) | 0 (0.0%) |
| Total (Overall) | 217 (60.5%) | 142 (39.6%) |
Employment Industries by Sex in Kaanapali
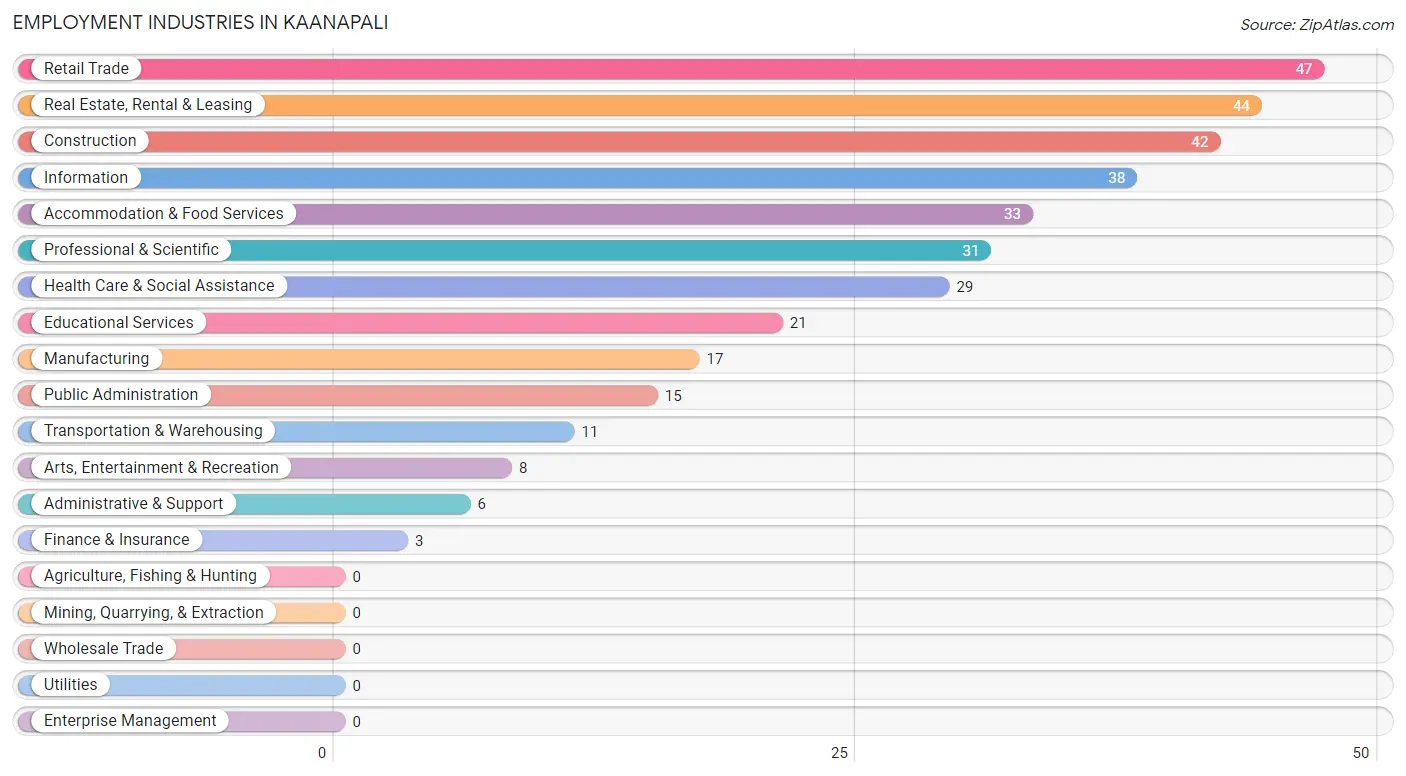
Employment Industries in Kaanapali
The major employment industries in Kaanapali include Retail Trade (47 | 13.1%), Real Estate, Rental & Leasing (44 | 12.3%), Construction (42 | 11.7%), Information (38 | 10.6%), and Accommodation & Food Services (33 | 9.2%).
Employment Industries by Sex in Kaanapali
The Kaanapali industries that see more men than women are Construction (100.0%), Transportation & Warehousing (100.0%), and Finance & Insurance (100.0%), whereas the industries that tend to have a higher number of women are Retail Trade (70.2%), Accommodation & Food Services (60.6%), and Educational Services (57.1%).
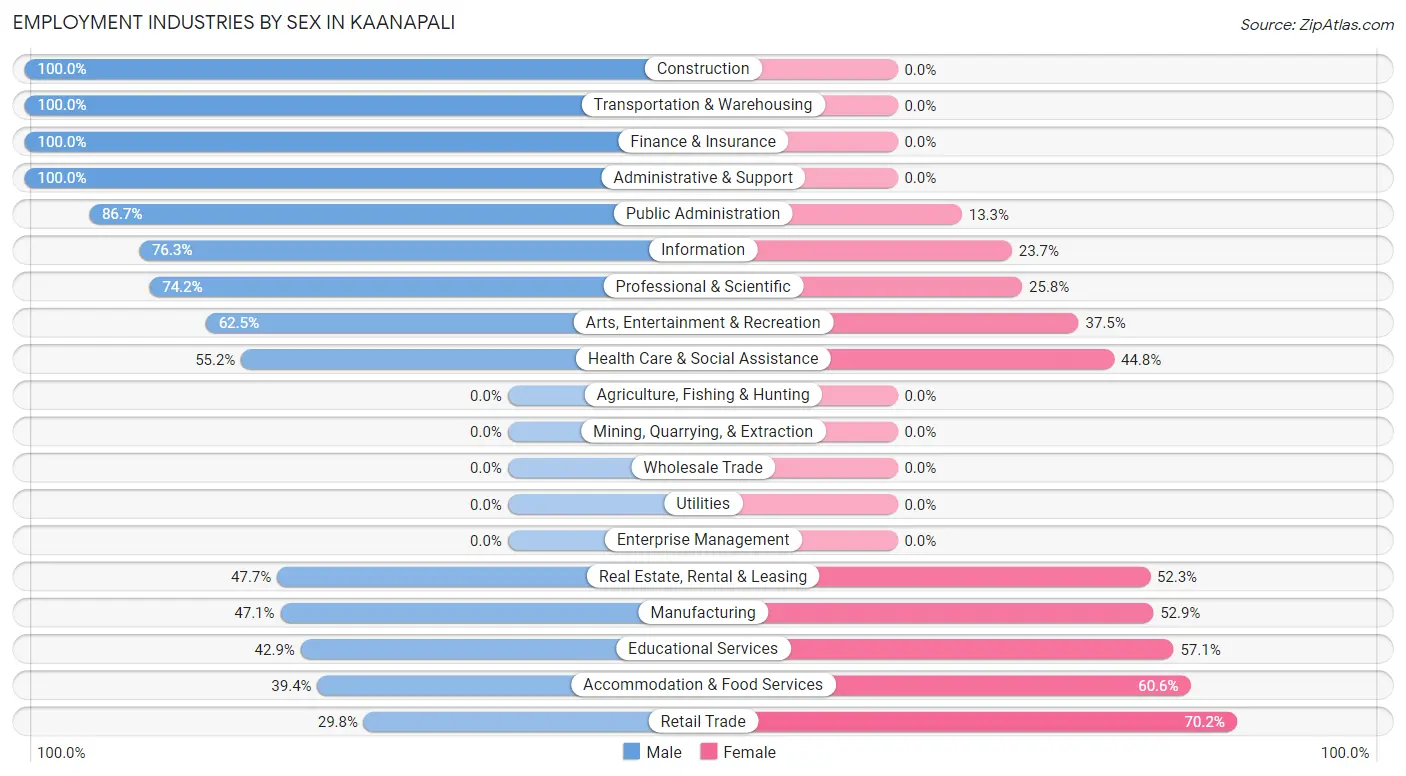
| Industry | Male | Female |
| Agriculture, Fishing & Hunting | 0 (0.0%) | 0 (0.0%) |
| Mining, Quarrying, & Extraction | 0 (0.0%) | 0 (0.0%) |
| Construction | 42 (100.0%) | 0 (0.0%) |
| Manufacturing | 8 (47.1%) | 9 (52.9%) |
| Wholesale Trade | 0 (0.0%) | 0 (0.0%) |
| Retail Trade | 14 (29.8%) | 33 (70.2%) |
| Transportation & Warehousing | 11 (100.0%) | 0 (0.0%) |
| Utilities | 0 (0.0%) | 0 (0.0%) |
| Information | 29 (76.3%) | 9 (23.7%) |
| Finance & Insurance | 3 (100.0%) | 0 (0.0%) |
| Real Estate, Rental & Leasing | 21 (47.7%) | 23 (52.3%) |
| Professional & Scientific | 23 (74.2%) | 8 (25.8%) |
| Enterprise Management | 0 (0.0%) | 0 (0.0%) |
| Administrative & Support | 6 (100.0%) | 0 (0.0%) |
| Educational Services | 9 (42.9%) | 12 (57.1%) |
| Health Care & Social Assistance | 16 (55.2%) | 13 (44.8%) |
| Arts, Entertainment & Recreation | 5 (62.5%) | 3 (37.5%) |
| Accommodation & Food Services | 13 (39.4%) | 20 (60.6%) |
| Public Administration | 13 (86.7%) | 2 (13.3%) |
| Total | 217 (60.5%) | 142 (39.6%) |
Education in Kaanapali
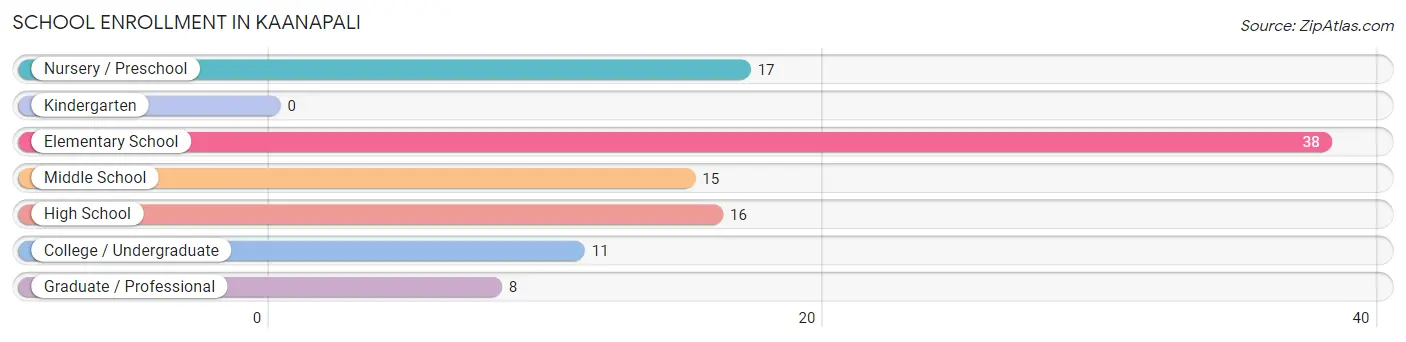
School Enrollment in Kaanapali
The most common levels of schooling among the 105 students in Kaanapali are elementary school (38 | 36.2%), nursery / preschool (17 | 16.2%), and high school (16 | 15.2%).
| School Level | # Students | % Students |
| Nursery / Preschool | 17 | 16.2% |
| Kindergarten | 0 | 0.0% |
| Elementary School | 38 | 36.2% |
| Middle School | 15 | 14.3% |
| High School | 16 | 15.2% |
| College / Undergraduate | 11 | 10.5% |
| Graduate / Professional | 8 | 7.6% |
| Total | 105 | 100.0% |
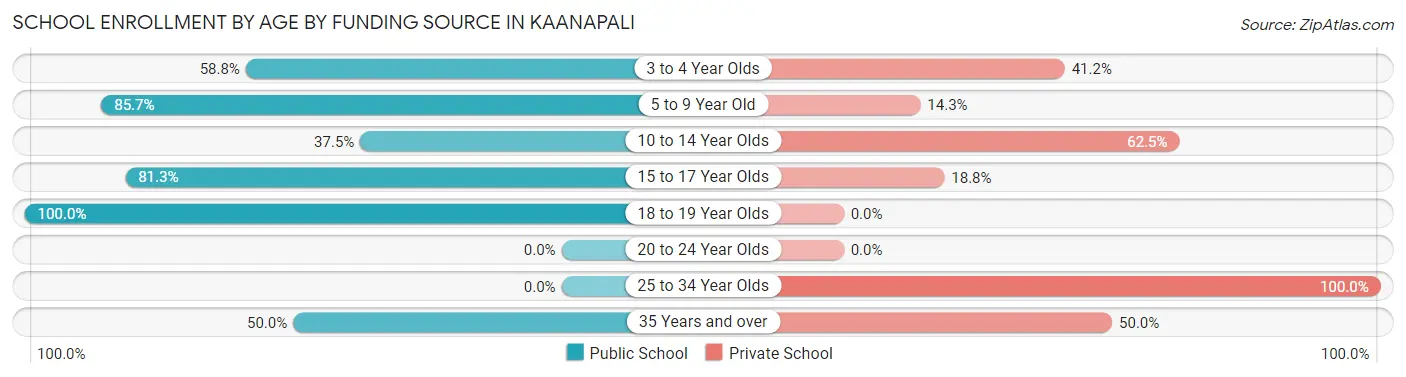
School Enrollment by Age by Funding Source in Kaanapali
Out of a total of 105 students who are enrolled in schools in Kaanapali, 40 (38.1%) attend a private institution, while the remaining 65 (61.9%) are enrolled in public schools. The age group of 25 to 34 year olds has the highest likelihood of being enrolled in private schools, with 6 (100.0% in the age bracket) enrolled. Conversely, the age group of 18 to 19 year olds has the lowest likelihood of being enrolled in a private school, with 11 (100.0% in the age bracket) attending a public institution.
| Age Bracket | Public School | Private School |
| 3 to 4 Year Olds | 10 (58.8%) | 7 (41.2%) |
| 5 to 9 Year Old | 18 (85.7%) | 3 (14.3%) |
| 10 to 14 Year Olds | 12 (37.5%) | 20 (62.5%) |
| 15 to 17 Year Olds | 13 (81.2%) | 3 (18.8%) |
| 18 to 19 Year Olds | 11 (100.0%) | 0 (0.0%) |
| 20 to 24 Year Olds | 0 (0.0%) | 0 (0.0%) |
| 25 to 34 Year Olds | 0 (0.0%) | 6 (100.0%) |
| 35 Years and over | 1 (50.0%) | 1 (50.0%) |
| Total | 65 (61.9%) | 40 (38.1%) |
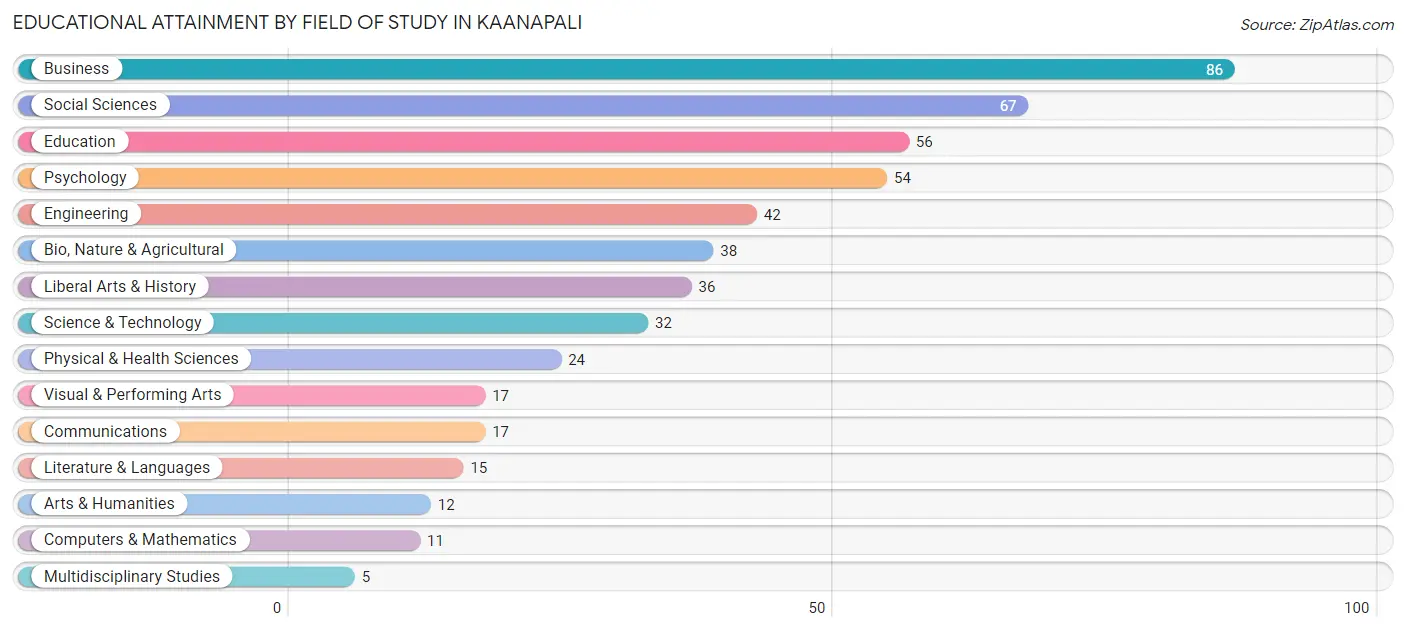
Educational Attainment by Field of Study in Kaanapali
Business (86 | 16.8%), social sciences (67 | 13.1%), education (56 | 10.9%), psychology (54 | 10.5%), and engineering (42 | 8.2%) are the most common fields of study among 512 individuals in Kaanapali who have obtained a bachelor's degree or higher.
| Field of Study | # Graduates | % Graduates |
| Computers & Mathematics | 11 | 2.1% |
| Bio, Nature & Agricultural | 38 | 7.4% |
| Physical & Health Sciences | 24 | 4.7% |
| Psychology | 54 | 10.5% |
| Social Sciences | 67 | 13.1% |
| Engineering | 42 | 8.2% |
| Multidisciplinary Studies | 5 | 1.0% |
| Science & Technology | 32 | 6.2% |
| Business | 86 | 16.8% |
| Education | 56 | 10.9% |
| Literature & Languages | 15 | 2.9% |
| Liberal Arts & History | 36 | 7.0% |
| Visual & Performing Arts | 17 | 3.3% |
| Communications | 17 | 3.3% |
| Arts & Humanities | 12 | 2.3% |
| Total | 512 | 100.0% |
Transportation & Commute in Kaanapali
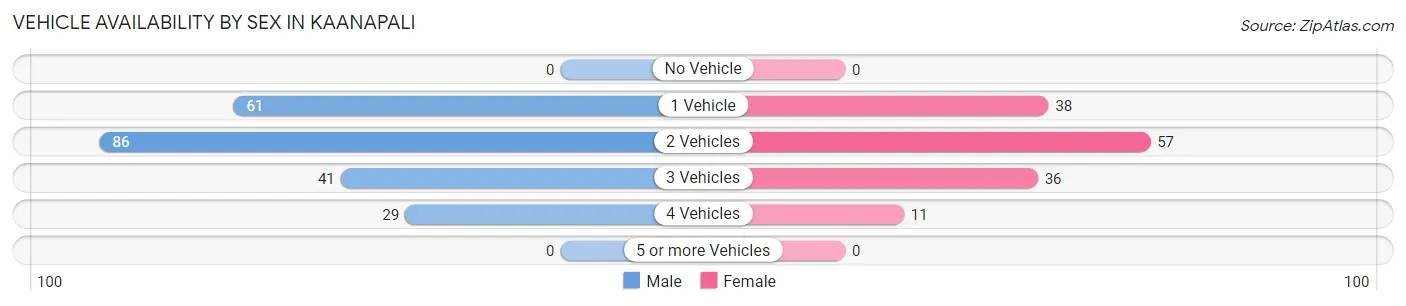
Vehicle Availability by Sex in Kaanapali
The most prevalent vehicle ownership categories in Kaanapali are males with 2 vehicles (86, accounting for 39.6%) and females with 2 vehicles (57, making up 60.6%).
| Vehicles Available | Male | Female |
| No Vehicle | 0 (0.0%) | 0 (0.0%) |
| 1 Vehicle | 61 (28.1%) | 38 (26.8%) |
| 2 Vehicles | 86 (39.6%) | 57 (40.1%) |
| 3 Vehicles | 41 (18.9%) | 36 (25.4%) |
| 4 Vehicles | 29 (13.4%) | 11 (7.7%) |
| 5 or more Vehicles | 0 (0.0%) | 0 (0.0%) |
| Total | 217 (100.0%) | 142 (100.0%) |
Commute Time in Kaanapali
The most frequently occuring commute durations in Kaanapali are 10 to 14 minutes (59 commuters, 25.9%), 15 to 19 minutes (56 commuters, 24.6%), and 45 to 59 minutes (44 commuters, 19.3%).
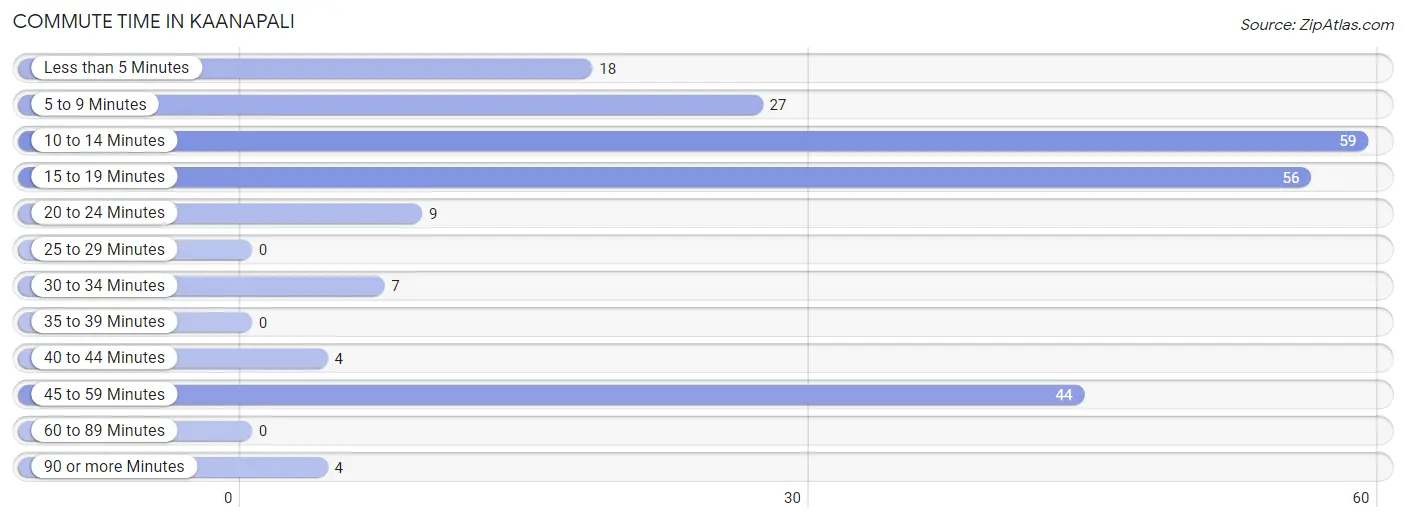
| Commute Time | # Commuters | % Commuters |
| Less than 5 Minutes | 18 | 7.9% |
| 5 to 9 Minutes | 27 | 11.8% |
| 10 to 14 Minutes | 59 | 25.9% |
| 15 to 19 Minutes | 56 | 24.6% |
| 20 to 24 Minutes | 9 | 4.0% |
| 25 to 29 Minutes | 0 | 0.0% |
| 30 to 34 Minutes | 7 | 3.1% |
| 35 to 39 Minutes | 0 | 0.0% |
| 40 to 44 Minutes | 4 | 1.8% |
| 45 to 59 Minutes | 44 | 19.3% |
| 60 to 89 Minutes | 0 | 0.0% |
| 90 or more Minutes | 4 | 1.8% |
Commute Time by Sex in Kaanapali
The most common commute times in Kaanapali are 15 to 19 minutes (30 commuters, 25.9%) for males and 10 to 14 minutes (33 commuters, 29.5%) for females.
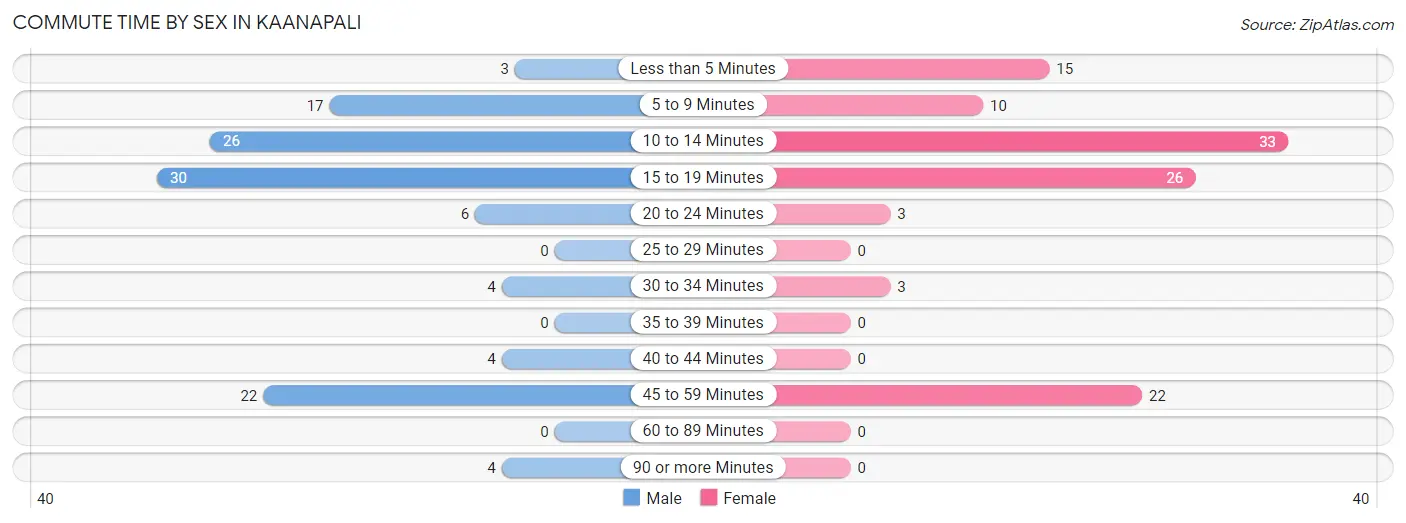
| Commute Time | Male | Female |
| Less than 5 Minutes | 3 (2.6%) | 15 (13.4%) |
| 5 to 9 Minutes | 17 (14.7%) | 10 (8.9%) |
| 10 to 14 Minutes | 26 (22.4%) | 33 (29.5%) |
| 15 to 19 Minutes | 30 (25.9%) | 26 (23.2%) |
| 20 to 24 Minutes | 6 (5.2%) | 3 (2.7%) |
| 25 to 29 Minutes | 0 (0.0%) | 0 (0.0%) |
| 30 to 34 Minutes | 4 (3.5%) | 3 (2.7%) |
| 35 to 39 Minutes | 0 (0.0%) | 0 (0.0%) |
| 40 to 44 Minutes | 4 (3.5%) | 0 (0.0%) |
| 45 to 59 Minutes | 22 (19.0%) | 22 (19.6%) |
| 60 to 89 Minutes | 0 (0.0%) | 0 (0.0%) |
| 90 or more Minutes | 4 (3.5%) | 0 (0.0%) |
Time of Departure to Work by Sex in Kaanapali
The most frequent times of departure to work in Kaanapali are 7:30 AM to 7:59 AM (34, 29.3%) for males and 7:30 AM to 7:59 AM (30, 26.8%) for females.
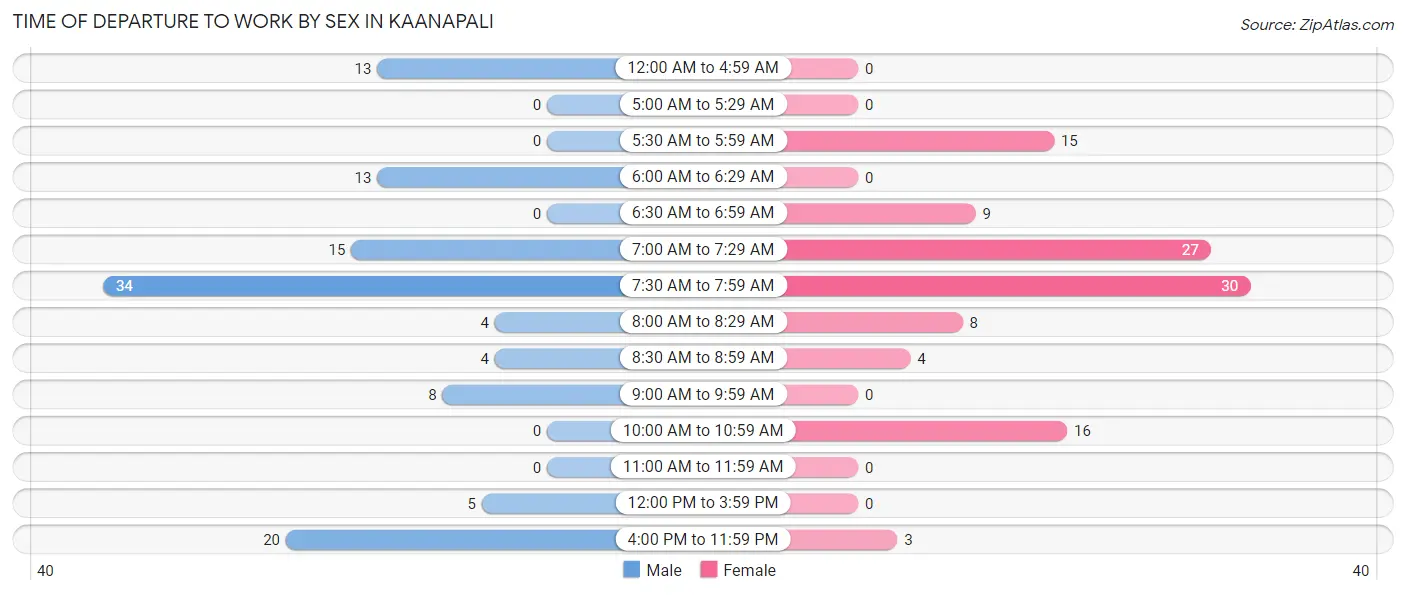
| Time of Departure | Male | Female |
| 12:00 AM to 4:59 AM | 13 (11.2%) | 0 (0.0%) |
| 5:00 AM to 5:29 AM | 0 (0.0%) | 0 (0.0%) |
| 5:30 AM to 5:59 AM | 0 (0.0%) | 15 (13.4%) |
| 6:00 AM to 6:29 AM | 13 (11.2%) | 0 (0.0%) |
| 6:30 AM to 6:59 AM | 0 (0.0%) | 9 (8.0%) |
| 7:00 AM to 7:29 AM | 15 (12.9%) | 27 (24.1%) |
| 7:30 AM to 7:59 AM | 34 (29.3%) | 30 (26.8%) |
| 8:00 AM to 8:29 AM | 4 (3.5%) | 8 (7.1%) |
| 8:30 AM to 8:59 AM | 4 (3.5%) | 4 (3.6%) |
| 9:00 AM to 9:59 AM | 8 (6.9%) | 0 (0.0%) |
| 10:00 AM to 10:59 AM | 0 (0.0%) | 16 (14.3%) |
| 11:00 AM to 11:59 AM | 0 (0.0%) | 0 (0.0%) |
| 12:00 PM to 3:59 PM | 5 (4.3%) | 0 (0.0%) |
| 4:00 PM to 11:59 PM | 20 (17.2%) | 3 (2.7%) |
| Total | 116 (100.0%) | 112 (100.0%) |
Housing Occupancy in Kaanapali
Occupancy by Ownership in Kaanapali
Of the total 549 dwellings in Kaanapali, owner-occupied units account for 479 (87.3%), while renter-occupied units make up 70 (12.8%).
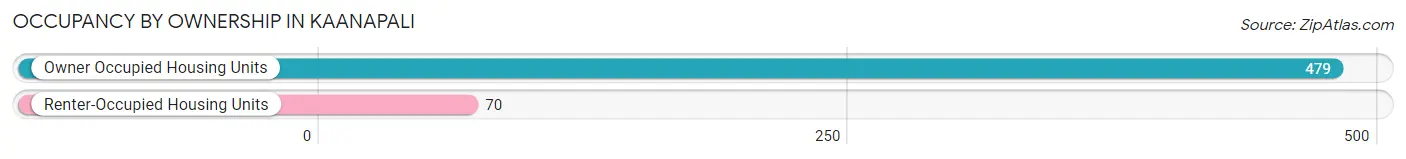
| Occupancy | # Housing Units | % Housing Units |
| Owner Occupied Housing Units | 479 | 87.3% |
| Renter-Occupied Housing Units | 70 | 12.8% |
| Total Occupied Housing Units | 549 | 100.0% |
Occupancy by Household Size in Kaanapali
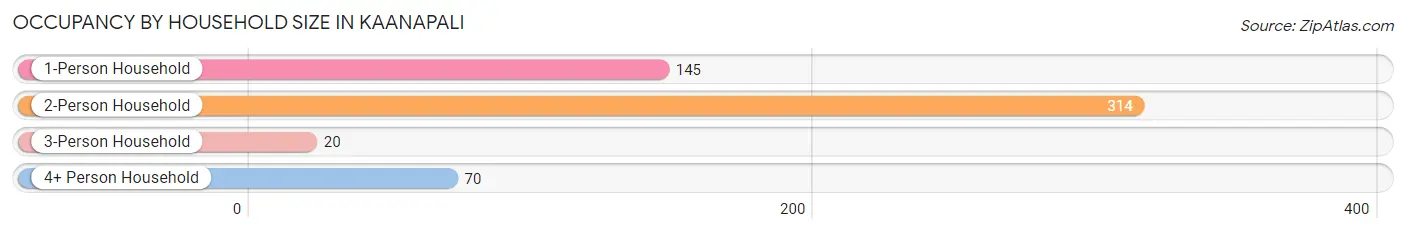
| Household Size | # Housing Units | % Housing Units |
| 1-Person Household | 145 | 26.4% |
| 2-Person Household | 314 | 57.2% |
| 3-Person Household | 20 | 3.6% |
| 4+ Person Household | 70 | 12.8% |
| Total Housing Units | 549 | 100.0% |
Occupancy by Ownership by Household Size in Kaanapali
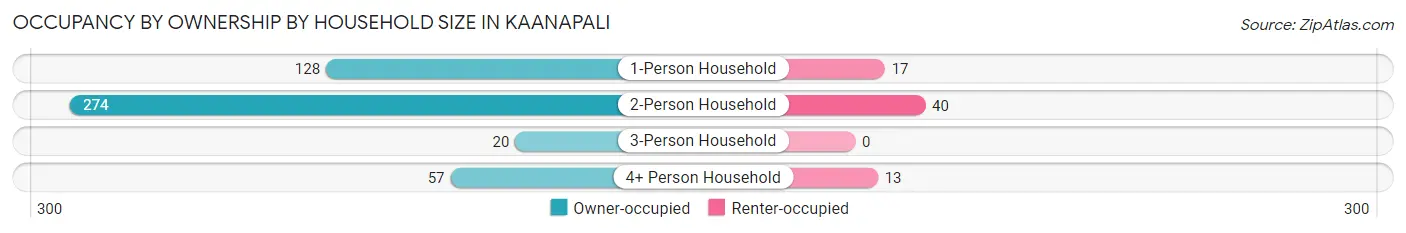
| Household Size | Owner-occupied | Renter-occupied |
| 1-Person Household | 128 (88.3%) | 17 (11.7%) |
| 2-Person Household | 274 (87.3%) | 40 (12.7%) |
| 3-Person Household | 20 (100.0%) | 0 (0.0%) |
| 4+ Person Household | 57 (81.4%) | 13 (18.6%) |
| Total Housing Units | 479 (87.3%) | 70 (12.8%) |
Occupancy by Educational Attainment in Kaanapali
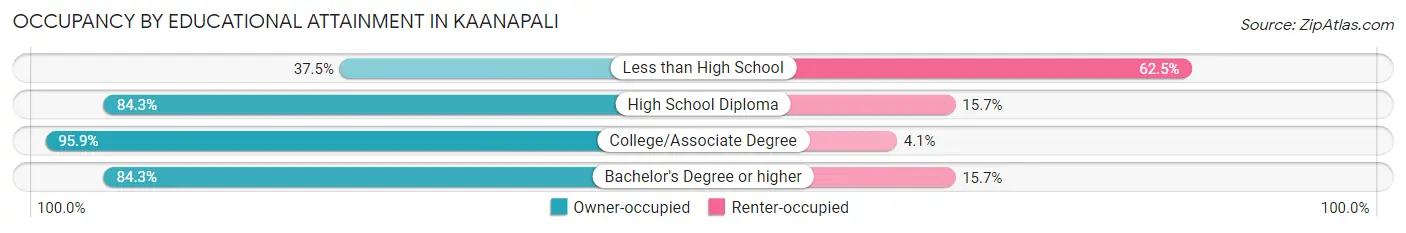
| Household Size | Owner-occupied | Renter-occupied |
| Less than High School | 3 (37.5%) | 5 (62.5%) |
| High School Diploma | 59 (84.3%) | 11 (15.7%) |
| College/Associate Degree | 164 (95.9%) | 7 (4.1%) |
| Bachelor's Degree or higher | 253 (84.3%) | 47 (15.7%) |
Occupancy by Age of Householder in Kaanapali
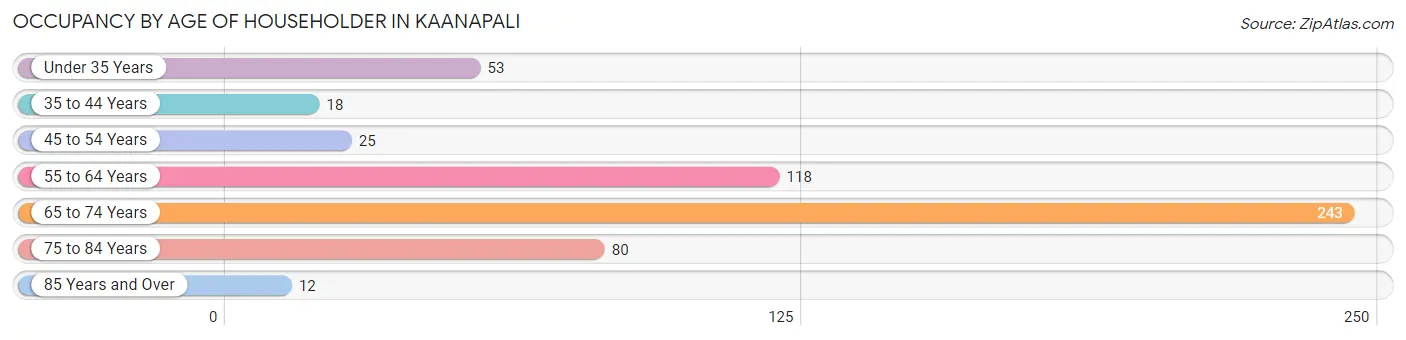
| Age Bracket | # Households | % Households |
| Under 35 Years | 53 | 9.7% |
| 35 to 44 Years | 18 | 3.3% |
| 45 to 54 Years | 25 | 4.5% |
| 55 to 64 Years | 118 | 21.5% |
| 65 to 74 Years | 243 | 44.3% |
| 75 to 84 Years | 80 | 14.6% |
| 85 Years and Over | 12 | 2.2% |
| Total | 549 | 100.0% |
Housing Finances in Kaanapali
Median Income by Occupancy in Kaanapali
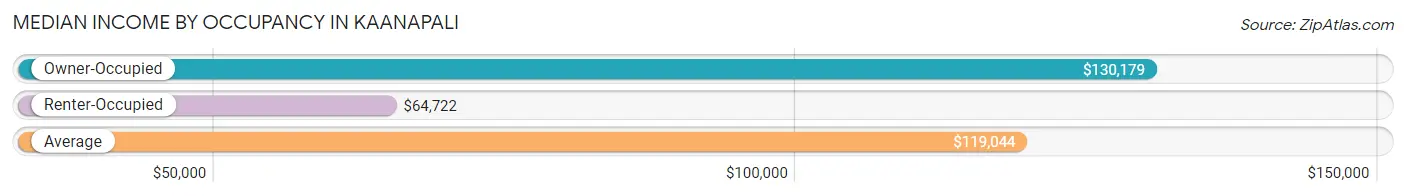
| Occupancy Type | # Households | Median Income |
| Owner-Occupied | 479 (87.3%) | $130,179 |
| Renter-Occupied | 70 (12.8%) | $64,722 |
| Average | 549 (100.0%) | $119,044 |
Occupancy by Householder Income Bracket in Kaanapali
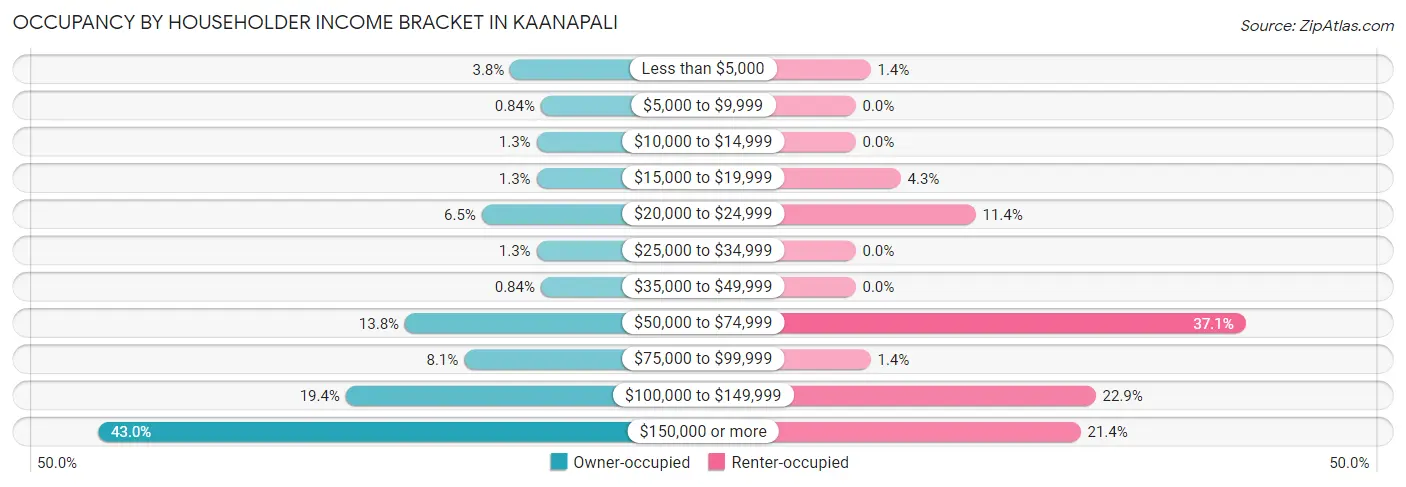
| Income Bracket | Owner-occupied | Renter-occupied |
| Less than $5,000 | 18 (3.8%) | 1 (1.4%) |
| $5,000 to $9,999 | 4 (0.8%) | 0 (0.0%) |
| $10,000 to $14,999 | 6 (1.3%) | 0 (0.0%) |
| $15,000 to $19,999 | 6 (1.3%) | 3 (4.3%) |
| $20,000 to $24,999 | 31 (6.5%) | 8 (11.4%) |
| $25,000 to $34,999 | 6 (1.3%) | 0 (0.0%) |
| $35,000 to $49,999 | 4 (0.8%) | 0 (0.0%) |
| $50,000 to $74,999 | 66 (13.8%) | 26 (37.1%) |
| $75,000 to $99,999 | 39 (8.1%) | 1 (1.4%) |
| $100,000 to $149,999 | 93 (19.4%) | 16 (22.9%) |
| $150,000 or more | 206 (43.0%) | 15 (21.4%) |
| Total | 479 (100.0%) | 70 (100.0%) |
Monthly Housing Cost Tiers in Kaanapali
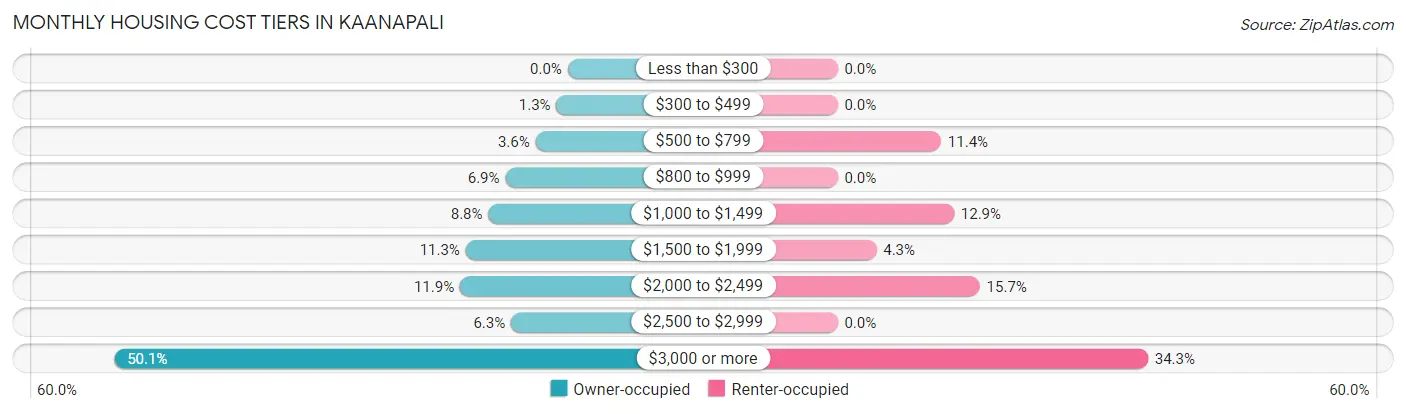
| Monthly Cost | Owner-occupied | Renter-occupied |
| Less than $300 | 0 (0.0%) | 0 (0.0%) |
| $300 to $499 | 6 (1.3%) | 0 (0.0%) |
| $500 to $799 | 17 (3.5%) | 8 (11.4%) |
| $800 to $999 | 33 (6.9%) | 0 (0.0%) |
| $1,000 to $1,499 | 42 (8.8%) | 9 (12.9%) |
| $1,500 to $1,999 | 54 (11.3%) | 3 (4.3%) |
| $2,000 to $2,499 | 57 (11.9%) | 11 (15.7%) |
| $2,500 to $2,999 | 30 (6.3%) | 0 (0.0%) |
| $3,000 or more | 240 (50.1%) | 24 (34.3%) |
| Total | 479 (100.0%) | 70 (100.0%) |
Physical Housing Characteristics in Kaanapali
Housing Structures in Kaanapali
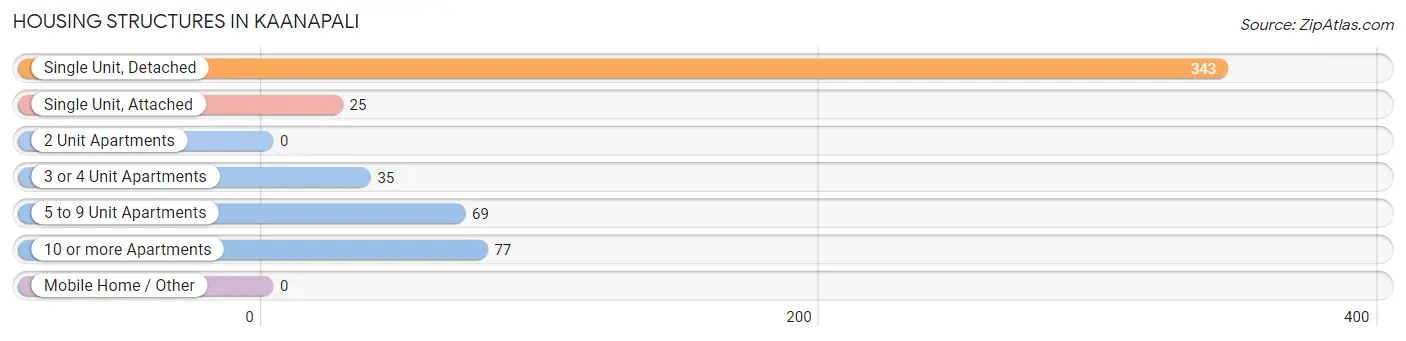
| Structure Type | # Housing Units | % Housing Units |
| Single Unit, Detached | 343 | 62.5% |
| Single Unit, Attached | 25 | 4.5% |
| 2 Unit Apartments | 0 | 0.0% |
| 3 or 4 Unit Apartments | 35 | 6.4% |
| 5 to 9 Unit Apartments | 69 | 12.6% |
| 10 or more Apartments | 77 | 14.0% |
| Mobile Home / Other | 0 | 0.0% |
| Total | 549 | 100.0% |
Housing Structures by Occupancy in Kaanapali
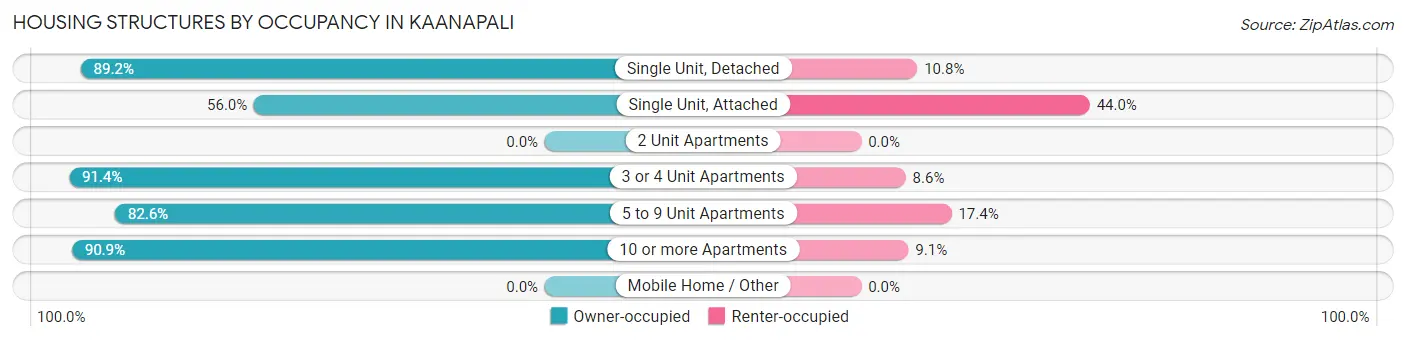
| Structure Type | Owner-occupied | Renter-occupied |
| Single Unit, Detached | 306 (89.2%) | 37 (10.8%) |
| Single Unit, Attached | 14 (56.0%) | 11 (44.0%) |
| 2 Unit Apartments | 0 (0.0%) | 0 (0.0%) |
| 3 or 4 Unit Apartments | 32 (91.4%) | 3 (8.6%) |
| 5 to 9 Unit Apartments | 57 (82.6%) | 12 (17.4%) |
| 10 or more Apartments | 70 (90.9%) | 7 (9.1%) |
| Mobile Home / Other | 0 (0.0%) | 0 (0.0%) |
| Total | 479 (87.3%) | 70 (12.8%) |
Housing Structures by Number of Rooms in Kaanapali
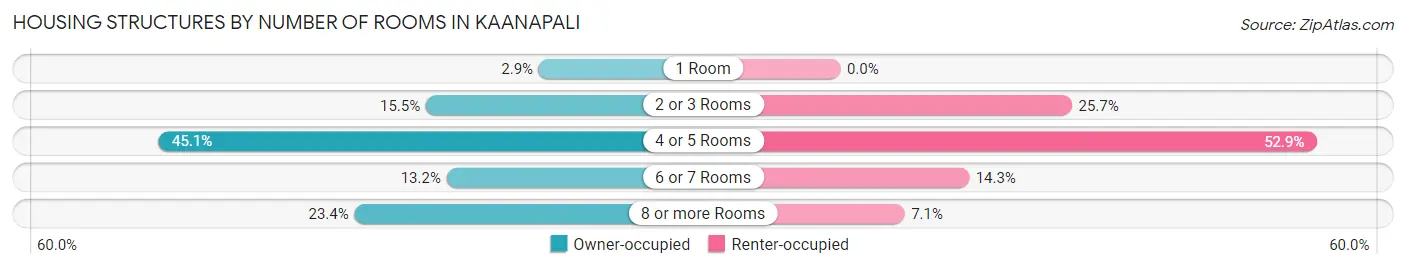
| Number of Rooms | Owner-occupied | Renter-occupied |
| 1 Room | 14 (2.9%) | 0 (0.0%) |
| 2 or 3 Rooms | 74 (15.4%) | 18 (25.7%) |
| 4 or 5 Rooms | 216 (45.1%) | 37 (52.9%) |
| 6 or 7 Rooms | 63 (13.2%) | 10 (14.3%) |
| 8 or more Rooms | 112 (23.4%) | 5 (7.1%) |
| Total | 479 (100.0%) | 70 (100.0%) |
Housing Structure by Heating Type in Kaanapali
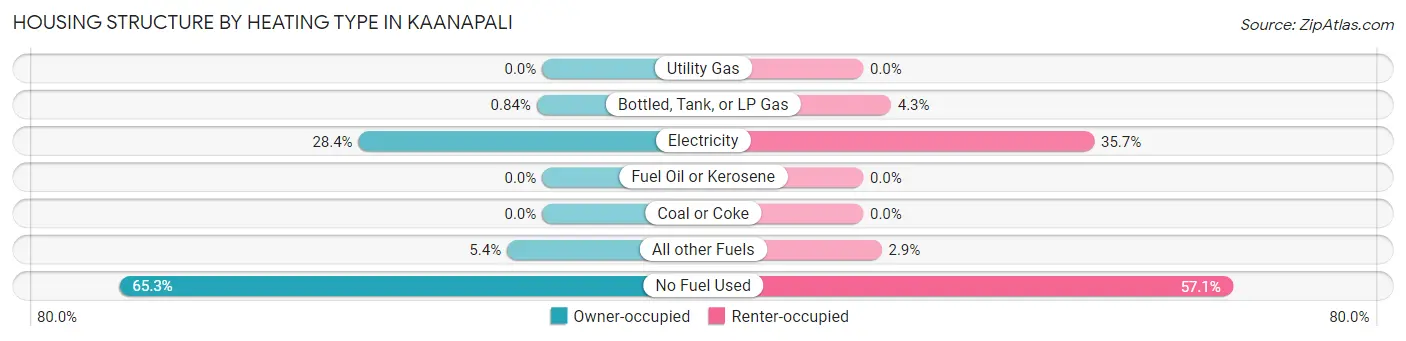
| Heating Type | Owner-occupied | Renter-occupied |
| Utility Gas | 0 (0.0%) | 0 (0.0%) |
| Bottled, Tank, or LP Gas | 4 (0.8%) | 3 (4.3%) |
| Electricity | 136 (28.4%) | 25 (35.7%) |
| Fuel Oil or Kerosene | 0 (0.0%) | 0 (0.0%) |
| Coal or Coke | 0 (0.0%) | 0 (0.0%) |
| All other Fuels | 26 (5.4%) | 2 (2.9%) |
| No Fuel Used | 313 (65.3%) | 40 (57.1%) |
| Total | 479 (100.0%) | 70 (100.0%) |
Household Vehicle Usage in Kaanapali
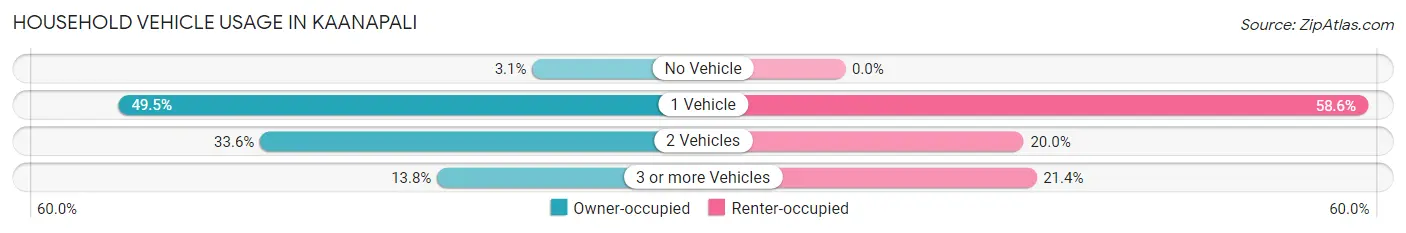
| Vehicles per Household | Owner-occupied | Renter-occupied |
| No Vehicle | 15 (3.1%) | 0 (0.0%) |
| 1 Vehicle | 237 (49.5%) | 41 (58.6%) |
| 2 Vehicles | 161 (33.6%) | 14 (20.0%) |
| 3 or more Vehicles | 66 (13.8%) | 15 (21.4%) |
| Total | 479 (100.0%) | 70 (100.0%) |
Real Estate & Mortgages in Kaanapali
Real Estate and Mortgage Overview in Kaanapali
| Characteristic | Without Mortgage | With Mortgage |
| Housing Units | 202 | 277 |
| Median Property Value | $1,701,900 | $1,442,100 |
| Median Household Income | $112,500 | $138 |
| Monthly Housing Costs | $1,501 | $226 |
| Real Estate Taxes | $5,583 | $17 |
Property Value by Mortgage Status in Kaanapali
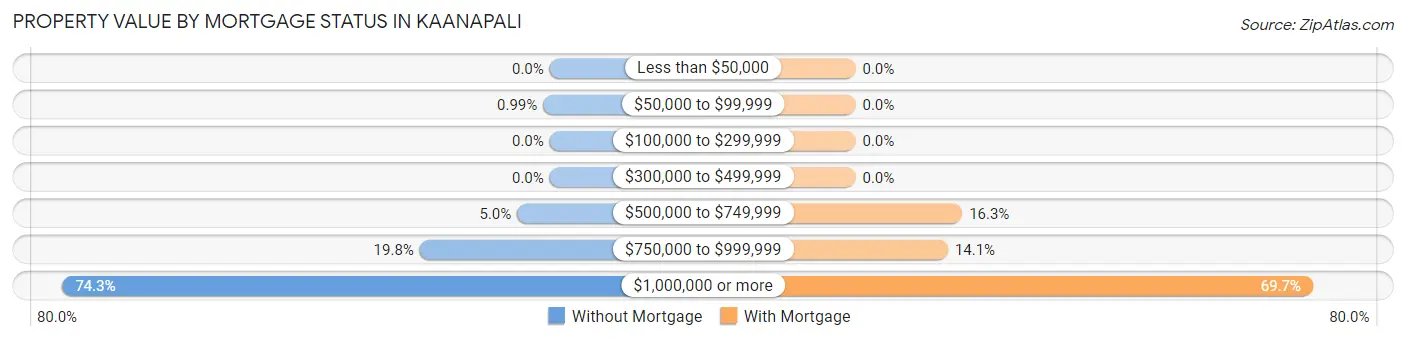
| Property Value | Without Mortgage | With Mortgage |
| Less than $50,000 | 0 (0.0%) | 0 (0.0%) |
| $50,000 to $99,999 | 2 (1.0%) | 0 (0.0%) |
| $100,000 to $299,999 | 0 (0.0%) | 0 (0.0%) |
| $300,000 to $499,999 | 0 (0.0%) | 0 (0.0%) |
| $500,000 to $749,999 | 10 (5.0%) | 45 (16.3%) |
| $750,000 to $999,999 | 40 (19.8%) | 39 (14.1%) |
| $1,000,000 or more | 150 (74.3%) | 193 (69.7%) |
| Total | 202 (100.0%) | 277 (100.0%) |
Household Income by Mortgage Status in Kaanapali
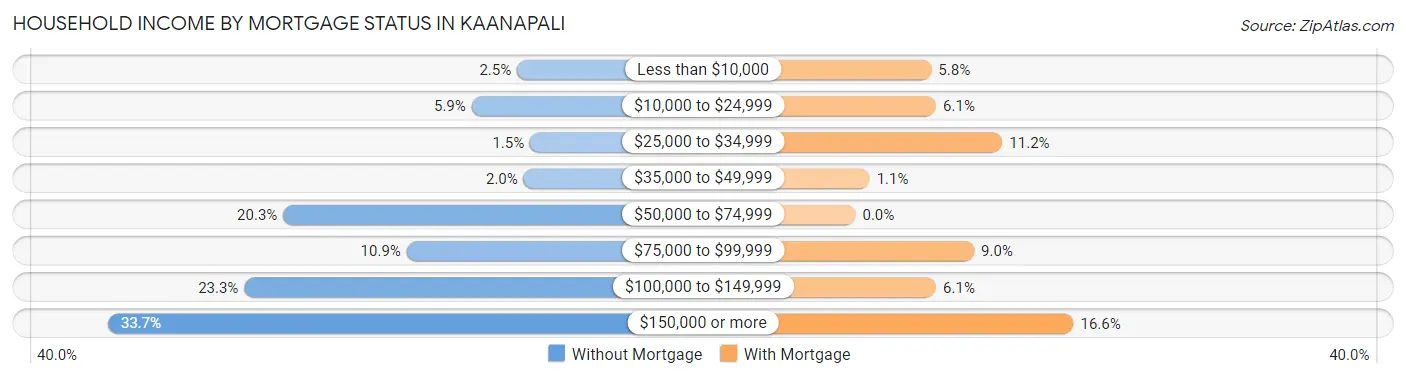
| Household Income | Without Mortgage | With Mortgage |
| Less than $10,000 | 5 (2.5%) | 16 (5.8%) |
| $10,000 to $24,999 | 12 (5.9%) | 17 (6.1%) |
| $25,000 to $34,999 | 3 (1.5%) | 31 (11.2%) |
| $35,000 to $49,999 | 4 (2.0%) | 3 (1.1%) |
| $50,000 to $74,999 | 41 (20.3%) | 0 (0.0%) |
| $75,000 to $99,999 | 22 (10.9%) | 25 (9.0%) |
| $100,000 to $149,999 | 47 (23.3%) | 17 (6.1%) |
| $150,000 or more | 68 (33.7%) | 46 (16.6%) |
| Total | 202 (100.0%) | 277 (100.0%) |
Property Value to Household Income Ratio in Kaanapali
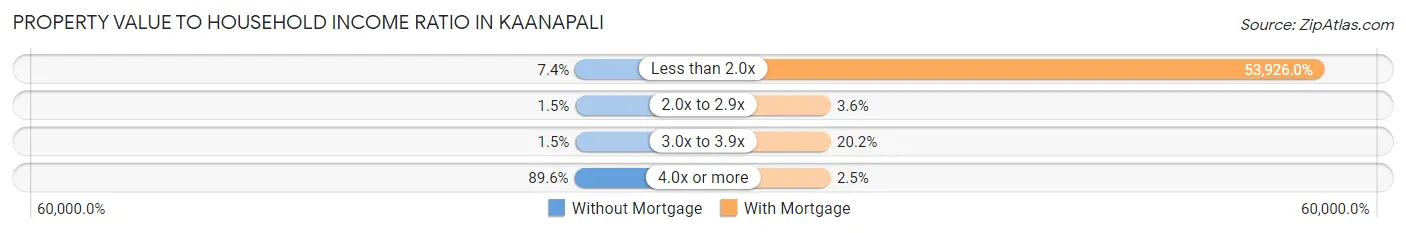
| Value-to-Income Ratio | Without Mortgage | With Mortgage |
| Less than 2.0x | 15 (7.4%) | 149,375 (53,926.0%) |
| 2.0x to 2.9x | 3 (1.5%) | 10 (3.6%) |
| 3.0x to 3.9x | 3 (1.5%) | 56 (20.2%) |
| 4.0x or more | 181 (89.6%) | 7 (2.5%) |
| Total | 202 (100.0%) | 277 (100.0%) |
Real Estate Taxes by Mortgage Status in Kaanapali
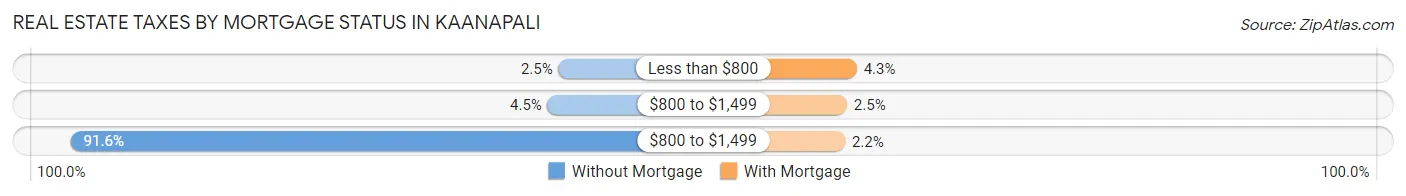
| Property Taxes | Without Mortgage | With Mortgage |
| Less than $800 | 5 (2.5%) | 12 (4.3%) |
| $800 to $1,499 | 9 (4.5%) | 7 (2.5%) |
| $800 to $1,499 | 185 (91.6%) | 6 (2.2%) |
| Total | 202 (100.0%) | 277 (100.0%) |
Health & Disability in Kaanapali
Health Insurance Coverage by Age in Kaanapali
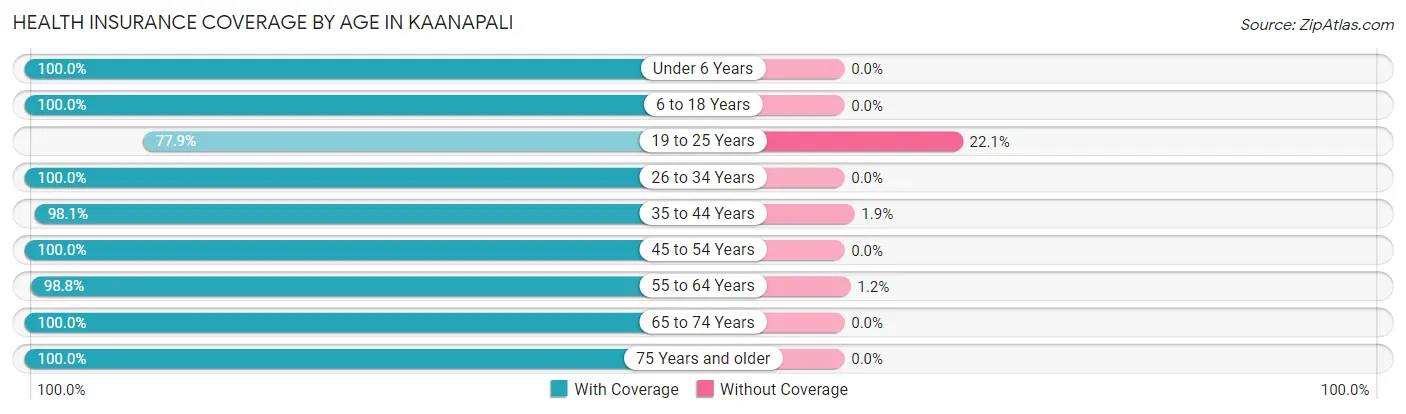
| Age Bracket | With Coverage | Without Coverage |
| Under 6 Years | 88 (100.0%) | 0 (0.0%) |
| 6 to 18 Years | 88 (100.0%) | 0 (0.0%) |
| 19 to 25 Years | 53 (77.9%) | 15 (22.1%) |
| 26 to 34 Years | 94 (100.0%) | 0 (0.0%) |
| 35 to 44 Years | 52 (98.1%) | 1 (1.9%) |
| 45 to 54 Years | 73 (100.0%) | 0 (0.0%) |
| 55 to 64 Years | 255 (98.8%) | 3 (1.2%) |
| 65 to 74 Years | 340 (100.0%) | 0 (0.0%) |
| 75 Years and older | 165 (100.0%) | 0 (0.0%) |
| Total | 1,208 (98.5%) | 19 (1.5%) |
Health Insurance Coverage by Citizenship Status in Kaanapali
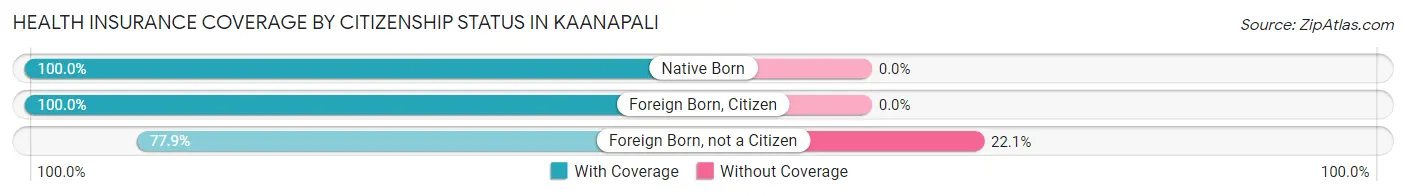
| Citizenship Status | With Coverage | Without Coverage |
| Native Born | 88 (100.0%) | 0 (0.0%) |
| Foreign Born, Citizen | 88 (100.0%) | 0 (0.0%) |
| Foreign Born, not a Citizen | 53 (77.9%) | 15 (22.1%) |
Health Insurance Coverage by Household Income in Kaanapali
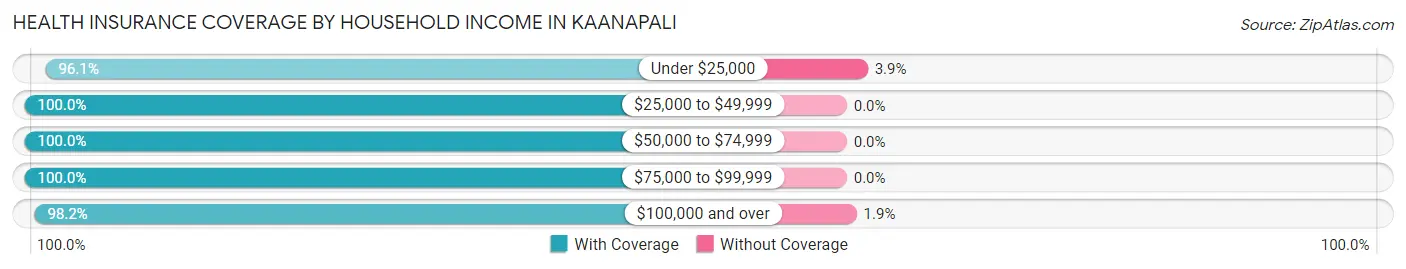
| Household Income | With Coverage | Without Coverage |
| Under $25,000 | 98 (96.1%) | 4 (3.9%) |
| $25,000 to $49,999 | 19 (100.0%) | 0 (0.0%) |
| $50,000 to $74,999 | 218 (100.0%) | 0 (0.0%) |
| $75,000 to $99,999 | 67 (100.0%) | 0 (0.0%) |
| $100,000 and over | 795 (98.2%) | 15 (1.8%) |
Public vs Private Health Insurance Coverage by Age in Kaanapali
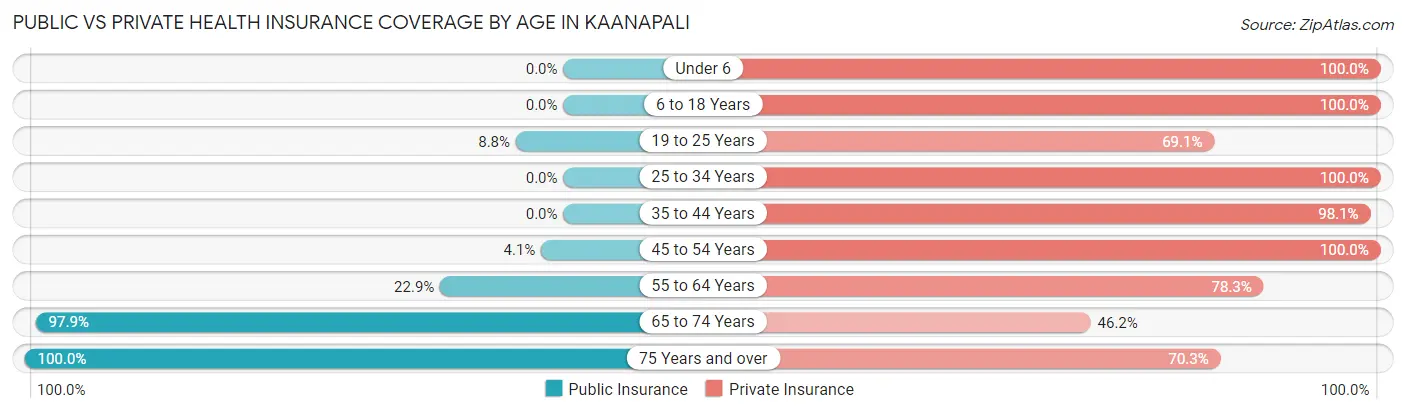
| Age Bracket | Public Insurance | Private Insurance |
| Under 6 | 0 (0.0%) | 88 (100.0%) |
| 6 to 18 Years | 0 (0.0%) | 88 (100.0%) |
| 19 to 25 Years | 6 (8.8%) | 47 (69.1%) |
| 25 to 34 Years | 0 (0.0%) | 94 (100.0%) |
| 35 to 44 Years | 0 (0.0%) | 52 (98.1%) |
| 45 to 54 Years | 3 (4.1%) | 73 (100.0%) |
| 55 to 64 Years | 59 (22.9%) | 202 (78.3%) |
| 65 to 74 Years | 333 (97.9%) | 157 (46.2%) |
| 75 Years and over | 165 (100.0%) | 116 (70.3%) |
| Total | 566 (46.1%) | 917 (74.7%) |
Disability Status by Sex by Age in Kaanapali
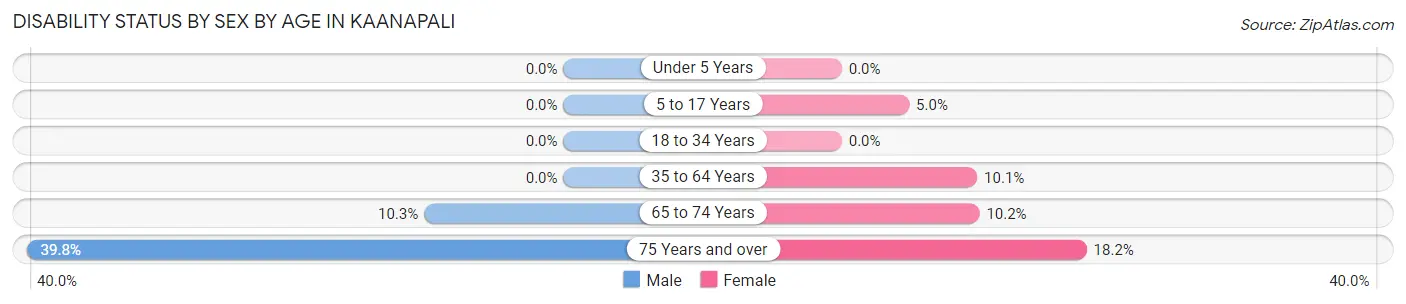
| Age Bracket | Male | Female |
| Under 5 Years | 0 (0.0%) | 0 (0.0%) |
| 5 to 17 Years | 0 (0.0%) | 3 (5.0%) |
| 18 to 34 Years | 0 (0.0%) | 0 (0.0%) |
| 35 to 64 Years | 0 (0.0%) | 21 (10.1%) |
| 65 to 74 Years | 21 (10.3%) | 14 (10.2%) |
| 75 Years and over | 35 (39.8%) | 14 (18.2%) |
Disability Class by Sex by Age in Kaanapali
Disability Class: Hearing Difficulty
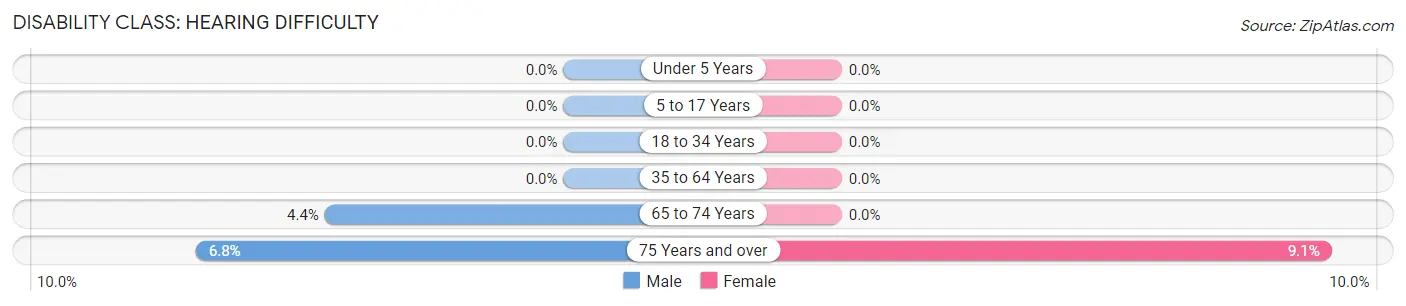
| Age Bracket | Male | Female |
| Under 5 Years | 0 (0.0%) | 0 (0.0%) |
| 5 to 17 Years | 0 (0.0%) | 0 (0.0%) |
| 18 to 34 Years | 0 (0.0%) | 0 (0.0%) |
| 35 to 64 Years | 0 (0.0%) | 0 (0.0%) |
| 65 to 74 Years | 9 (4.4%) | 0 (0.0%) |
| 75 Years and over | 6 (6.8%) | 7 (9.1%) |
Disability Class: Vision Difficulty
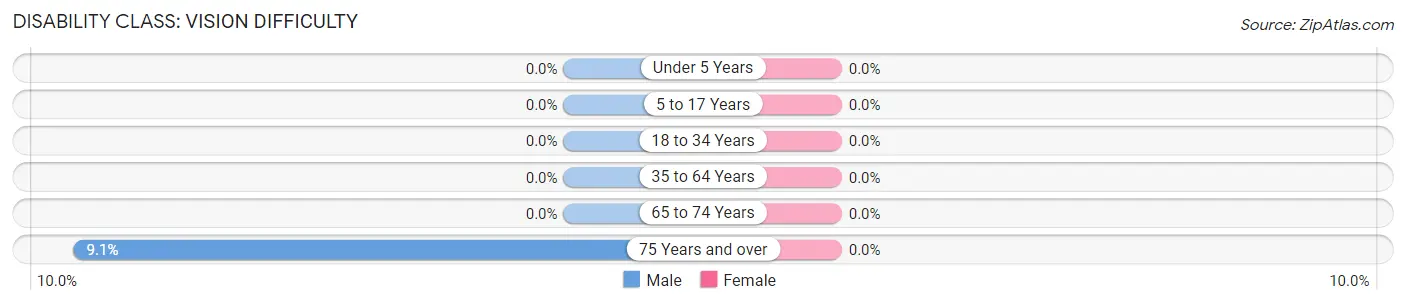
| Age Bracket | Male | Female |
| Under 5 Years | 0 (0.0%) | 0 (0.0%) |
| 5 to 17 Years | 0 (0.0%) | 0 (0.0%) |
| 18 to 34 Years | 0 (0.0%) | 0 (0.0%) |
| 35 to 64 Years | 0 (0.0%) | 0 (0.0%) |
| 65 to 74 Years | 0 (0.0%) | 0 (0.0%) |
| 75 Years and over | 8 (9.1%) | 0 (0.0%) |
Disability Class: Cognitive Difficulty
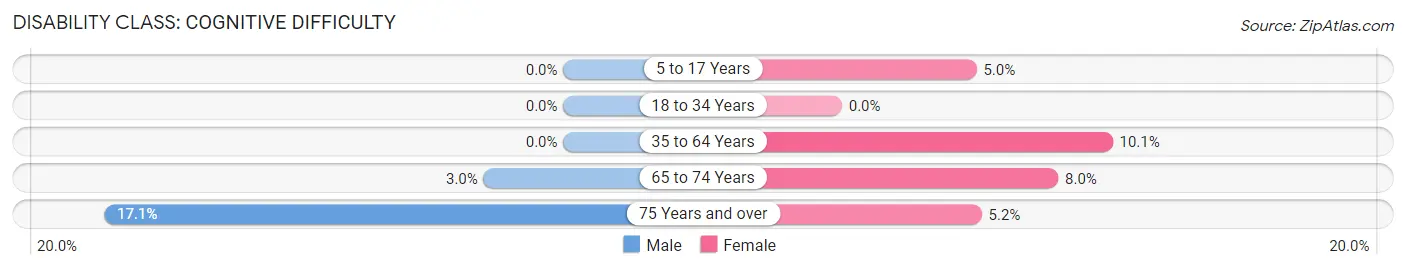
| Age Bracket | Male | Female |
| 5 to 17 Years | 0 (0.0%) | 3 (5.0%) |
| 18 to 34 Years | 0 (0.0%) | 0 (0.0%) |
| 35 to 64 Years | 0 (0.0%) | 21 (10.1%) |
| 65 to 74 Years | 6 (3.0%) | 11 (8.0%) |
| 75 Years and over | 15 (17.1%) | 4 (5.2%) |
Disability Class: Ambulatory Difficulty
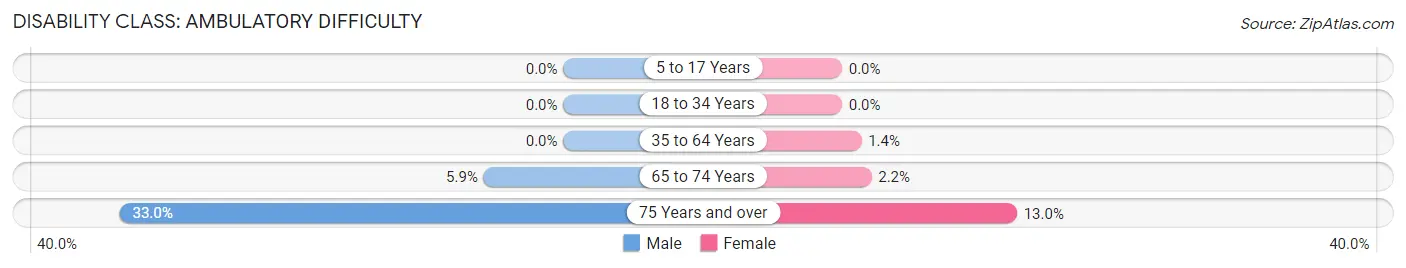
| Age Bracket | Male | Female |
| 5 to 17 Years | 0 (0.0%) | 0 (0.0%) |
| 18 to 34 Years | 0 (0.0%) | 0 (0.0%) |
| 35 to 64 Years | 0 (0.0%) | 3 (1.4%) |
| 65 to 74 Years | 12 (5.9%) | 3 (2.2%) |
| 75 Years and over | 29 (33.0%) | 10 (13.0%) |
Disability Class: Self-Care Difficulty
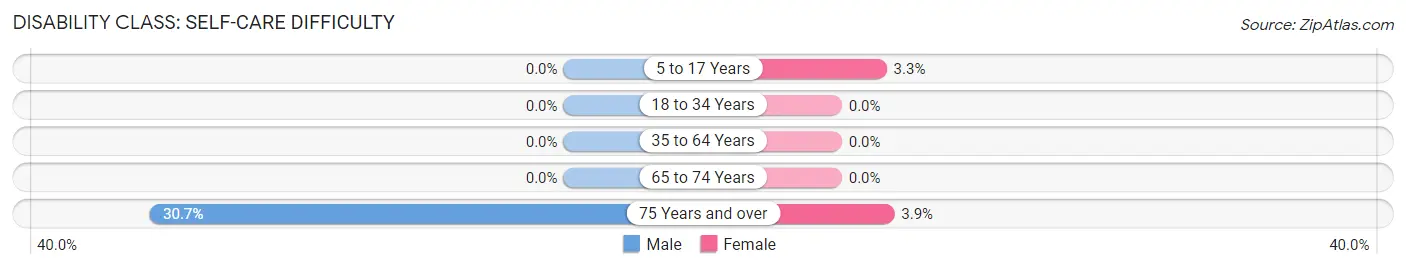
| Age Bracket | Male | Female |
| 5 to 17 Years | 0 (0.0%) | 2 (3.3%) |
| 18 to 34 Years | 0 (0.0%) | 0 (0.0%) |
| 35 to 64 Years | 0 (0.0%) | 0 (0.0%) |
| 65 to 74 Years | 0 (0.0%) | 0 (0.0%) |
| 75 Years and over | 27 (30.7%) | 3 (3.9%) |
Technology Access in Kaanapali
Computing Device Access in Kaanapali
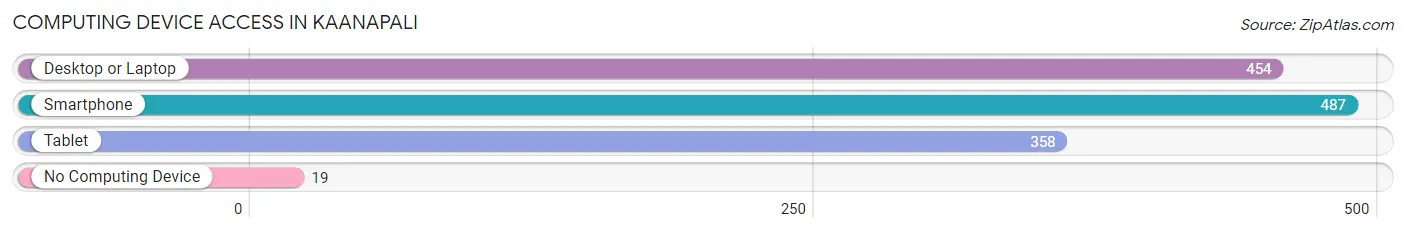
| Device Type | # Households | % Households |
| Desktop or Laptop | 454 | 82.7% |
| Smartphone | 487 | 88.7% |
| Tablet | 358 | 65.2% |
| No Computing Device | 19 | 3.5% |
| Total | 549 | 100.0% |
Internet Access in Kaanapali
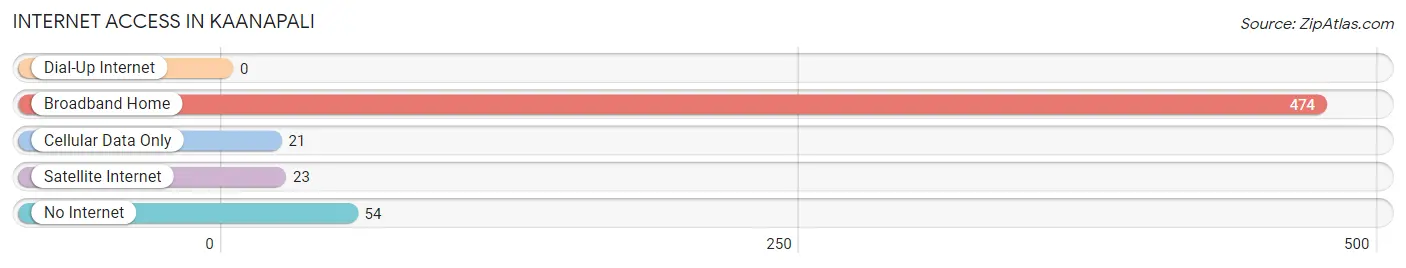
| Internet Type | # Households | % Households |
| Dial-Up Internet | 0 | 0.0% |
| Broadband Home | 474 | 86.3% |
| Cellular Data Only | 21 | 3.8% |
| Satellite Internet | 23 | 4.2% |
| No Internet | 54 | 9.8% |
| Total | 549 | 100.0% |
Kaanapali Summary
Kaanapali is a resort town located on the western side of Maui, Hawaii. It is one of the most popular tourist destinations in the state, and is known for its beautiful beaches, resorts, and activities. The area is also home to a number of historical sites, including the Kaanapali Historic Trail, which is a walking tour of the area’s past.
Geography
Kaanapali is located on the western side of Maui, Hawaii. It is bordered by the Pacific Ocean to the west, and the West Maui Mountains to the east. The area is known for its beautiful beaches, which are popular for swimming, snorkeling, and other water activities. Kaanapali is also home to a number of resorts, restaurants, and shops.
History
Kaanapali has a long and rich history. The area was first settled by Polynesian voyagers in the 13th century. The area was then occupied by the Hawaiian Kingdom in the 18th century. In the 19th century, the area was used as a whaling station, and later as a sugar plantation. In the 1960s, the area was developed as a resort destination, and today it is one of the most popular tourist destinations in Hawaii.
Economy
Kaanapali’s economy is largely driven by tourism. The area is home to a number of resorts, restaurants, and shops, which cater to the millions of tourists who visit the area each year. The area is also home to a number of golf courses, which attract golfers from around the world. Additionally, the area is home to a number of businesses that provide services to the local population, such as construction, landscaping, and other services.
Demographics
As of the 2010 census, the population of Kaanapali was 8,219. The population is largely composed of people of Hawaiian, Asian, and Pacific Islander descent. The median age of the population is 44.7 years, and the median household income is $68,945. The area is also home to a number of immigrants, primarily from the Philippines, Japan, and China.
Kaanapali is a beautiful and vibrant area of Maui, Hawaii. It is home to a number of historical sites, resorts, restaurants, and shops, and is a popular tourist destination. The area is also home to a diverse population, and has a strong economy driven by tourism. Kaanapali is a great place to visit, and is sure to provide visitors with a memorable experience.
Common Questions
What is Per Capita Income in Kaanapali?
Per Capita income in Kaanapali is $87,814.
What is the Median Family Income in Kaanapali?
Median Family Income in Kaanapali is $146,111.
What is the Median Household income in Kaanapali?
Median Household Income in Kaanapali is $119,044.
What is Income or Wage Gap in Kaanapali?
Income or Wage Gap in Kaanapali is 12.7%.
Women in Kaanapali earn 87.3 cents for every dollar earned by a man.
What is Inequality or Gini Index in Kaanapali?
Inequality or Gini Index in Kaanapali is 0.54.
What is the Total Population of Kaanapali?
Total Population of Kaanapali is 1,227.
What is the Total Male Population of Kaanapali?
Total Male Population of Kaanapali is 666.
What is the Total Female Population of Kaanapali?
Total Female Population of Kaanapali is 561.
What is the Ratio of Males per 100 Females in Kaanapali?
There are 118.72 Males per 100 Females in Kaanapali.
What is the Ratio of Females per 100 Males in Kaanapali?
There are 84.23 Females per 100 Males in Kaanapali.
What is the Median Population Age in Kaanapali?
Median Population Age in Kaanapali is 61.2 Years.
What is the Average Family Size in Kaanapali
Average Family Size in Kaanapali is 2.6 People.
What is the Average Household Size in Kaanapali
Average Household Size in Kaanapali is 2.2 People.
How Large is the Labor Force in Kaanapali?
There are 457 People in the Labor Forcein in Kaanapali.
What is the Percentage of People in the Labor Force in Kaanapali?
42.5% of People are in the Labor Force in Kaanapali.
What is the Unemployment Rate in Kaanapali?
Unemployment Rate in Kaanapali is 21.4%.