Olinda, HI Map & Demographics
Olinda Map
Olinda Overview
$56,374
PER CAPITA INCOME
$113,906
AVG FAMILY INCOME
$93,125
AVG HOUSEHOLD INCOME
40.9%
WAGE / INCOME GAP [ % ]
59.1¢/ $1
WAGE / INCOME GAP [ $ ]
0.49
INEQUALITY / GINI INDEX
1,018
TOTAL POPULATION
516
MALE POPULATION
502
FEMALE POPULATION
102.79
MALES / 100 FEMALES
97.29
FEMALES / 100 MALES
43.9
MEDIAN AGE
2.8
AVG FAMILY SIZE
2.5
AVG HOUSEHOLD SIZE
593
LABOR FORCE [ PEOPLE ]
66.3%
PERCENT IN LABOR FORCE
2.9%
UNEMPLOYMENT RATE
Income in Olinda
Income Overview in Olinda
Per Capita Income in Olinda is $56,374, while median incomes of families and households are $113,906 and $93,125 respectively.
| Characteristic | Number | Measure |
| Per Capita Income | 1,018 | $56,374 |
| Median Family Income | 291 | $113,906 |
| Mean Family Income | 291 | $155,676 |
| Median Household Income | 415 | $93,125 |
| Mean Household Income | 415 | $132,428 |
| Income Deficit | 291 | $0 |
| Wage / Income Gap (%) | 1,018 | 40.90% |
| Wage / Income Gap ($) | 1,018 | 59.10¢ per $1 |
| Gini / Inequality Index | 1,018 | 0.49 |
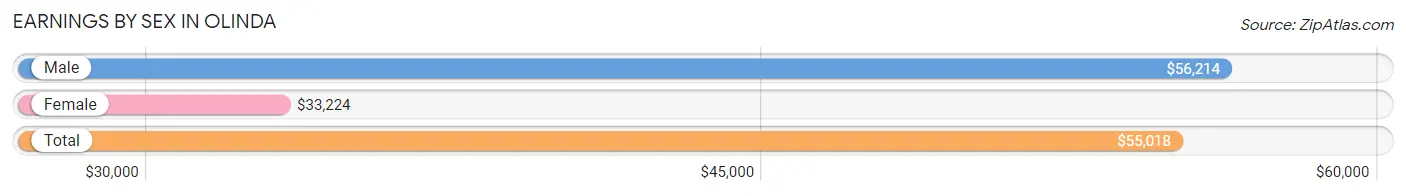
Earnings by Sex in Olinda
Average Earnings in Olinda are $55,018, $56,214 for men and $33,224 for women, a difference of 40.9%.
| Sex | Number | Average Earnings |
| Male | 312 (50.7%) | $56,214 |
| Female | 303 (49.3%) | $33,224 |
| Total | 615 (100.0%) | $55,018 |
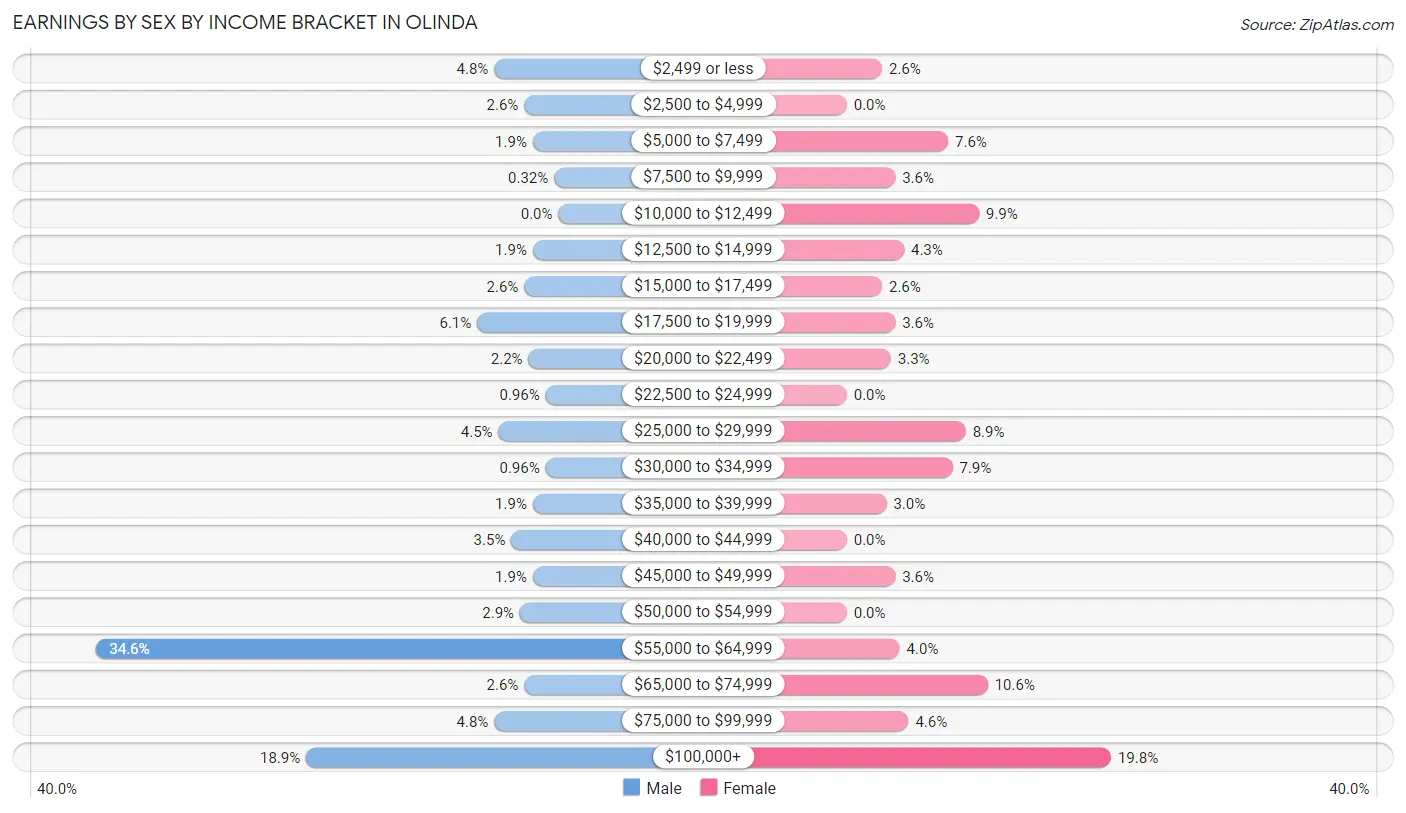
Earnings by Sex by Income Bracket in Olinda
The most common earnings brackets in Olinda are $55,000 to $64,999 for men (108 | 34.6%) and $100,000+ for women (60 | 19.8%).
| Income | Male | Female |
| $2,499 or less | 15 (4.8%) | 8 (2.6%) |
| $2,500 to $4,999 | 8 (2.6%) | 0 (0.0%) |
| $5,000 to $7,499 | 6 (1.9%) | 23 (7.6%) |
| $7,500 to $9,999 | 1 (0.3%) | 11 (3.6%) |
| $10,000 to $12,499 | 0 (0.0%) | 30 (9.9%) |
| $12,500 to $14,999 | 6 (1.9%) | 13 (4.3%) |
| $15,000 to $17,499 | 8 (2.6%) | 8 (2.6%) |
| $17,500 to $19,999 | 19 (6.1%) | 11 (3.6%) |
| $20,000 to $22,499 | 7 (2.2%) | 10 (3.3%) |
| $22,500 to $24,999 | 3 (1.0%) | 0 (0.0%) |
| $25,000 to $29,999 | 14 (4.5%) | 27 (8.9%) |
| $30,000 to $34,999 | 3 (1.0%) | 24 (7.9%) |
| $35,000 to $39,999 | 6 (1.9%) | 9 (3.0%) |
| $40,000 to $44,999 | 11 (3.5%) | 0 (0.0%) |
| $45,000 to $49,999 | 6 (1.9%) | 11 (3.6%) |
| $50,000 to $54,999 | 9 (2.9%) | 0 (0.0%) |
| $55,000 to $64,999 | 108 (34.6%) | 12 (4.0%) |
| $65,000 to $74,999 | 8 (2.6%) | 32 (10.6%) |
| $75,000 to $99,999 | 15 (4.8%) | 14 (4.6%) |
| $100,000+ | 59 (18.9%) | 60 (19.8%) |
| Total | 312 (100.0%) | 303 (100.0%) |
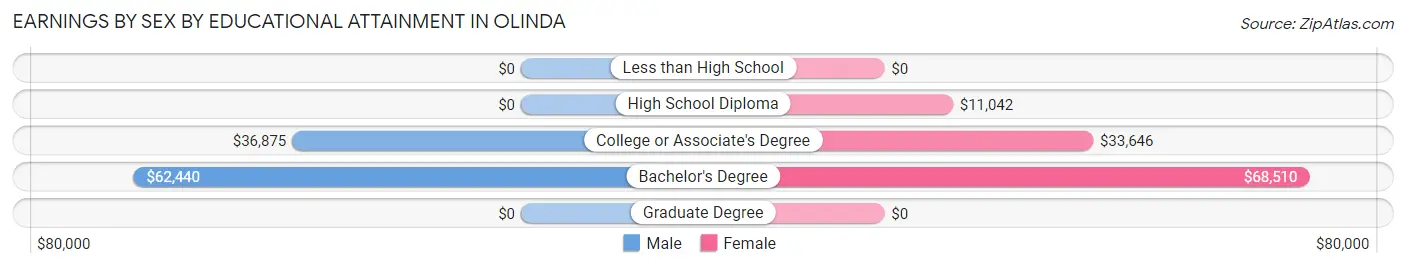
Earnings by Sex by Educational Attainment in Olinda
Average earnings in Olinda are $56,446 for men and $34,539 for women, a difference of 38.8%. Men with an educational attainment of bachelor's degree enjoy the highest average annual earnings of $62,440, while those with college or associate's degree education earn the least with $36,875. Women with an educational attainment of bachelor's degree earn the most with the average annual earnings of $68,510, while those with high school diploma education have the smallest earnings of $11,042.
| Educational Attainment | Male Income | Female Income |
| Less than High School | - | - |
| High School Diploma | - | - |
| College or Associate's Degree | $36,875 | $33,646 |
| Bachelor's Degree | $62,440 | $68,510 |
| Graduate Degree | - | - |
| Total | $56,446 | $34,539 |
Family Income in Olinda
Family Income Brackets in Olinda
According to the Olinda family income data, there are 98 families falling into the $200,000+ income range, which is the most common income bracket and makes up 33.7% of all families.
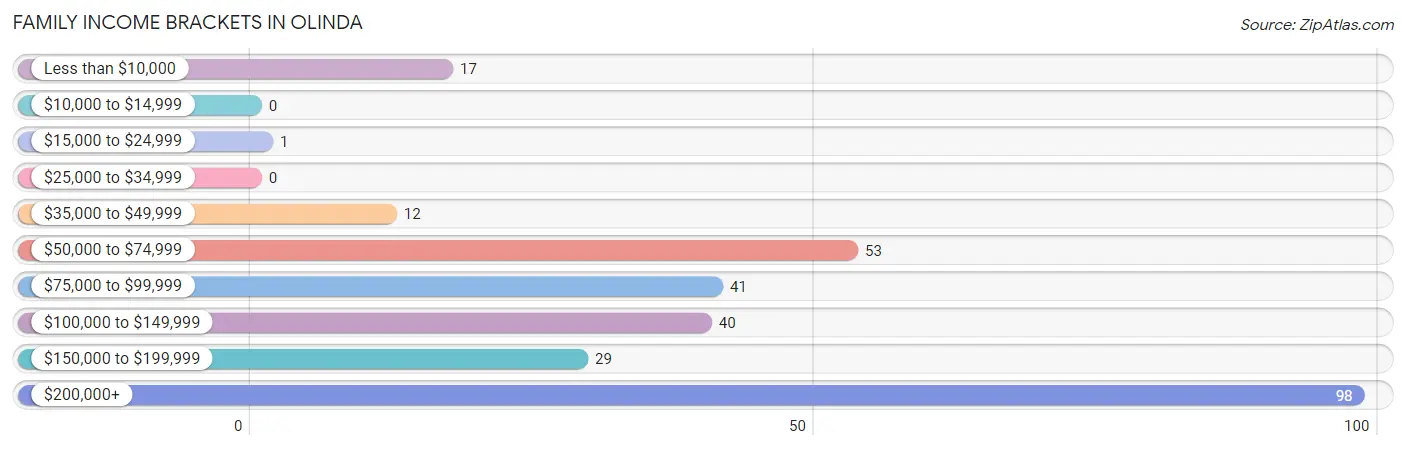
| Income Bracket | # Families | % Families |
| Less than $10,000 | 17 | 5.8% |
| $10,000 to $14,999 | 0 | 0.0% |
| $15,000 to $24,999 | 1 | 0.3% |
| $25,000 to $34,999 | 0 | 0.0% |
| $35,000 to $49,999 | 12 | 4.1% |
| $50,000 to $74,999 | 53 | 18.2% |
| $75,000 to $99,999 | 41 | 14.1% |
| $100,000 to $149,999 | 40 | 13.7% |
| $150,000 to $199,999 | 29 | 10.0% |
| $200,000+ | 98 | 33.7% |
Family Income by Famaliy Size in Olinda
2-person families (218 | 74.9%) account for the highest median family income in Olinda with $122,222 per family, while 2-person families (218 | 74.9%) have the highest median income of $61,111 per family member.
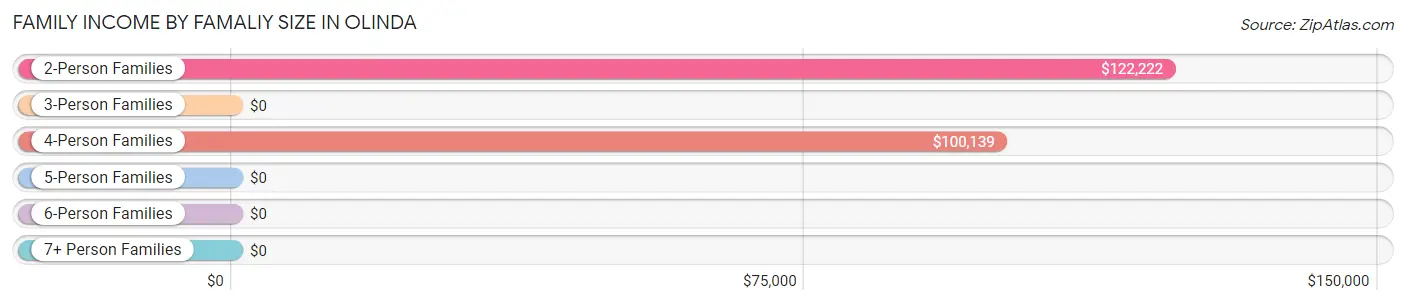
| Income Bracket | # Families | Median Income |
| 2-Person Families | 218 (74.9%) | $122,222 |
| 3-Person Families | 16 (5.5%) | $0 |
| 4-Person Families | 37 (12.7%) | $100,139 |
| 5-Person Families | 3 (1.0%) | $0 |
| 6-Person Families | 17 (5.8%) | $0 |
| 7+ Person Families | 0 (0.0%) | $0 |
| Total | 291 (100.0%) | $113,906 |
Family Income by Number of Earners in Olinda
| Number of Earners | # Families | Median Income |
| No Earners | 48 (16.5%) | $0 |
| 1 Earner | 59 (20.3%) | $0 |
| 2 Earners | 164 (56.4%) | $0 |
| 3+ Earners | 20 (6.9%) | $0 |
| Total | 291 (100.0%) | $113,906 |
Household Income in Olinda
Household Income Brackets in Olinda
With 107 households falling in the category, the $200,000+ income range is the most frequent in Olinda, accounting for 25.8% of all households. In contrast, only 5 households (1.2%) fall into the $15,000 to $24,999 income bracket, making it the least populous group.
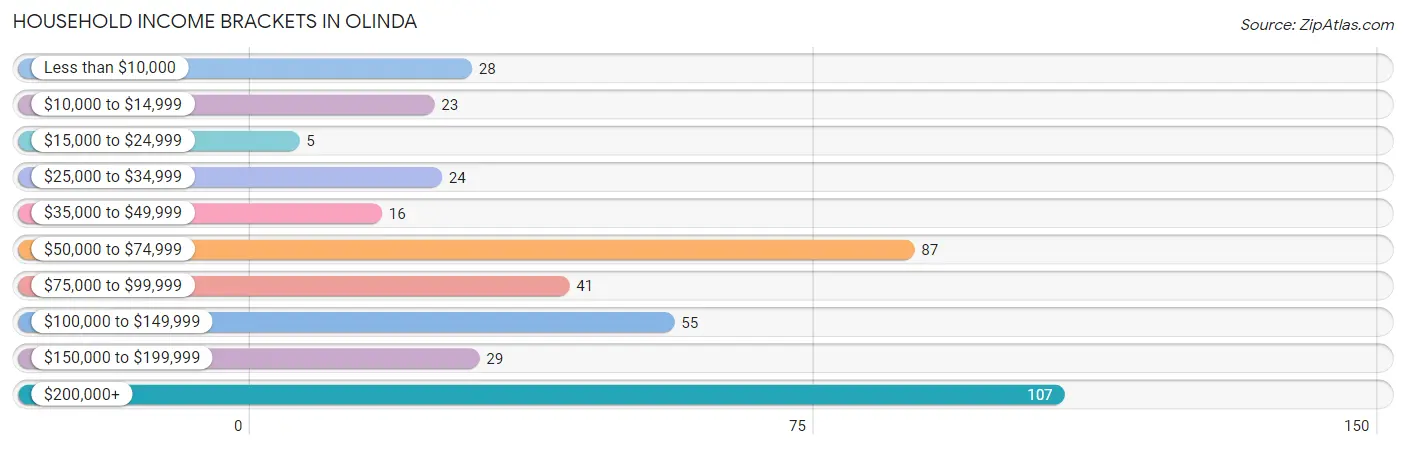
| Income Bracket | # Households | % Households |
| Less than $10,000 | 28 | 6.7% |
| $10,000 to $14,999 | 23 | 5.5% |
| $15,000 to $24,999 | 5 | 1.2% |
| $25,000 to $34,999 | 24 | 5.8% |
| $35,000 to $49,999 | 16 | 3.9% |
| $50,000 to $74,999 | 87 | 21.0% |
| $75,000 to $99,999 | 41 | 9.9% |
| $100,000 to $149,999 | 55 | 13.3% |
| $150,000 to $199,999 | 29 | 7.0% |
| $200,000+ | 107 | 25.8% |
Household Income by Householder Age in Olinda
The median household income in Olinda is $93,125, with the highest median household income of $99,271 found in the 45 to 64 years age bracket for the primary householder. A total of 119 households (28.7%) fall into this category.
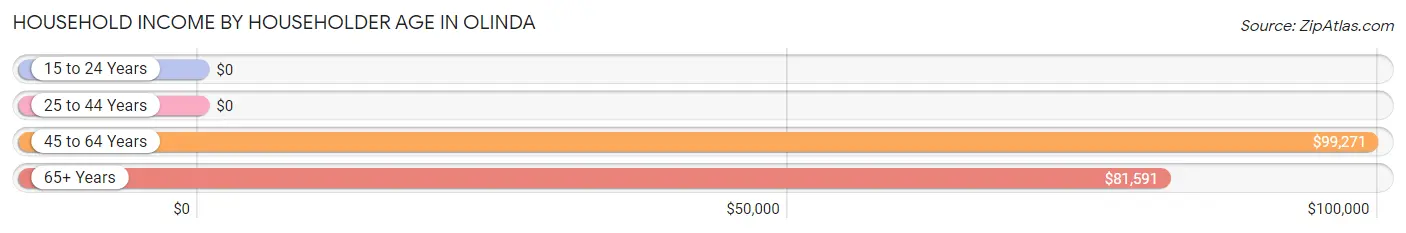
| Income Bracket | # Households | Median Income |
| 15 to 24 Years | 0 (0.0%) | $0 |
| 25 to 44 Years | 164 (39.5%) | $0 |
| 45 to 64 Years | 119 (28.7%) | $99,271 |
| 65+ Years | 132 (31.8%) | $81,591 |
| Total | 415 (100.0%) | $93,125 |
Poverty in Olinda
Income Below Poverty by Sex and Age in Olinda
With 8.9% poverty level for males and 11.7% for females among the residents of Olinda, 55 to 64 year old males and 65 to 74 year old females are the most vulnerable to poverty, with 14 males (26.4%) and 22 females (27.9%) in their respective age groups living below the poverty level.
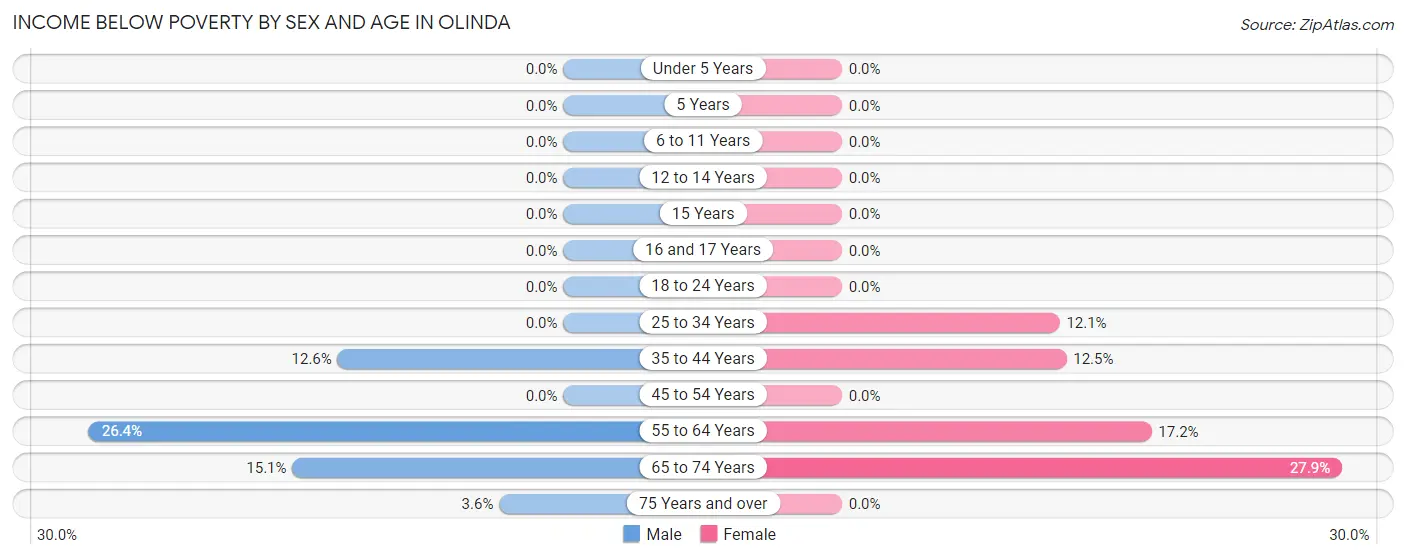
| Age Bracket | Male | Female |
| Under 5 Years | 0 (0.0%) | 0 (0.0%) |
| 5 Years | 0 (0.0%) | 0 (0.0%) |
| 6 to 11 Years | 0 (0.0%) | 0 (0.0%) |
| 12 to 14 Years | 0 (0.0%) | 0 (0.0%) |
| 15 Years | 0 (0.0%) | 0 (0.0%) |
| 16 and 17 Years | 0 (0.0%) | 0 (0.0%) |
| 18 to 24 Years | 0 (0.0%) | 0 (0.0%) |
| 25 to 34 Years | 0 (0.0%) | 4 (12.1%) |
| 35 to 44 Years | 21 (12.6%) | 18 (12.5%) |
| 45 to 54 Years | 0 (0.0%) | 0 (0.0%) |
| 55 to 64 Years | 14 (26.4%) | 15 (17.2%) |
| 65 to 74 Years | 8 (15.1%) | 22 (27.9%) |
| 75 Years and over | 3 (3.6%) | 0 (0.0%) |
| Total | 46 (8.9%) | 59 (11.7%) |
Income Above Poverty by Sex and Age in Olinda
According to the poverty statistics in Olinda, males aged under 5 years and females aged under 5 years are the age groups that are most secure financially, with 100.0% of males and 100.0% of females in these age groups living above the poverty line.
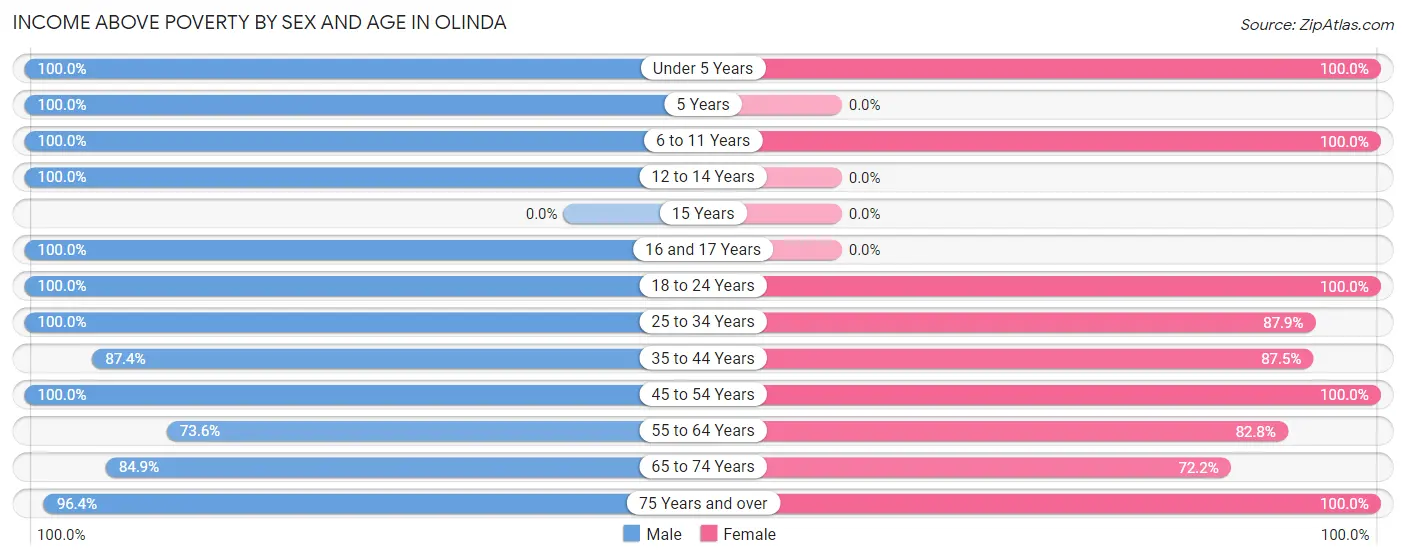
| Age Bracket | Male | Female |
| Under 5 Years | 16 (100.0%) | 26 (100.0%) |
| 5 Years | 2 (100.0%) | 0 (0.0%) |
| 6 to 11 Years | 32 (100.0%) | 17 (100.0%) |
| 12 to 14 Years | 31 (100.0%) | 0 (0.0%) |
| 15 Years | 0 (0.0%) | 0 (0.0%) |
| 16 and 17 Years | 5 (100.0%) | 0 (0.0%) |
| 18 to 24 Years | 11 (100.0%) | 20 (100.0%) |
| 25 to 34 Years | 15 (100.0%) | 29 (87.9%) |
| 35 to 44 Years | 146 (87.4%) | 126 (87.5%) |
| 45 to 54 Years | 47 (100.0%) | 68 (100.0%) |
| 55 to 64 Years | 39 (73.6%) | 72 (82.8%) |
| 65 to 74 Years | 45 (84.9%) | 57 (72.2%) |
| 75 Years and over | 81 (96.4%) | 28 (100.0%) |
| Total | 470 (91.1%) | 443 (88.2%) |
Income Below Poverty Among Married-Couple Families in Olinda
The poverty statistics for married-couple families in Olinda show that 7.4% or 17 of the total 231 families live below the poverty line. Families with no children have the highest poverty rate of 9.2%, comprising of 17 families. On the other hand, families with 1 or 2 children have the lowest poverty rate of 0.0%, which includes 0 families.
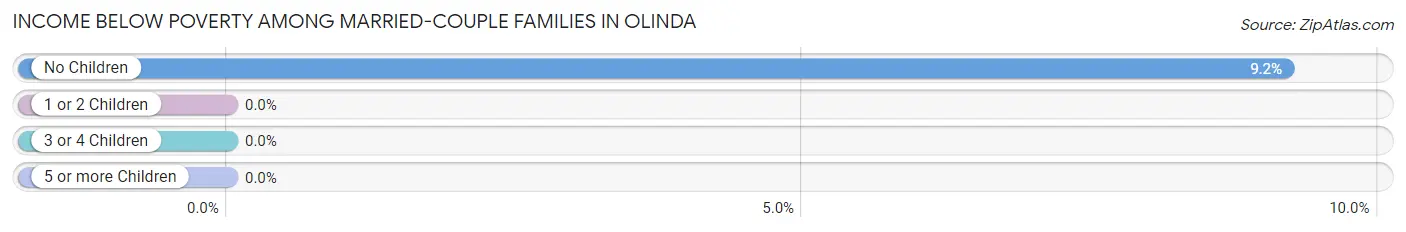
| Children | Above Poverty | Below Poverty |
| No Children | 168 (90.8%) | 17 (9.2%) |
| 1 or 2 Children | 34 (100.0%) | 0 (0.0%) |
| 3 or 4 Children | 12 (100.0%) | 0 (0.0%) |
| 5 or more Children | 0 (0.0%) | 0 (0.0%) |
| Total | 214 (92.6%) | 17 (7.4%) |
Income Below Poverty Among Single-Parent Households in Olinda
| Children | Single Father | Single Mother |
| No Children | 0 (0.0%) | 0 (0.0%) |
| 1 or 2 Children | 0 (0.0%) | 0 (0.0%) |
| 3 or 4 Children | 0 (0.0%) | 0 (0.0%) |
| 5 or more Children | 0 (0.0%) | 0 (0.0%) |
| Total | 0 (0.0%) | 0 (0.0%) |
Income Below Poverty Among Married-Couple vs Single-Parent Households in Olinda
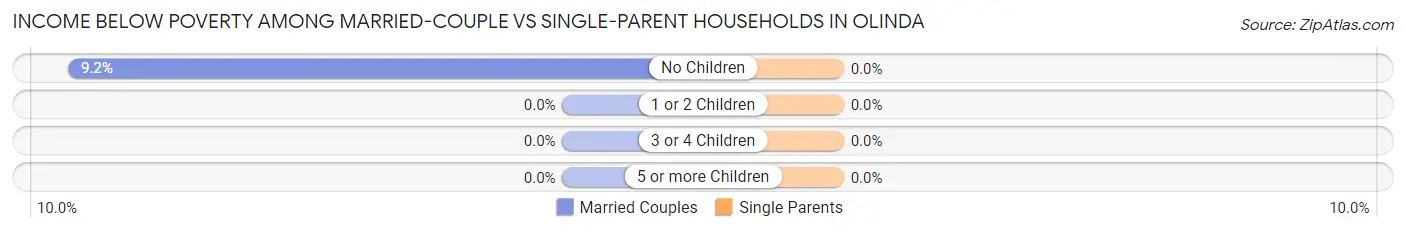
| Children | Married-Couple Families | Single-Parent Households |
| No Children | 17 (9.2%) | 0 (0.0%) |
| 1 or 2 Children | 0 (0.0%) | 0 (0.0%) |
| 3 or 4 Children | 0 (0.0%) | 0 (0.0%) |
| 5 or more Children | 0 (0.0%) | 0 (0.0%) |
| Total | 17 (7.4%) | 0 (0.0%) |
Race in Olinda
The most populous races in Olinda are White / Caucasian (638 | 62.7%), Two or more Races (226 | 22.2%), and Hispanic or Latino (85 | 8.4%).
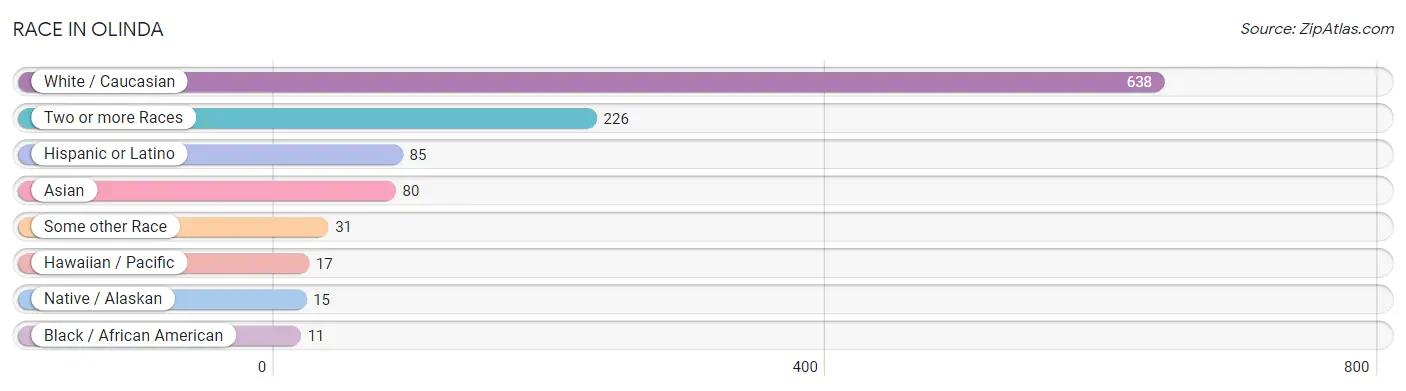
| Race | # Population | % Population |
| Asian | 80 | 7.9% |
| Black / African American | 11 | 1.1% |
| Hawaiian / Pacific | 17 | 1.7% |
| Hispanic or Latino | 85 | 8.4% |
| Native / Alaskan | 15 | 1.5% |
| White / Caucasian | 638 | 62.7% |
| Two or more Races | 226 | 22.2% |
| Some other Race | 31 | 3.0% |
| Total | 1,018 | 100.0% |
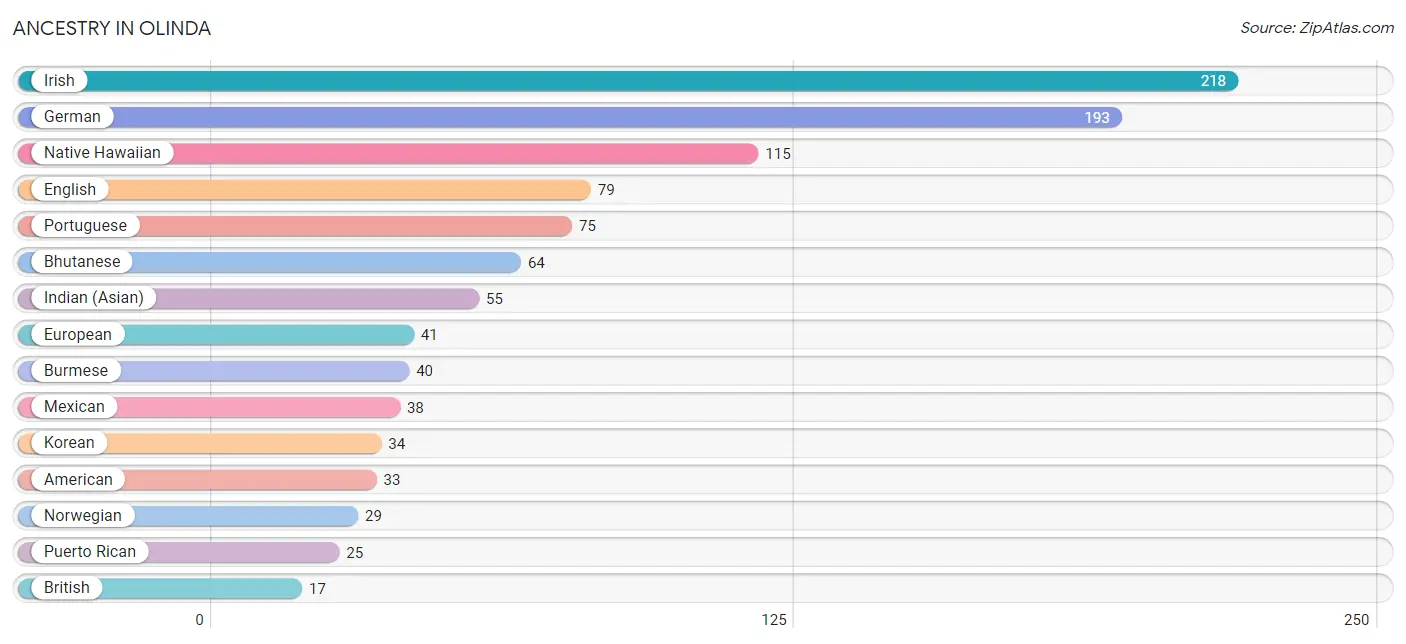
Ancestry in Olinda
The most populous ancestries reported in Olinda are Irish (218 | 21.4%), German (193 | 19.0%), Native Hawaiian (115 | 11.3%), English (79 | 7.8%), and Portuguese (75 | 7.4%), together accounting for 66.8% of all Olinda residents.
| Ancestry | # Population | % Population |
| African | 3 | 0.3% |
| American | 33 | 3.2% |
| Bhutanese | 64 | 6.3% |
| British | 17 | 1.7% |
| Burmese | 40 | 3.9% |
| Canadian | 4 | 0.4% |
| Central American | 7 | 0.7% |
| Chinese | 6 | 0.6% |
| Costa Rican | 7 | 0.7% |
| Cuban | 2 | 0.2% |
| Czech | 3 | 0.3% |
| Eastern European | 16 | 1.6% |
| English | 79 | 7.8% |
| European | 41 | 4.0% |
| French | 8 | 0.8% |
| German | 193 | 19.0% |
| Greek | 4 | 0.4% |
| Indian (Asian) | 55 | 5.4% |
| Iranian | 6 | 0.6% |
| Irish | 218 | 21.4% |
| Italian | 14 | 1.4% |
| Korean | 34 | 3.3% |
| Lithuanian | 6 | 0.6% |
| Mexican | 38 | 3.7% |
| Native Hawaiian | 115 | 11.3% |
| Northern European | 10 | 1.0% |
| Norwegian | 29 | 2.9% |
| Osage | 7 | 0.7% |
| Peruvian | 7 | 0.7% |
| Polish | 12 | 1.2% |
| Portuguese | 75 | 7.4% |
| Puerto Rican | 25 | 2.5% |
| Puget Sound Salish | 2 | 0.2% |
| Russian | 11 | 1.1% |
| Samoan | 4 | 0.4% |
| Scotch-Irish | 5 | 0.5% |
| Scottish | 13 | 1.3% |
| South American | 7 | 0.7% |
| Sri Lankan | 4 | 0.4% |
| Subsaharan African | 3 | 0.3% |
| Swedish | 12 | 1.2% |
| Swiss | 4 | 0.4% |
| Thai | 8 | 0.8% |
| Trinidadian and Tobagonian | 2 | 0.2% |
| Ukrainian | 2 | 0.2% |
| Welsh | 1 | 0.1% | View All 46 Rows |
Immigrants in Olinda
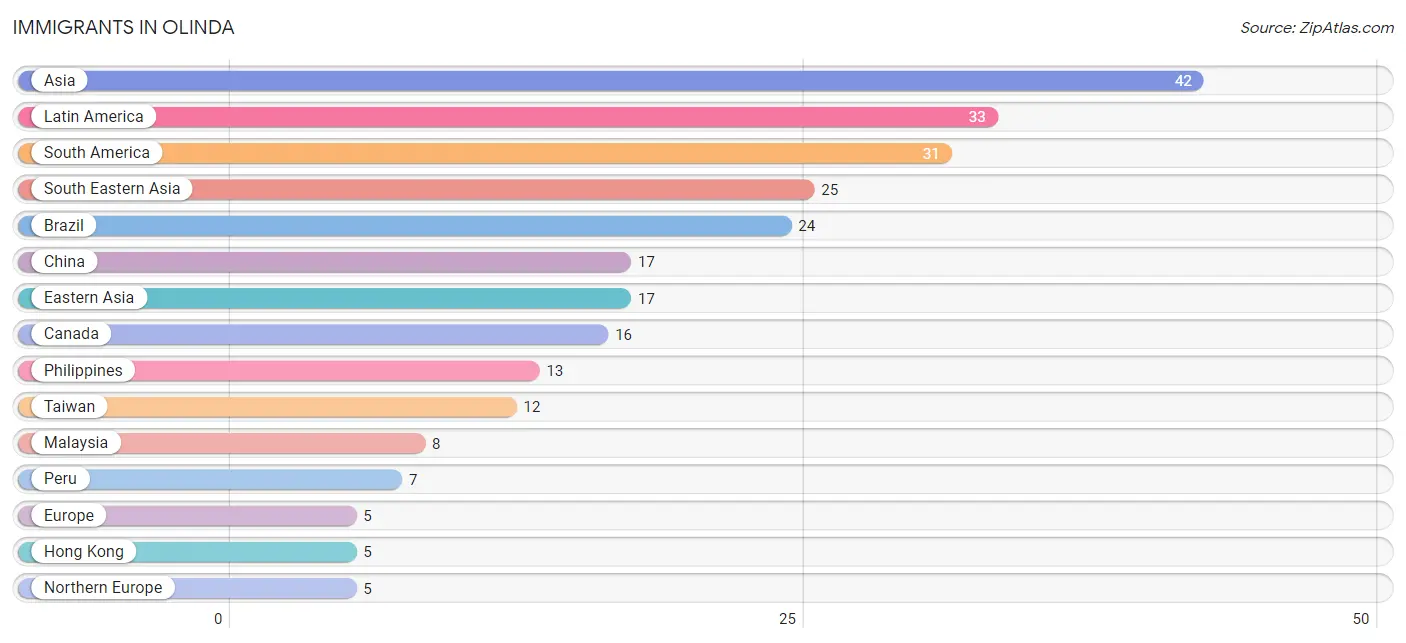
The most numerous immigrant groups reported in Olinda came from Asia (42 | 4.1%), Latin America (33 | 3.2%), South America (31 | 3.0%), South Eastern Asia (25 | 2.5%), and Brazil (24 | 2.4%), together accounting for 15.2% of all Olinda residents.
| Immigration Origin | # Population | % Population |
| Asia | 42 | 4.1% |
| Brazil | 24 | 2.4% |
| Canada | 16 | 1.6% |
| Caribbean | 2 | 0.2% |
| China | 17 | 1.7% |
| Cuba | 2 | 0.2% |
| Eastern Asia | 17 | 1.7% |
| Europe | 5 | 0.5% |
| Hong Kong | 5 | 0.5% |
| Latin America | 33 | 3.2% |
| Malaysia | 8 | 0.8% |
| Northern Europe | 5 | 0.5% |
| Peru | 7 | 0.7% |
| Philippines | 13 | 1.3% |
| South America | 31 | 3.0% |
| South Eastern Asia | 25 | 2.5% |
| Taiwan | 12 | 1.2% |
| Vietnam | 4 | 0.4% | View All 18 Rows |
Sex and Age in Olinda
Sex and Age in Olinda
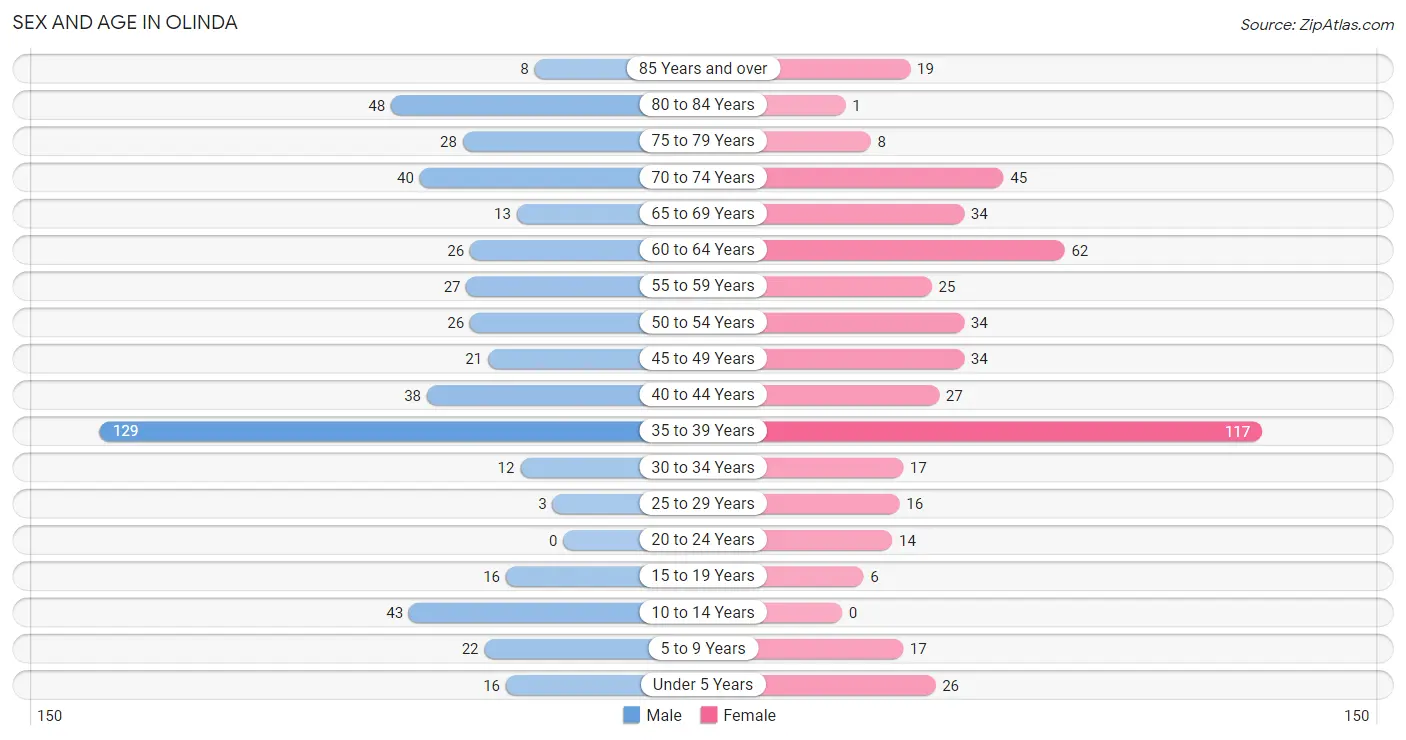
The most populous age groups in Olinda are 35 to 39 Years (129 | 25.0%) for men and 35 to 39 Years (117 | 23.3%) for women.
| Age Bracket | Male | Female |
| Under 5 Years | 16 (3.1%) | 26 (5.2%) |
| 5 to 9 Years | 22 (4.3%) | 17 (3.4%) |
| 10 to 14 Years | 43 (8.3%) | 0 (0.0%) |
| 15 to 19 Years | 16 (3.1%) | 6 (1.2%) |
| 20 to 24 Years | 0 (0.0%) | 14 (2.8%) |
| 25 to 29 Years | 3 (0.6%) | 16 (3.2%) |
| 30 to 34 Years | 12 (2.3%) | 17 (3.4%) |
| 35 to 39 Years | 129 (25.0%) | 117 (23.3%) |
| 40 to 44 Years | 38 (7.4%) | 27 (5.4%) |
| 45 to 49 Years | 21 (4.1%) | 34 (6.8%) |
| 50 to 54 Years | 26 (5.0%) | 34 (6.8%) |
| 55 to 59 Years | 27 (5.2%) | 25 (5.0%) |
| 60 to 64 Years | 26 (5.0%) | 62 (12.3%) |
| 65 to 69 Years | 13 (2.5%) | 34 (6.8%) |
| 70 to 74 Years | 40 (7.7%) | 45 (9.0%) |
| 75 to 79 Years | 28 (5.4%) | 8 (1.6%) |
| 80 to 84 Years | 48 (9.3%) | 1 (0.2%) |
| 85 Years and over | 8 (1.5%) | 19 (3.8%) |
| Total | 516 (100.0%) | 502 (100.0%) |
Families and Households in Olinda
Median Family Size in Olinda
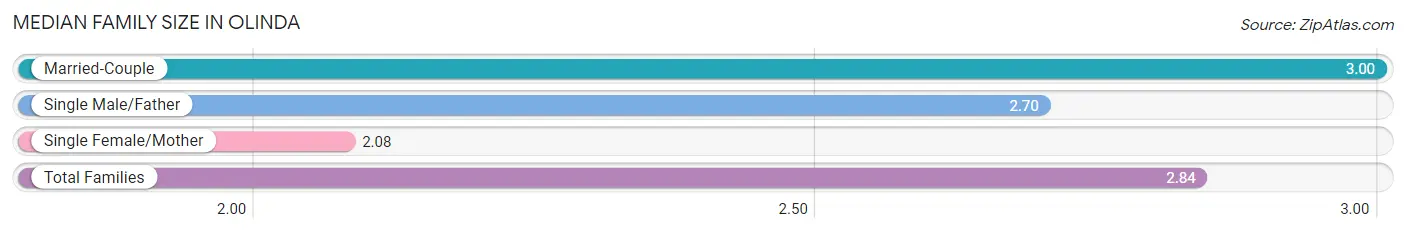
The median family size in Olinda is 2.84 persons per family, with married-couple families (231 | 79.4%) accounting for the largest median family size of 3 persons per family. On the other hand, single female/mother families (50 | 17.2%) represent the smallest median family size with 2.08 persons per family.
| Family Type | # Families | Family Size |
| Married-Couple | 231 (79.4%) | 3.00 |
| Single Male/Father | 10 (3.4%) | 2.70 |
| Single Female/Mother | 50 (17.2%) | 2.08 |
| Total Families | 291 (100.0%) | 2.84 |
Median Household Size in Olinda
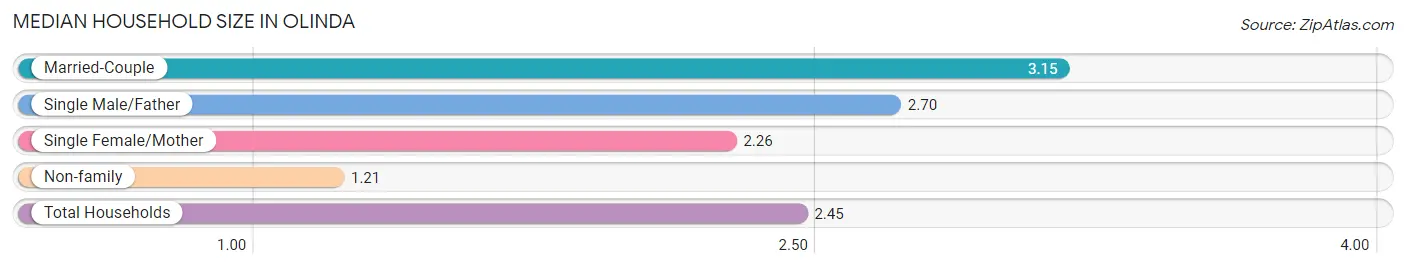
The median household size in Olinda is 2.45 persons per household, with married-couple households (231 | 55.7%) accounting for the largest median household size of 3.15 persons per household. non-family households (124 | 29.9%) represent the smallest median household size with 1.21 persons per household.
| Household Type | # Households | Household Size |
| Married-Couple | 231 (55.7%) | 3.15 |
| Single Male/Father | 10 (2.4%) | 2.70 |
| Single Female/Mother | 50 (12.0%) | 2.26 |
| Non-family | 124 (29.9%) | 1.21 |
| Total Households | 415 (100.0%) | 2.45 |
Household Size by Marriage Status in Olinda
Out of a total of 415 households in Olinda, 291 (70.1%) are family households, while 124 (29.9%) are nonfamily households. The most numerous type of family households are 2-person households, comprising 196, and the most common type of nonfamily households are 1-person households, comprising 102.
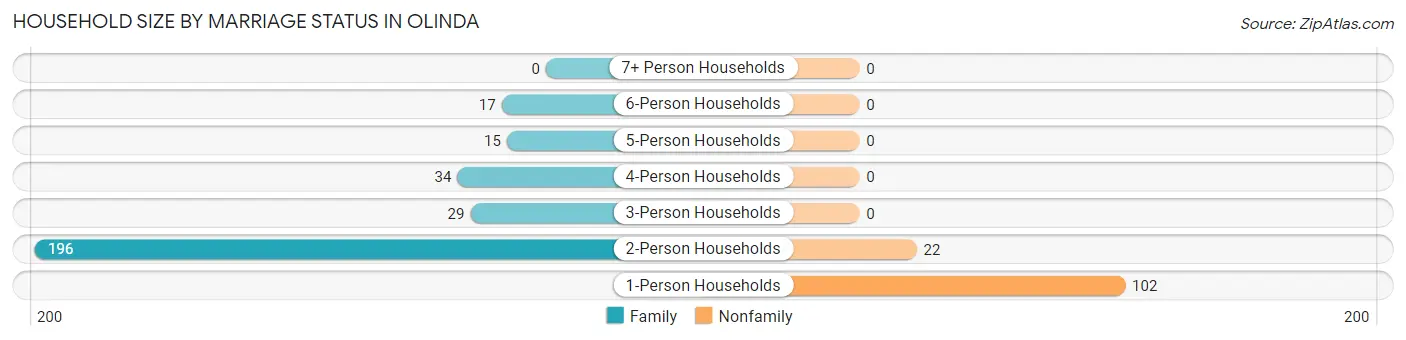
| Household Size | Family Households | Nonfamily Households |
| 1-Person Households | - | 102 (24.6%) |
| 2-Person Households | 196 (47.2%) | 22 (5.3%) |
| 3-Person Households | 29 (7.0%) | 0 (0.0%) |
| 4-Person Households | 34 (8.2%) | 0 (0.0%) |
| 5-Person Households | 15 (3.6%) | 0 (0.0%) |
| 6-Person Households | 17 (4.1%) | 0 (0.0%) |
| 7+ Person Households | 0 (0.0%) | 0 (0.0%) |
| Total | 291 (70.1%) | 124 (29.9%) |
Female Fertility in Olinda
Fertility by Age in Olinda
Average fertility rate in Olinda is 45.0 births per 1,000 women. Women in the age bracket of 20 to 34 years have the highest fertility rate with 234.0 births per 1,000 women. Women in the age bracket of 20 to 34 years acount for 100.0% of all women with births.
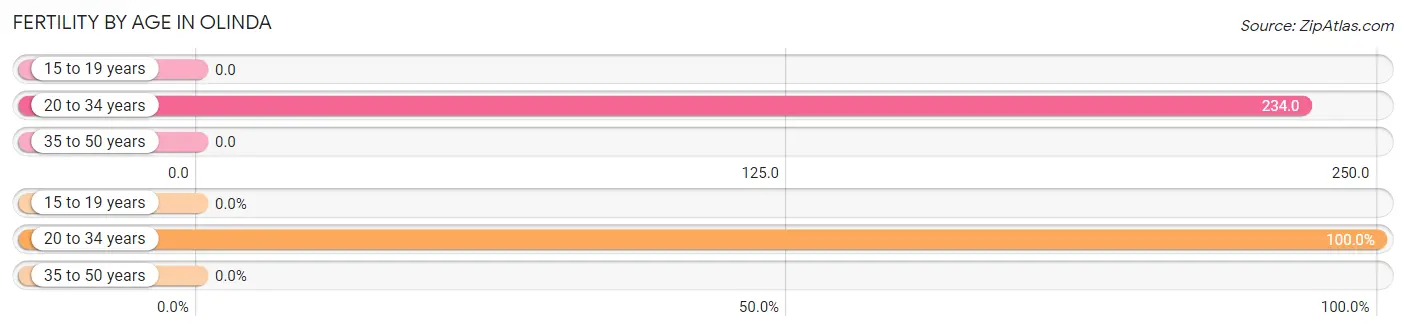
| Age Bracket | Women with Births | Births / 1,000 Women |
| 15 to 19 years | 0 (0.0%) | 0.0 |
| 20 to 34 years | 11 (100.0%) | 234.0 |
| 35 to 50 years | 0 (0.0%) | 0.0 |
| Total | 11 (100.0%) | 45.0 |
Fertility by Age by Marriage Status in Olinda
36.4% of women with births (11) in Olinda are married. The highest percentage of unmarried women with births falls into 20 to 34 years age bracket with 63.6% of them unmarried at the time of birth, while the lowest percentage of unmarried women with births belong to 20 to 34 years age bracket with 63.6% of them unmarried.
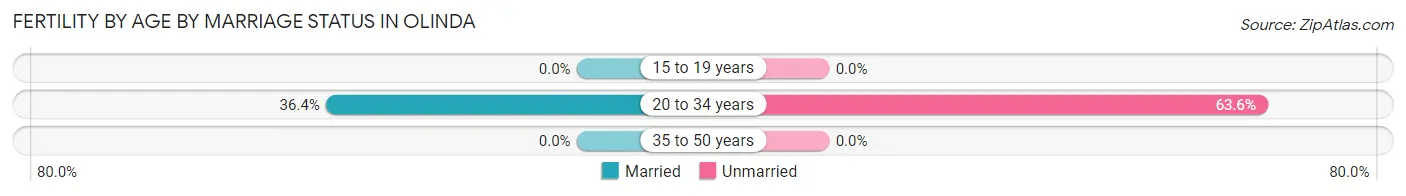
| Age Bracket | Married | Unmarried |
| 15 to 19 years | 0 (0.0%) | 0 (0.0%) |
| 20 to 34 years | 4 (36.4%) | 7 (63.6%) |
| 35 to 50 years | 0 (0.0%) | 0 (0.0%) |
| Total | 4 (36.4%) | 7 (63.6%) |
Fertility by Education in Olinda
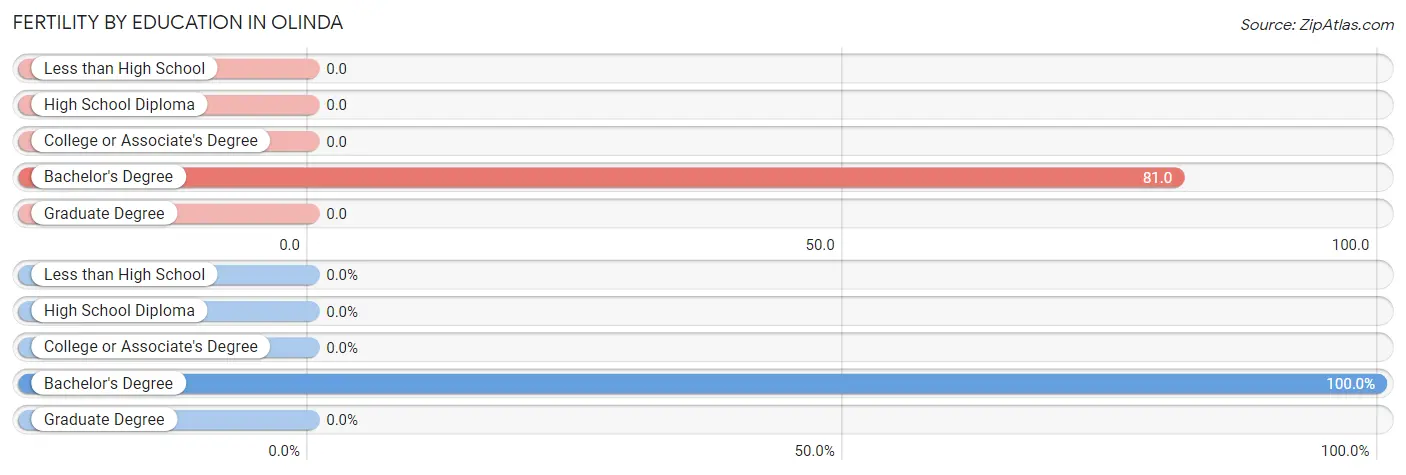
| Educational Attainment | Women with Births | Births / 1,000 Women |
| Less than High School | 0 (0.0%) | 0.0 |
| High School Diploma | 0 (0.0%) | 0.0 |
| College or Associate's Degree | 0 (0.0%) | 0.0 |
| Bachelor's Degree | 11 (100.0%) | 81.0 |
| Graduate Degree | 0 (0.0%) | 0.0 |
| Total | 11 (100.0%) | 45.0 |
Fertility by Education by Marriage Status in Olinda
63.6% of women with births in Olinda are unmarried. Women with the educational attainment of bachelor's degree are most likely to be married with 36.4% of them married at childbirth, while women with the educational attainment of bachelor's degree are least likely to be married with 63.6% of them unmarried at childbirth.
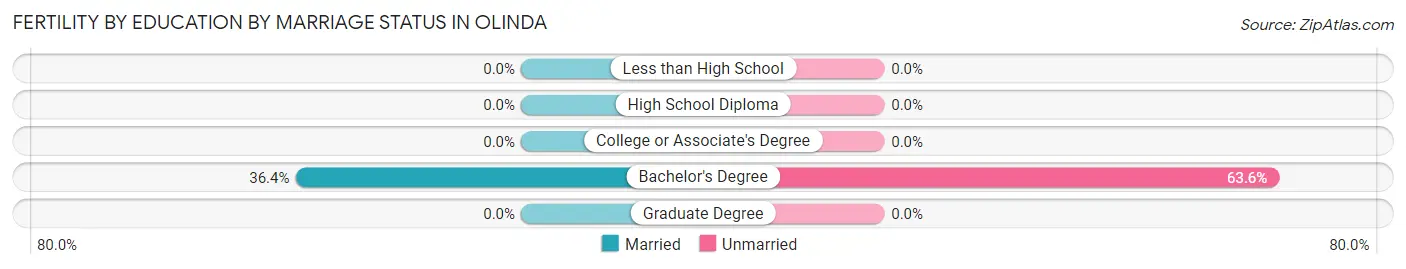
| Educational Attainment | Married | Unmarried |
| Less than High School | 0 (0.0%) | 0 (0.0%) |
| High School Diploma | 0 (0.0%) | 0 (0.0%) |
| College or Associate's Degree | 0 (0.0%) | 0 (0.0%) |
| Bachelor's Degree | 4 (36.4%) | 7 (63.6%) |
| Graduate Degree | 0 (0.0%) | 0 (0.0%) |
| Total | 4 (36.4%) | 7 (63.6%) |
Employment Characteristics in Olinda
Employment by Class of Employer in Olinda
Among the 576 employed individuals in Olinda, private company employees (192 | 33.3%), self-employed (not incorporated) (176 | 30.6%), and self-employed (incorporated) (93 | 16.2%) make up the most common classes of employment.
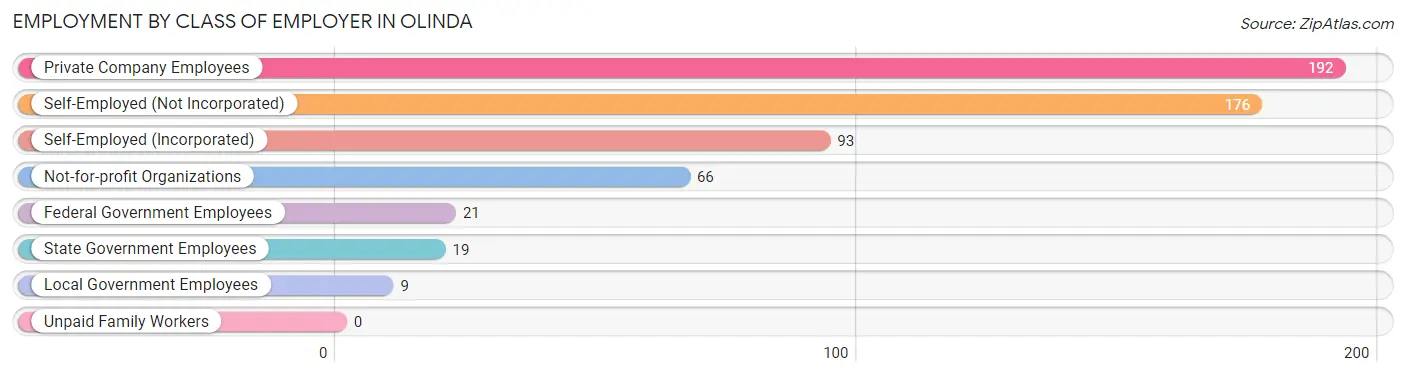
| Employer Class | # Employees | % Employees |
| Private Company Employees | 192 | 33.3% |
| Self-Employed (Incorporated) | 93 | 16.2% |
| Self-Employed (Not Incorporated) | 176 | 30.6% |
| Not-for-profit Organizations | 66 | 11.5% |
| Local Government Employees | 9 | 1.6% |
| State Government Employees | 19 | 3.3% |
| Federal Government Employees | 21 | 3.6% |
| Unpaid Family Workers | 0 | 0.0% |
| Total | 576 | 100.0% |
Employment Status by Age in Olinda
According to the labor force statistics for Olinda, out of the total population over 16 years of age (894), 66.3% or 593 individuals are in the labor force, with 2.9% or 17 of them unemployed. The age group with the highest labor force participation rate is 30 to 34 years, with 100.0% or 29 individuals in the labor force. Within the labor force, the 16 to 19 years age range has the highest percentage of unemployed individuals, with 50.0% or 6 of them being unemployed.
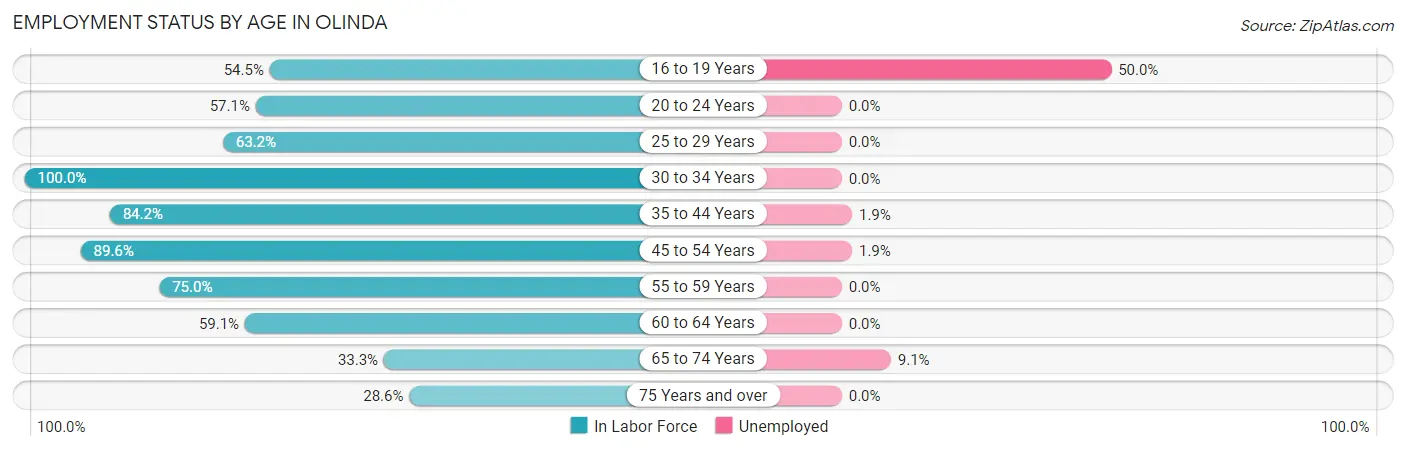
| Age Bracket | In Labor Force | Unemployed |
| 16 to 19 Years | 12 (54.5%) | 6 (50.0%) |
| 20 to 24 Years | 8 (57.1%) | 0 (0.0%) |
| 25 to 29 Years | 12 (63.2%) | 0 (0.0%) |
| 30 to 34 Years | 29 (100.0%) | 0 (0.0%) |
| 35 to 44 Years | 262 (84.2%) | 5 (1.9%) |
| 45 to 54 Years | 103 (89.6%) | 2 (1.9%) |
| 55 to 59 Years | 39 (75.0%) | 0 (0.0%) |
| 60 to 64 Years | 52 (59.1%) | 0 (0.0%) |
| 65 to 74 Years | 44 (33.3%) | 4 (9.1%) |
| 75 Years and over | 32 (28.6%) | 0 (0.0%) |
| Total | 593 (66.3%) | 17 (2.9%) |
Employment Status by Educational Attainment in Olinda
According to labor force statistics for Olinda, 80.9% of individuals (497) out of the total population between 25 and 64 years of age (614) are in the labor force, with 1.4% or 7 of them being unemployed. The group with the highest labor force participation rate are those with the educational attainment of less than high school, with 100.0% or 78 individuals in the labor force. Within the labor force, individuals with college / associate degree education have the highest percentage of unemployment, with 6.3% or 7 of them being unemployed.
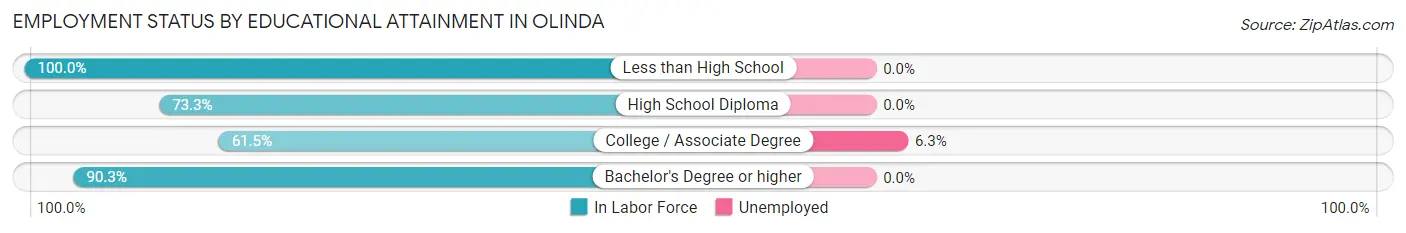
| Educational Attainment | In Labor Force | Unemployed |
| Less than High School | 78 (100.0%) | 0 (0.0%) |
| High School Diploma | 55 (73.3%) | 0 (0.0%) |
| College / Associate Degree | 112 (61.5%) | 11 (6.3%) |
| Bachelor's Degree or higher | 252 (90.3%) | 0 (0.0%) |
| Total | 497 (80.9%) | 9 (1.4%) |
Employment Occupations by Sex in Olinda
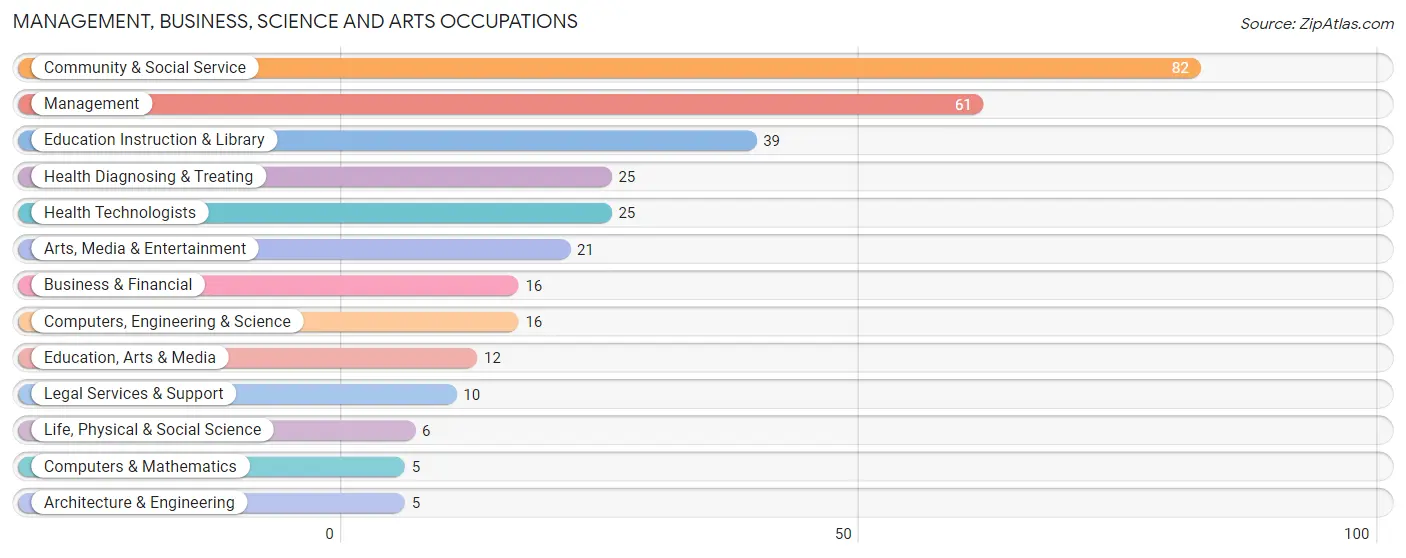
Management, Business, Science and Arts Occupations
The most common Management, Business, Science and Arts occupations in Olinda are Community & Social Service (82 | 14.3%), Management (61 | 10.6%), Education Instruction & Library (39 | 6.8%), Health Diagnosing & Treating (25 | 4.4%), and Health Technologists (25 | 4.4%).
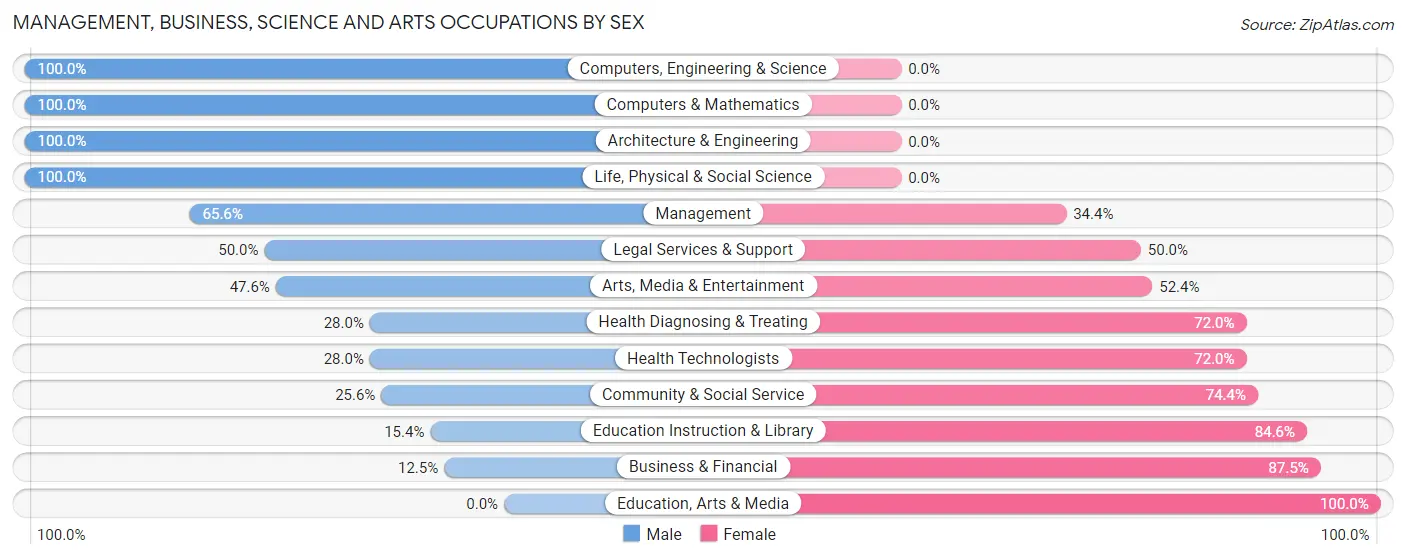
Management, Business, Science and Arts Occupations by Sex
Within the Management, Business, Science and Arts occupations in Olinda, the most male-oriented occupations are Computers, Engineering & Science (100.0%), Computers & Mathematics (100.0%), and Architecture & Engineering (100.0%), while the most female-oriented occupations are Education, Arts & Media (100.0%), Business & Financial (87.5%), and Education Instruction & Library (84.6%).
| Occupation | Male | Female |
| Management | 40 (65.6%) | 21 (34.4%) |
| Business & Financial | 2 (12.5%) | 14 (87.5%) |
| Computers, Engineering & Science | 16 (100.0%) | 0 (0.0%) |
| Computers & Mathematics | 5 (100.0%) | 0 (0.0%) |
| Architecture & Engineering | 5 (100.0%) | 0 (0.0%) |
| Life, Physical & Social Science | 6 (100.0%) | 0 (0.0%) |
| Community & Social Service | 21 (25.6%) | 61 (74.4%) |
| Education, Arts & Media | 0 (0.0%) | 12 (100.0%) |
| Legal Services & Support | 5 (50.0%) | 5 (50.0%) |
| Education Instruction & Library | 6 (15.4%) | 33 (84.6%) |
| Arts, Media & Entertainment | 10 (47.6%) | 11 (52.4%) |
| Health Diagnosing & Treating | 7 (28.0%) | 18 (72.0%) |
| Health Technologists | 7 (28.0%) | 18 (72.0%) |
| Total (Category) | 86 (43.0%) | 114 (57.0%) |
| Total (Overall) | 294 (51.3%) | 279 (48.7%) |
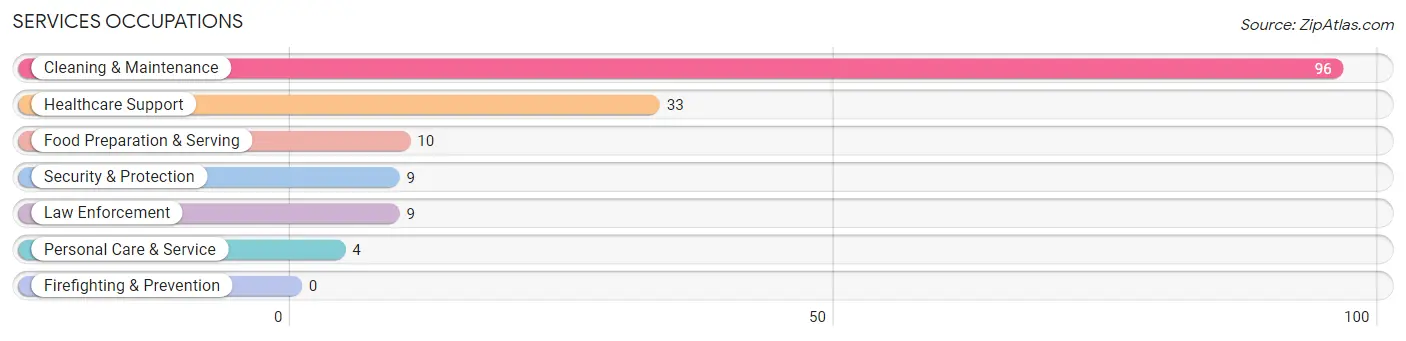
Services Occupations
The most common Services occupations in Olinda are Cleaning & Maintenance (96 | 16.8%), Healthcare Support (33 | 5.8%), Food Preparation & Serving (10 | 1.8%), Security & Protection (9 | 1.6%), and Law Enforcement (9 | 1.6%).
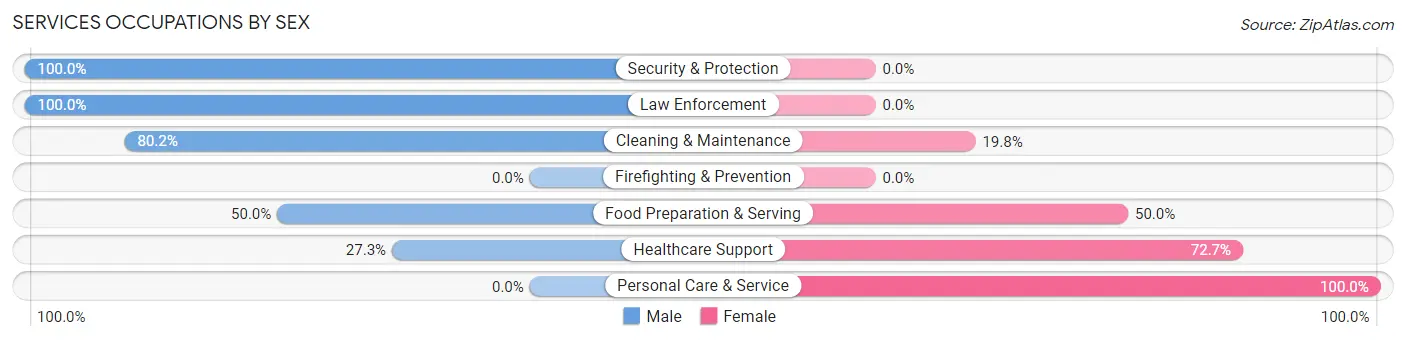
Services Occupations by Sex
Within the Services occupations in Olinda, the most male-oriented occupations are Security & Protection (100.0%), Law Enforcement (100.0%), and Cleaning & Maintenance (80.2%), while the most female-oriented occupations are Personal Care & Service (100.0%), Healthcare Support (72.7%), and Food Preparation & Serving (50.0%).
| Occupation | Male | Female |
| Healthcare Support | 9 (27.3%) | 24 (72.7%) |
| Security & Protection | 9 (100.0%) | 0 (0.0%) |
| Firefighting & Prevention | 0 (0.0%) | 0 (0.0%) |
| Law Enforcement | 9 (100.0%) | 0 (0.0%) |
| Food Preparation & Serving | 5 (50.0%) | 5 (50.0%) |
| Cleaning & Maintenance | 77 (80.2%) | 19 (19.8%) |
| Personal Care & Service | 0 (0.0%) | 4 (100.0%) |
| Total (Category) | 100 (65.8%) | 52 (34.2%) |
| Total (Overall) | 294 (51.3%) | 279 (48.7%) |
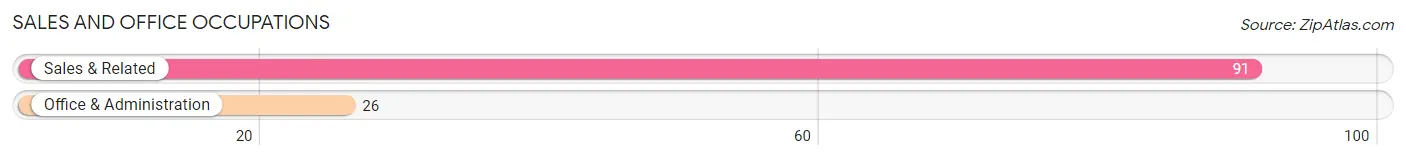
Sales and Office Occupations
The most common Sales and Office occupations in Olinda are Sales & Related (91 | 15.9%), and Office & Administration (26 | 4.5%).
Sales and Office Occupations by Sex
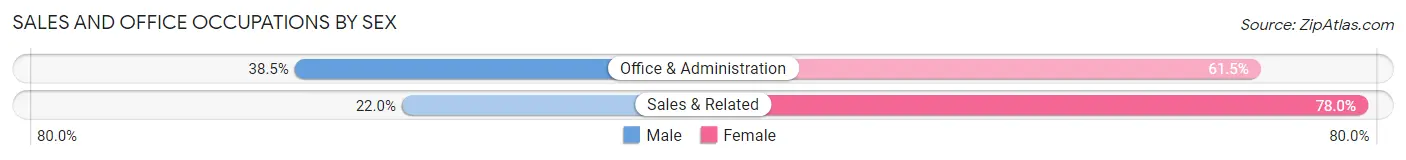
| Occupation | Male | Female |
| Sales & Related | 20 (22.0%) | 71 (78.0%) |
| Office & Administration | 10 (38.5%) | 16 (61.5%) |
| Total (Category) | 30 (25.6%) | 87 (74.4%) |
| Total (Overall) | 294 (51.3%) | 279 (48.7%) |
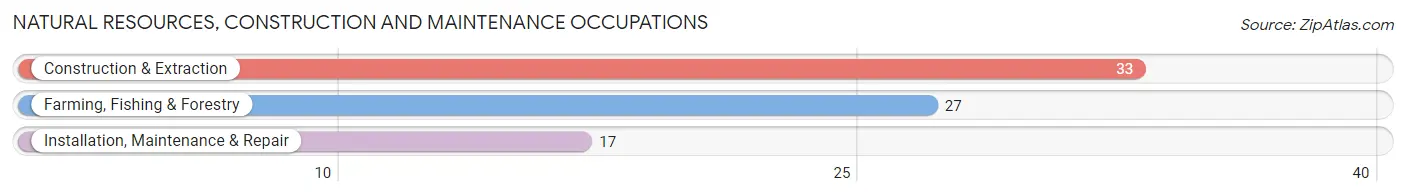
Natural Resources, Construction and Maintenance Occupations
The most common Natural Resources, Construction and Maintenance occupations in Olinda are Construction & Extraction (33 | 5.8%), Farming, Fishing & Forestry (27 | 4.7%), and Installation, Maintenance & Repair (17 | 3.0%).
Natural Resources, Construction and Maintenance Occupations by Sex
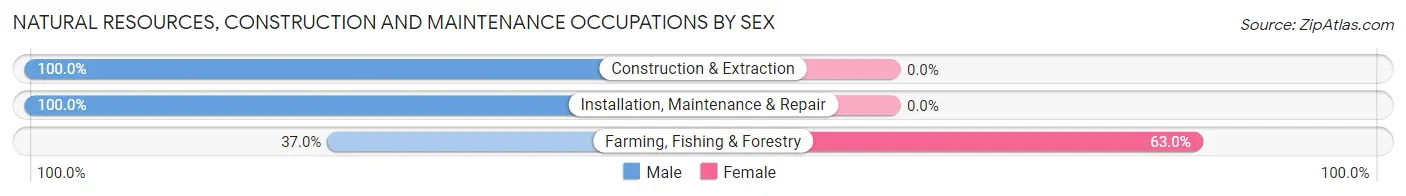
| Occupation | Male | Female |
| Farming, Fishing & Forestry | 10 (37.0%) | 17 (63.0%) |
| Construction & Extraction | 33 (100.0%) | 0 (0.0%) |
| Installation, Maintenance & Repair | 17 (100.0%) | 0 (0.0%) |
| Total (Category) | 60 (77.9%) | 17 (22.1%) |
| Total (Overall) | 294 (51.3%) | 279 (48.7%) |
Production, Transportation and Moving Occupations
The most common Production, Transportation and Moving occupations in Olinda are Transportation (23 | 4.0%), and Production (4 | 0.7%).
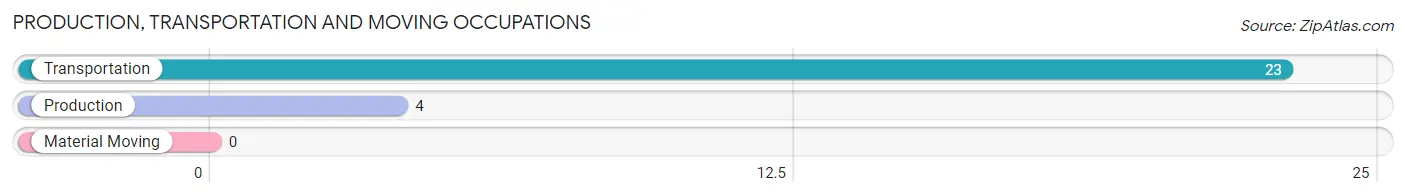
Production, Transportation and Moving Occupations by Sex
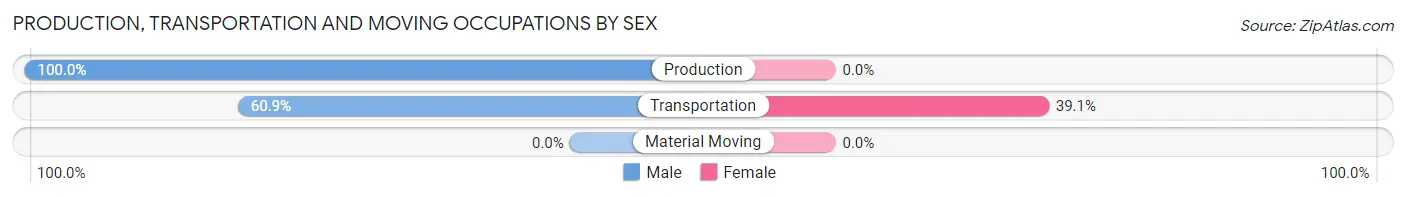
| Occupation | Male | Female |
| Production | 4 (100.0%) | 0 (0.0%) |
| Transportation | 14 (60.9%) | 9 (39.1%) |
| Material Moving | 0 (0.0%) | 0 (0.0%) |
| Total (Category) | 18 (66.7%) | 9 (33.3%) |
| Total (Overall) | 294 (51.3%) | 279 (48.7%) |
Employment Industries by Sex in Olinda
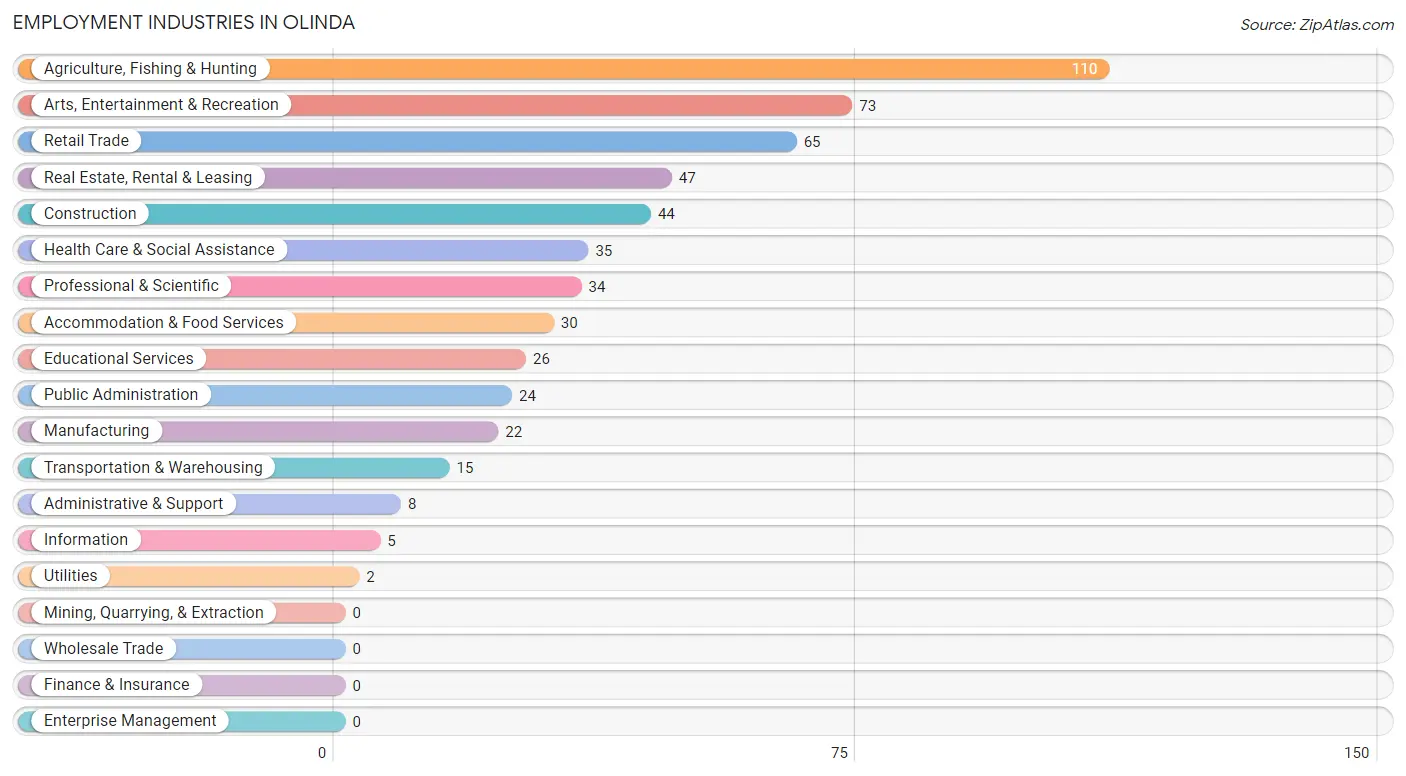
Employment Industries in Olinda
The major employment industries in Olinda include Agriculture, Fishing & Hunting (110 | 19.2%), Arts, Entertainment & Recreation (73 | 12.7%), Retail Trade (65 | 11.3%), Real Estate, Rental & Leasing (47 | 8.2%), and Construction (44 | 7.7%).
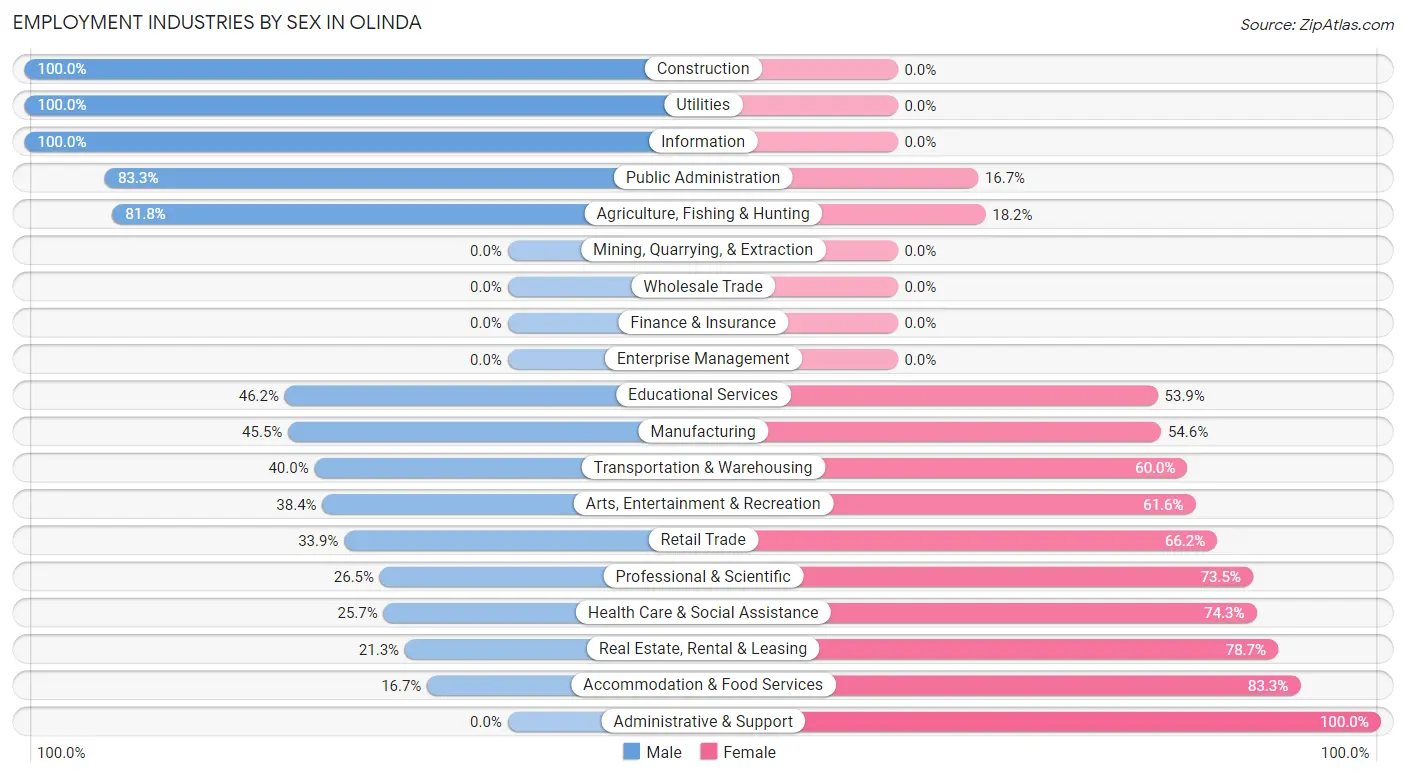
Employment Industries by Sex in Olinda
The Olinda industries that see more men than women are Construction (100.0%), Utilities (100.0%), and Information (100.0%), whereas the industries that tend to have a higher number of women are Administrative & Support (100.0%), Accommodation & Food Services (83.3%), and Real Estate, Rental & Leasing (78.7%).
| Industry | Male | Female |
| Agriculture, Fishing & Hunting | 90 (81.8%) | 20 (18.2%) |
| Mining, Quarrying, & Extraction | 0 (0.0%) | 0 (0.0%) |
| Construction | 44 (100.0%) | 0 (0.0%) |
| Manufacturing | 10 (45.5%) | 12 (54.5%) |
| Wholesale Trade | 0 (0.0%) | 0 (0.0%) |
| Retail Trade | 22 (33.9%) | 43 (66.1%) |
| Transportation & Warehousing | 6 (40.0%) | 9 (60.0%) |
| Utilities | 2 (100.0%) | 0 (0.0%) |
| Information | 5 (100.0%) | 0 (0.0%) |
| Finance & Insurance | 0 (0.0%) | 0 (0.0%) |
| Real Estate, Rental & Leasing | 10 (21.3%) | 37 (78.7%) |
| Professional & Scientific | 9 (26.5%) | 25 (73.5%) |
| Enterprise Management | 0 (0.0%) | 0 (0.0%) |
| Administrative & Support | 0 (0.0%) | 8 (100.0%) |
| Educational Services | 12 (46.2%) | 14 (53.8%) |
| Health Care & Social Assistance | 9 (25.7%) | 26 (74.3%) |
| Arts, Entertainment & Recreation | 28 (38.4%) | 45 (61.6%) |
| Accommodation & Food Services | 5 (16.7%) | 25 (83.3%) |
| Public Administration | 20 (83.3%) | 4 (16.7%) |
| Total | 294 (51.3%) | 279 (48.7%) |
Education in Olinda
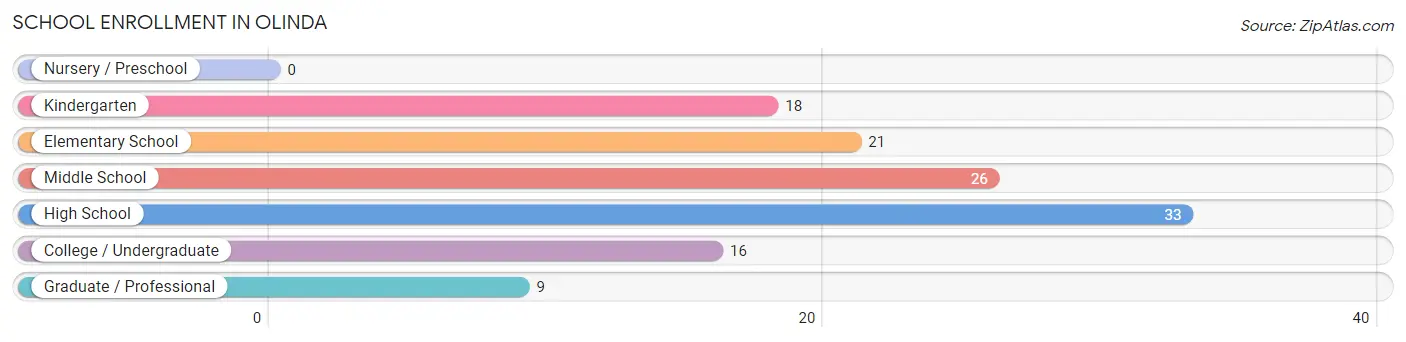
School Enrollment in Olinda
The most common levels of schooling among the 123 students in Olinda are high school (33 | 26.8%), middle school (26 | 21.1%), and elementary school (21 | 17.1%).
| School Level | # Students | % Students |
| Nursery / Preschool | 0 | 0.0% |
| Kindergarten | 18 | 14.6% |
| Elementary School | 21 | 17.1% |
| Middle School | 26 | 21.1% |
| High School | 33 | 26.8% |
| College / Undergraduate | 16 | 13.0% |
| Graduate / Professional | 9 | 7.3% |
| Total | 123 | 100.0% |
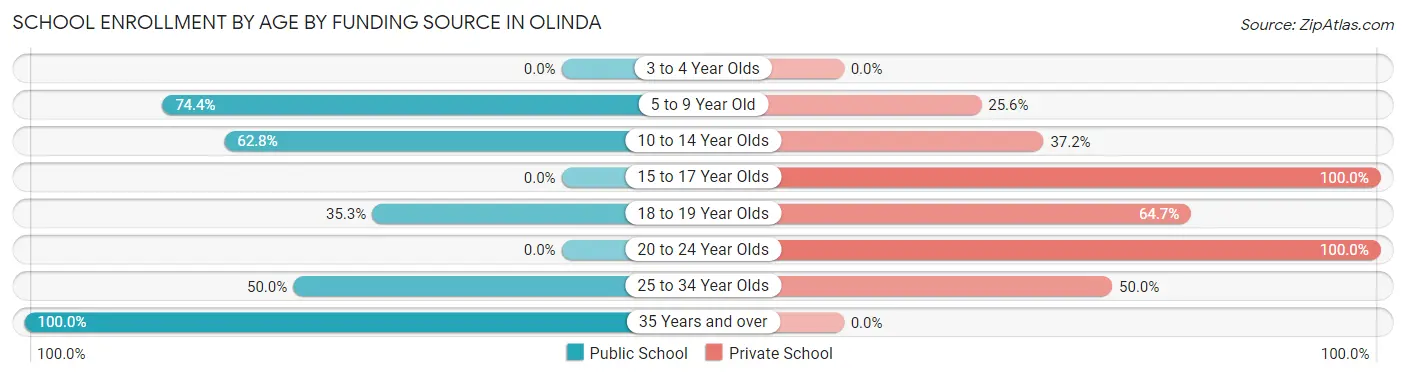
School Enrollment by Age by Funding Source in Olinda
Out of a total of 123 students who are enrolled in schools in Olinda, 52 (42.3%) attend a private institution, while the remaining 71 (57.7%) are enrolled in public schools. The age group of 15 to 17 year olds has the highest likelihood of being enrolled in private schools, with 5 (100.0% in the age bracket) enrolled. Conversely, the age group of 35 years and over has the lowest likelihood of being enrolled in a private school, with 5 (100.0% in the age bracket) attending a public institution.
| Age Bracket | Public School | Private School |
| 3 to 4 Year Olds | 0 (0.0%) | 0 (0.0%) |
| 5 to 9 Year Old | 29 (74.4%) | 10 (25.6%) |
| 10 to 14 Year Olds | 27 (62.8%) | 16 (37.2%) |
| 15 to 17 Year Olds | 0 (0.0%) | 5 (100.0%) |
| 18 to 19 Year Olds | 6 (35.3%) | 11 (64.7%) |
| 20 to 24 Year Olds | 0 (0.0%) | 6 (100.0%) |
| 25 to 34 Year Olds | 4 (50.0%) | 4 (50.0%) |
| 35 Years and over | 5 (100.0%) | 0 (0.0%) |
| Total | 71 (57.7%) | 52 (42.3%) |
Educational Attainment by Field of Study in Olinda
Visual & performing arts (79 | 17.9%), literature & languages (62 | 14.1%), psychology (56 | 12.7%), social sciences (42 | 9.6%), and business (37 | 8.4%) are the most common fields of study among 440 individuals in Olinda who have obtained a bachelor's degree or higher.
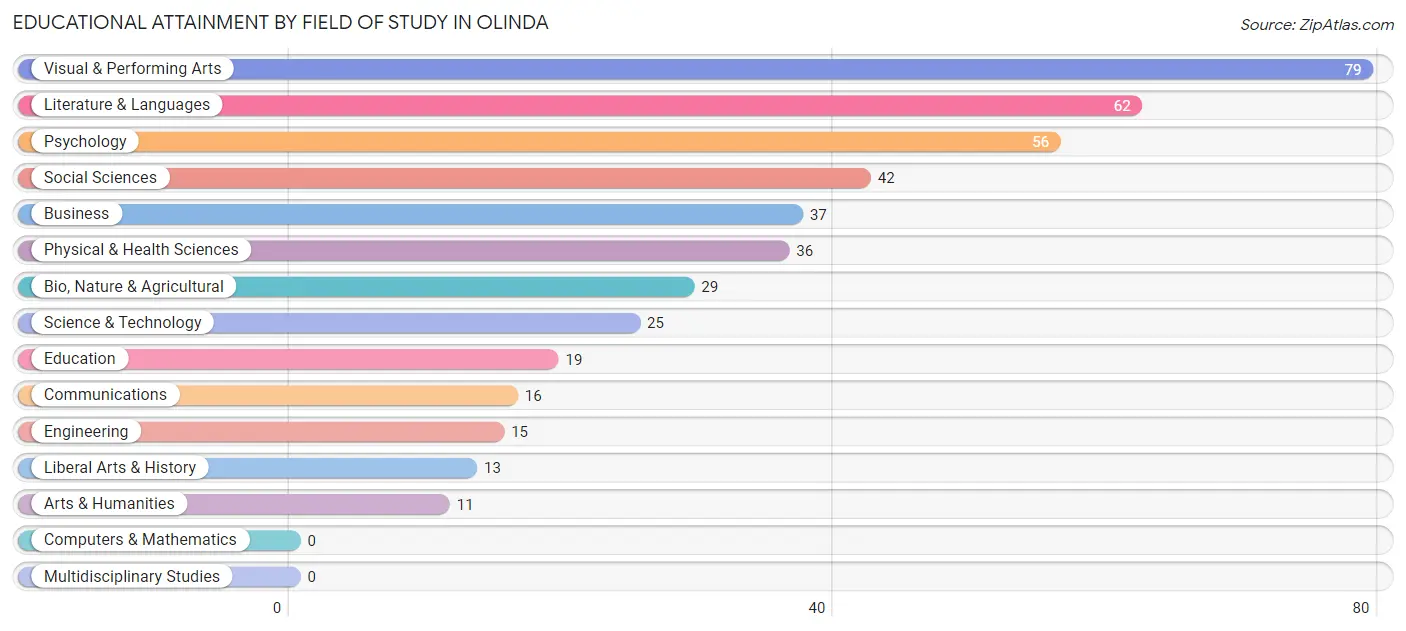
| Field of Study | # Graduates | % Graduates |
| Computers & Mathematics | 0 | 0.0% |
| Bio, Nature & Agricultural | 29 | 6.6% |
| Physical & Health Sciences | 36 | 8.2% |
| Psychology | 56 | 12.7% |
| Social Sciences | 42 | 9.6% |
| Engineering | 15 | 3.4% |
| Multidisciplinary Studies | 0 | 0.0% |
| Science & Technology | 25 | 5.7% |
| Business | 37 | 8.4% |
| Education | 19 | 4.3% |
| Literature & Languages | 62 | 14.1% |
| Liberal Arts & History | 13 | 2.9% |
| Visual & Performing Arts | 79 | 17.9% |
| Communications | 16 | 3.6% |
| Arts & Humanities | 11 | 2.5% |
| Total | 440 | 100.0% |
Transportation & Commute in Olinda
Vehicle Availability by Sex in Olinda
The most prevalent vehicle ownership categories in Olinda are males with 2 vehicles (146, accounting for 49.2%) and females with 2 vehicles (101, making up 52.3%).
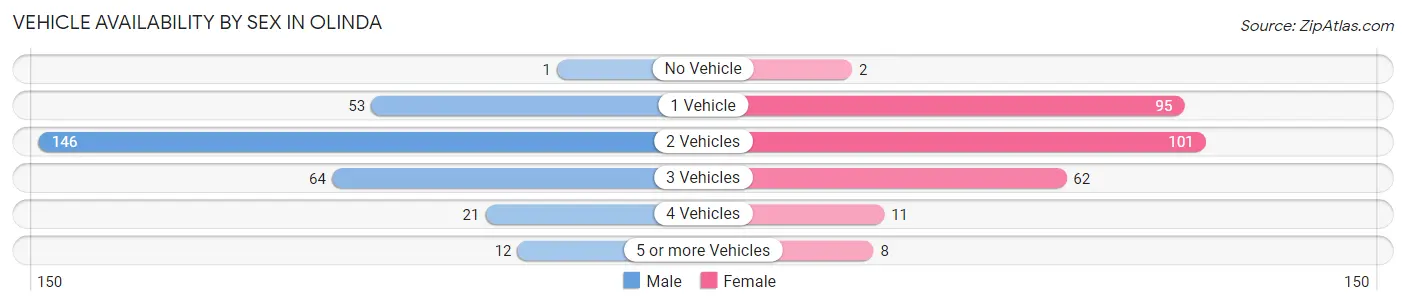
| Vehicles Available | Male | Female |
| No Vehicle | 1 (0.3%) | 2 (0.7%) |
| 1 Vehicle | 53 (17.8%) | 95 (34.1%) |
| 2 Vehicles | 146 (49.2%) | 101 (36.2%) |
| 3 Vehicles | 64 (21.5%) | 62 (22.2%) |
| 4 Vehicles | 21 (7.1%) | 11 (3.9%) |
| 5 or more Vehicles | 12 (4.0%) | 8 (2.9%) |
| Total | 297 (100.0%) | 279 (100.0%) |
Commute Time in Olinda
The most frequently occuring commute durations in Olinda are 15 to 19 minutes (100 commuters, 23.0%), 10 to 14 minutes (53 commuters, 12.2%), and 30 to 34 minutes (52 commuters, 12.0%).
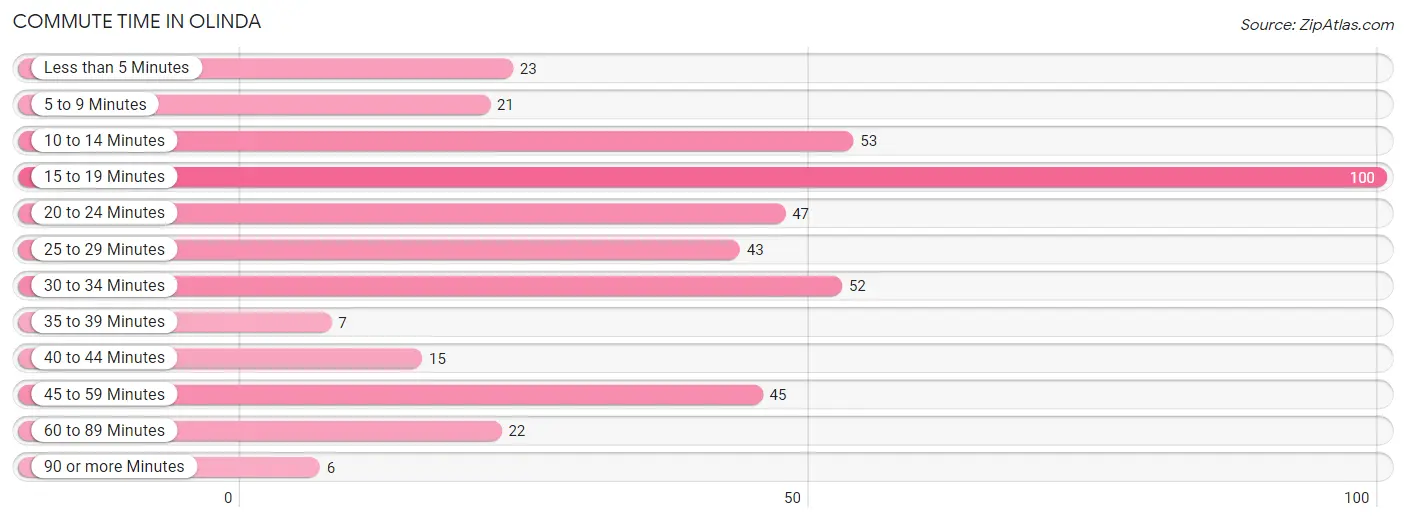
| Commute Time | # Commuters | % Commuters |
| Less than 5 Minutes | 23 | 5.3% |
| 5 to 9 Minutes | 21 | 4.8% |
| 10 to 14 Minutes | 53 | 12.2% |
| 15 to 19 Minutes | 100 | 23.0% |
| 20 to 24 Minutes | 47 | 10.8% |
| 25 to 29 Minutes | 43 | 9.9% |
| 30 to 34 Minutes | 52 | 12.0% |
| 35 to 39 Minutes | 7 | 1.6% |
| 40 to 44 Minutes | 15 | 3.5% |
| 45 to 59 Minutes | 45 | 10.4% |
| 60 to 89 Minutes | 22 | 5.1% |
| 90 or more Minutes | 6 | 1.4% |
Commute Time by Sex in Olinda
The most common commute times in Olinda are 15 to 19 minutes (93 commuters, 38.6%) for males and 25 to 29 minutes (43 commuters, 22.3%) for females.
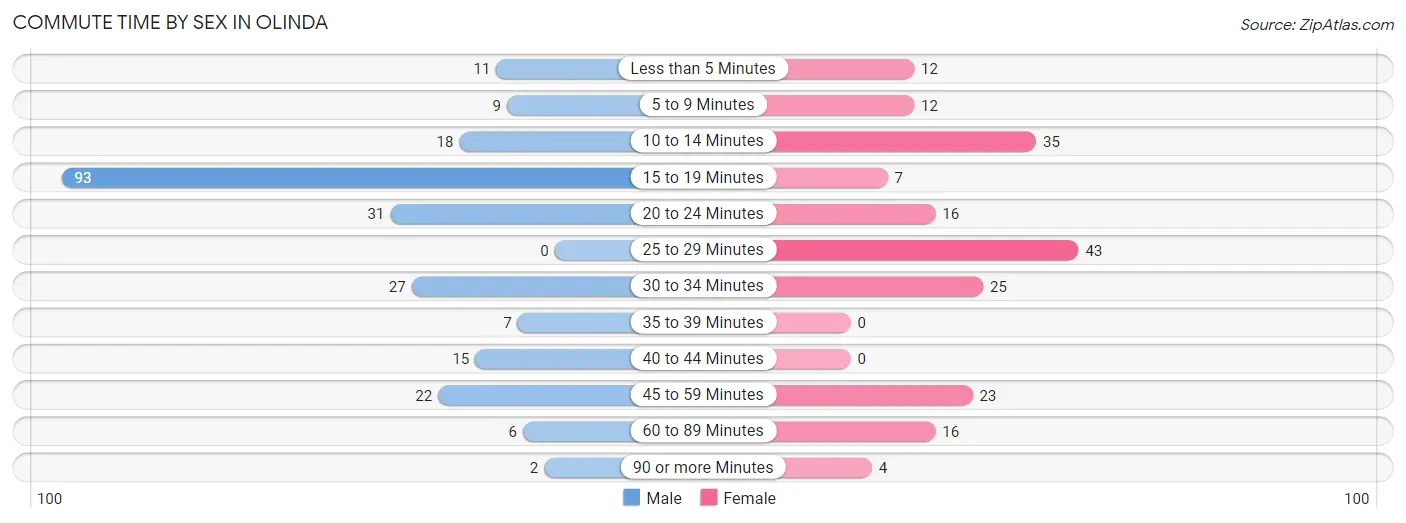
| Commute Time | Male | Female |
| Less than 5 Minutes | 11 (4.6%) | 12 (6.2%) |
| 5 to 9 Minutes | 9 (3.7%) | 12 (6.2%) |
| 10 to 14 Minutes | 18 (7.5%) | 35 (18.1%) |
| 15 to 19 Minutes | 93 (38.6%) | 7 (3.6%) |
| 20 to 24 Minutes | 31 (12.9%) | 16 (8.3%) |
| 25 to 29 Minutes | 0 (0.0%) | 43 (22.3%) |
| 30 to 34 Minutes | 27 (11.2%) | 25 (13.0%) |
| 35 to 39 Minutes | 7 (2.9%) | 0 (0.0%) |
| 40 to 44 Minutes | 15 (6.2%) | 0 (0.0%) |
| 45 to 59 Minutes | 22 (9.1%) | 23 (11.9%) |
| 60 to 89 Minutes | 6 (2.5%) | 16 (8.3%) |
| 90 or more Minutes | 2 (0.8%) | 4 (2.1%) |
Time of Departure to Work by Sex in Olinda
The most frequent times of departure to work in Olinda are 7:30 AM to 7:59 AM (85, 35.3%) for males and 9:00 AM to 9:59 AM (63, 32.6%) for females.
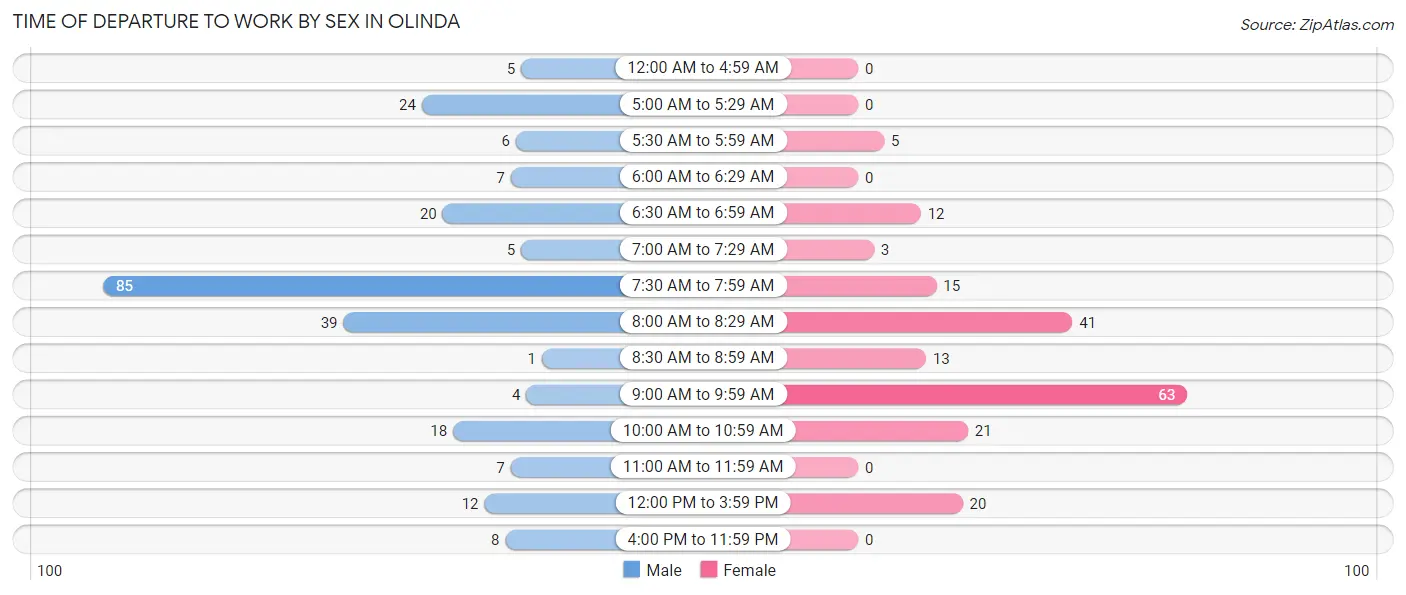
| Time of Departure | Male | Female |
| 12:00 AM to 4:59 AM | 5 (2.1%) | 0 (0.0%) |
| 5:00 AM to 5:29 AM | 24 (10.0%) | 0 (0.0%) |
| 5:30 AM to 5:59 AM | 6 (2.5%) | 5 (2.6%) |
| 6:00 AM to 6:29 AM | 7 (2.9%) | 0 (0.0%) |
| 6:30 AM to 6:59 AM | 20 (8.3%) | 12 (6.2%) |
| 7:00 AM to 7:29 AM | 5 (2.1%) | 3 (1.5%) |
| 7:30 AM to 7:59 AM | 85 (35.3%) | 15 (7.8%) |
| 8:00 AM to 8:29 AM | 39 (16.2%) | 41 (21.2%) |
| 8:30 AM to 8:59 AM | 1 (0.4%) | 13 (6.7%) |
| 9:00 AM to 9:59 AM | 4 (1.7%) | 63 (32.6%) |
| 10:00 AM to 10:59 AM | 18 (7.5%) | 21 (10.9%) |
| 11:00 AM to 11:59 AM | 7 (2.9%) | 0 (0.0%) |
| 12:00 PM to 3:59 PM | 12 (5.0%) | 20 (10.4%) |
| 4:00 PM to 11:59 PM | 8 (3.3%) | 0 (0.0%) |
| Total | 241 (100.0%) | 193 (100.0%) |
Housing Occupancy in Olinda
Occupancy by Ownership in Olinda
Of the total 415 dwellings in Olinda, owner-occupied units account for 278 (67.0%), while renter-occupied units make up 137 (33.0%).
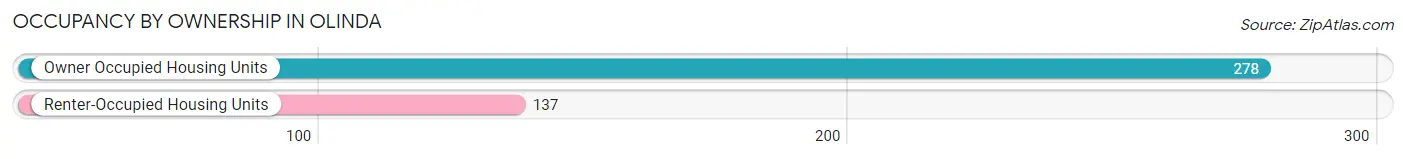
| Occupancy | # Housing Units | % Housing Units |
| Owner Occupied Housing Units | 278 | 67.0% |
| Renter-Occupied Housing Units | 137 | 33.0% |
| Total Occupied Housing Units | 415 | 100.0% |
Occupancy by Household Size in Olinda
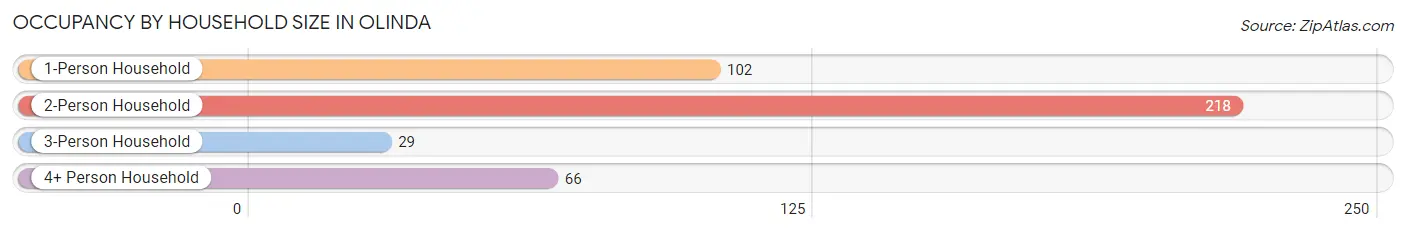
| Household Size | # Housing Units | % Housing Units |
| 1-Person Household | 102 | 24.6% |
| 2-Person Household | 218 | 52.5% |
| 3-Person Household | 29 | 7.0% |
| 4+ Person Household | 66 | 15.9% |
| Total Housing Units | 415 | 100.0% |
Occupancy by Ownership by Household Size in Olinda
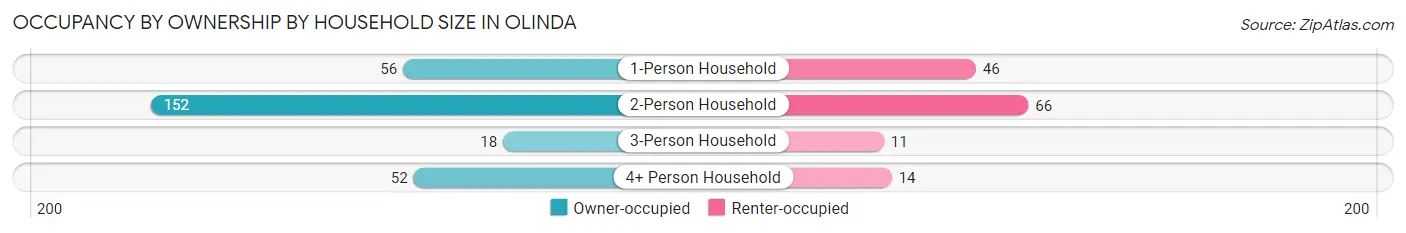
| Household Size | Owner-occupied | Renter-occupied |
| 1-Person Household | 56 (54.9%) | 46 (45.1%) |
| 2-Person Household | 152 (69.7%) | 66 (30.3%) |
| 3-Person Household | 18 (62.1%) | 11 (37.9%) |
| 4+ Person Household | 52 (78.8%) | 14 (21.2%) |
| Total Housing Units | 278 (67.0%) | 137 (33.0%) |
Occupancy by Educational Attainment in Olinda
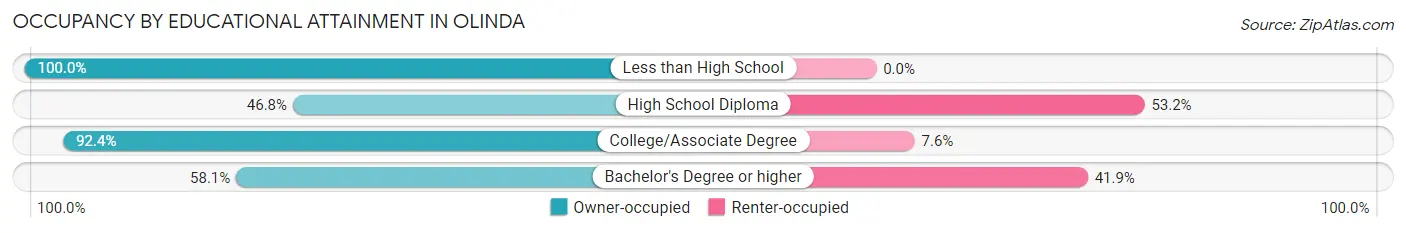
| Household Size | Owner-occupied | Renter-occupied |
| Less than High School | 15 (100.0%) | 0 (0.0%) |
| High School Diploma | 22 (46.8%) | 25 (53.2%) |
| College/Associate Degree | 97 (92.4%) | 8 (7.6%) |
| Bachelor's Degree or higher | 144 (58.1%) | 104 (41.9%) |
Occupancy by Age of Householder in Olinda
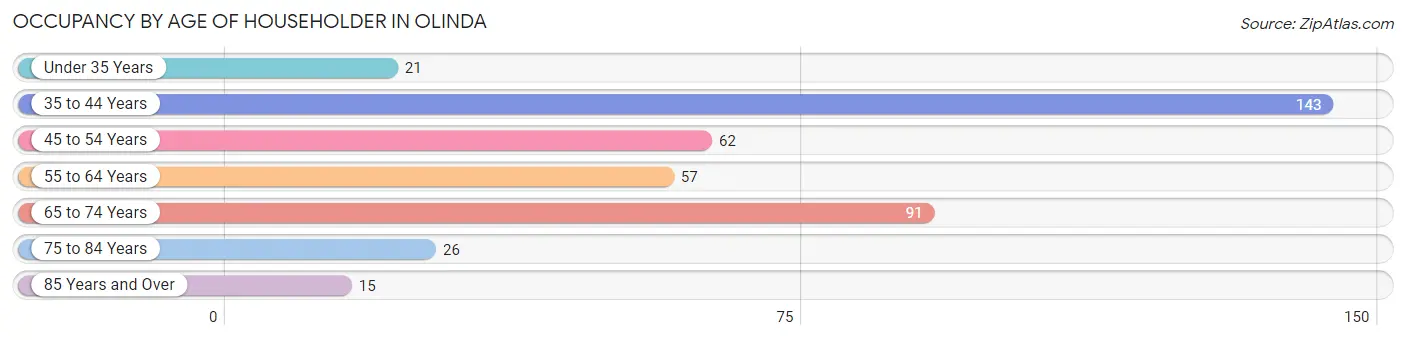
| Age Bracket | # Households | % Households |
| Under 35 Years | 21 | 5.1% |
| 35 to 44 Years | 143 | 34.5% |
| 45 to 54 Years | 62 | 14.9% |
| 55 to 64 Years | 57 | 13.7% |
| 65 to 74 Years | 91 | 21.9% |
| 75 to 84 Years | 26 | 6.3% |
| 85 Years and Over | 15 | 3.6% |
| Total | 415 | 100.0% |
Housing Finances in Olinda
Median Income by Occupancy in Olinda
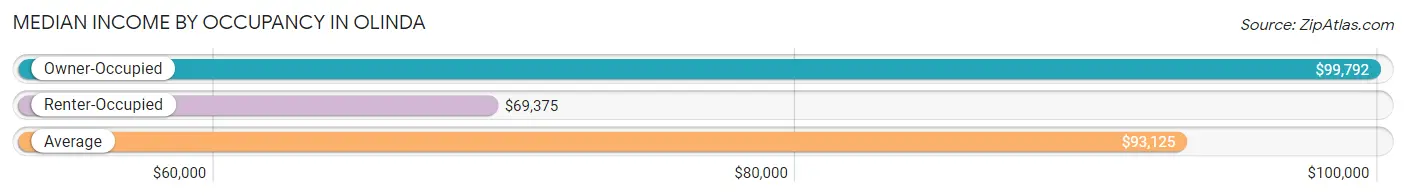
| Occupancy Type | # Households | Median Income |
| Owner-Occupied | 278 (67.0%) | $99,792 |
| Renter-Occupied | 137 (33.0%) | $69,375 |
| Average | 415 (100.0%) | $93,125 |
Occupancy by Householder Income Bracket in Olinda
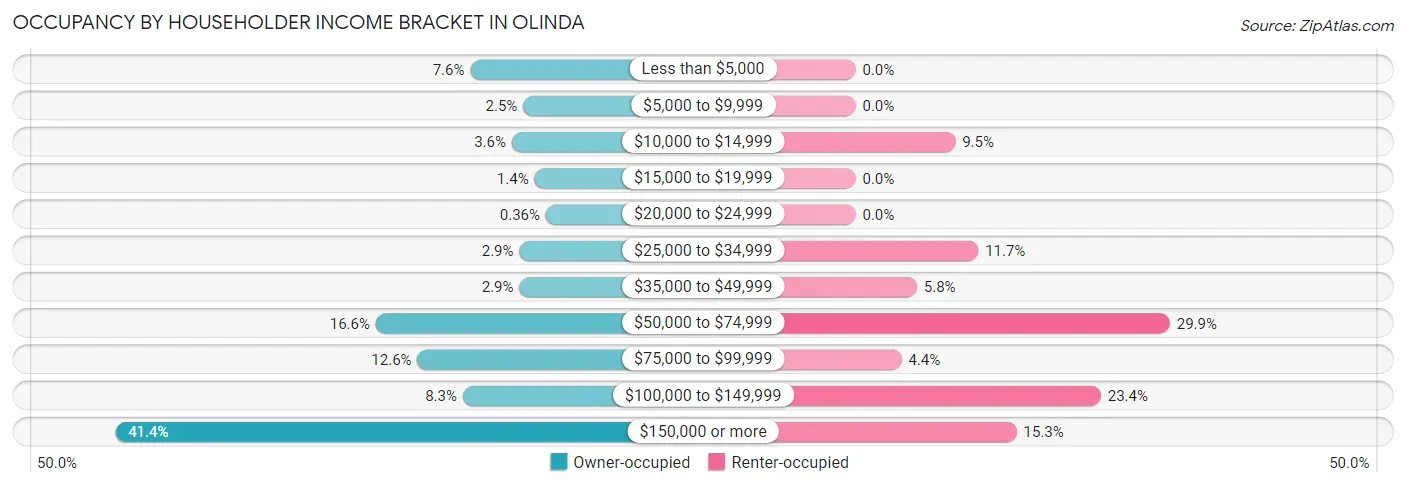
| Income Bracket | Owner-occupied | Renter-occupied |
| Less than $5,000 | 21 (7.5%) | 0 (0.0%) |
| $5,000 to $9,999 | 7 (2.5%) | 0 (0.0%) |
| $10,000 to $14,999 | 10 (3.6%) | 13 (9.5%) |
| $15,000 to $19,999 | 4 (1.4%) | 0 (0.0%) |
| $20,000 to $24,999 | 1 (0.4%) | 0 (0.0%) |
| $25,000 to $34,999 | 8 (2.9%) | 16 (11.7%) |
| $35,000 to $49,999 | 8 (2.9%) | 8 (5.8%) |
| $50,000 to $74,999 | 46 (16.6%) | 41 (29.9%) |
| $75,000 to $99,999 | 35 (12.6%) | 6 (4.4%) |
| $100,000 to $149,999 | 23 (8.3%) | 32 (23.4%) |
| $150,000 or more | 115 (41.4%) | 21 (15.3%) |
| Total | 278 (100.0%) | 137 (100.0%) |
Monthly Housing Cost Tiers in Olinda
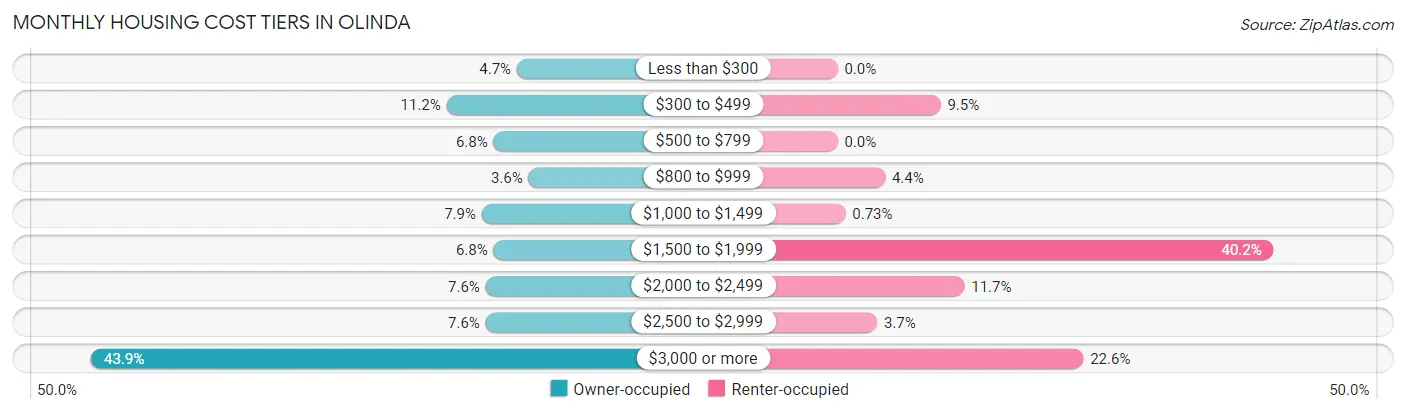
| Monthly Cost | Owner-occupied | Renter-occupied |
| Less than $300 | 13 (4.7%) | 0 (0.0%) |
| $300 to $499 | 31 (11.2%) | 13 (9.5%) |
| $500 to $799 | 19 (6.8%) | 0 (0.0%) |
| $800 to $999 | 10 (3.6%) | 6 (4.4%) |
| $1,000 to $1,499 | 22 (7.9%) | 1 (0.7%) |
| $1,500 to $1,999 | 19 (6.8%) | 55 (40.2%) |
| $2,000 to $2,499 | 21 (7.5%) | 16 (11.7%) |
| $2,500 to $2,999 | 21 (7.5%) | 5 (3.6%) |
| $3,000 or more | 122 (43.9%) | 31 (22.6%) |
| Total | 278 (100.0%) | 137 (100.0%) |
Physical Housing Characteristics in Olinda
Housing Structures in Olinda
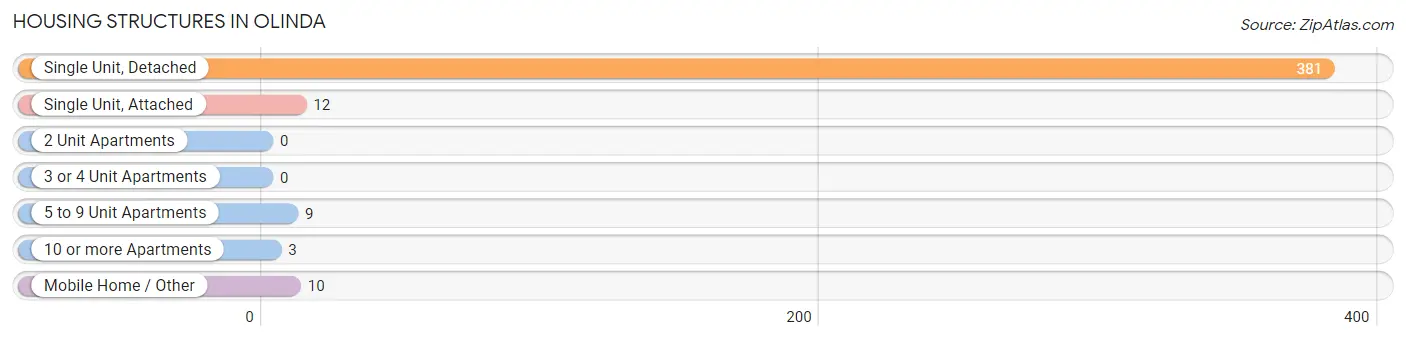
| Structure Type | # Housing Units | % Housing Units |
| Single Unit, Detached | 381 | 91.8% |
| Single Unit, Attached | 12 | 2.9% |
| 2 Unit Apartments | 0 | 0.0% |
| 3 or 4 Unit Apartments | 0 | 0.0% |
| 5 to 9 Unit Apartments | 9 | 2.2% |
| 10 or more Apartments | 3 | 0.7% |
| Mobile Home / Other | 10 | 2.4% |
| Total | 415 | 100.0% |
Housing Structures by Occupancy in Olinda
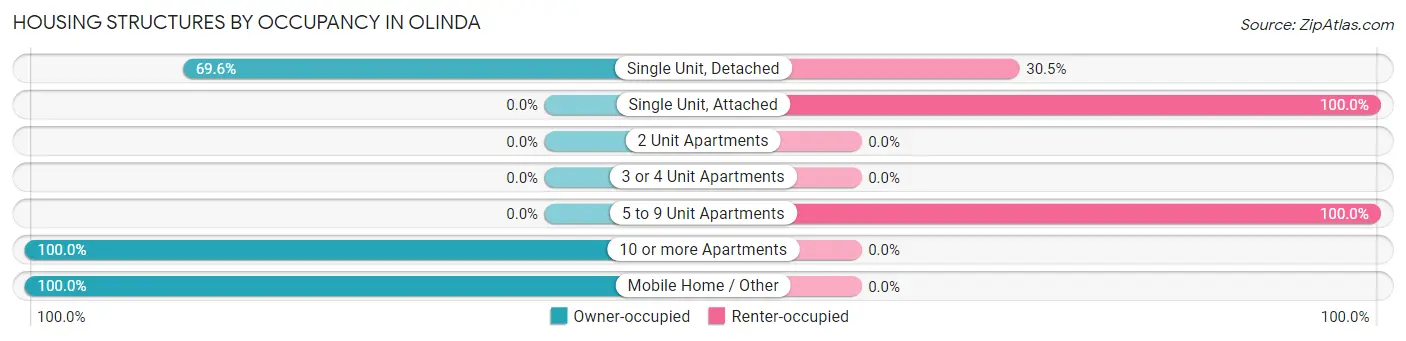
| Structure Type | Owner-occupied | Renter-occupied |
| Single Unit, Detached | 265 (69.6%) | 116 (30.4%) |
| Single Unit, Attached | 0 (0.0%) | 12 (100.0%) |
| 2 Unit Apartments | 0 (0.0%) | 0 (0.0%) |
| 3 or 4 Unit Apartments | 0 (0.0%) | 0 (0.0%) |
| 5 to 9 Unit Apartments | 0 (0.0%) | 9 (100.0%) |
| 10 or more Apartments | 3 (100.0%) | 0 (0.0%) |
| Mobile Home / Other | 10 (100.0%) | 0 (0.0%) |
| Total | 278 (67.0%) | 137 (33.0%) |
Housing Structures by Number of Rooms in Olinda
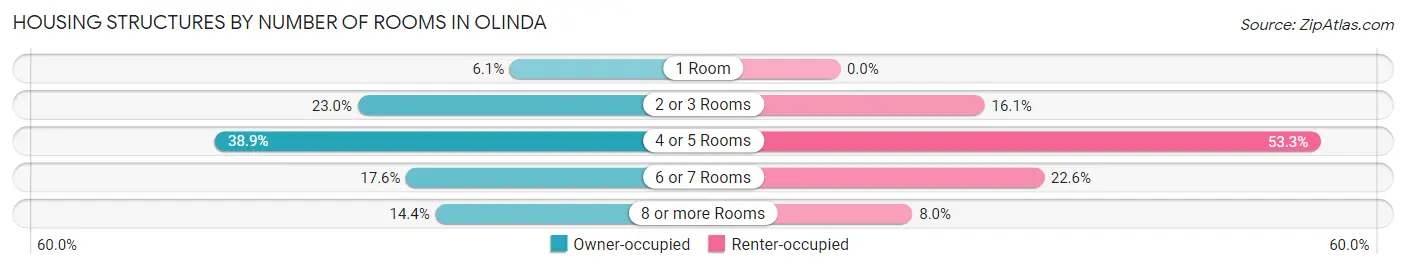
| Number of Rooms | Owner-occupied | Renter-occupied |
| 1 Room | 17 (6.1%) | 0 (0.0%) |
| 2 or 3 Rooms | 64 (23.0%) | 22 (16.1%) |
| 4 or 5 Rooms | 108 (38.9%) | 73 (53.3%) |
| 6 or 7 Rooms | 49 (17.6%) | 31 (22.6%) |
| 8 or more Rooms | 40 (14.4%) | 11 (8.0%) |
| Total | 278 (100.0%) | 137 (100.0%) |
Housing Structure by Heating Type in Olinda
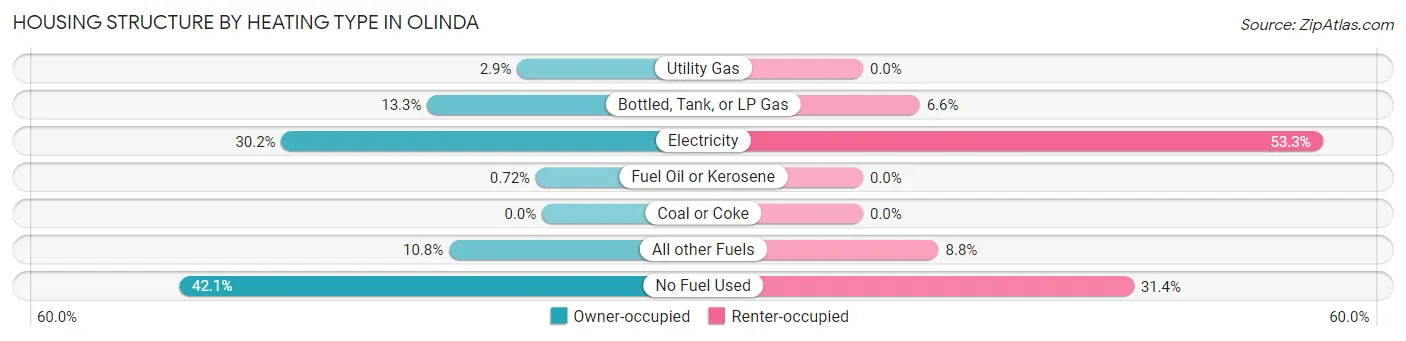
| Heating Type | Owner-occupied | Renter-occupied |
| Utility Gas | 8 (2.9%) | 0 (0.0%) |
| Bottled, Tank, or LP Gas | 37 (13.3%) | 9 (6.6%) |
| Electricity | 84 (30.2%) | 73 (53.3%) |
| Fuel Oil or Kerosene | 2 (0.7%) | 0 (0.0%) |
| Coal or Coke | 0 (0.0%) | 0 (0.0%) |
| All other Fuels | 30 (10.8%) | 12 (8.8%) |
| No Fuel Used | 117 (42.1%) | 43 (31.4%) |
| Total | 278 (100.0%) | 137 (100.0%) |
Household Vehicle Usage in Olinda
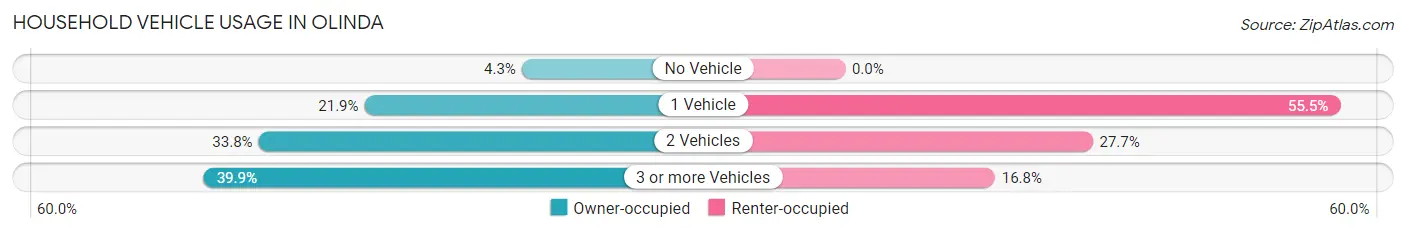
| Vehicles per Household | Owner-occupied | Renter-occupied |
| No Vehicle | 12 (4.3%) | 0 (0.0%) |
| 1 Vehicle | 61 (21.9%) | 76 (55.5%) |
| 2 Vehicles | 94 (33.8%) | 38 (27.7%) |
| 3 or more Vehicles | 111 (39.9%) | 23 (16.8%) |
| Total | 278 (100.0%) | 137 (100.0%) |
Real Estate & Mortgages in Olinda
Real Estate and Mortgage Overview in Olinda
| Characteristic | Without Mortgage | With Mortgage |
| Housing Units | 91 | 187 |
| Median Property Value | $1,102,800 | $1,062,500 |
| Median Household Income | $81,705 | $93 |
| Monthly Housing Costs | $519 | $122 |
| Real Estate Taxes | $1,570 | $0 |
Property Value by Mortgage Status in Olinda
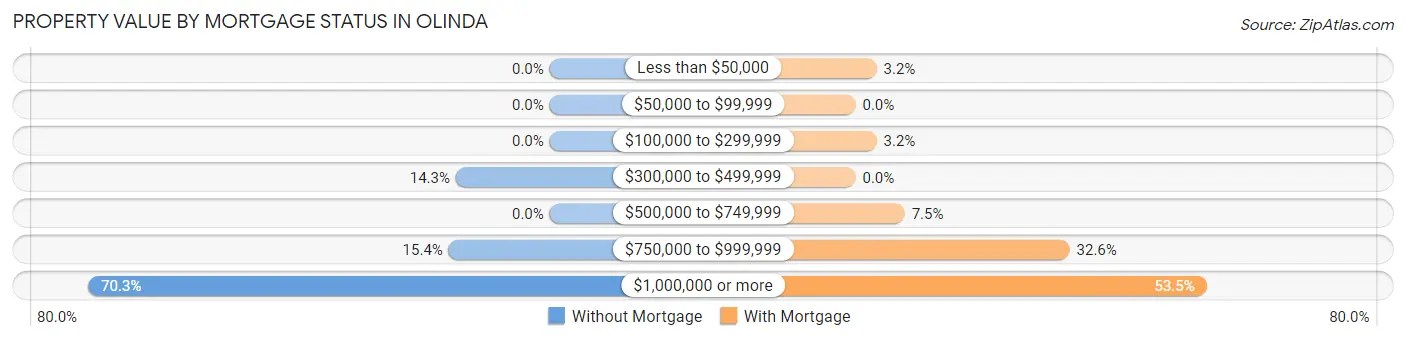
| Property Value | Without Mortgage | With Mortgage |
| Less than $50,000 | 0 (0.0%) | 6 (3.2%) |
| $50,000 to $99,999 | 0 (0.0%) | 0 (0.0%) |
| $100,000 to $299,999 | 0 (0.0%) | 6 (3.2%) |
| $300,000 to $499,999 | 13 (14.3%) | 0 (0.0%) |
| $500,000 to $749,999 | 0 (0.0%) | 14 (7.5%) |
| $750,000 to $999,999 | 14 (15.4%) | 61 (32.6%) |
| $1,000,000 or more | 64 (70.3%) | 100 (53.5%) |
| Total | 91 (100.0%) | 187 (100.0%) |
Household Income by Mortgage Status in Olinda
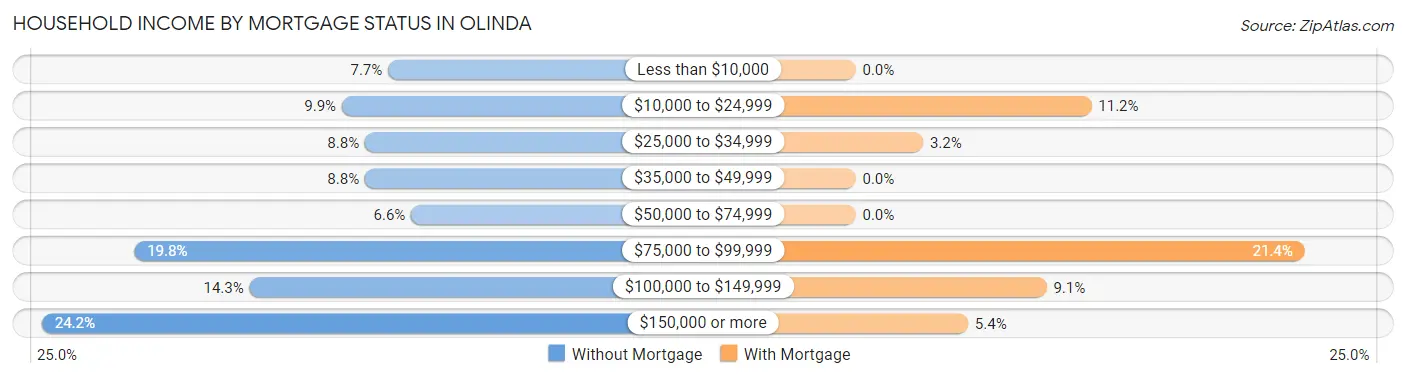
| Household Income | Without Mortgage | With Mortgage |
| Less than $10,000 | 7 (7.7%) | 0 (0.0%) |
| $10,000 to $24,999 | 9 (9.9%) | 21 (11.2%) |
| $25,000 to $34,999 | 8 (8.8%) | 6 (3.2%) |
| $35,000 to $49,999 | 8 (8.8%) | 0 (0.0%) |
| $50,000 to $74,999 | 6 (6.6%) | 0 (0.0%) |
| $75,000 to $99,999 | 18 (19.8%) | 40 (21.4%) |
| $100,000 to $149,999 | 13 (14.3%) | 17 (9.1%) |
| $150,000 or more | 22 (24.2%) | 10 (5.3%) |
| Total | 91 (100.0%) | 187 (100.0%) |
Property Value to Household Income Ratio in Olinda
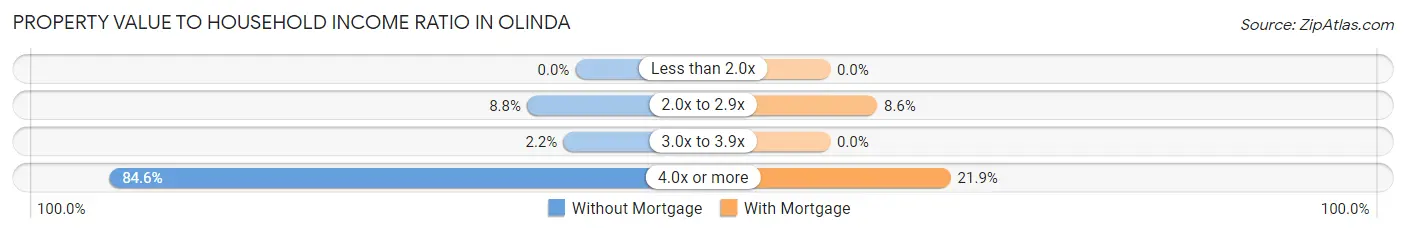
| Value-to-Income Ratio | Without Mortgage | With Mortgage |
| Less than 2.0x | 0 (0.0%) | 0 (0.0%) |
| 2.0x to 2.9x | 8 (8.8%) | 16 (8.6%) |
| 3.0x to 3.9x | 2 (2.2%) | 0 (0.0%) |
| 4.0x or more | 77 (84.6%) | 41 (21.9%) |
| Total | 91 (100.0%) | 187 (100.0%) |
Real Estate Taxes by Mortgage Status in Olinda
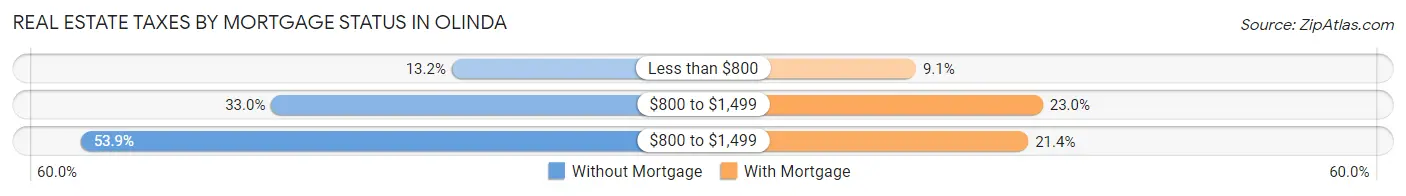
| Property Taxes | Without Mortgage | With Mortgage |
| Less than $800 | 12 (13.2%) | 17 (9.1%) |
| $800 to $1,499 | 30 (33.0%) | 43 (23.0%) |
| $800 to $1,499 | 49 (53.8%) | 40 (21.4%) |
| Total | 91 (100.0%) | 187 (100.0%) |
Health & Disability in Olinda
Health Insurance Coverage by Age in Olinda
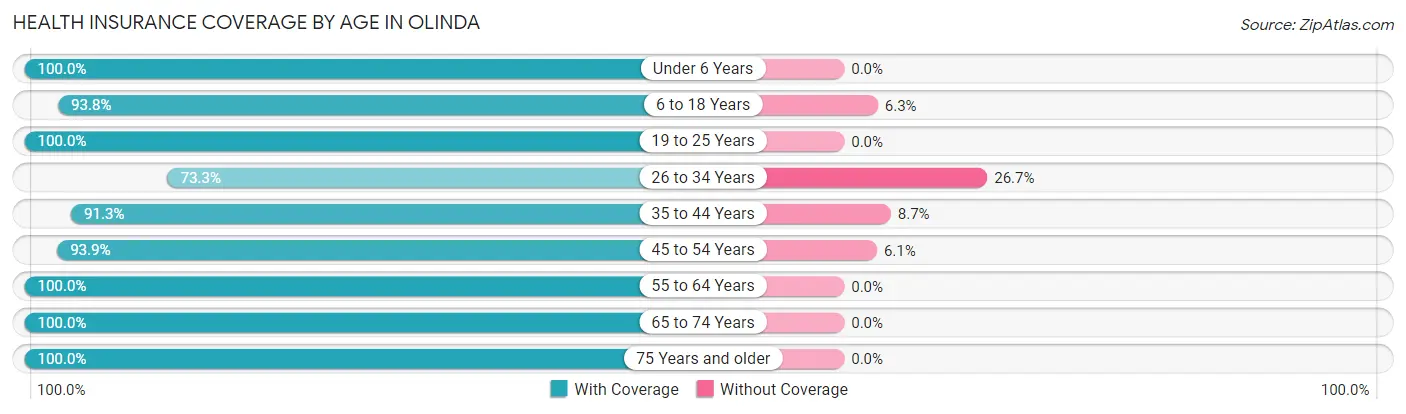
| Age Bracket | With Coverage | Without Coverage |
| Under 6 Years | 44 (100.0%) | 0 (0.0%) |
| 6 to 18 Years | 90 (93.8%) | 6 (6.2%) |
| 19 to 25 Years | 20 (100.0%) | 0 (0.0%) |
| 26 to 34 Years | 33 (73.3%) | 12 (26.7%) |
| 35 to 44 Years | 284 (91.3%) | 27 (8.7%) |
| 45 to 54 Years | 108 (93.9%) | 7 (6.1%) |
| 55 to 64 Years | 140 (100.0%) | 0 (0.0%) |
| 65 to 74 Years | 132 (100.0%) | 0 (0.0%) |
| 75 Years and older | 112 (100.0%) | 0 (0.0%) |
| Total | 963 (94.9%) | 52 (5.1%) |
Health Insurance Coverage by Citizenship Status in Olinda
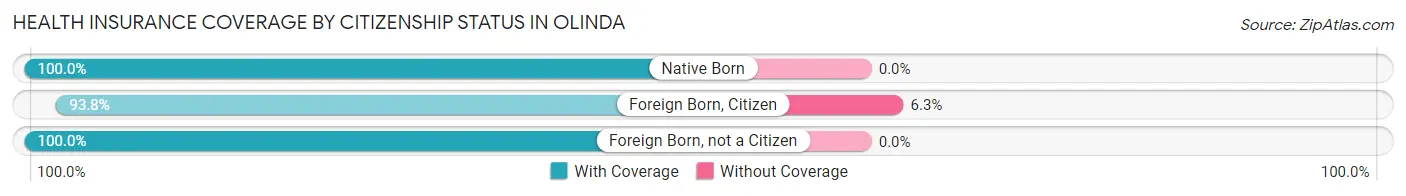
| Citizenship Status | With Coverage | Without Coverage |
| Native Born | 44 (100.0%) | 0 (0.0%) |
| Foreign Born, Citizen | 90 (93.8%) | 6 (6.2%) |
| Foreign Born, not a Citizen | 20 (100.0%) | 0 (0.0%) |
Health Insurance Coverage by Household Income in Olinda
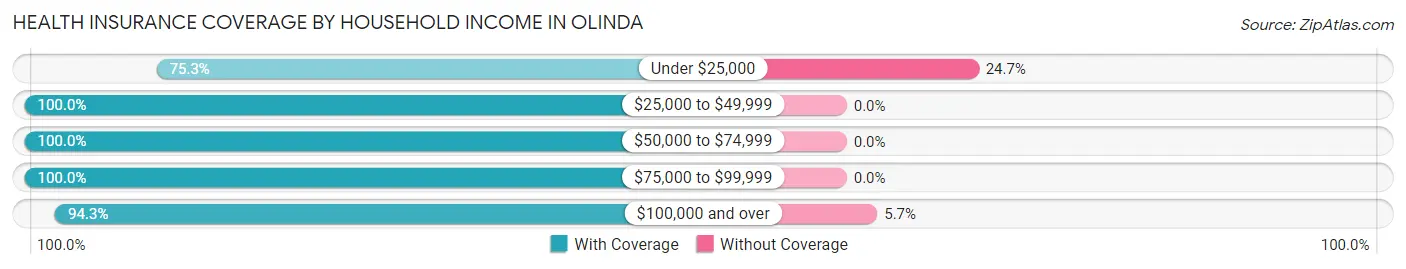
| Household Income | With Coverage | Without Coverage |
| Under $25,000 | 64 (75.3%) | 21 (24.7%) |
| $25,000 to $49,999 | 62 (100.0%) | 0 (0.0%) |
| $50,000 to $74,999 | 231 (100.0%) | 0 (0.0%) |
| $75,000 to $99,999 | 94 (100.0%) | 0 (0.0%) |
| $100,000 and over | 512 (94.3%) | 31 (5.7%) |
Public vs Private Health Insurance Coverage by Age in Olinda
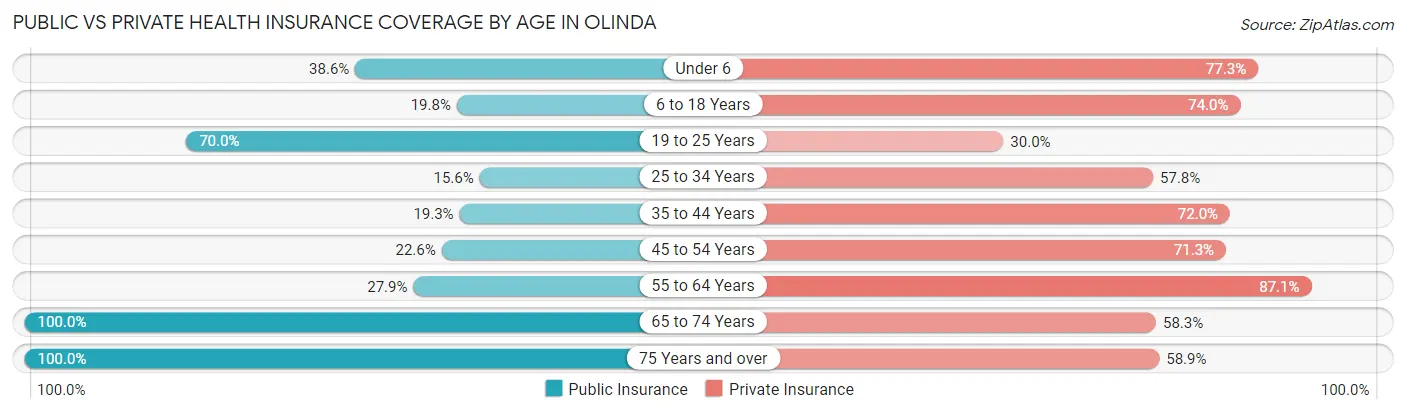
| Age Bracket | Public Insurance | Private Insurance |
| Under 6 | 17 (38.6%) | 34 (77.3%) |
| 6 to 18 Years | 19 (19.8%) | 71 (74.0%) |
| 19 to 25 Years | 14 (70.0%) | 6 (30.0%) |
| 25 to 34 Years | 7 (15.6%) | 26 (57.8%) |
| 35 to 44 Years | 60 (19.3%) | 224 (72.0%) |
| 45 to 54 Years | 26 (22.6%) | 82 (71.3%) |
| 55 to 64 Years | 39 (27.9%) | 122 (87.1%) |
| 65 to 74 Years | 132 (100.0%) | 77 (58.3%) |
| 75 Years and over | 112 (100.0%) | 66 (58.9%) |
| Total | 426 (42.0%) | 708 (69.8%) |
Disability Status by Sex by Age in Olinda
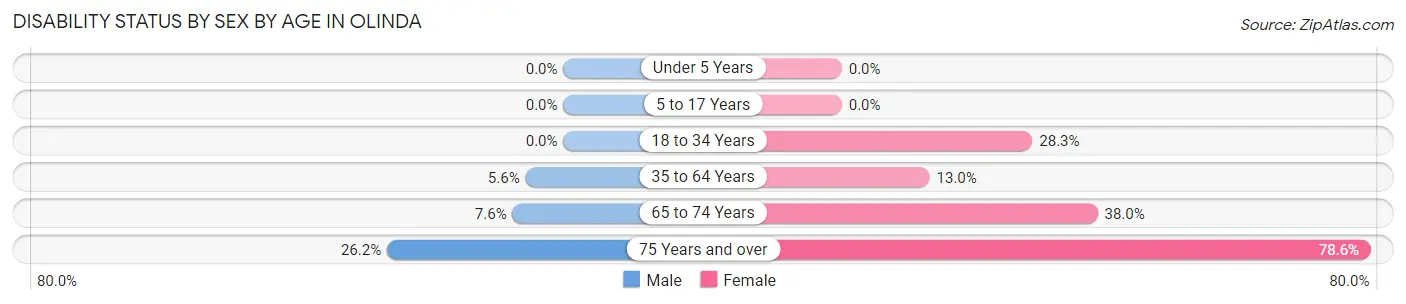
| Age Bracket | Male | Female |
| Under 5 Years | 0 (0.0%) | 0 (0.0%) |
| 5 to 17 Years | 0 (0.0%) | 0 (0.0%) |
| 18 to 34 Years | 0 (0.0%) | 15 (28.3%) |
| 35 to 64 Years | 15 (5.6%) | 39 (13.0%) |
| 65 to 74 Years | 4 (7.5%) | 30 (38.0%) |
| 75 Years and over | 22 (26.2%) | 22 (78.6%) |
Disability Class by Sex by Age in Olinda
Disability Class: Hearing Difficulty
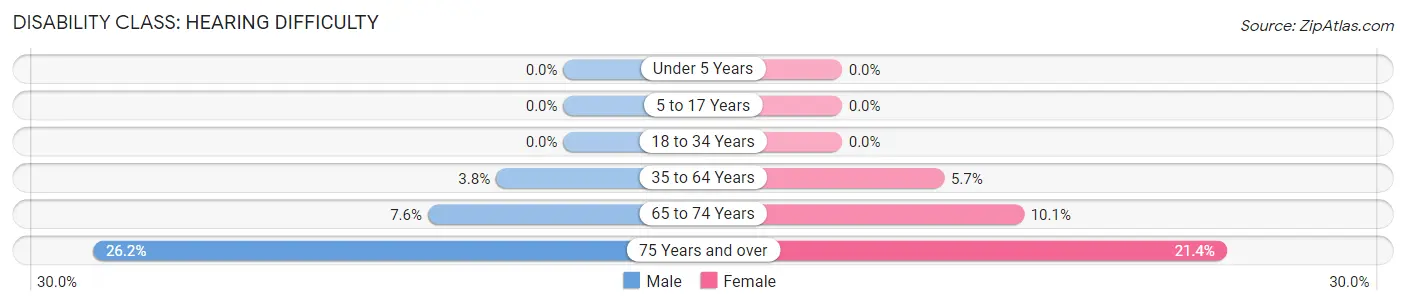
| Age Bracket | Male | Female |
| Under 5 Years | 0 (0.0%) | 0 (0.0%) |
| 5 to 17 Years | 0 (0.0%) | 0 (0.0%) |
| 18 to 34 Years | 0 (0.0%) | 0 (0.0%) |
| 35 to 64 Years | 10 (3.7%) | 17 (5.7%) |
| 65 to 74 Years | 4 (7.5%) | 8 (10.1%) |
| 75 Years and over | 22 (26.2%) | 6 (21.4%) |
Disability Class: Vision Difficulty
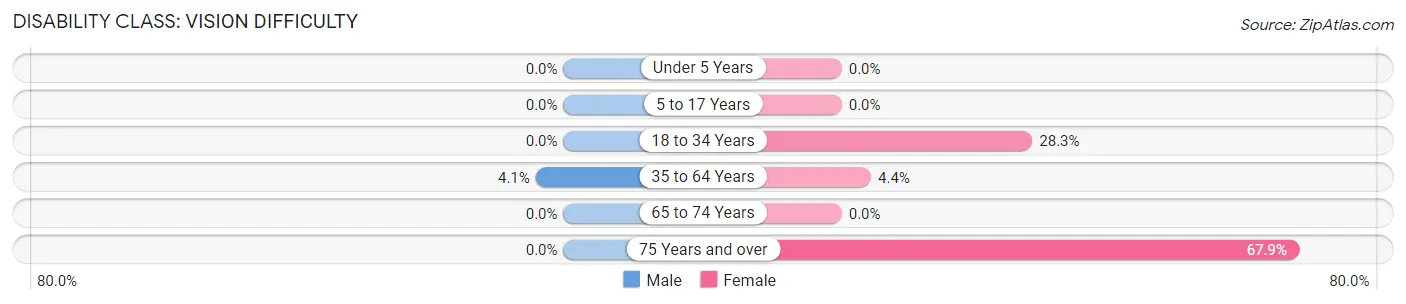
| Age Bracket | Male | Female |
| Under 5 Years | 0 (0.0%) | 0 (0.0%) |
| 5 to 17 Years | 0 (0.0%) | 0 (0.0%) |
| 18 to 34 Years | 0 (0.0%) | 15 (28.3%) |
| 35 to 64 Years | 11 (4.1%) | 13 (4.3%) |
| 65 to 74 Years | 0 (0.0%) | 0 (0.0%) |
| 75 Years and over | 0 (0.0%) | 19 (67.9%) |
Disability Class: Cognitive Difficulty
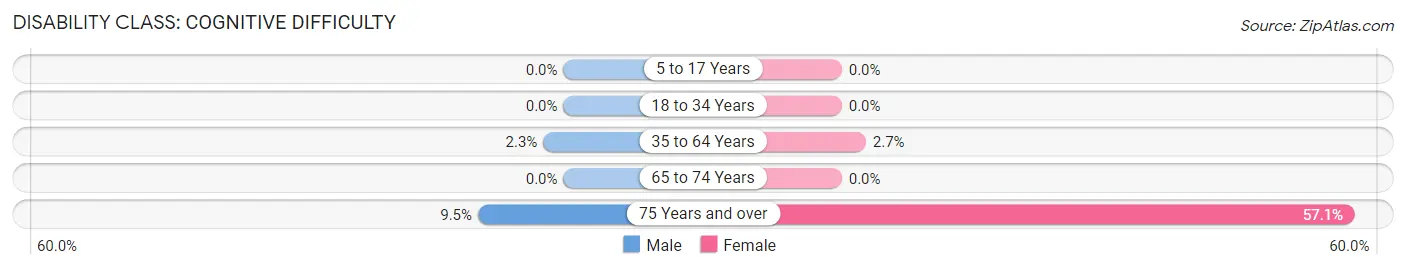
| Age Bracket | Male | Female |
| 5 to 17 Years | 0 (0.0%) | 0 (0.0%) |
| 18 to 34 Years | 0 (0.0%) | 0 (0.0%) |
| 35 to 64 Years | 6 (2.2%) | 8 (2.7%) |
| 65 to 74 Years | 0 (0.0%) | 0 (0.0%) |
| 75 Years and over | 8 (9.5%) | 16 (57.1%) |
Disability Class: Ambulatory Difficulty
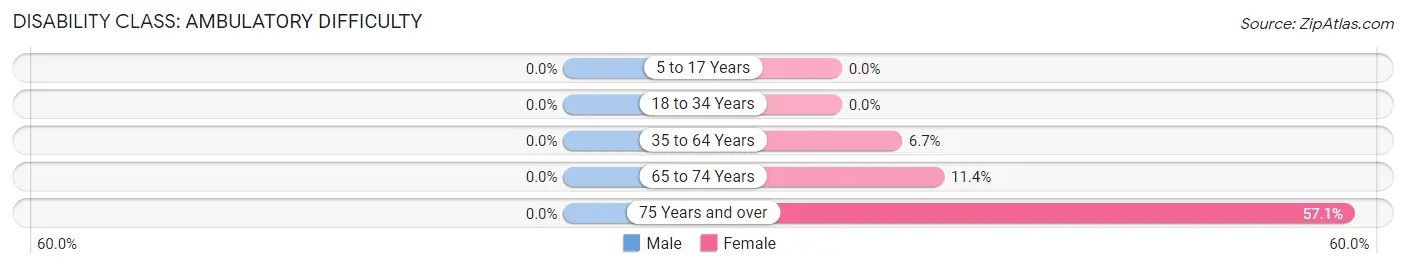
| Age Bracket | Male | Female |
| 5 to 17 Years | 0 (0.0%) | 0 (0.0%) |
| 18 to 34 Years | 0 (0.0%) | 0 (0.0%) |
| 35 to 64 Years | 0 (0.0%) | 20 (6.7%) |
| 65 to 74 Years | 0 (0.0%) | 9 (11.4%) |
| 75 Years and over | 0 (0.0%) | 16 (57.1%) |
Disability Class: Self-Care Difficulty
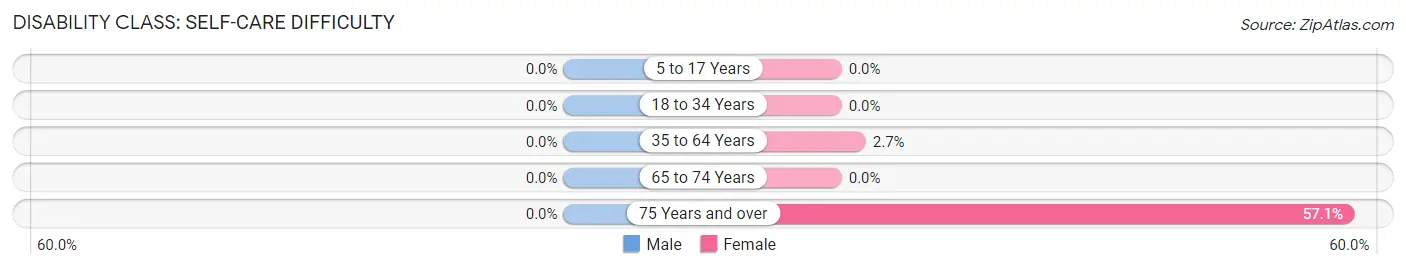
| Age Bracket | Male | Female |
| 5 to 17 Years | 0 (0.0%) | 0 (0.0%) |
| 18 to 34 Years | 0 (0.0%) | 0 (0.0%) |
| 35 to 64 Years | 0 (0.0%) | 8 (2.7%) |
| 65 to 74 Years | 0 (0.0%) | 0 (0.0%) |
| 75 Years and over | 0 (0.0%) | 16 (57.1%) |
Technology Access in Olinda
Computing Device Access in Olinda
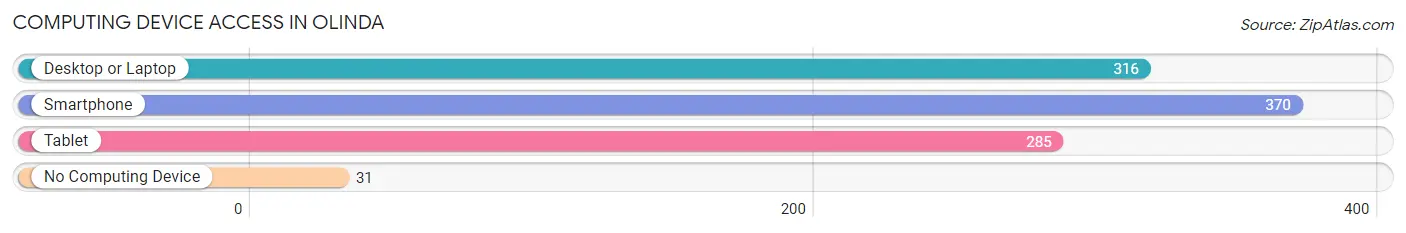
| Device Type | # Households | % Households |
| Desktop or Laptop | 316 | 76.1% |
| Smartphone | 370 | 89.2% |
| Tablet | 285 | 68.7% |
| No Computing Device | 31 | 7.5% |
| Total | 415 | 100.0% |
Internet Access in Olinda
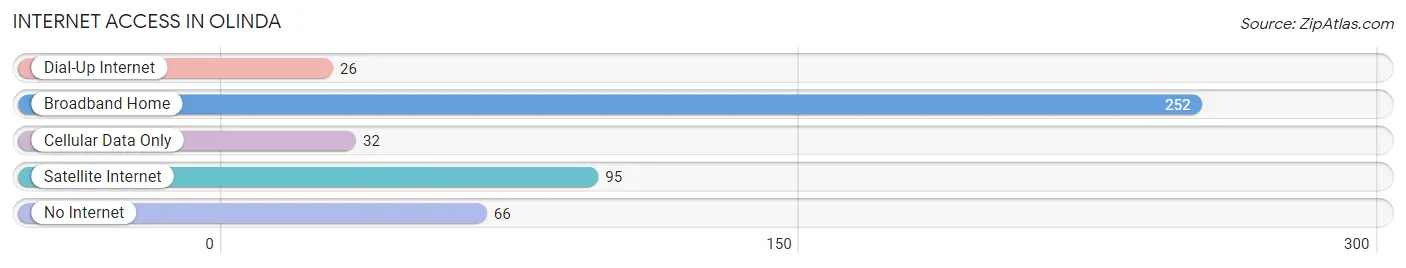
| Internet Type | # Households | % Households |
| Dial-Up Internet | 26 | 6.3% |
| Broadband Home | 252 | 60.7% |
| Cellular Data Only | 32 | 7.7% |
| Satellite Internet | 95 | 22.9% |
| No Internet | 66 | 15.9% |
| Total | 415 | 100.0% |
Olinda Summary
Olinda is a small town located on the island of Maui in the state of Hawaii. It is situated on the north shore of the island, just south of the city of Lahaina. The town is known for its beautiful beaches, lush tropical forests, and stunning views of the Pacific Ocean.
History
The area that is now Olinda was first settled by Polynesian immigrants in the late 1700s. The first settlers were primarily fishermen and farmers, and the area was known as “Kahakuloa”, which means “the long valley”. The area was later renamed “Olinda”, which means “pleasant” in Hawaiian.
In the early 1800s, the area was a popular destination for whalers and traders. The whalers would often stop in Olinda to rest and resupply before continuing on their journey. In 1845, the first sugar plantation was established in Olinda, and the town quickly became a hub for the sugar industry.
In the late 1800s, the town began to grow and develop. The first school was built in 1887, and the first post office was established in 1891. The town was also home to a number of churches, including the Church of Jesus Christ of Latter-day Saints, which was established in 1892.
Geography
Olinda is located on the north shore of Maui, just south of the city of Lahaina. The town is situated on a plateau, with the Pacific Ocean to the west and the mountains of the West Maui Mountains to the east. The town is surrounded by lush tropical forests and is home to a number of beautiful beaches.
The climate in Olinda is tropical, with temperatures ranging from the mid-70s to the mid-80s throughout the year. The town receives an average of about 20 inches of rain per year, with most of the rain falling between November and April.
Economy
The economy of Olinda is largely based on tourism and agriculture. The town is home to a number of resorts and hotels, as well as a number of restaurants and shops. The town is also home to a number of farms, which produce a variety of fruits and vegetables.
The town is also home to a number of small businesses, including a number of art galleries and craft stores. The town is also home to a number of small manufacturing companies, which produce a variety of products, including clothing and jewelry.
Demographics
As of the 2010 census, the population of Olinda was 2,845. The town is predominantly white, with about 75% of the population being of European descent. The town is also home to a number of other ethnic groups, including Native Hawaiians, Asians, and Pacific Islanders.
The median household income in Olinda is $50,000, and the median home value is $400,000. The town has a low unemployment rate, and the majority of the population is employed in the tourism and agriculture industries.
Conclusion
Olinda is a small town located on the north shore of Maui in the state of Hawaii. The town is known for its beautiful beaches, lush tropical forests, and stunning views of the Pacific Ocean. The town is home to a number of resorts and hotels, as well as a number of restaurants and shops. The town is also home to a number of farms, which produce a variety of fruits and vegetables. The town is predominantly white, with about 75% of the population being of European descent. The town has a low unemployment rate, and the majority of the population is employed in the tourism and agriculture industries.
Common Questions
What is Per Capita Income in Olinda?
Per Capita income in Olinda is $56,374.
What is the Median Family Income in Olinda?
Median Family Income in Olinda is $113,906.
What is the Median Household income in Olinda?
Median Household Income in Olinda is $93,125.
What is Income or Wage Gap in Olinda?
Income or Wage Gap in Olinda is 40.9%.
Women in Olinda earn 59.1 cents for every dollar earned by a man.
What is Inequality or Gini Index in Olinda?
Inequality or Gini Index in Olinda is 0.49.
What is the Total Population of Olinda?
Total Population of Olinda is 1,018.
What is the Total Male Population of Olinda?
Total Male Population of Olinda is 516.
What is the Total Female Population of Olinda?
Total Female Population of Olinda is 502.
What is the Ratio of Males per 100 Females in Olinda?
There are 102.79 Males per 100 Females in Olinda.
What is the Ratio of Females per 100 Males in Olinda?
There are 97.29 Females per 100 Males in Olinda.
What is the Median Population Age in Olinda?
Median Population Age in Olinda is 43.9 Years.
What is the Average Family Size in Olinda
Average Family Size in Olinda is 2.8 People.
What is the Average Household Size in Olinda
Average Household Size in Olinda is 2.5 People.
How Large is the Labor Force in Olinda?
There are 593 People in the Labor Forcein in Olinda.
What is the Percentage of People in the Labor Force in Olinda?
66.3% of People are in the Labor Force in Olinda.
What is the Unemployment Rate in Olinda?
Unemployment Rate in Olinda is 2.9%.