Kawela Bay, HI Map & Demographics
Kawela Bay Map
Kawela Bay Overview
$44,638
PER CAPITA INCOME
$112,813
AVG FAMILY INCOME
$71,429
AVG HOUSEHOLD INCOME
29.2%
WAGE / INCOME GAP [ % ]
70.8¢/ $1
WAGE / INCOME GAP [ $ ]
0.39
INEQUALITY / GINI INDEX
365
TOTAL POPULATION
211
MALE POPULATION
154
FEMALE POPULATION
137.01
MALES / 100 FEMALES
72.99
FEMALES / 100 MALES
45.1
MEDIAN AGE
3.2
AVG FAMILY SIZE
2.1
AVG HOUSEHOLD SIZE
192
LABOR FORCE [ PEOPLE ]
61.5%
PERCENT IN LABOR FORCE
2.2%
UNEMPLOYMENT RATE
Income in Kawela Bay
Income Overview in Kawela Bay
Per Capita Income in Kawela Bay is $44,638, while median incomes of families and households are $112,813 and $71,429 respectively.
| Characteristic | Number | Measure |
| Per Capita Income | 365 | $44,638 |
| Median Family Income | 81 | $112,813 |
| Mean Family Income | 81 | $121,612 |
| Median Household Income | 176 | $71,429 |
| Mean Household Income | 176 | $92,836 |
| Income Deficit | 81 | $0 |
| Wage / Income Gap (%) | 365 | 29.22% |
| Wage / Income Gap ($) | 365 | 70.78¢ per $1 |
| Gini / Inequality Index | 365 | 0.39 |
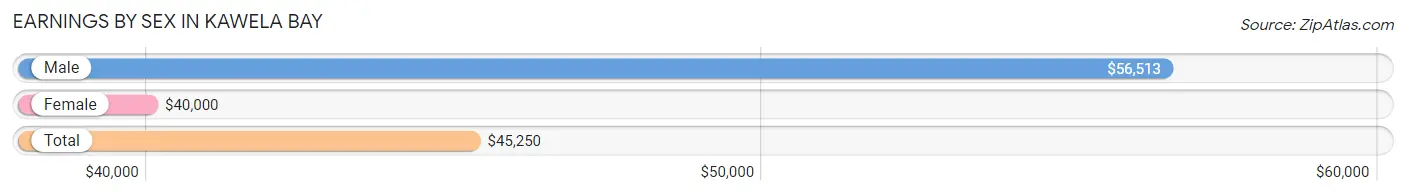
Earnings by Sex in Kawela Bay
Average Earnings in Kawela Bay are $45,250, $56,513 for men and $40,000 for women, a difference of 29.2%.
| Sex | Number | Average Earnings |
| Male | 125 (60.4%) | $56,513 |
| Female | 82 (39.6%) | $40,000 |
| Total | 207 (100.0%) | $45,250 |
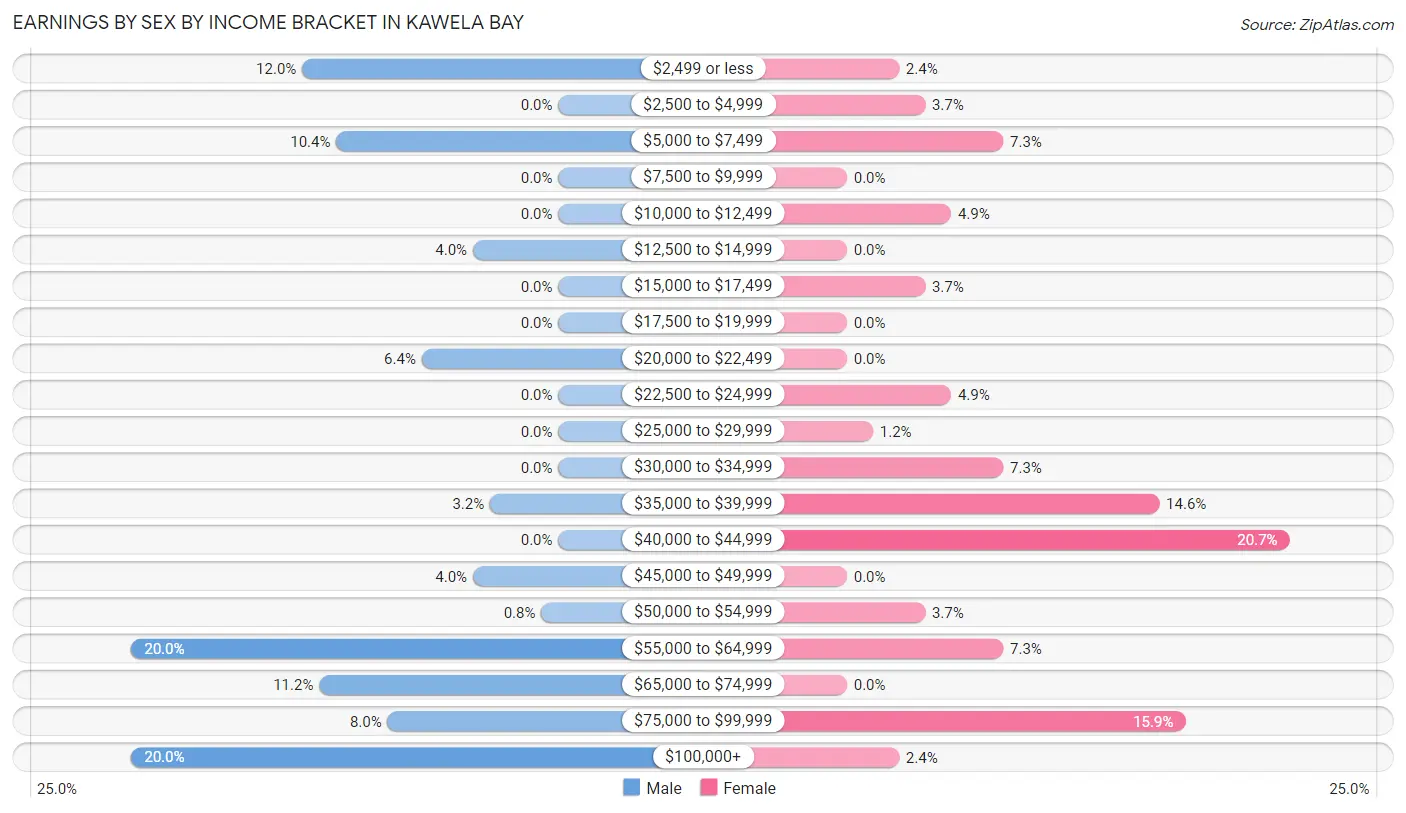
Earnings by Sex by Income Bracket in Kawela Bay
The most common earnings brackets in Kawela Bay are $55,000 to $64,999 for men (25 | 20.0%) and $40,000 to $44,999 for women (17 | 20.7%).
| Income | Male | Female |
| $2,499 or less | 15 (12.0%) | 2 (2.4%) |
| $2,500 to $4,999 | 0 (0.0%) | 3 (3.7%) |
| $5,000 to $7,499 | 13 (10.4%) | 6 (7.3%) |
| $7,500 to $9,999 | 0 (0.0%) | 0 (0.0%) |
| $10,000 to $12,499 | 0 (0.0%) | 4 (4.9%) |
| $12,500 to $14,999 | 5 (4.0%) | 0 (0.0%) |
| $15,000 to $17,499 | 0 (0.0%) | 3 (3.7%) |
| $17,500 to $19,999 | 0 (0.0%) | 0 (0.0%) |
| $20,000 to $22,499 | 8 (6.4%) | 0 (0.0%) |
| $22,500 to $24,999 | 0 (0.0%) | 4 (4.9%) |
| $25,000 to $29,999 | 0 (0.0%) | 1 (1.2%) |
| $30,000 to $34,999 | 0 (0.0%) | 6 (7.3%) |
| $35,000 to $39,999 | 4 (3.2%) | 12 (14.6%) |
| $40,000 to $44,999 | 0 (0.0%) | 17 (20.7%) |
| $45,000 to $49,999 | 5 (4.0%) | 0 (0.0%) |
| $50,000 to $54,999 | 1 (0.8%) | 3 (3.7%) |
| $55,000 to $64,999 | 25 (20.0%) | 6 (7.3%) |
| $65,000 to $74,999 | 14 (11.2%) | 0 (0.0%) |
| $75,000 to $99,999 | 10 (8.0%) | 13 (15.9%) |
| $100,000+ | 25 (20.0%) | 2 (2.4%) |
| Total | 125 (100.0%) | 82 (100.0%) |
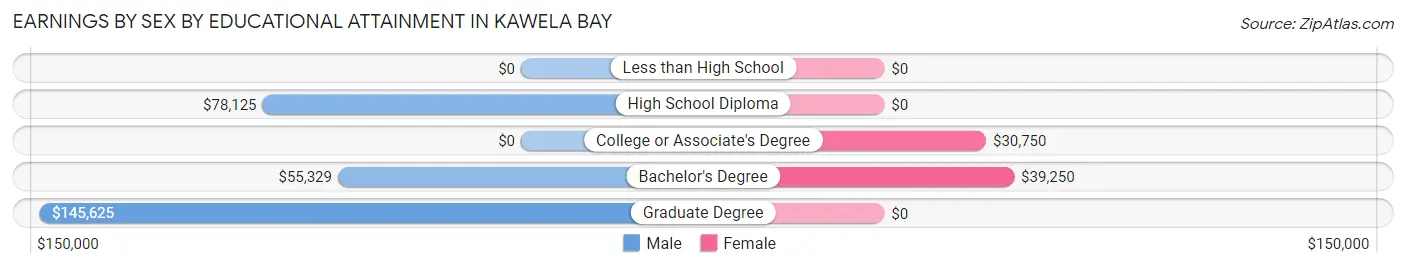
Earnings by Sex by Educational Attainment in Kawela Bay
Average earnings in Kawela Bay are $56,053 for men and $40,208 for women, a difference of 28.3%. Men with an educational attainment of graduate degree enjoy the highest average annual earnings of $145,625, while those with bachelor's degree education earn the least with $55,329. Women with an educational attainment of bachelor's degree earn the most with the average annual earnings of $39,250, while those with college or associate's degree education have the smallest earnings of $30,750.
| Educational Attainment | Male Income | Female Income |
| Less than High School | - | - |
| High School Diploma | $78,125 | $0 |
| College or Associate's Degree | - | - |
| Bachelor's Degree | $55,329 | $39,250 |
| Graduate Degree | $145,625 | $0 |
| Total | $56,053 | $40,208 |
Family Income in Kawela Bay
Family Income Brackets in Kawela Bay
According to the Kawela Bay family income data, there are 24 families falling into the $150,000 to $199,999 income range, which is the most common income bracket and makes up 29.6% of all families.
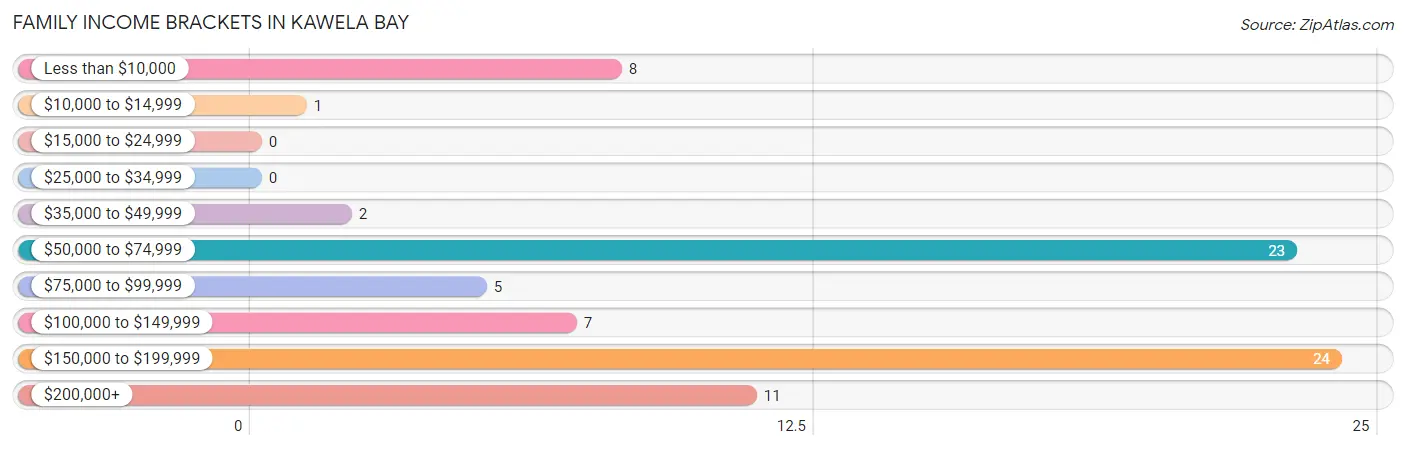
| Income Bracket | # Families | % Families |
| Less than $10,000 | 8 | 9.9% |
| $10,000 to $14,999 | 1 | 1.2% |
| $15,000 to $24,999 | 0 | 0.0% |
| $25,000 to $34,999 | 0 | 0.0% |
| $35,000 to $49,999 | 2 | 2.5% |
| $50,000 to $74,999 | 23 | 28.4% |
| $75,000 to $99,999 | 5 | 6.2% |
| $100,000 to $149,999 | 7 | 8.6% |
| $150,000 to $199,999 | 24 | 29.6% |
| $200,000+ | 11 | 13.6% |
Family Income by Famaliy Size in Kawela Bay
3-person families (17 | 21.0%) account for the highest median family income in Kawela Bay with $160,625 per family, while 3-person families (17 | 21.0%) have the highest median income of $53,542 per family member.
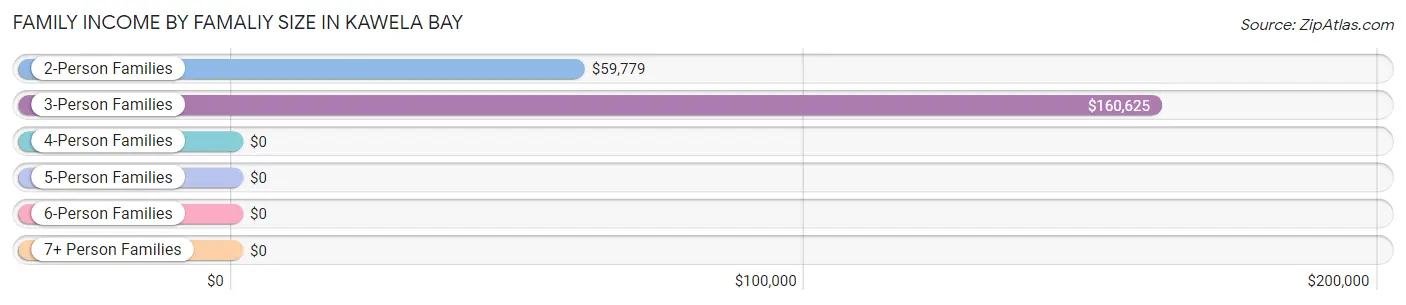
| Income Bracket | # Families | Median Income |
| 2-Person Families | 51 (63.0%) | $59,779 |
| 3-Person Families | 17 (21.0%) | $160,625 |
| 4-Person Families | 0 (0.0%) | $0 |
| 5-Person Families | 7 (8.6%) | $0 |
| 6-Person Families | 6 (7.4%) | $0 |
| 7+ Person Families | 0 (0.0%) | $0 |
| Total | 81 (100.0%) | $112,813 |
Family Income by Number of Earners in Kawela Bay
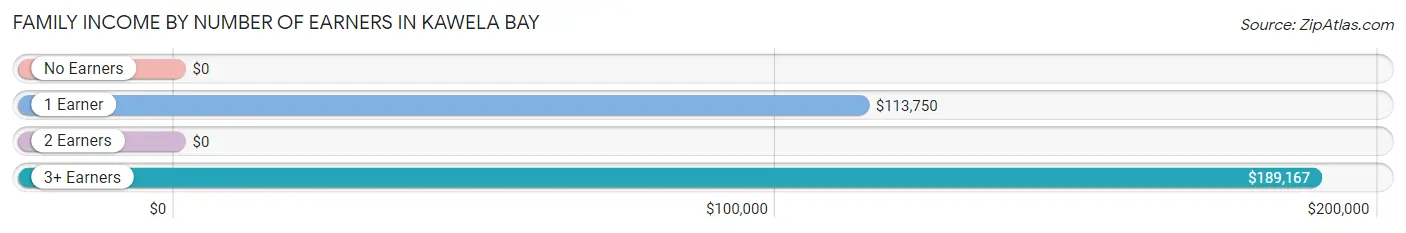
| Number of Earners | # Families | Median Income |
| No Earners | 16 (19.8%) | $0 |
| 1 Earner | 14 (17.3%) | $113,750 |
| 2 Earners | 39 (48.1%) | $0 |
| 3+ Earners | 12 (14.8%) | $189,167 |
| Total | 81 (100.0%) | $112,813 |
Household Income in Kawela Bay
Household Income Brackets in Kawela Bay
With 54 households falling in the category, the $50,000 to $74,999 income range is the most frequent in Kawela Bay, accounting for 30.7% of all households. In contrast, only 1 households (0.6%) fall into the $10,000 to $14,999 income bracket, making it the least populous group.
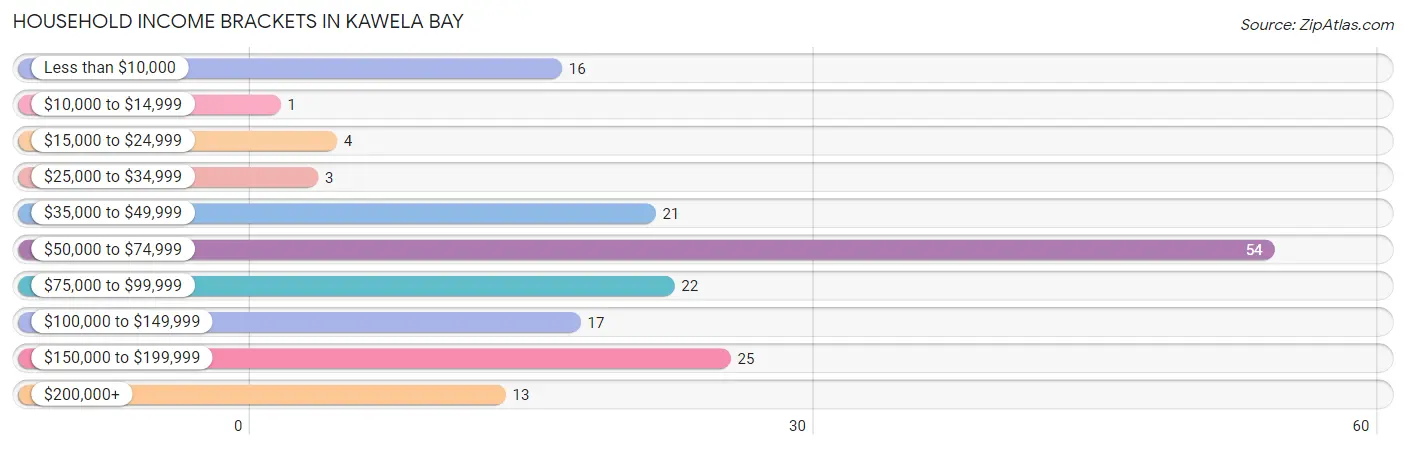
| Income Bracket | # Households | % Households |
| Less than $10,000 | 16 | 9.1% |
| $10,000 to $14,999 | 1 | 0.6% |
| $15,000 to $24,999 | 4 | 2.3% |
| $25,000 to $34,999 | 3 | 1.7% |
| $35,000 to $49,999 | 21 | 11.9% |
| $50,000 to $74,999 | 54 | 30.7% |
| $75,000 to $99,999 | 22 | 12.5% |
| $100,000 to $149,999 | 17 | 9.7% |
| $150,000 to $199,999 | 25 | 14.2% |
| $200,000+ | 13 | 7.4% |
Household Income by Householder Age in Kawela Bay
The median household income in Kawela Bay is $71,429, with the highest median household income of $81,250 found in the 65+ years age bracket for the primary householder. A total of 71 households (40.3%) fall into this category. Meanwhile, the 15 to 24 years age bracket for the primary householder has the lowest median household income of $0, with 7 households (4.0%) in this group.
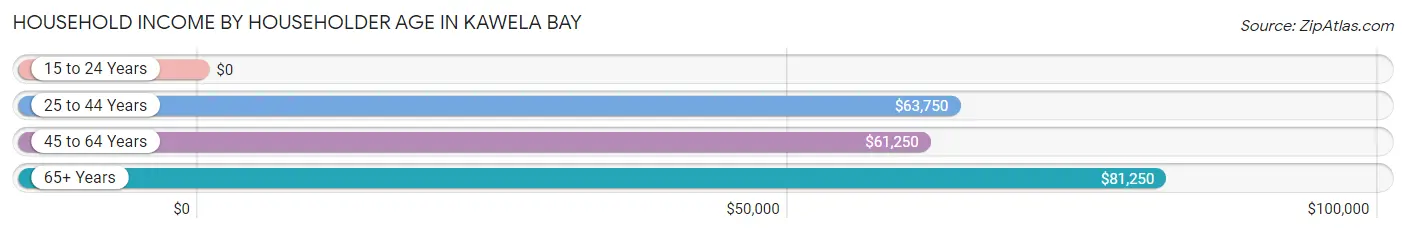
| Income Bracket | # Households | Median Income |
| 15 to 24 Years | 7 (4.0%) | $0 |
| 25 to 44 Years | 48 (27.3%) | $63,750 |
| 45 to 64 Years | 50 (28.4%) | $61,250 |
| 65+ Years | 71 (40.3%) | $81,250 |
| Total | 176 (100.0%) | $71,429 |
Poverty in Kawela Bay
Income Below Poverty by Sex and Age in Kawela Bay
With 6.6% poverty level for males and 14.3% for females among the residents of Kawela Bay, 6 to 11 year old males and 75 year old and over females are the most vulnerable to poverty, with 2 males (50.0%) and 11 females (57.9%) in their respective age groups living below the poverty level.
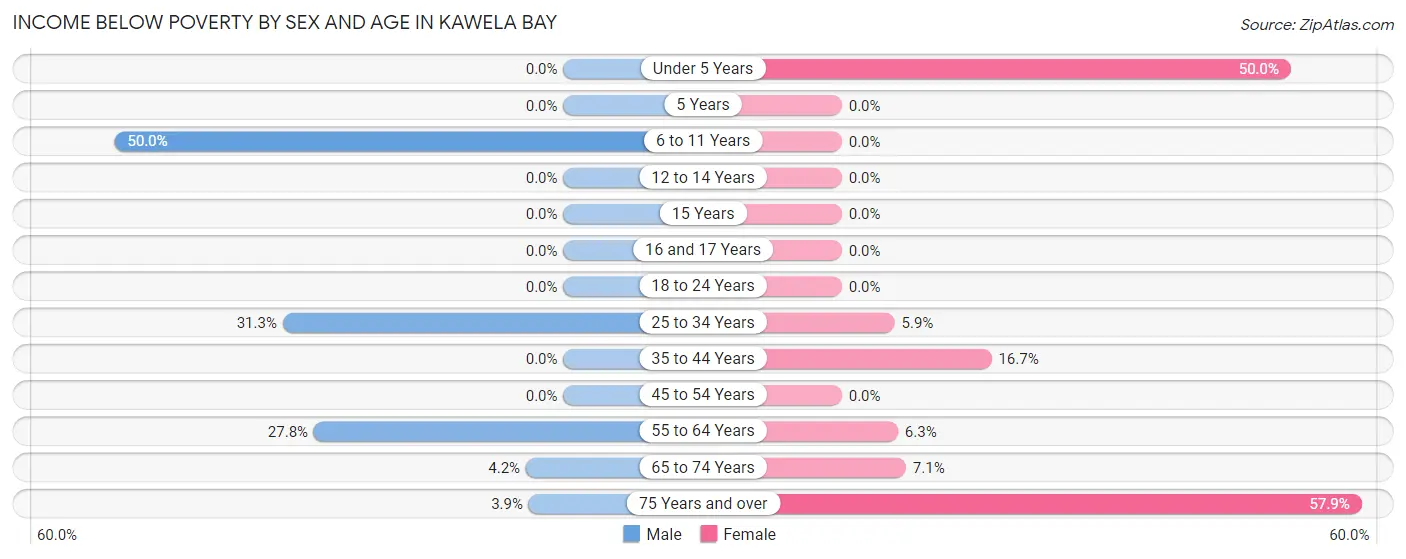
| Age Bracket | Male | Female |
| Under 5 Years | 0 (0.0%) | 1 (50.0%) |
| 5 Years | 0 (0.0%) | 0 (0.0%) |
| 6 to 11 Years | 2 (50.0%) | 0 (0.0%) |
| 12 to 14 Years | 0 (0.0%) | 0 (0.0%) |
| 15 Years | 0 (0.0%) | 0 (0.0%) |
| 16 and 17 Years | 0 (0.0%) | 0 (0.0%) |
| 18 to 24 Years | 0 (0.0%) | 0 (0.0%) |
| 25 to 34 Years | 5 (31.2%) | 1 (5.9%) |
| 35 to 44 Years | 0 (0.0%) | 5 (16.7%) |
| 45 to 54 Years | 0 (0.0%) | 0 (0.0%) |
| 55 to 64 Years | 5 (27.8%) | 2 (6.2%) |
| 65 to 74 Years | 1 (4.2%) | 2 (7.1%) |
| 75 Years and over | 1 (3.8%) | 11 (57.9%) |
| Total | 14 (6.6%) | 22 (14.3%) |
Income Above Poverty by Sex and Age in Kawela Bay
According to the poverty statistics in Kawela Bay, males aged under 5 years and females aged 6 to 11 years are the age groups that are most secure financially, with 100.0% of males and 100.0% of females in these age groups living above the poverty line.
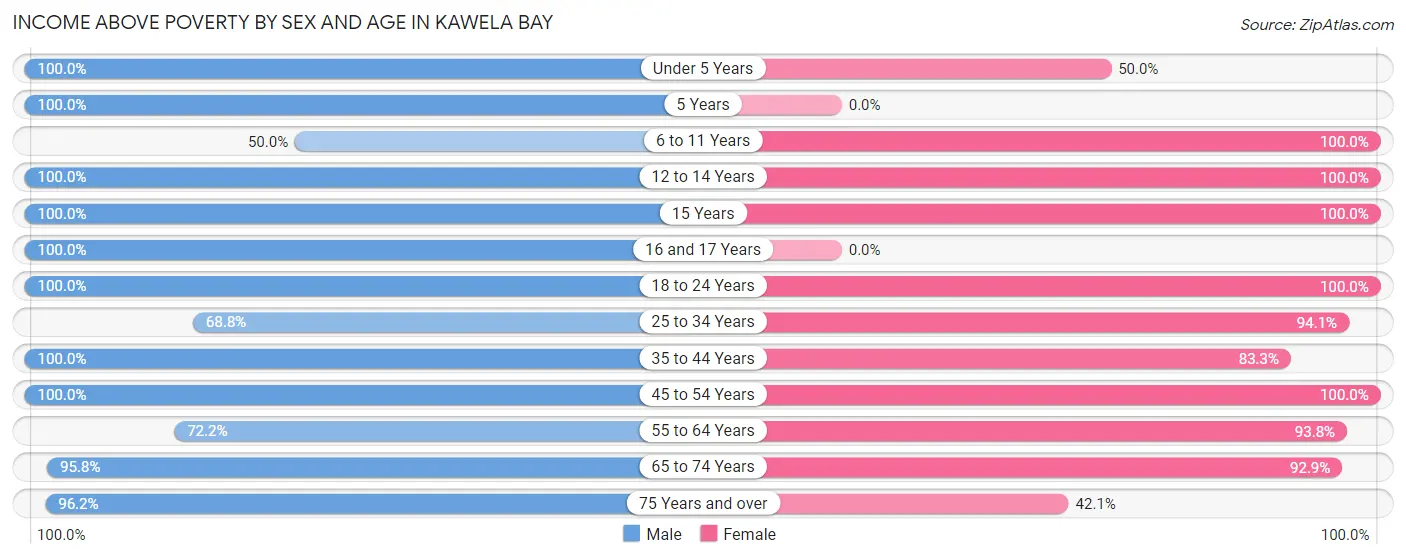
| Age Bracket | Male | Female |
| Under 5 Years | 6 (100.0%) | 1 (50.0%) |
| 5 Years | 4 (100.0%) | 0 (0.0%) |
| 6 to 11 Years | 2 (50.0%) | 7 (100.0%) |
| 12 to 14 Years | 18 (100.0%) | 2 (100.0%) |
| 15 Years | 1 (100.0%) | 9 (100.0%) |
| 16 and 17 Years | 8 (100.0%) | 0 (0.0%) |
| 18 to 24 Years | 9 (100.0%) | 2 (100.0%) |
| 25 to 34 Years | 11 (68.8%) | 16 (94.1%) |
| 35 to 44 Years | 46 (100.0%) | 25 (83.3%) |
| 45 to 54 Years | 31 (100.0%) | 6 (100.0%) |
| 55 to 64 Years | 13 (72.2%) | 30 (93.8%) |
| 65 to 74 Years | 23 (95.8%) | 26 (92.9%) |
| 75 Years and over | 25 (96.2%) | 8 (42.1%) |
| Total | 197 (93.4%) | 132 (85.7%) |
Income Below Poverty Among Married-Couple Families in Kawela Bay
The poverty statistics for married-couple families in Kawela Bay show that 11.4% or 8 of the total 70 families live below the poverty line. Families with 1 or 2 children have the highest poverty rate of 16.7%, comprising of 1 families. On the other hand, families with 3 or 4 children have the lowest poverty rate of 0.0%, which includes 0 families.
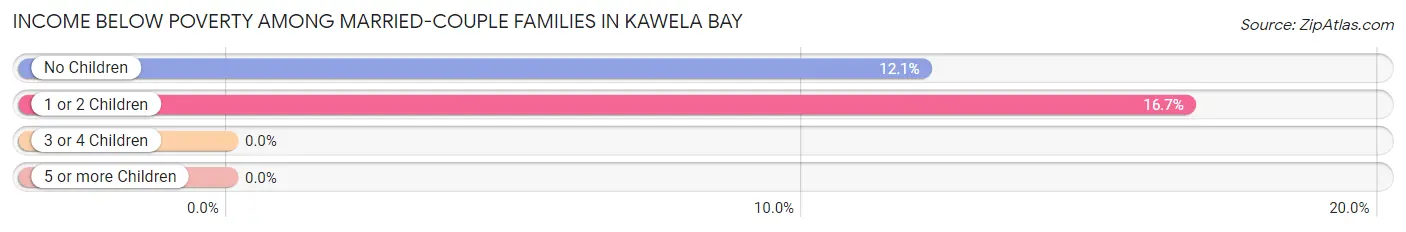
| Children | Above Poverty | Below Poverty |
| No Children | 51 (87.9%) | 7 (12.1%) |
| 1 or 2 Children | 5 (83.3%) | 1 (16.7%) |
| 3 or 4 Children | 6 (100.0%) | 0 (0.0%) |
| 5 or more Children | 0 (0.0%) | 0 (0.0%) |
| Total | 62 (88.6%) | 8 (11.4%) |
Income Below Poverty Among Single-Parent Households in Kawela Bay
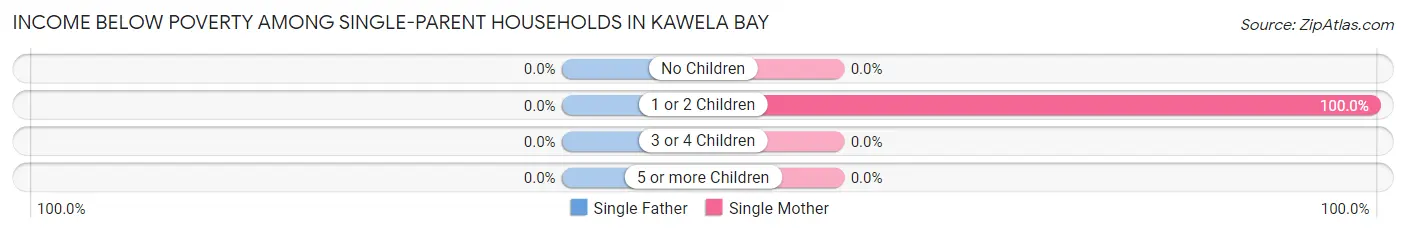
| Children | Single Father | Single Mother |
| No Children | 0 (0.0%) | 0 (0.0%) |
| 1 or 2 Children | 0 (0.0%) | 1 (100.0%) |
| 3 or 4 Children | 0 (0.0%) | 0 (0.0%) |
| 5 or more Children | 0 (0.0%) | 0 (0.0%) |
| Total | 0 (0.0%) | 1 (10.0%) |
Income Below Poverty Among Married-Couple vs Single-Parent Households in Kawela Bay
The poverty data for Kawela Bay shows that 8 of the married-couple family households (11.4%) and 1 of the single-parent households (9.1%) are living below the poverty level. Within the married-couple family households, those with 1 or 2 children have the highest poverty rate, with 1 households (16.7%) falling below the poverty line. Among the single-parent households, those with 1 or 2 children have the highest poverty rate, with 1 household (100.0%) living below poverty.
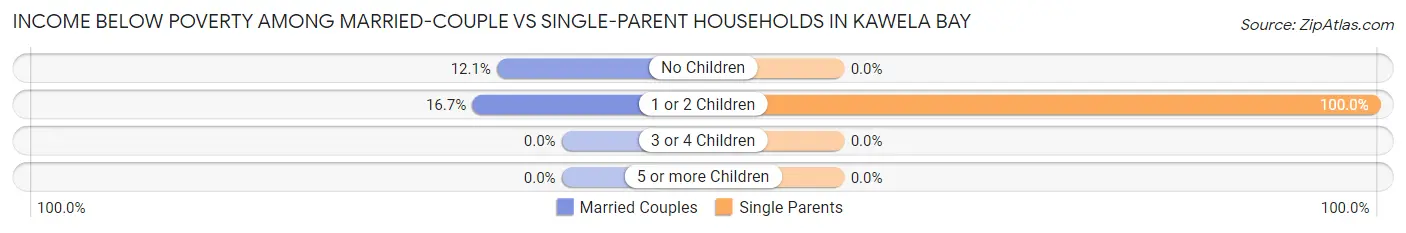
| Children | Married-Couple Families | Single-Parent Households |
| No Children | 7 (12.1%) | 0 (0.0%) |
| 1 or 2 Children | 1 (16.7%) | 1 (100.0%) |
| 3 or 4 Children | 0 (0.0%) | 0 (0.0%) |
| 5 or more Children | 0 (0.0%) | 0 (0.0%) |
| Total | 8 (11.4%) | 1 (9.1%) |
Race in Kawela Bay
The most populous races in Kawela Bay are White / Caucasian (231 | 63.3%), Two or more Races (93 | 25.5%), and Asian (31 | 8.5%).
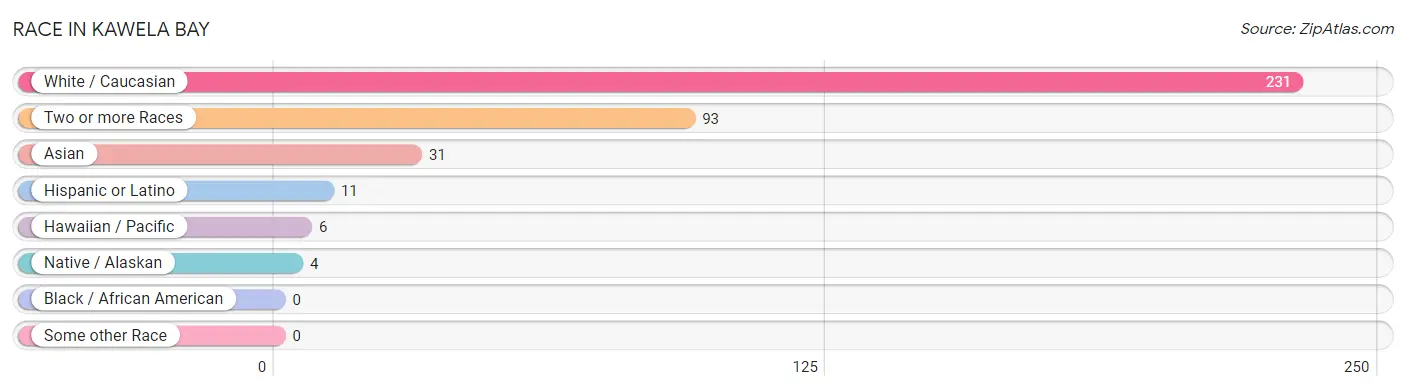
| Race | # Population | % Population |
| Asian | 31 | 8.5% |
| Black / African American | 0 | 0.0% |
| Hawaiian / Pacific | 6 | 1.6% |
| Hispanic or Latino | 11 | 3.0% |
| Native / Alaskan | 4 | 1.1% |
| White / Caucasian | 231 | 63.3% |
| Two or more Races | 93 | 25.5% |
| Some other Race | 0 | 0.0% |
| Total | 365 | 100.0% |
Ancestry in Kawela Bay
The most populous ancestries reported in Kawela Bay are English (89 | 24.4%), German (79 | 21.6%), Native Hawaiian (63 | 17.3%), Korean (42 | 11.5%), and Indian (Asian) (37 | 10.1%), together accounting for 84.9% of all Kawela Bay residents.
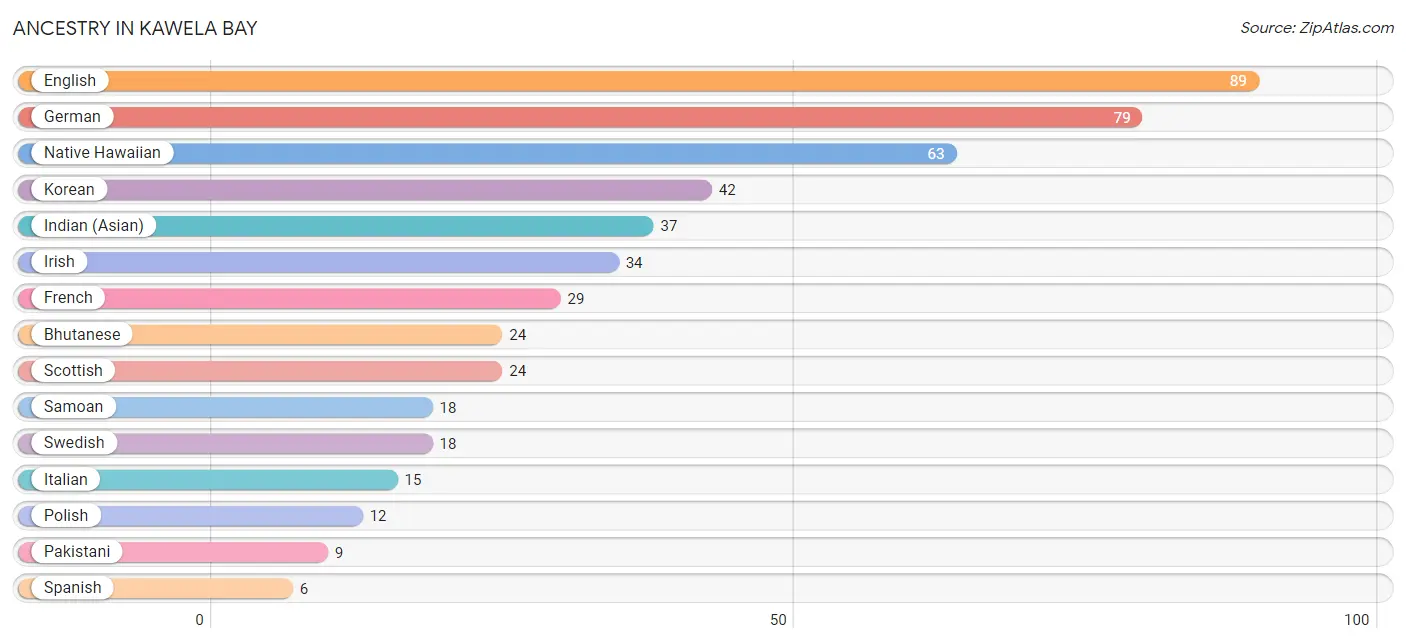
| Ancestry | # Population | % Population |
| Australian | 2 | 0.5% |
| Austrian | 2 | 0.5% |
| Belgian | 5 | 1.4% |
| Bhutanese | 24 | 6.6% |
| British | 5 | 1.4% |
| Central American | 4 | 1.1% |
| Central American Indian | 4 | 1.1% |
| Croatian | 1 | 0.3% |
| Czech | 1 | 0.3% |
| Danish | 3 | 0.8% |
| English | 89 | 24.4% |
| European | 5 | 1.4% |
| French | 29 | 8.0% |
| German | 79 | 21.6% |
| Hungarian | 1 | 0.3% |
| Indian (Asian) | 37 | 10.1% |
| Irish | 34 | 9.3% |
| Italian | 15 | 4.1% |
| Korean | 42 | 11.5% |
| Mexican | 1 | 0.3% |
| Native Hawaiian | 63 | 17.3% |
| Norwegian | 2 | 0.5% |
| Pakistani | 9 | 2.5% |
| Polish | 12 | 3.3% |
| Portuguese | 4 | 1.1% |
| Romanian | 2 | 0.5% |
| Salvadoran | 4 | 1.1% |
| Samoan | 18 | 4.9% |
| Scotch-Irish | 1 | 0.3% |
| Scottish | 24 | 6.6% |
| Sioux | 3 | 0.8% |
| Slovak | 1 | 0.3% |
| Spanish | 6 | 1.6% |
| Swedish | 18 | 4.9% |
| Thai | 1 | 0.3% |
| Ukrainian | 1 | 0.3% |
| Welsh | 2 | 0.5% | View All 37 Rows |
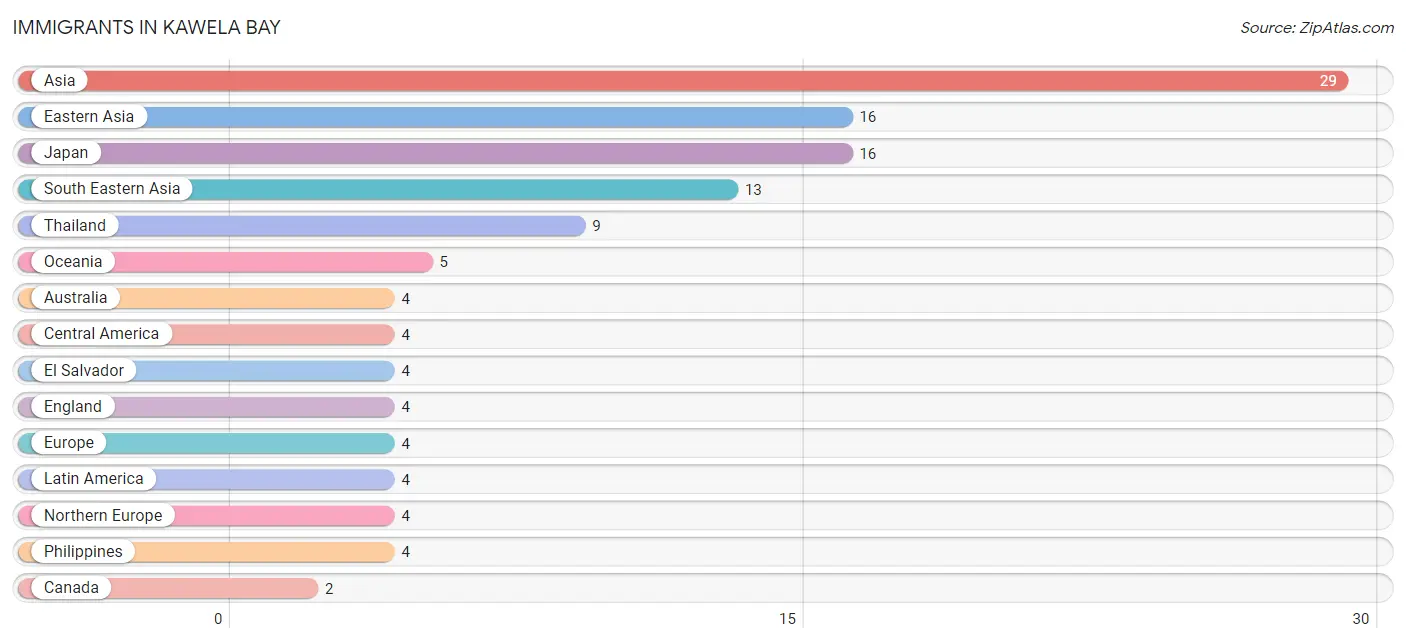
Immigrants in Kawela Bay
The most numerous immigrant groups reported in Kawela Bay came from Asia (29 | 8.0%), Eastern Asia (16 | 4.4%), Japan (16 | 4.4%), South Eastern Asia (13 | 3.6%), and Thailand (9 | 2.5%), together accounting for 22.7% of all Kawela Bay residents.
| Immigration Origin | # Population | % Population |
| Asia | 29 | 8.0% |
| Australia | 4 | 1.1% |
| Canada | 2 | 0.5% |
| Central America | 4 | 1.1% |
| Eastern Asia | 16 | 4.4% |
| El Salvador | 4 | 1.1% |
| England | 4 | 1.1% |
| Europe | 4 | 1.1% |
| Japan | 16 | 4.4% |
| Latin America | 4 | 1.1% |
| Northern Europe | 4 | 1.1% |
| Oceania | 5 | 1.4% |
| Philippines | 4 | 1.1% |
| South Eastern Asia | 13 | 3.6% |
| Thailand | 9 | 2.5% | View All 15 Rows |
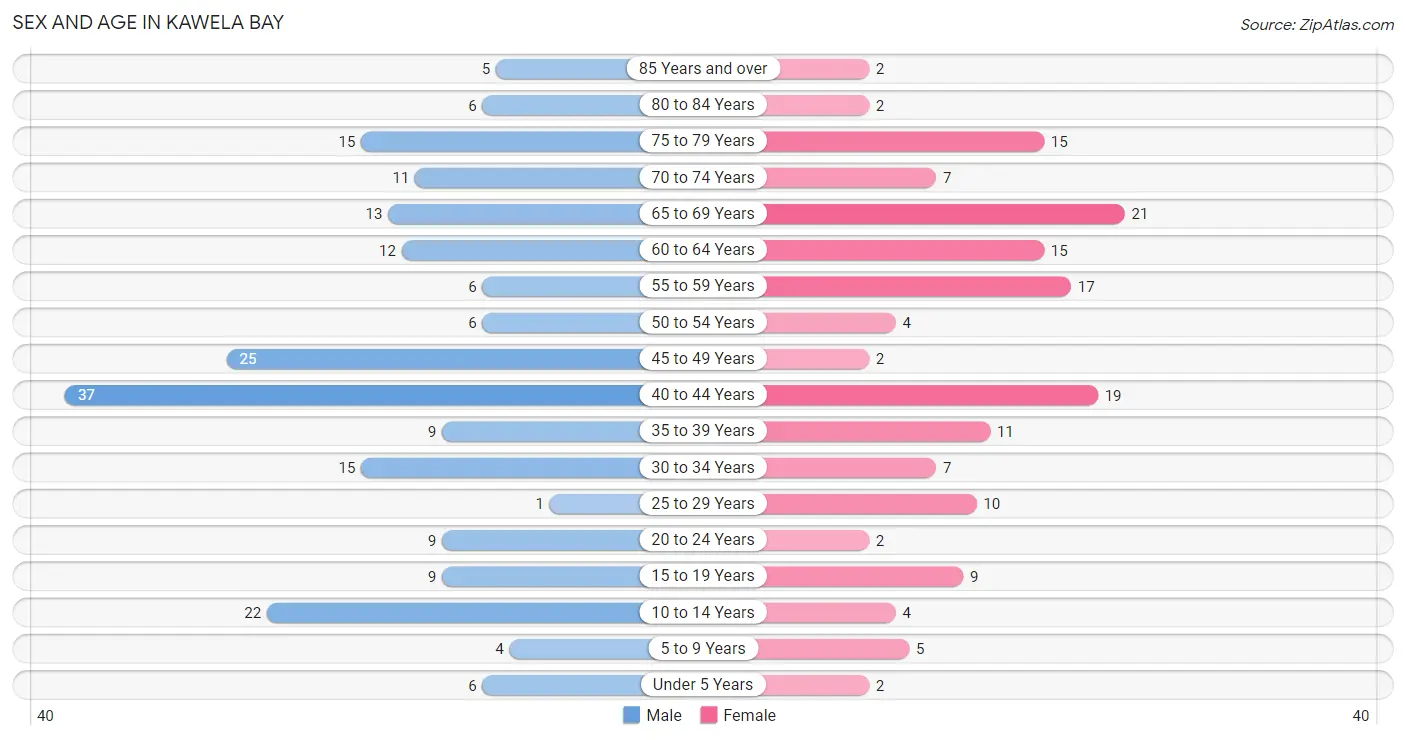
Sex and Age in Kawela Bay
Sex and Age in Kawela Bay
The most populous age groups in Kawela Bay are 40 to 44 Years (37 | 17.5%) for men and 65 to 69 Years (21 | 13.6%) for women.
| Age Bracket | Male | Female |
| Under 5 Years | 6 (2.8%) | 2 (1.3%) |
| 5 to 9 Years | 4 (1.9%) | 5 (3.3%) |
| 10 to 14 Years | 22 (10.4%) | 4 (2.6%) |
| 15 to 19 Years | 9 (4.3%) | 9 (5.8%) |
| 20 to 24 Years | 9 (4.3%) | 2 (1.3%) |
| 25 to 29 Years | 1 (0.5%) | 10 (6.5%) |
| 30 to 34 Years | 15 (7.1%) | 7 (4.5%) |
| 35 to 39 Years | 9 (4.3%) | 11 (7.1%) |
| 40 to 44 Years | 37 (17.5%) | 19 (12.3%) |
| 45 to 49 Years | 25 (11.8%) | 2 (1.3%) |
| 50 to 54 Years | 6 (2.8%) | 4 (2.6%) |
| 55 to 59 Years | 6 (2.8%) | 17 (11.0%) |
| 60 to 64 Years | 12 (5.7%) | 15 (9.7%) |
| 65 to 69 Years | 13 (6.2%) | 21 (13.6%) |
| 70 to 74 Years | 11 (5.2%) | 7 (4.5%) |
| 75 to 79 Years | 15 (7.1%) | 15 (9.7%) |
| 80 to 84 Years | 6 (2.8%) | 2 (1.3%) |
| 85 Years and over | 5 (2.4%) | 2 (1.3%) |
| Total | 211 (100.0%) | 154 (100.0%) |
Families and Households in Kawela Bay
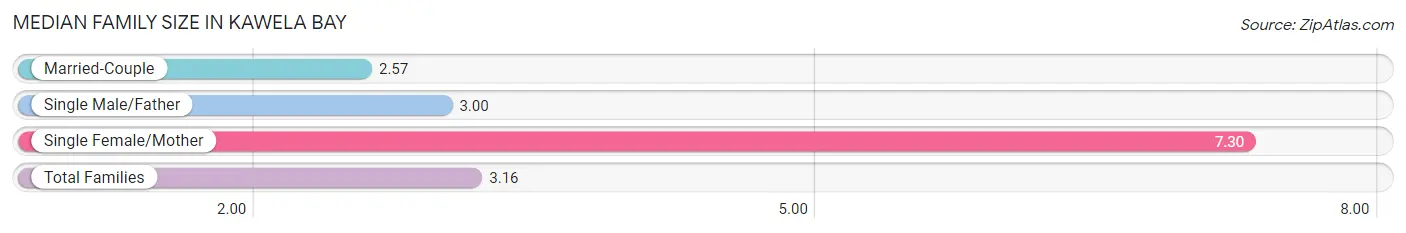
Median Family Size in Kawela Bay
The median family size in Kawela Bay is 3.16 persons per family, with single female/mother families (10 | 12.3%) accounting for the largest median family size of 7.3 persons per family. On the other hand, married-couple families (70 | 86.4%) represent the smallest median family size with 2.57 persons per family.
| Family Type | # Families | Family Size |
| Married-Couple | 70 (86.4%) | 2.57 |
| Single Male/Father | 1 (1.2%) | 3.00 |
| Single Female/Mother | 10 (12.3%) | 7.30 |
| Total Families | 81 (100.0%) | 3.16 |
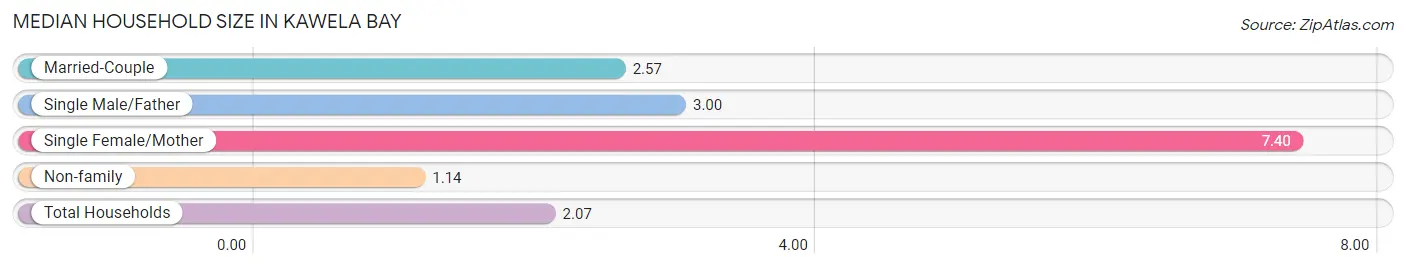
Median Household Size in Kawela Bay
The median household size in Kawela Bay is 2.07 persons per household, with single female/mother households (10 | 5.7%) accounting for the largest median household size of 7.4 persons per household. non-family households (95 | 54.0%) represent the smallest median household size with 1.14 persons per household.
| Household Type | # Households | Household Size |
| Married-Couple | 70 (39.8%) | 2.57 |
| Single Male/Father | 1 (0.6%) | 3.00 |
| Single Female/Mother | 10 (5.7%) | 7.40 |
| Non-family | 95 (54.0%) | 1.14 |
| Total Households | 176 (100.0%) | 2.07 |
Household Size by Marriage Status in Kawela Bay
Out of a total of 176 households in Kawela Bay, 81 (46.0%) are family households, while 95 (54.0%) are nonfamily households. The most numerous type of family households are 2-person households, comprising 50, and the most common type of nonfamily households are 1-person households, comprising 83.
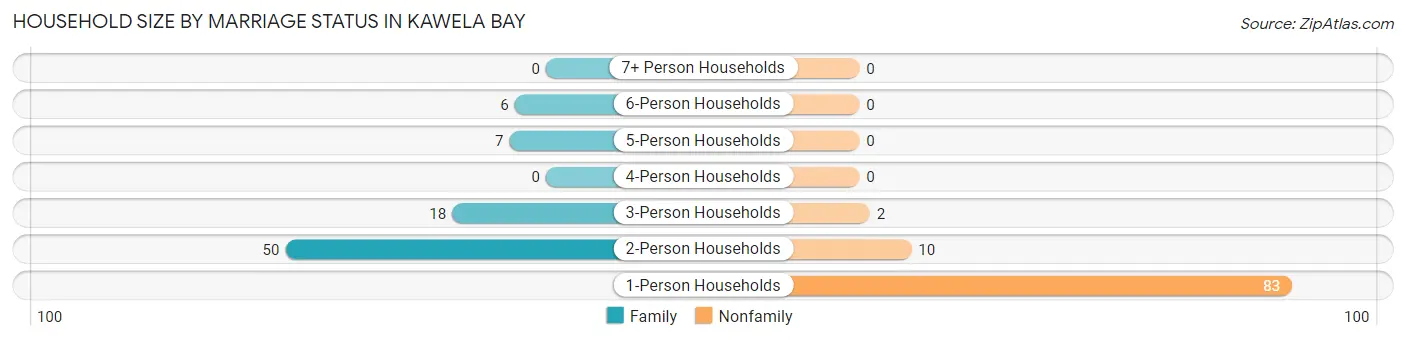
| Household Size | Family Households | Nonfamily Households |
| 1-Person Households | - | 83 (47.2%) |
| 2-Person Households | 50 (28.4%) | 10 (5.7%) |
| 3-Person Households | 18 (10.2%) | 2 (1.1%) |
| 4-Person Households | 0 (0.0%) | 0 (0.0%) |
| 5-Person Households | 7 (4.0%) | 0 (0.0%) |
| 6-Person Households | 6 (3.4%) | 0 (0.0%) |
| 7+ Person Households | 0 (0.0%) | 0 (0.0%) |
| Total | 81 (46.0%) | 95 (54.0%) |
Female Fertility in Kawela Bay
Fertility by Age in Kawela Bay
| Age Bracket | Women with Births | Births / 1,000 Women |
| 15 to 19 years | 0 (0.0%) | 0.0 |
| 20 to 34 years | 0 (0.0%) | 0.0 |
| 35 to 50 years | 0 (0.0%) | 0.0 |
| Total | 0 (0.0%) | 0.0 |
Fertility by Age by Marriage Status in Kawela Bay
| Age Bracket | Married | Unmarried |
| 15 to 19 years | 0 (0.0%) | 0 (0.0%) |
| 20 to 34 years | 0 (0.0%) | 0 (0.0%) |
| 35 to 50 years | 0 (0.0%) | 0 (0.0%) |
| Total | 0 (0.0%) | 0 (0.0%) |
Fertility by Education in Kawela Bay
| Educational Attainment | Women with Births | Births / 1,000 Women |
| Less than High School | 0 (0.0%) | 0.0 |
| High School Diploma | 0 (0.0%) | 0.0 |
| College or Associate's Degree | 0 (0.0%) | 0.0 |
| Bachelor's Degree | 0 (0.0%) | 0.0 |
| Graduate Degree | 0 (0.0%) | 0.0 |
| Total | 0 (0.0%) | 0.0 |
Fertility by Education by Marriage Status in Kawela Bay
| Educational Attainment | Married | Unmarried |
| Less than High School | 0 (0.0%) | 0 (0.0%) |
| High School Diploma | 0 (0.0%) | 0 (0.0%) |
| College or Associate's Degree | 0 (0.0%) | 0 (0.0%) |
| Bachelor's Degree | 0 (0.0%) | 0 (0.0%) |
| Graduate Degree | 0 (0.0%) | 0 (0.0%) |
| Total | 0 (0.0%) | 0 (0.0%) |
Employment Characteristics in Kawela Bay
Employment by Class of Employer in Kawela Bay
Among the 178 employed individuals in Kawela Bay, private company employees (85 | 47.7%), self-employed (not incorporated) (31 | 17.4%), and federal government employees (18 | 10.1%) make up the most common classes of employment.
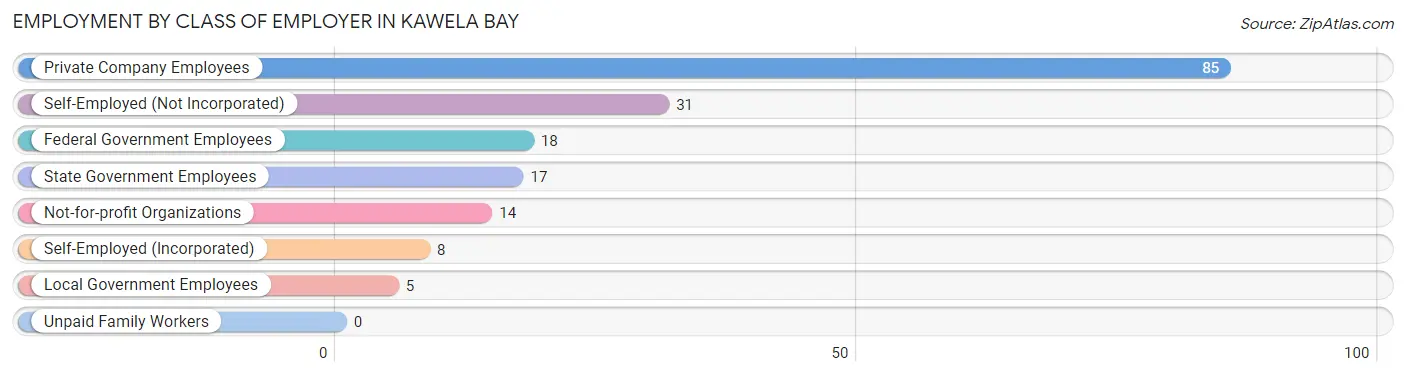
| Employer Class | # Employees | % Employees |
| Private Company Employees | 85 | 47.7% |
| Self-Employed (Incorporated) | 8 | 4.5% |
| Self-Employed (Not Incorporated) | 31 | 17.4% |
| Not-for-profit Organizations | 14 | 7.9% |
| Local Government Employees | 5 | 2.8% |
| State Government Employees | 17 | 9.6% |
| Federal Government Employees | 18 | 10.1% |
| Unpaid Family Workers | 0 | 0.0% |
| Total | 178 | 100.0% |
Employment Status by Age in Kawela Bay
According to the labor force statistics for Kawela Bay, out of the total population over 16 years of age (312), 61.5% or 192 individuals are in the labor force, with 2.2% or 4 of them unemployed. The age group with the highest labor force participation rate is 30 to 34 years, with 90.9% or 20 individuals in the labor force. Within the labor force, the 55 to 59 years age range has the highest percentage of unemployed individuals, with 10.5% or 2 of them being unemployed.
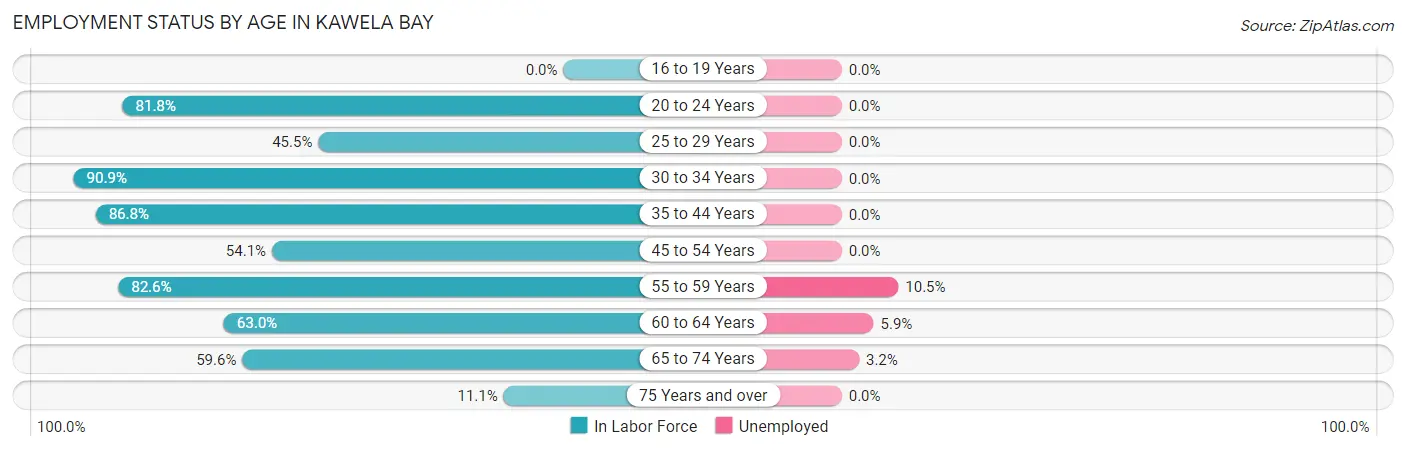
| Age Bracket | In Labor Force | Unemployed |
| 16 to 19 Years | 0 (0.0%) | 0 (0.0%) |
| 20 to 24 Years | 9 (81.8%) | 0 (0.0%) |
| 25 to 29 Years | 5 (45.5%) | 0 (0.0%) |
| 30 to 34 Years | 20 (90.9%) | 0 (0.0%) |
| 35 to 44 Years | 66 (86.8%) | 0 (0.0%) |
| 45 to 54 Years | 20 (54.1%) | 0 (0.0%) |
| 55 to 59 Years | 19 (82.6%) | 2 (10.5%) |
| 60 to 64 Years | 17 (63.0%) | 1 (5.9%) |
| 65 to 74 Years | 31 (59.6%) | 1 (3.2%) |
| 75 Years and over | 5 (11.1%) | 0 (0.0%) |
| Total | 192 (61.5%) | 4 (2.2%) |
Employment Status by Educational Attainment in Kawela Bay
According to labor force statistics for Kawela Bay, 75.0% of individuals (147) out of the total population between 25 and 64 years of age (196) are in the labor force, with 2.1% or 3 of them being unemployed. The group with the highest labor force participation rate are those with the educational attainment of bachelor's degree or higher, with 95.9% or 94 individuals in the labor force. Within the labor force, individuals with bachelor's degree or higher education have the highest percentage of unemployment, with 3.2% or 3 of them being unemployed.
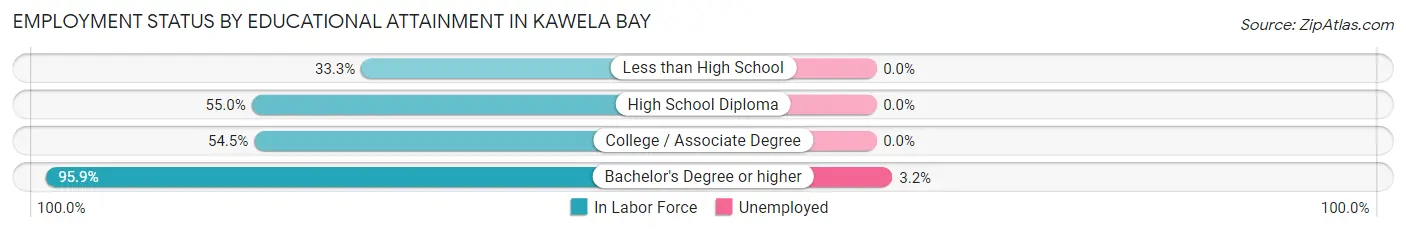
| Educational Attainment | In Labor Force | Unemployed |
| Less than High School | 1 (33.3%) | 0 (0.0%) |
| High School Diploma | 22 (55.0%) | 0 (0.0%) |
| College / Associate Degree | 30 (54.5%) | 0 (0.0%) |
| Bachelor's Degree or higher | 94 (95.9%) | 3 (3.2%) |
| Total | 147 (75.0%) | 4 (2.1%) |
Employment Occupations by Sex in Kawela Bay
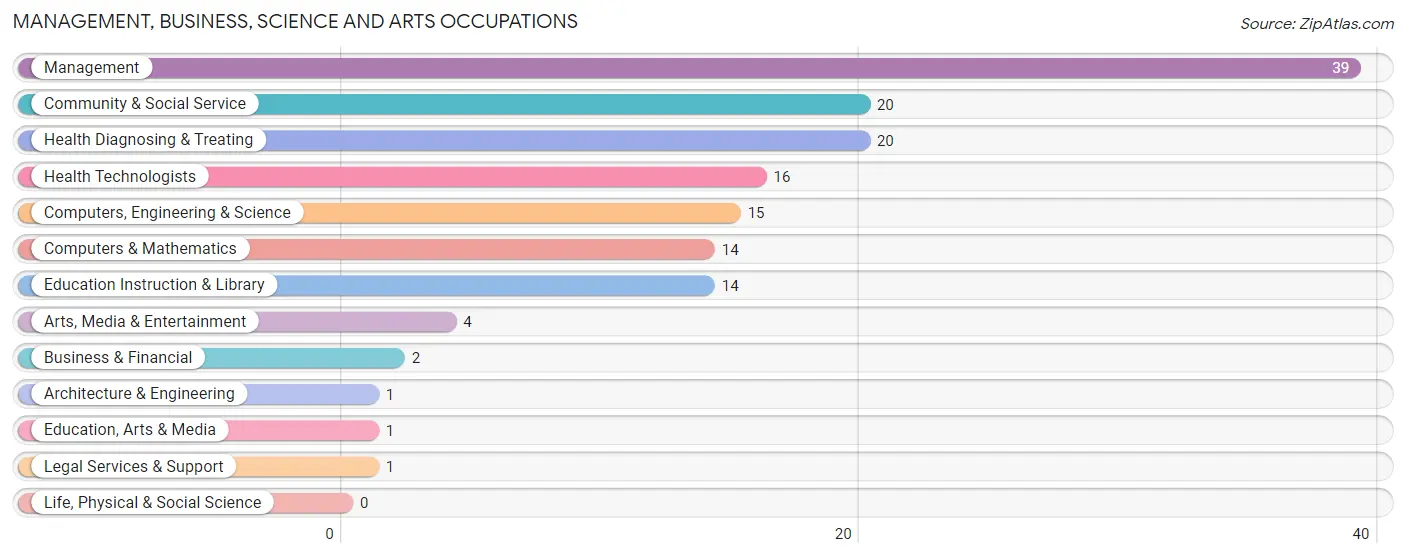
Management, Business, Science and Arts Occupations
The most common Management, Business, Science and Arts occupations in Kawela Bay are Management (39 | 22.2%), Community & Social Service (20 | 11.4%), Health Diagnosing & Treating (20 | 11.4%), Health Technologists (16 | 9.1%), and Computers, Engineering & Science (15 | 8.5%).
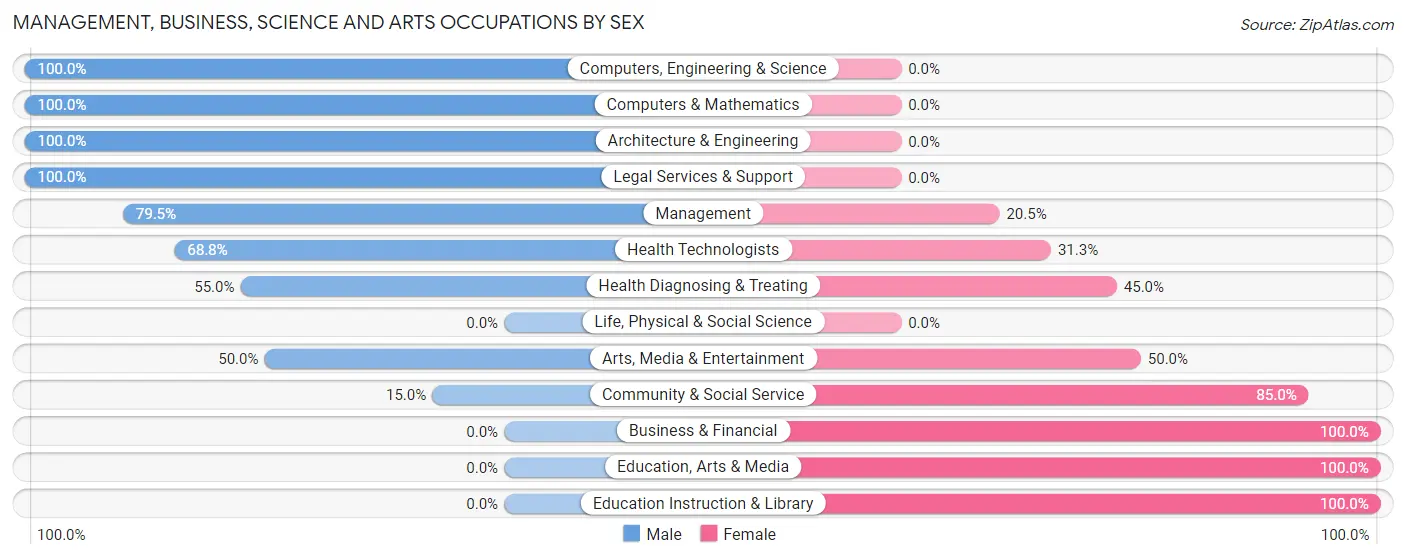
Management, Business, Science and Arts Occupations by Sex
Within the Management, Business, Science and Arts occupations in Kawela Bay, the most male-oriented occupations are Computers, Engineering & Science (100.0%), Computers & Mathematics (100.0%), and Architecture & Engineering (100.0%), while the most female-oriented occupations are Business & Financial (100.0%), Education, Arts & Media (100.0%), and Education Instruction & Library (100.0%).
| Occupation | Male | Female |
| Management | 31 (79.5%) | 8 (20.5%) |
| Business & Financial | 0 (0.0%) | 2 (100.0%) |
| Computers, Engineering & Science | 15 (100.0%) | 0 (0.0%) |
| Computers & Mathematics | 14 (100.0%) | 0 (0.0%) |
| Architecture & Engineering | 1 (100.0%) | 0 (0.0%) |
| Life, Physical & Social Science | 0 (0.0%) | 0 (0.0%) |
| Community & Social Service | 3 (15.0%) | 17 (85.0%) |
| Education, Arts & Media | 0 (0.0%) | 1 (100.0%) |
| Legal Services & Support | 1 (100.0%) | 0 (0.0%) |
| Education Instruction & Library | 0 (0.0%) | 14 (100.0%) |
| Arts, Media & Entertainment | 2 (50.0%) | 2 (50.0%) |
| Health Diagnosing & Treating | 11 (55.0%) | 9 (45.0%) |
| Health Technologists | 11 (68.8%) | 5 (31.2%) |
| Total (Category) | 60 (62.5%) | 36 (37.5%) |
| Total (Overall) | 98 (55.7%) | 78 (44.3%) |
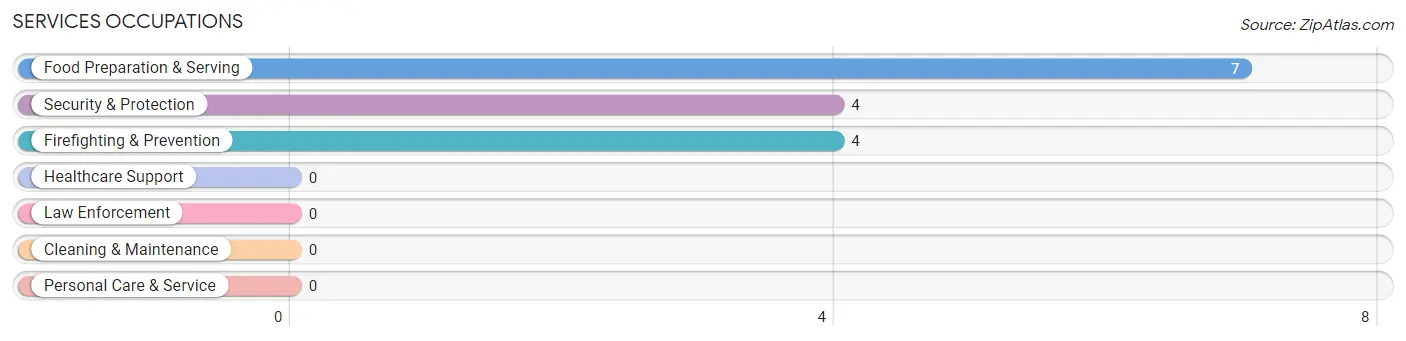
Services Occupations
The most common Services occupations in Kawela Bay are Food Preparation & Serving (7 | 4.0%), Security & Protection (4 | 2.3%), and Firefighting & Prevention (4 | 2.3%).
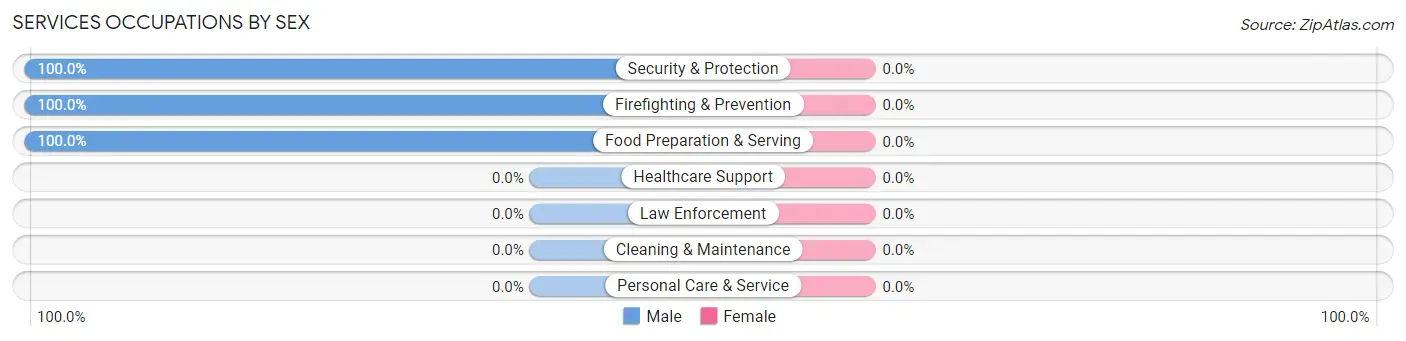
Services Occupations by Sex
| Occupation | Male | Female |
| Healthcare Support | 0 (0.0%) | 0 (0.0%) |
| Security & Protection | 4 (100.0%) | 0 (0.0%) |
| Firefighting & Prevention | 4 (100.0%) | 0 (0.0%) |
| Law Enforcement | 0 (0.0%) | 0 (0.0%) |
| Food Preparation & Serving | 7 (100.0%) | 0 (0.0%) |
| Cleaning & Maintenance | 0 (0.0%) | 0 (0.0%) |
| Personal Care & Service | 0 (0.0%) | 0 (0.0%) |
| Total (Category) | 11 (100.0%) | 0 (0.0%) |
| Total (Overall) | 98 (55.7%) | 78 (44.3%) |
Sales and Office Occupations
The most common Sales and Office occupations in Kawela Bay are Sales & Related (33 | 18.8%), and Office & Administration (18 | 10.2%).
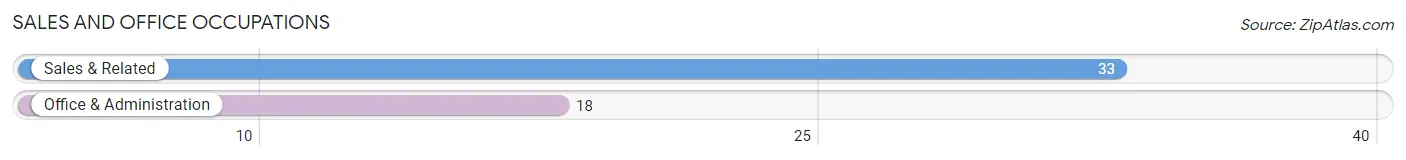
Sales and Office Occupations by Sex
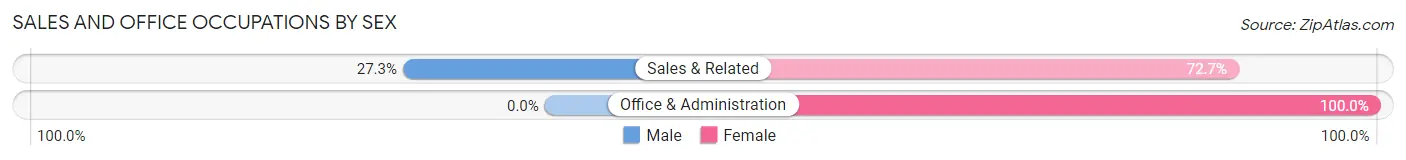
| Occupation | Male | Female |
| Sales & Related | 9 (27.3%) | 24 (72.7%) |
| Office & Administration | 0 (0.0%) | 18 (100.0%) |
| Total (Category) | 9 (17.6%) | 42 (82.4%) |
| Total (Overall) | 98 (55.7%) | 78 (44.3%) |
Natural Resources, Construction and Maintenance Occupations
The most common Natural Resources, Construction and Maintenance occupations in Kawela Bay are , and Construction & Extraction (10 | 5.7%).
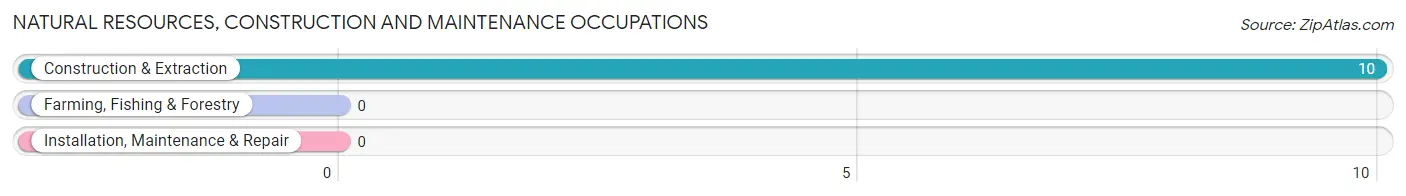
Natural Resources, Construction and Maintenance Occupations by Sex
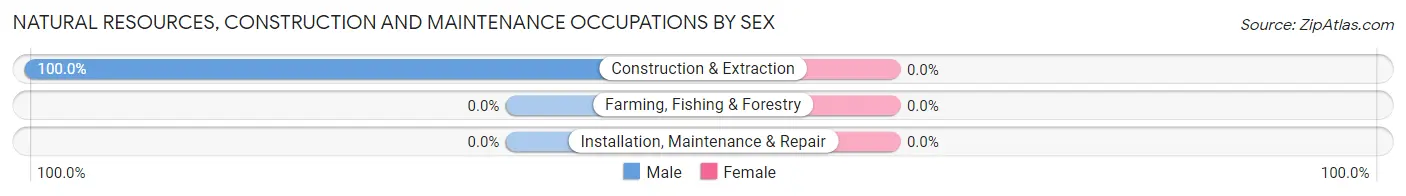
| Occupation | Male | Female |
| Farming, Fishing & Forestry | 0 (0.0%) | 0 (0.0%) |
| Construction & Extraction | 10 (100.0%) | 0 (0.0%) |
| Installation, Maintenance & Repair | 0 (0.0%) | 0 (0.0%) |
| Total (Category) | 10 (100.0%) | 0 (0.0%) |
| Total (Overall) | 98 (55.7%) | 78 (44.3%) |
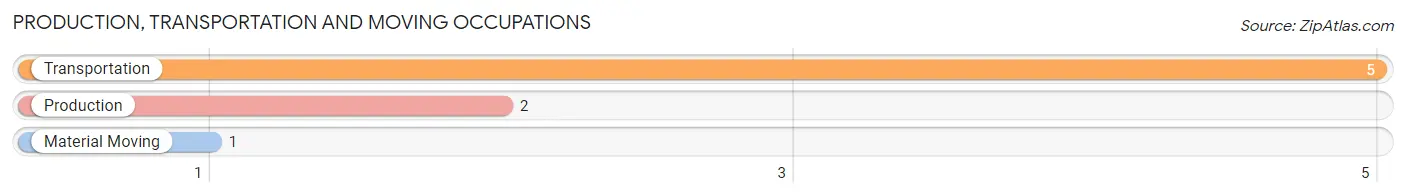
Production, Transportation and Moving Occupations
The most common Production, Transportation and Moving occupations in Kawela Bay are Transportation (5 | 2.8%), Production (2 | 1.1%), and Material Moving (1 | 0.6%).
Production, Transportation and Moving Occupations by Sex
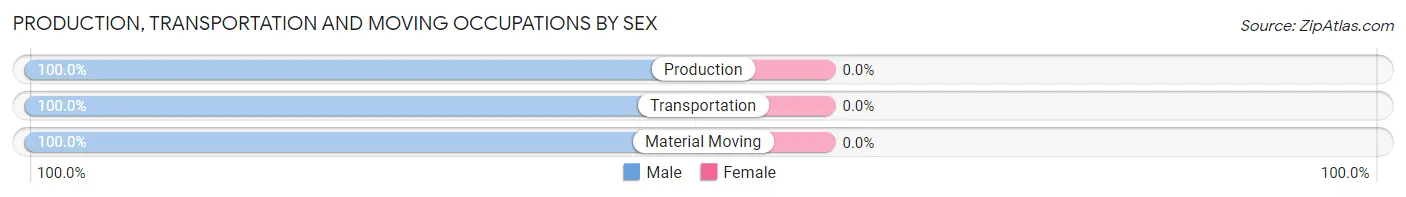
| Occupation | Male | Female |
| Production | 2 (100.0%) | 0 (0.0%) |
| Transportation | 5 (100.0%) | 0 (0.0%) |
| Material Moving | 1 (100.0%) | 0 (0.0%) |
| Total (Category) | 8 (100.0%) | 0 (0.0%) |
| Total (Overall) | 98 (55.7%) | 78 (44.3%) |
Employment Industries by Sex in Kawela Bay
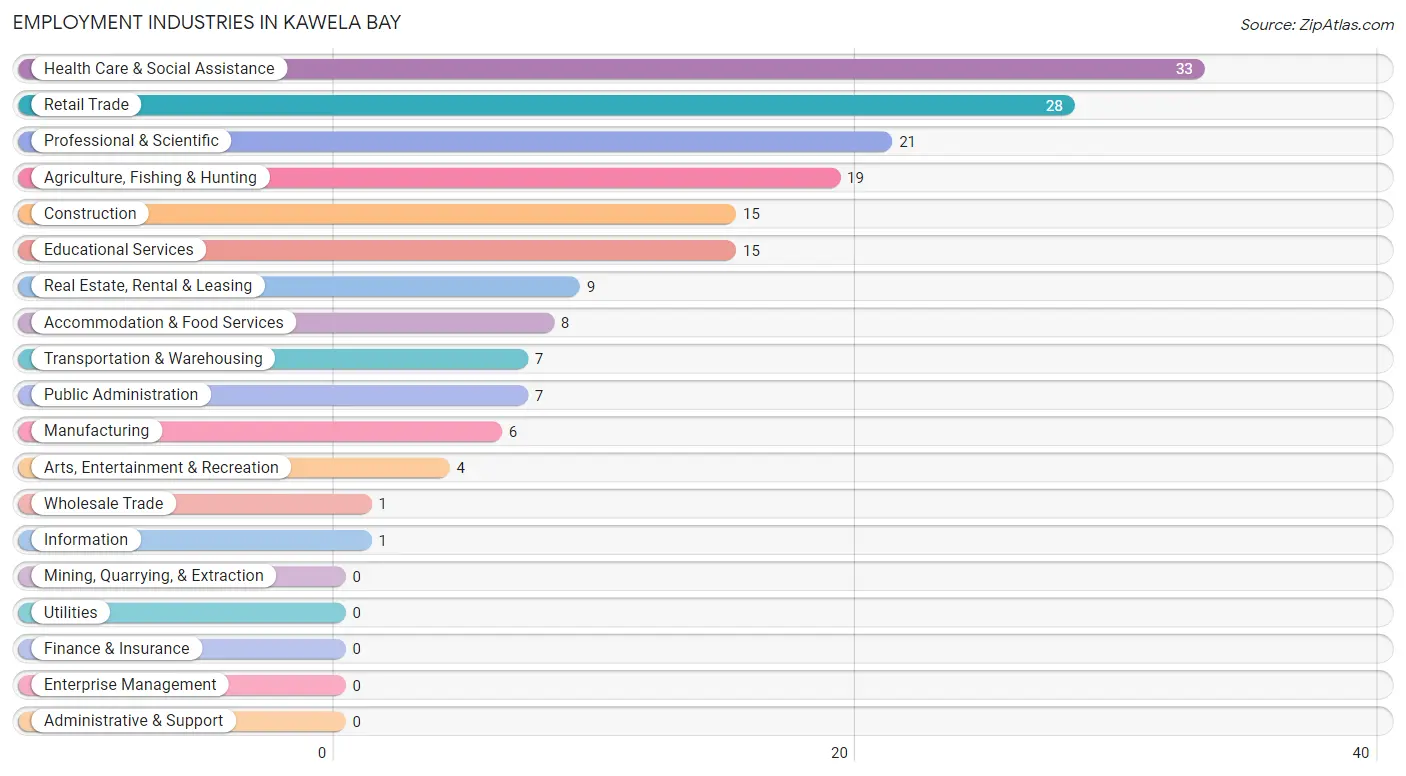
Employment Industries in Kawela Bay
The major employment industries in Kawela Bay include Health Care & Social Assistance (33 | 18.8%), Retail Trade (28 | 15.9%), Professional & Scientific (21 | 11.9%), Agriculture, Fishing & Hunting (19 | 10.8%), and Construction (15 | 8.5%).
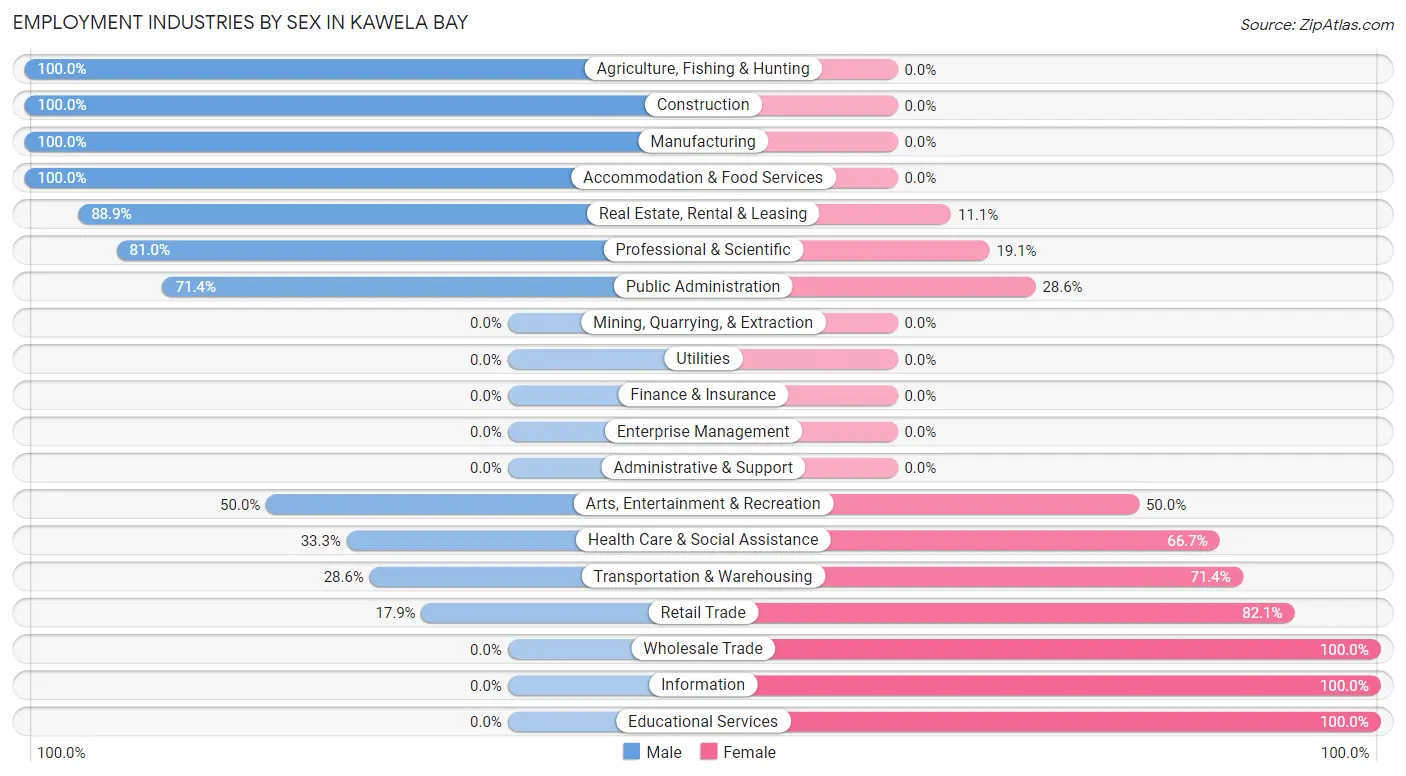
Employment Industries by Sex in Kawela Bay
The Kawela Bay industries that see more men than women are Agriculture, Fishing & Hunting (100.0%), Construction (100.0%), and Manufacturing (100.0%), whereas the industries that tend to have a higher number of women are Wholesale Trade (100.0%), Information (100.0%), and Educational Services (100.0%).
| Industry | Male | Female |
| Agriculture, Fishing & Hunting | 19 (100.0%) | 0 (0.0%) |
| Mining, Quarrying, & Extraction | 0 (0.0%) | 0 (0.0%) |
| Construction | 15 (100.0%) | 0 (0.0%) |
| Manufacturing | 6 (100.0%) | 0 (0.0%) |
| Wholesale Trade | 0 (0.0%) | 1 (100.0%) |
| Retail Trade | 5 (17.9%) | 23 (82.1%) |
| Transportation & Warehousing | 2 (28.6%) | 5 (71.4%) |
| Utilities | 0 (0.0%) | 0 (0.0%) |
| Information | 0 (0.0%) | 1 (100.0%) |
| Finance & Insurance | 0 (0.0%) | 0 (0.0%) |
| Real Estate, Rental & Leasing | 8 (88.9%) | 1 (11.1%) |
| Professional & Scientific | 17 (80.9%) | 4 (19.1%) |
| Enterprise Management | 0 (0.0%) | 0 (0.0%) |
| Administrative & Support | 0 (0.0%) | 0 (0.0%) |
| Educational Services | 0 (0.0%) | 15 (100.0%) |
| Health Care & Social Assistance | 11 (33.3%) | 22 (66.7%) |
| Arts, Entertainment & Recreation | 2 (50.0%) | 2 (50.0%) |
| Accommodation & Food Services | 8 (100.0%) | 0 (0.0%) |
| Public Administration | 5 (71.4%) | 2 (28.6%) |
| Total | 98 (55.7%) | 78 (44.3%) |
Education in Kawela Bay
School Enrollment in Kawela Bay
The most common levels of schooling among the 68 students in Kawela Bay are middle school (24 | 35.3%), high school (18 | 26.5%), and college / undergraduate (15 | 22.1%).
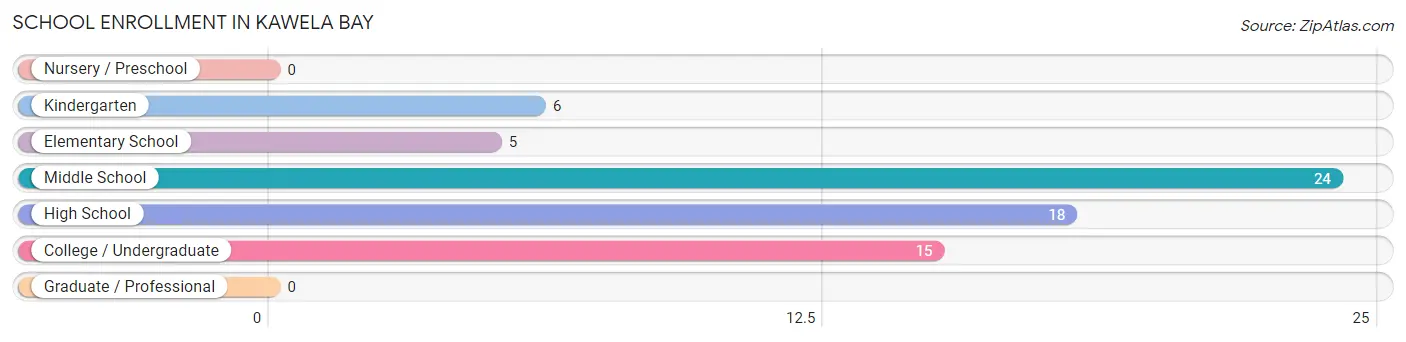
| School Level | # Students | % Students |
| Nursery / Preschool | 0 | 0.0% |
| Kindergarten | 6 | 8.8% |
| Elementary School | 5 | 7.3% |
| Middle School | 24 | 35.3% |
| High School | 18 | 26.5% |
| College / Undergraduate | 15 | 22.1% |
| Graduate / Professional | 0 | 0.0% |
| Total | 68 | 100.0% |
School Enrollment by Age by Funding Source in Kawela Bay
Out of a total of 68 students who are enrolled in schools in Kawela Bay, 13 (19.1%) attend a private institution, while the remaining 55 (80.9%) are enrolled in public schools. The age group of 35 years and over has the highest likelihood of being enrolled in private schools, with 13 (86.7% in the age bracket) enrolled. Conversely, the age group of 5 to 9 year old has the lowest likelihood of being enrolled in a private school, with 9 (100.0% in the age bracket) attending a public institution.
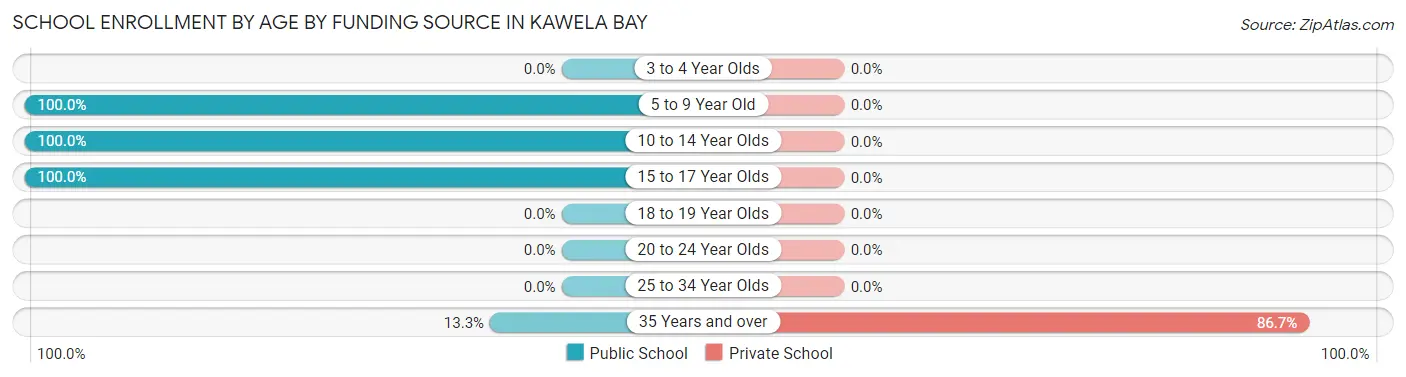
| Age Bracket | Public School | Private School |
| 3 to 4 Year Olds | 0 (0.0%) | 0 (0.0%) |
| 5 to 9 Year Old | 9 (100.0%) | 0 (0.0%) |
| 10 to 14 Year Olds | 26 (100.0%) | 0 (0.0%) |
| 15 to 17 Year Olds | 18 (100.0%) | 0 (0.0%) |
| 18 to 19 Year Olds | 0 (0.0%) | 0 (0.0%) |
| 20 to 24 Year Olds | 0 (0.0%) | 0 (0.0%) |
| 25 to 34 Year Olds | 0 (0.0%) | 0 (0.0%) |
| 35 Years and over | 2 (13.3%) | 13 (86.7%) |
| Total | 55 (80.9%) | 13 (19.1%) |
Educational Attainment by Field of Study in Kawela Bay
Arts & humanities (44 | 26.4%), business (19 | 11.4%), bio, nature & agricultural (17 | 10.2%), social sciences (13 | 7.8%), and education (12 | 7.2%) are the most common fields of study among 167 individuals in Kawela Bay who have obtained a bachelor's degree or higher.
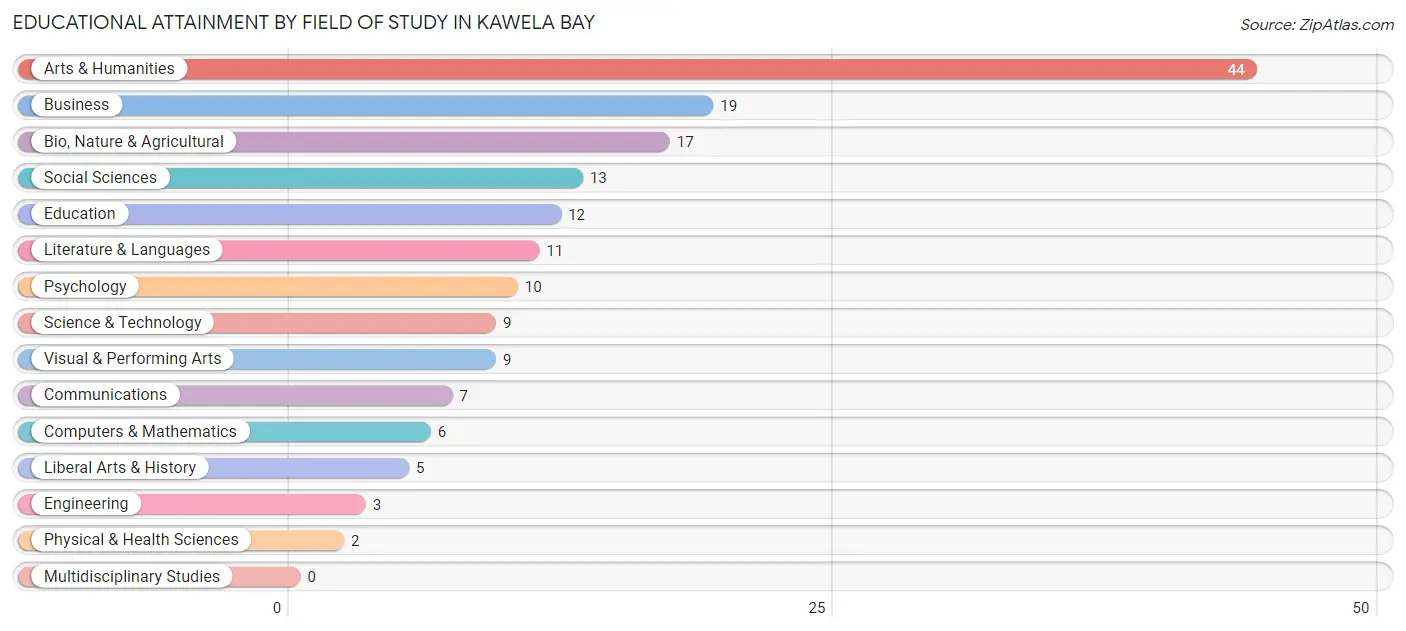
| Field of Study | # Graduates | % Graduates |
| Computers & Mathematics | 6 | 3.6% |
| Bio, Nature & Agricultural | 17 | 10.2% |
| Physical & Health Sciences | 2 | 1.2% |
| Psychology | 10 | 6.0% |
| Social Sciences | 13 | 7.8% |
| Engineering | 3 | 1.8% |
| Multidisciplinary Studies | 0 | 0.0% |
| Science & Technology | 9 | 5.4% |
| Business | 19 | 11.4% |
| Education | 12 | 7.2% |
| Literature & Languages | 11 | 6.6% |
| Liberal Arts & History | 5 | 3.0% |
| Visual & Performing Arts | 9 | 5.4% |
| Communications | 7 | 4.2% |
| Arts & Humanities | 44 | 26.4% |
| Total | 167 | 100.0% |
Transportation & Commute in Kawela Bay
Vehicle Availability by Sex in Kawela Bay
The most prevalent vehicle ownership categories in Kawela Bay are males with 2 vehicles (51, accounting for 49.0%) and females with 2 vehicles (23, making up 68.9%).
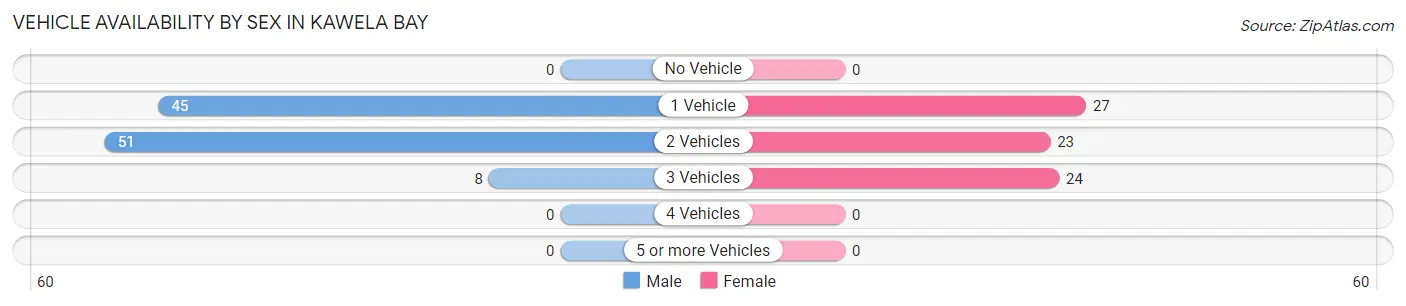
| Vehicles Available | Male | Female |
| No Vehicle | 0 (0.0%) | 0 (0.0%) |
| 1 Vehicle | 45 (43.3%) | 27 (36.5%) |
| 2 Vehicles | 51 (49.0%) | 23 (31.1%) |
| 3 Vehicles | 8 (7.7%) | 24 (32.4%) |
| 4 Vehicles | 0 (0.0%) | 0 (0.0%) |
| 5 or more Vehicles | 0 (0.0%) | 0 (0.0%) |
| Total | 104 (100.0%) | 74 (100.0%) |
Commute Time in Kawela Bay
The most frequently occuring commute durations in Kawela Bay are 15 to 19 minutes (33 commuters, 24.4%), 60 to 89 minutes (23 commuters, 17.0%), and 90 or more minutes (19 commuters, 14.1%).
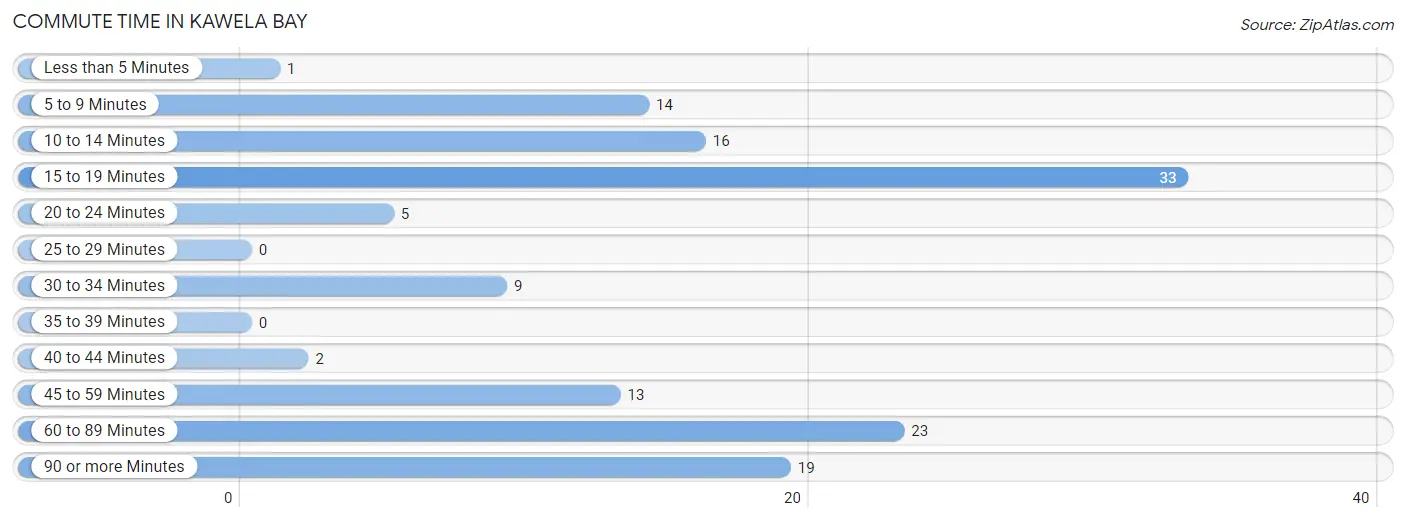
| Commute Time | # Commuters | % Commuters |
| Less than 5 Minutes | 1 | 0.7% |
| 5 to 9 Minutes | 14 | 10.4% |
| 10 to 14 Minutes | 16 | 11.8% |
| 15 to 19 Minutes | 33 | 24.4% |
| 20 to 24 Minutes | 5 | 3.7% |
| 25 to 29 Minutes | 0 | 0.0% |
| 30 to 34 Minutes | 9 | 6.7% |
| 35 to 39 Minutes | 0 | 0.0% |
| 40 to 44 Minutes | 2 | 1.5% |
| 45 to 59 Minutes | 13 | 9.6% |
| 60 to 89 Minutes | 23 | 17.0% |
| 90 or more Minutes | 19 | 14.1% |
Commute Time by Sex in Kawela Bay
The most common commute times in Kawela Bay are 60 to 89 minutes (16 commuters, 21.9%) for males and 15 to 19 minutes (23 commuters, 37.1%) for females.
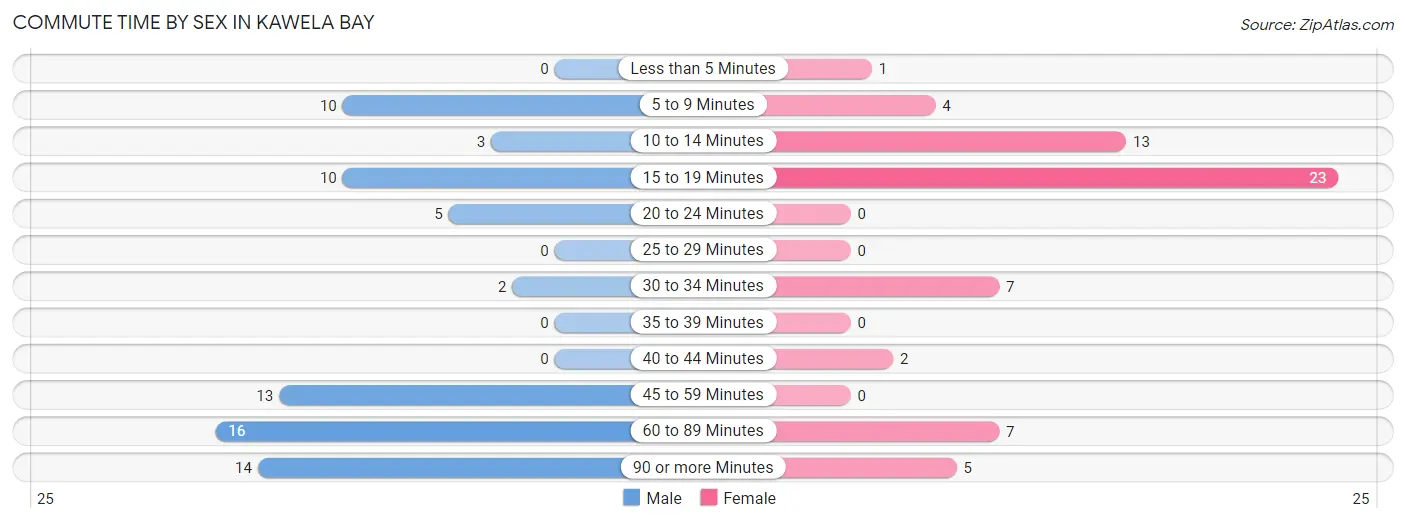
| Commute Time | Male | Female |
| Less than 5 Minutes | 0 (0.0%) | 1 (1.6%) |
| 5 to 9 Minutes | 10 (13.7%) | 4 (6.5%) |
| 10 to 14 Minutes | 3 (4.1%) | 13 (21.0%) |
| 15 to 19 Minutes | 10 (13.7%) | 23 (37.1%) |
| 20 to 24 Minutes | 5 (6.9%) | 0 (0.0%) |
| 25 to 29 Minutes | 0 (0.0%) | 0 (0.0%) |
| 30 to 34 Minutes | 2 (2.7%) | 7 (11.3%) |
| 35 to 39 Minutes | 0 (0.0%) | 0 (0.0%) |
| 40 to 44 Minutes | 0 (0.0%) | 2 (3.2%) |
| 45 to 59 Minutes | 13 (17.8%) | 0 (0.0%) |
| 60 to 89 Minutes | 16 (21.9%) | 7 (11.3%) |
| 90 or more Minutes | 14 (19.2%) | 5 (8.1%) |
Time of Departure to Work by Sex in Kawela Bay
The most frequent times of departure to work in Kawela Bay are 6:00 AM to 6:29 AM (21, 28.8%) for males and 7:30 AM to 7:59 AM (16, 25.8%) for females.
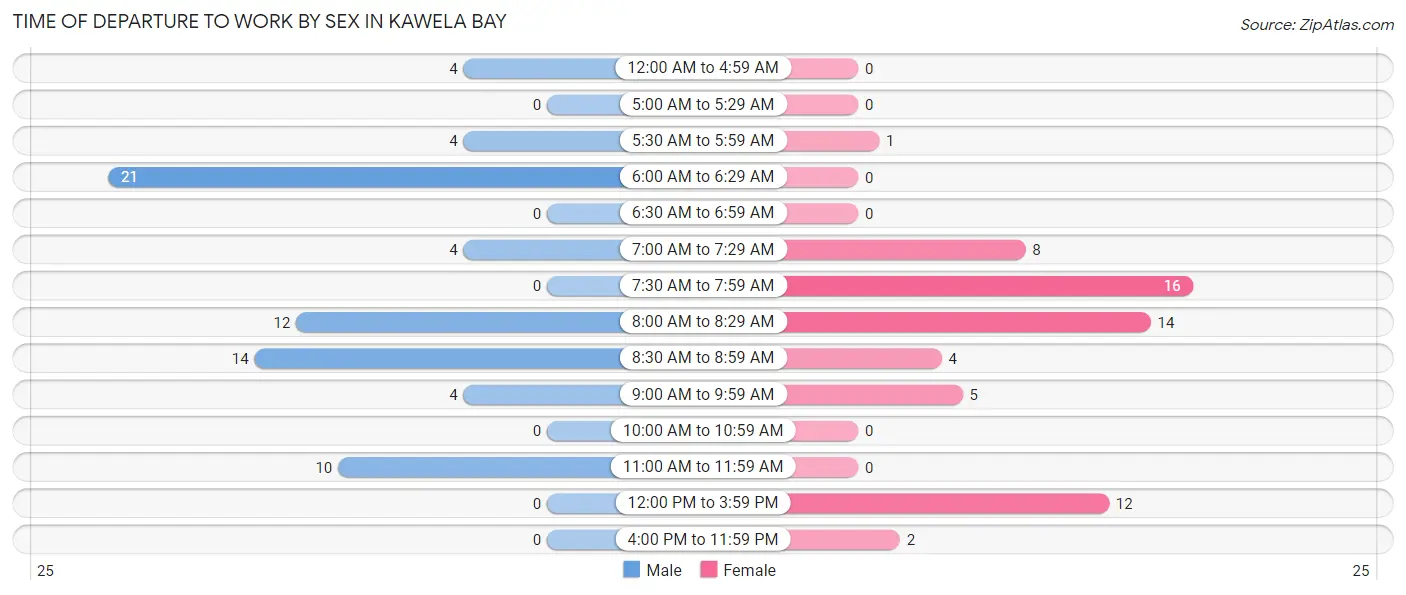
| Time of Departure | Male | Female |
| 12:00 AM to 4:59 AM | 4 (5.5%) | 0 (0.0%) |
| 5:00 AM to 5:29 AM | 0 (0.0%) | 0 (0.0%) |
| 5:30 AM to 5:59 AM | 4 (5.5%) | 1 (1.6%) |
| 6:00 AM to 6:29 AM | 21 (28.8%) | 0 (0.0%) |
| 6:30 AM to 6:59 AM | 0 (0.0%) | 0 (0.0%) |
| 7:00 AM to 7:29 AM | 4 (5.5%) | 8 (12.9%) |
| 7:30 AM to 7:59 AM | 0 (0.0%) | 16 (25.8%) |
| 8:00 AM to 8:29 AM | 12 (16.4%) | 14 (22.6%) |
| 8:30 AM to 8:59 AM | 14 (19.2%) | 4 (6.5%) |
| 9:00 AM to 9:59 AM | 4 (5.5%) | 5 (8.1%) |
| 10:00 AM to 10:59 AM | 0 (0.0%) | 0 (0.0%) |
| 11:00 AM to 11:59 AM | 10 (13.7%) | 0 (0.0%) |
| 12:00 PM to 3:59 PM | 0 (0.0%) | 12 (19.4%) |
| 4:00 PM to 11:59 PM | 0 (0.0%) | 2 (3.2%) |
| Total | 73 (100.0%) | 62 (100.0%) |
Housing Occupancy in Kawela Bay
Occupancy by Ownership in Kawela Bay
Of the total 176 dwellings in Kawela Bay, owner-occupied units account for 144 (81.8%), while renter-occupied units make up 32 (18.2%).
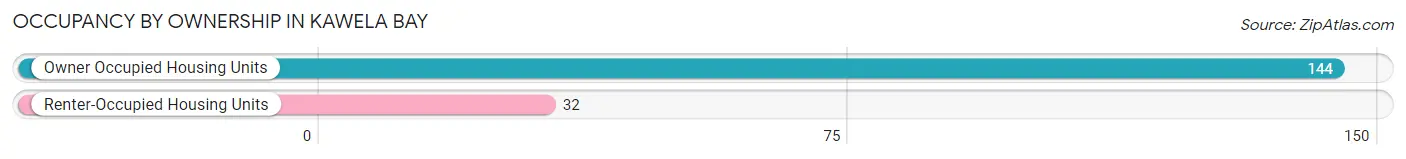
| Occupancy | # Housing Units | % Housing Units |
| Owner Occupied Housing Units | 144 | 81.8% |
| Renter-Occupied Housing Units | 32 | 18.2% |
| Total Occupied Housing Units | 176 | 100.0% |
Occupancy by Household Size in Kawela Bay
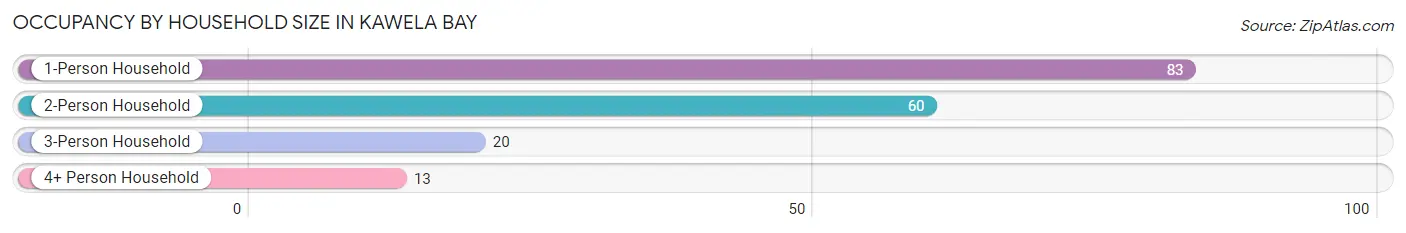
| Household Size | # Housing Units | % Housing Units |
| 1-Person Household | 83 | 47.2% |
| 2-Person Household | 60 | 34.1% |
| 3-Person Household | 20 | 11.4% |
| 4+ Person Household | 13 | 7.4% |
| Total Housing Units | 176 | 100.0% |
Occupancy by Ownership by Household Size in Kawela Bay
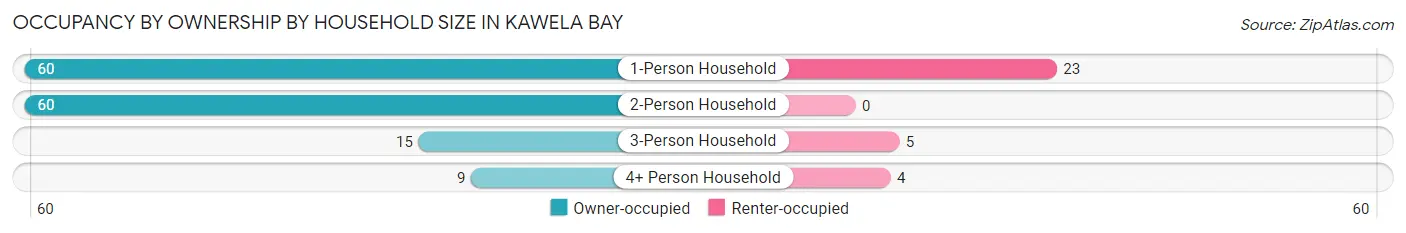
| Household Size | Owner-occupied | Renter-occupied |
| 1-Person Household | 60 (72.3%) | 23 (27.7%) |
| 2-Person Household | 60 (100.0%) | 0 (0.0%) |
| 3-Person Household | 15 (75.0%) | 5 (25.0%) |
| 4+ Person Household | 9 (69.2%) | 4 (30.8%) |
| Total Housing Units | 144 (81.8%) | 32 (18.2%) |
Occupancy by Educational Attainment in Kawela Bay
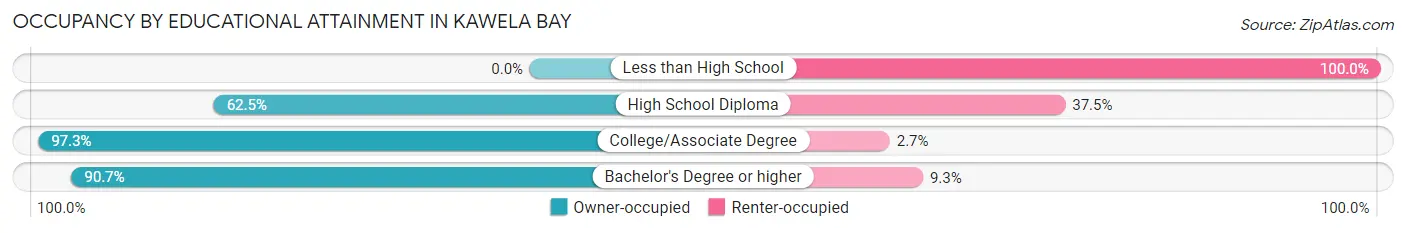
| Household Size | Owner-occupied | Renter-occupied |
| Less than High School | 0 (0.0%) | 10 (100.0%) |
| High School Diploma | 20 (62.5%) | 12 (37.5%) |
| College/Associate Degree | 36 (97.3%) | 1 (2.7%) |
| Bachelor's Degree or higher | 88 (90.7%) | 9 (9.3%) |
Occupancy by Age of Householder in Kawela Bay
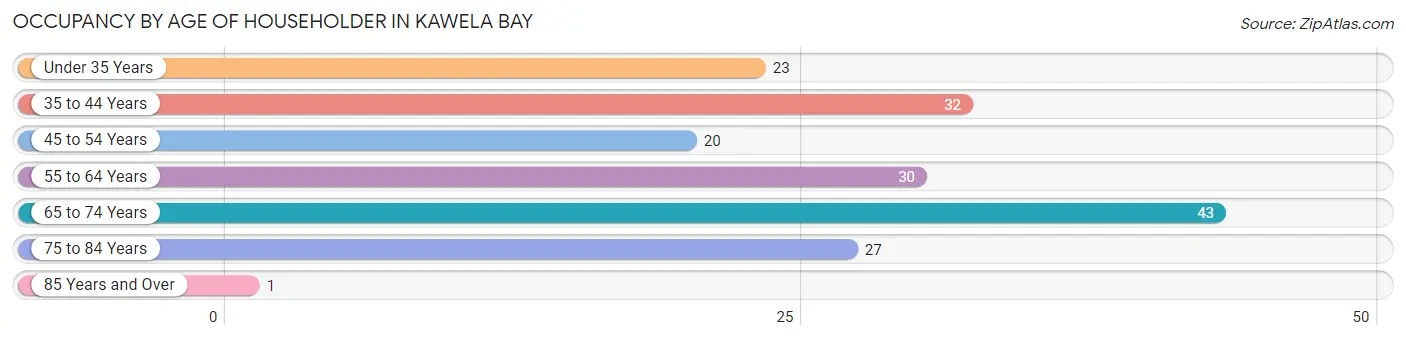
| Age Bracket | # Households | % Households |
| Under 35 Years | 23 | 13.1% |
| 35 to 44 Years | 32 | 18.2% |
| 45 to 54 Years | 20 | 11.4% |
| 55 to 64 Years | 30 | 17.1% |
| 65 to 74 Years | 43 | 24.4% |
| 75 to 84 Years | 27 | 15.3% |
| 85 Years and Over | 1 | 0.6% |
| Total | 176 | 100.0% |
Housing Finances in Kawela Bay
Median Income by Occupancy in Kawela Bay
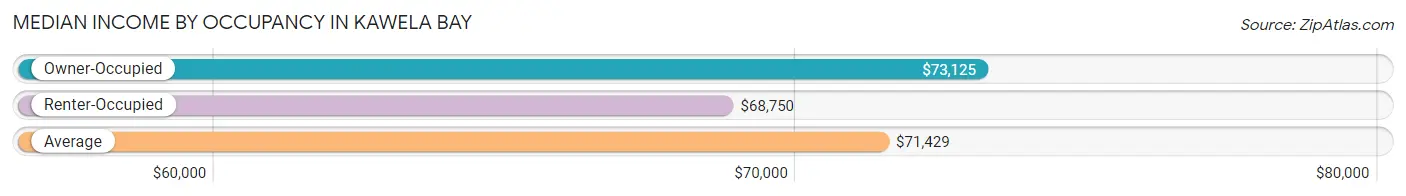
| Occupancy Type | # Households | Median Income |
| Owner-Occupied | 144 (81.8%) | $73,125 |
| Renter-Occupied | 32 (18.2%) | $68,750 |
| Average | 176 (100.0%) | $71,429 |
Occupancy by Householder Income Bracket in Kawela Bay
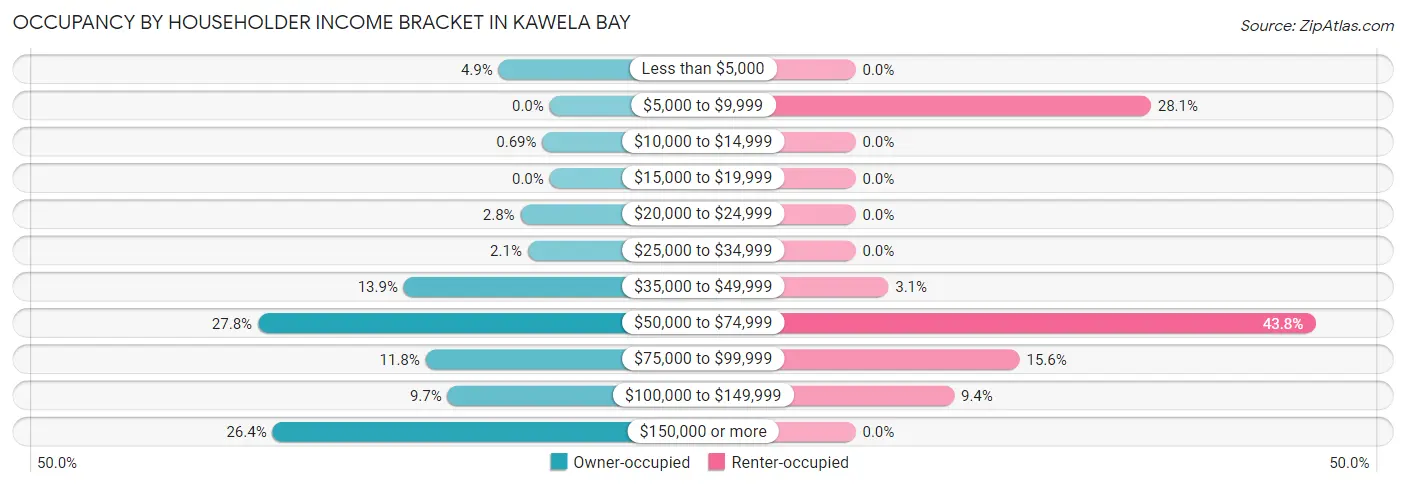
| Income Bracket | Owner-occupied | Renter-occupied |
| Less than $5,000 | 7 (4.9%) | 0 (0.0%) |
| $5,000 to $9,999 | 0 (0.0%) | 9 (28.1%) |
| $10,000 to $14,999 | 1 (0.7%) | 0 (0.0%) |
| $15,000 to $19,999 | 0 (0.0%) | 0 (0.0%) |
| $20,000 to $24,999 | 4 (2.8%) | 0 (0.0%) |
| $25,000 to $34,999 | 3 (2.1%) | 0 (0.0%) |
| $35,000 to $49,999 | 20 (13.9%) | 1 (3.1%) |
| $50,000 to $74,999 | 40 (27.8%) | 14 (43.8%) |
| $75,000 to $99,999 | 17 (11.8%) | 5 (15.6%) |
| $100,000 to $149,999 | 14 (9.7%) | 3 (9.4%) |
| $150,000 or more | 38 (26.4%) | 0 (0.0%) |
| Total | 144 (100.0%) | 32 (100.0%) |
Monthly Housing Cost Tiers in Kawela Bay
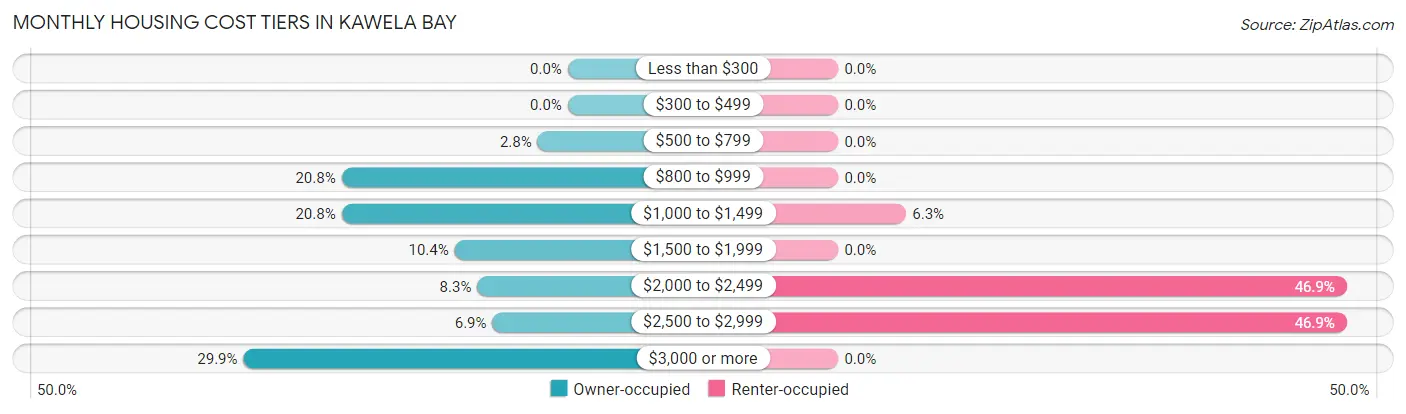
| Monthly Cost | Owner-occupied | Renter-occupied |
| Less than $300 | 0 (0.0%) | 0 (0.0%) |
| $300 to $499 | 0 (0.0%) | 0 (0.0%) |
| $500 to $799 | 4 (2.8%) | 0 (0.0%) |
| $800 to $999 | 30 (20.8%) | 0 (0.0%) |
| $1,000 to $1,499 | 30 (20.8%) | 2 (6.2%) |
| $1,500 to $1,999 | 15 (10.4%) | 0 (0.0%) |
| $2,000 to $2,499 | 12 (8.3%) | 15 (46.9%) |
| $2,500 to $2,999 | 10 (6.9%) | 15 (46.9%) |
| $3,000 or more | 43 (29.9%) | 0 (0.0%) |
| Total | 144 (100.0%) | 32 (100.0%) |
Physical Housing Characteristics in Kawela Bay
Housing Structures in Kawela Bay
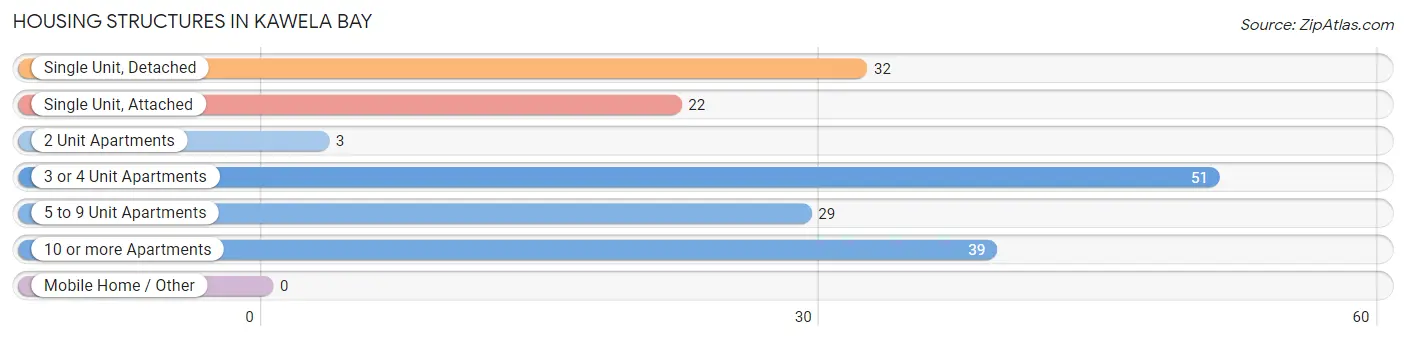
| Structure Type | # Housing Units | % Housing Units |
| Single Unit, Detached | 32 | 18.2% |
| Single Unit, Attached | 22 | 12.5% |
| 2 Unit Apartments | 3 | 1.7% |
| 3 or 4 Unit Apartments | 51 | 29.0% |
| 5 to 9 Unit Apartments | 29 | 16.5% |
| 10 or more Apartments | 39 | 22.2% |
| Mobile Home / Other | 0 | 0.0% |
| Total | 176 | 100.0% |
Housing Structures by Occupancy in Kawela Bay
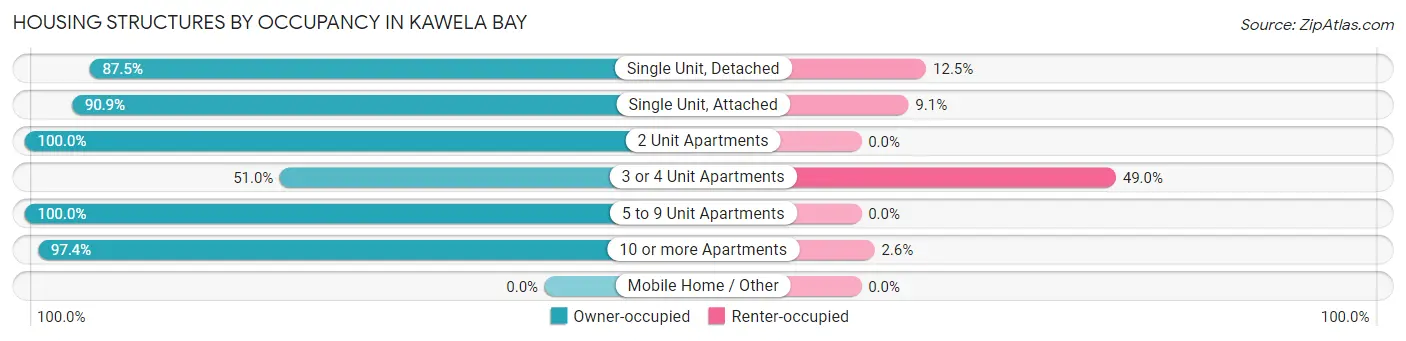
| Structure Type | Owner-occupied | Renter-occupied |
| Single Unit, Detached | 28 (87.5%) | 4 (12.5%) |
| Single Unit, Attached | 20 (90.9%) | 2 (9.1%) |
| 2 Unit Apartments | 3 (100.0%) | 0 (0.0%) |
| 3 or 4 Unit Apartments | 26 (51.0%) | 25 (49.0%) |
| 5 to 9 Unit Apartments | 29 (100.0%) | 0 (0.0%) |
| 10 or more Apartments | 38 (97.4%) | 1 (2.6%) |
| Mobile Home / Other | 0 (0.0%) | 0 (0.0%) |
| Total | 144 (81.8%) | 32 (18.2%) |
Housing Structures by Number of Rooms in Kawela Bay
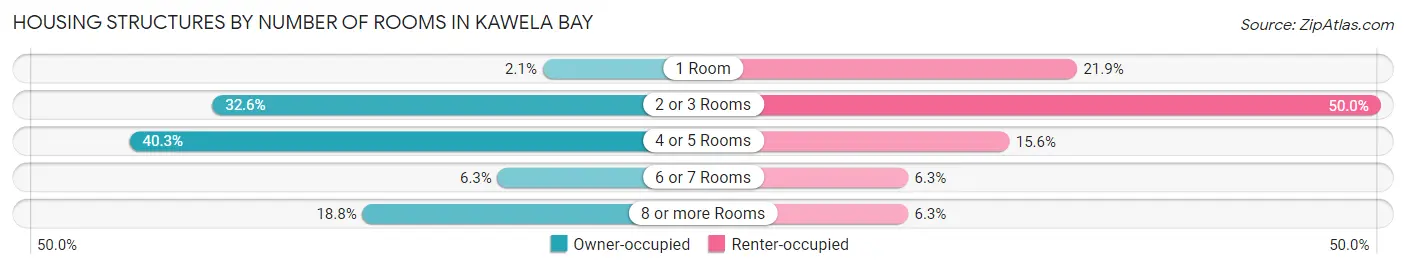
| Number of Rooms | Owner-occupied | Renter-occupied |
| 1 Room | 3 (2.1%) | 7 (21.9%) |
| 2 or 3 Rooms | 47 (32.6%) | 16 (50.0%) |
| 4 or 5 Rooms | 58 (40.3%) | 5 (15.6%) |
| 6 or 7 Rooms | 9 (6.2%) | 2 (6.2%) |
| 8 or more Rooms | 27 (18.8%) | 2 (6.2%) |
| Total | 144 (100.0%) | 32 (100.0%) |
Housing Structure by Heating Type in Kawela Bay
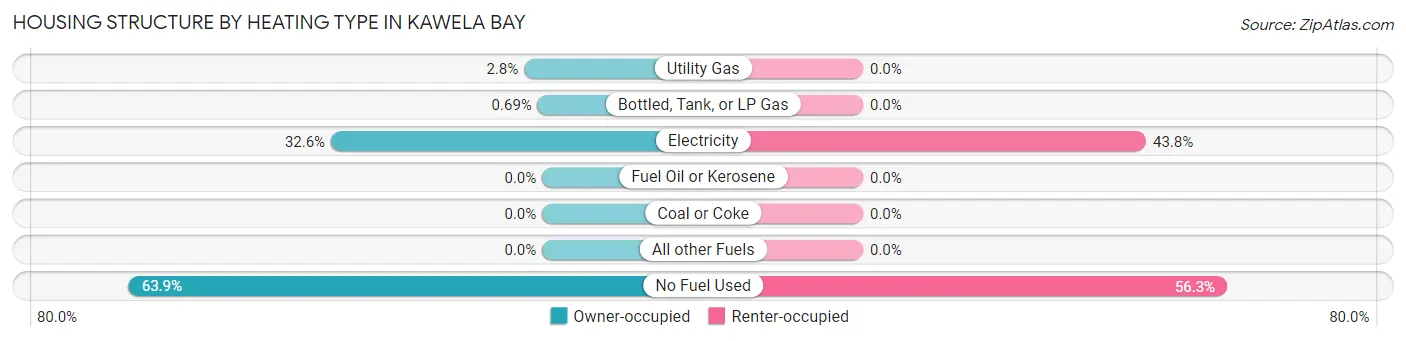
| Heating Type | Owner-occupied | Renter-occupied |
| Utility Gas | 4 (2.8%) | 0 (0.0%) |
| Bottled, Tank, or LP Gas | 1 (0.7%) | 0 (0.0%) |
| Electricity | 47 (32.6%) | 14 (43.8%) |
| Fuel Oil or Kerosene | 0 (0.0%) | 0 (0.0%) |
| Coal or Coke | 0 (0.0%) | 0 (0.0%) |
| All other Fuels | 0 (0.0%) | 0 (0.0%) |
| No Fuel Used | 92 (63.9%) | 18 (56.2%) |
| Total | 144 (100.0%) | 32 (100.0%) |
Household Vehicle Usage in Kawela Bay
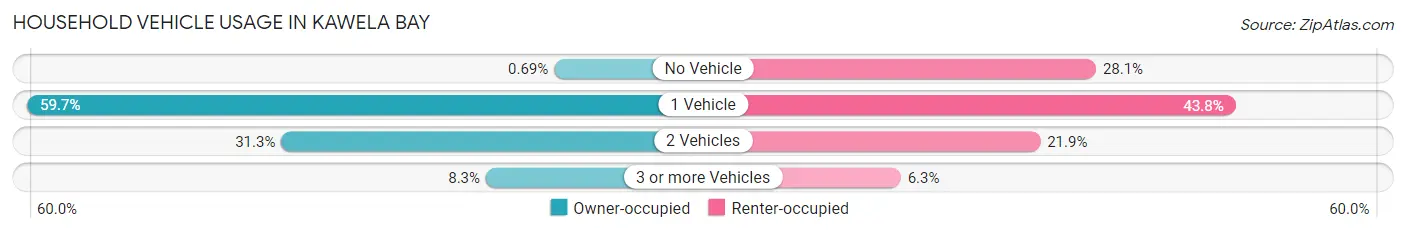
| Vehicles per Household | Owner-occupied | Renter-occupied |
| No Vehicle | 1 (0.7%) | 9 (28.1%) |
| 1 Vehicle | 86 (59.7%) | 14 (43.8%) |
| 2 Vehicles | 45 (31.2%) | 7 (21.9%) |
| 3 or more Vehicles | 12 (8.3%) | 2 (6.2%) |
| Total | 144 (100.0%) | 32 (100.0%) |
Real Estate & Mortgages in Kawela Bay
Real Estate and Mortgage Overview in Kawela Bay
| Characteristic | Without Mortgage | With Mortgage |
| Housing Units | 74 | 70 |
| Median Property Value | $759,300 | $676,800 |
| Median Household Income | $59,559 | $25 |
| Monthly Housing Costs | $1,100 | $43 |
| Real Estate Taxes | $2,143 | $9 |
Property Value by Mortgage Status in Kawela Bay
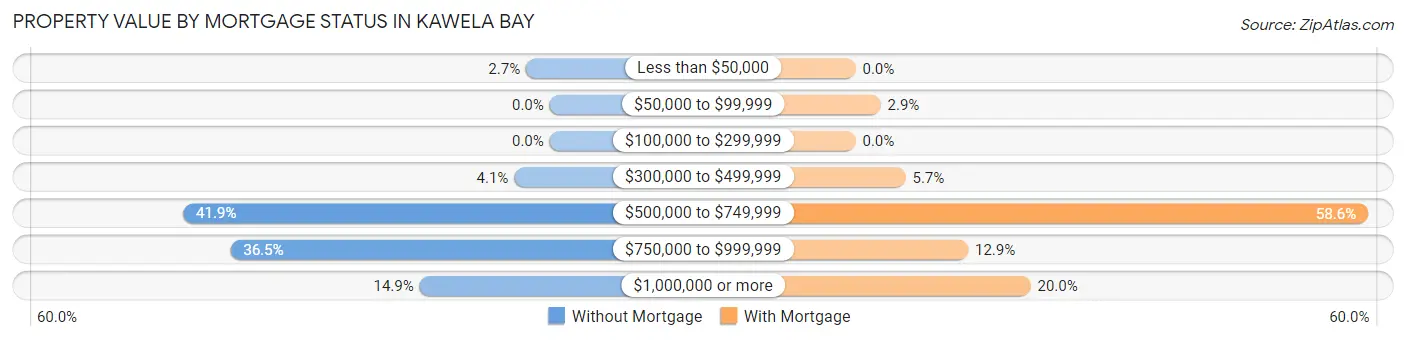
| Property Value | Without Mortgage | With Mortgage |
| Less than $50,000 | 2 (2.7%) | 0 (0.0%) |
| $50,000 to $99,999 | 0 (0.0%) | 2 (2.9%) |
| $100,000 to $299,999 | 0 (0.0%) | 0 (0.0%) |
| $300,000 to $499,999 | 3 (4.1%) | 4 (5.7%) |
| $500,000 to $749,999 | 31 (41.9%) | 41 (58.6%) |
| $750,000 to $999,999 | 27 (36.5%) | 9 (12.9%) |
| $1,000,000 or more | 11 (14.9%) | 14 (20.0%) |
| Total | 74 (100.0%) | 70 (100.0%) |
Household Income by Mortgage Status in Kawela Bay
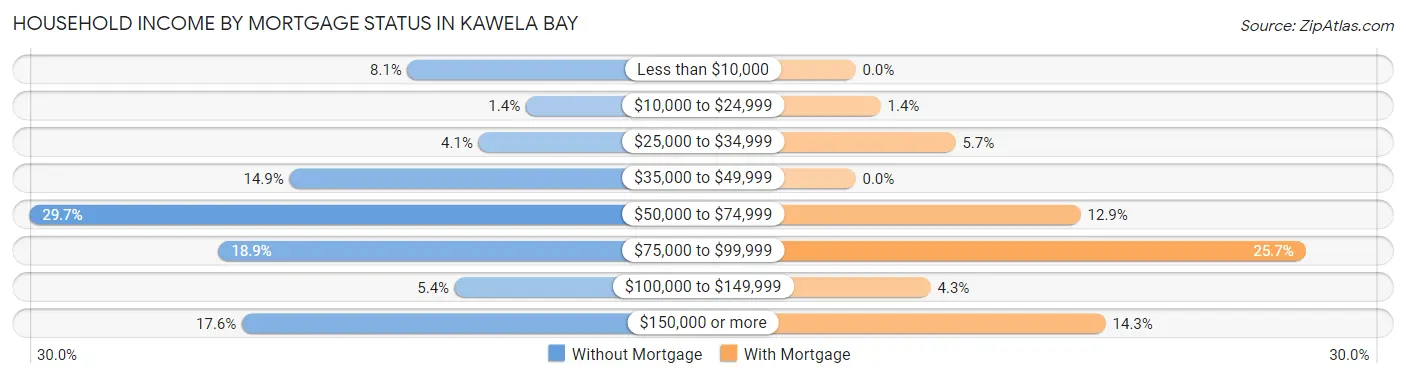
| Household Income | Without Mortgage | With Mortgage |
| Less than $10,000 | 6 (8.1%) | 0 (0.0%) |
| $10,000 to $24,999 | 1 (1.3%) | 1 (1.4%) |
| $25,000 to $34,999 | 3 (4.1%) | 4 (5.7%) |
| $35,000 to $49,999 | 11 (14.9%) | 0 (0.0%) |
| $50,000 to $74,999 | 22 (29.7%) | 9 (12.9%) |
| $75,000 to $99,999 | 14 (18.9%) | 18 (25.7%) |
| $100,000 to $149,999 | 4 (5.4%) | 3 (4.3%) |
| $150,000 or more | 13 (17.6%) | 10 (14.3%) |
| Total | 74 (100.0%) | 70 (100.0%) |
Property Value to Household Income Ratio in Kawela Bay
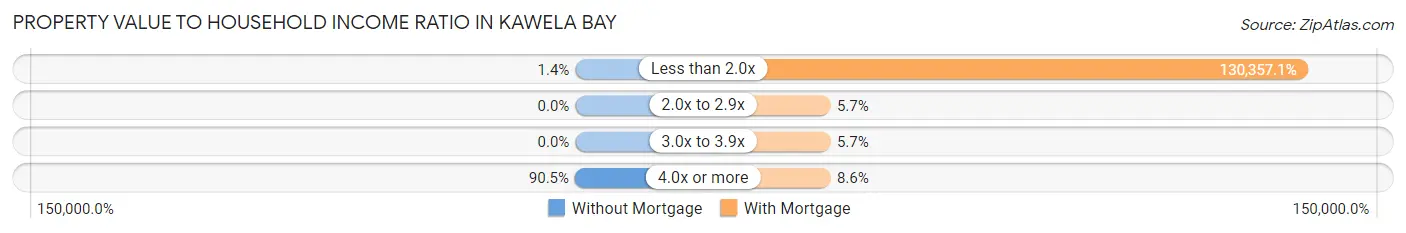
| Value-to-Income Ratio | Without Mortgage | With Mortgage |
| Less than 2.0x | 1 (1.3%) | 91,250 (130,357.1%) |
| 2.0x to 2.9x | 0 (0.0%) | 4 (5.7%) |
| 3.0x to 3.9x | 0 (0.0%) | 4 (5.7%) |
| 4.0x or more | 67 (90.5%) | 6 (8.6%) |
| Total | 74 (100.0%) | 70 (100.0%) |
Real Estate Taxes by Mortgage Status in Kawela Bay
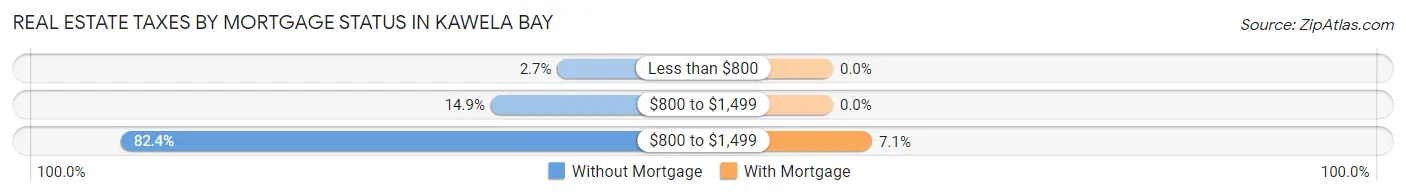
| Property Taxes | Without Mortgage | With Mortgage |
| Less than $800 | 2 (2.7%) | 0 (0.0%) |
| $800 to $1,499 | 11 (14.9%) | 0 (0.0%) |
| $800 to $1,499 | 61 (82.4%) | 5 (7.1%) |
| Total | 74 (100.0%) | 70 (100.0%) |
Health & Disability in Kawela Bay
Health Insurance Coverage by Age in Kawela Bay
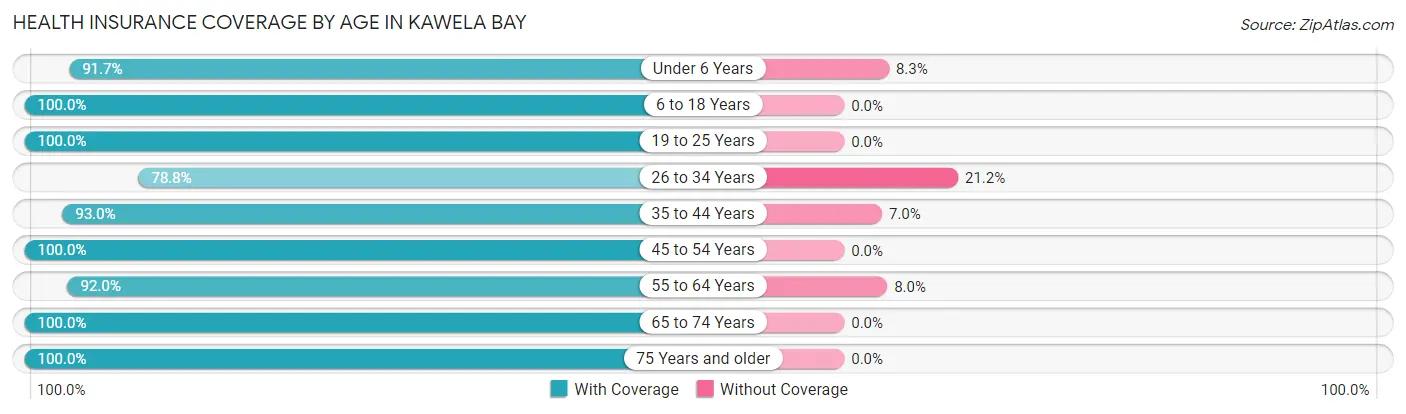
| Age Bracket | With Coverage | Without Coverage |
| Under 6 Years | 11 (91.7%) | 1 (8.3%) |
| 6 to 18 Years | 49 (100.0%) | 0 (0.0%) |
| 19 to 25 Years | 4 (100.0%) | 0 (0.0%) |
| 26 to 34 Years | 26 (78.8%) | 7 (21.2%) |
| 35 to 44 Years | 66 (93.0%) | 5 (7.0%) |
| 45 to 54 Years | 37 (100.0%) | 0 (0.0%) |
| 55 to 64 Years | 46 (92.0%) | 4 (8.0%) |
| 65 to 74 Years | 52 (100.0%) | 0 (0.0%) |
| 75 Years and older | 45 (100.0%) | 0 (0.0%) |
| Total | 336 (95.2%) | 17 (4.8%) |
Health Insurance Coverage by Citizenship Status in Kawela Bay
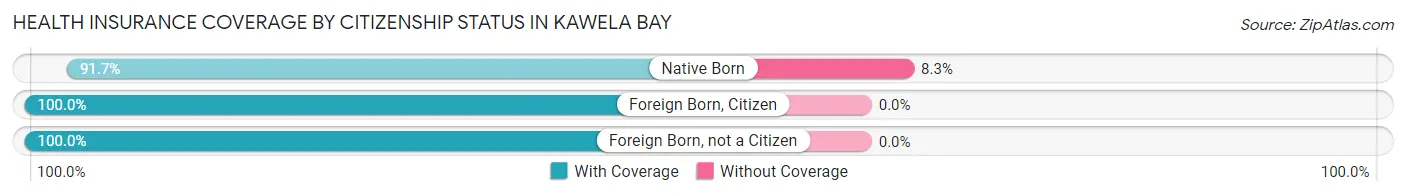
| Citizenship Status | With Coverage | Without Coverage |
| Native Born | 11 (91.7%) | 1 (8.3%) |
| Foreign Born, Citizen | 49 (100.0%) | 0 (0.0%) |
| Foreign Born, not a Citizen | 4 (100.0%) | 0 (0.0%) |
Health Insurance Coverage by Household Income in Kawela Bay
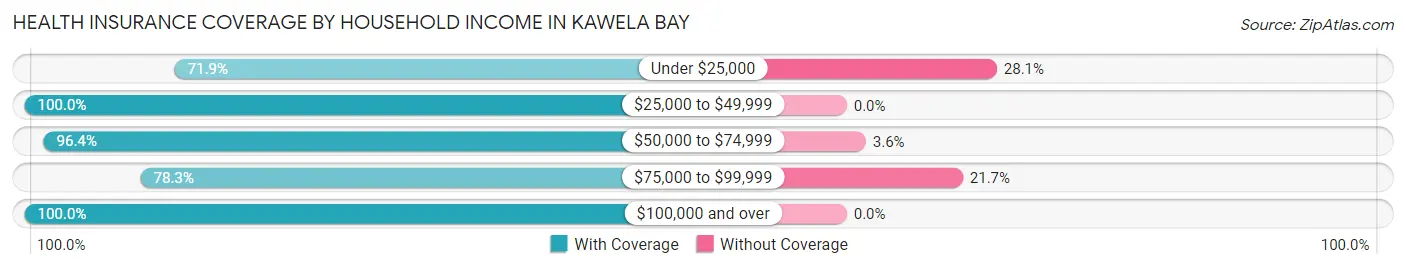
| Household Income | With Coverage | Without Coverage |
| Under $25,000 | 23 (71.9%) | 9 (28.1%) |
| $25,000 to $49,999 | 32 (100.0%) | 0 (0.0%) |
| $50,000 to $74,999 | 81 (96.4%) | 3 (3.6%) |
| $75,000 to $99,999 | 18 (78.3%) | 5 (21.7%) |
| $100,000 and over | 182 (100.0%) | 0 (0.0%) |
Public vs Private Health Insurance Coverage by Age in Kawela Bay
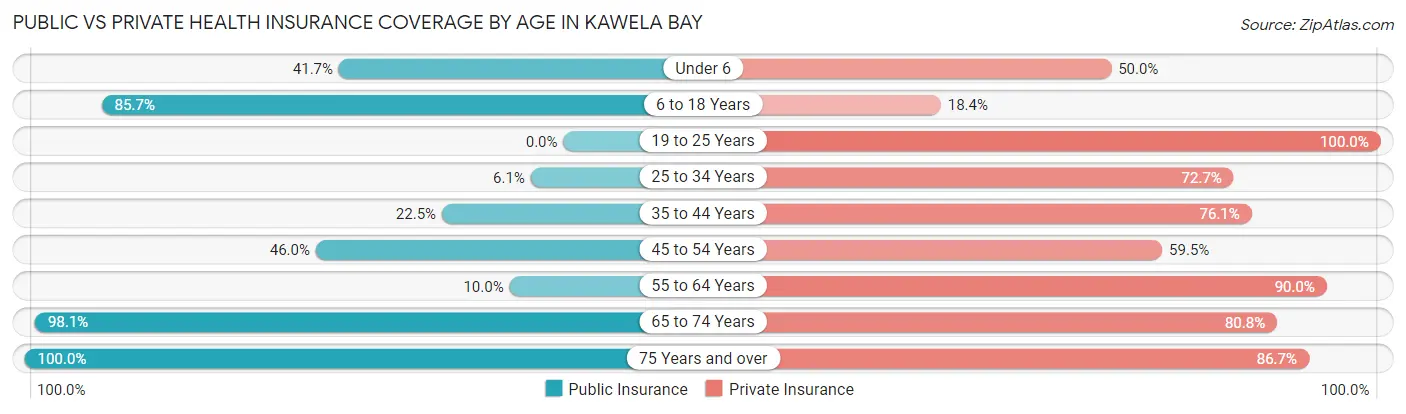
| Age Bracket | Public Insurance | Private Insurance |
| Under 6 | 5 (41.7%) | 6 (50.0%) |
| 6 to 18 Years | 42 (85.7%) | 9 (18.4%) |
| 19 to 25 Years | 0 (0.0%) | 4 (100.0%) |
| 25 to 34 Years | 2 (6.1%) | 24 (72.7%) |
| 35 to 44 Years | 16 (22.5%) | 54 (76.1%) |
| 45 to 54 Years | 17 (46.0%) | 22 (59.5%) |
| 55 to 64 Years | 5 (10.0%) | 45 (90.0%) |
| 65 to 74 Years | 51 (98.1%) | 42 (80.8%) |
| 75 Years and over | 45 (100.0%) | 39 (86.7%) |
| Total | 183 (51.8%) | 245 (69.4%) |
Disability Status by Sex by Age in Kawela Bay
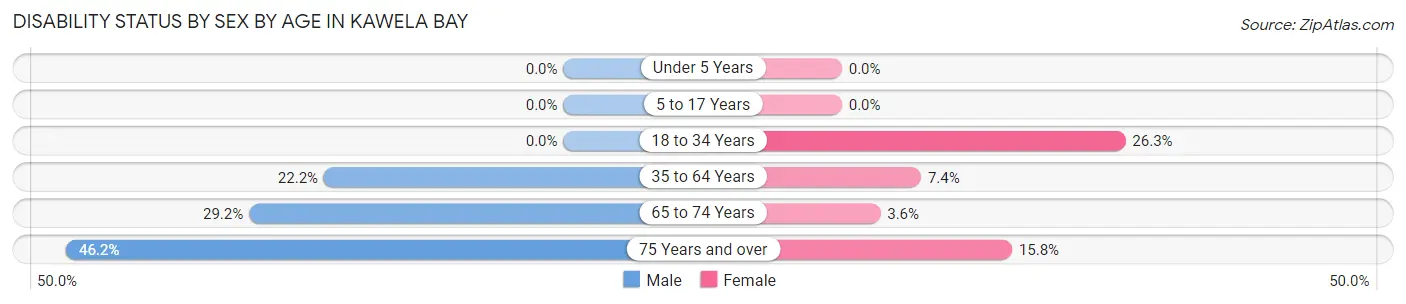
| Age Bracket | Male | Female |
| Under 5 Years | 0 (0.0%) | 0 (0.0%) |
| 5 to 17 Years | 0 (0.0%) | 0 (0.0%) |
| 18 to 34 Years | 0 (0.0%) | 5 (26.3%) |
| 35 to 64 Years | 20 (22.2%) | 5 (7.3%) |
| 65 to 74 Years | 7 (29.2%) | 1 (3.6%) |
| 75 Years and over | 12 (46.2%) | 3 (15.8%) |
Disability Class by Sex by Age in Kawela Bay
Disability Class: Hearing Difficulty
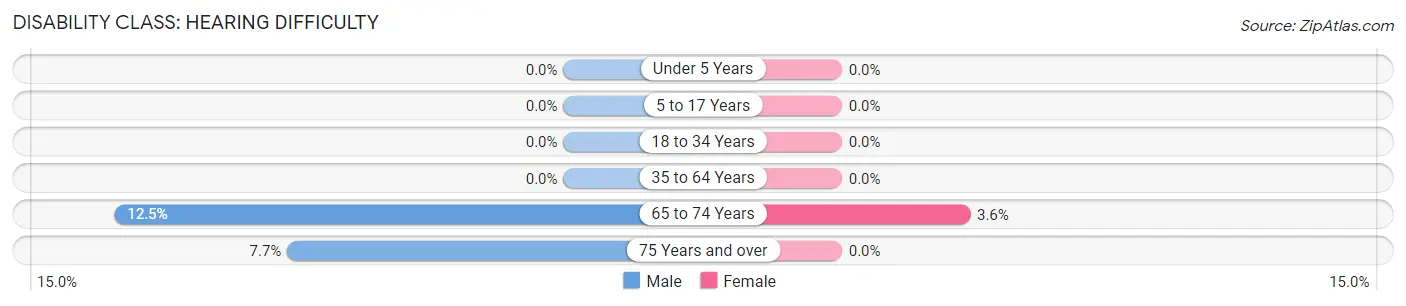
| Age Bracket | Male | Female |
| Under 5 Years | 0 (0.0%) | 0 (0.0%) |
| 5 to 17 Years | 0 (0.0%) | 0 (0.0%) |
| 18 to 34 Years | 0 (0.0%) | 0 (0.0%) |
| 35 to 64 Years | 0 (0.0%) | 0 (0.0%) |
| 65 to 74 Years | 3 (12.5%) | 1 (3.6%) |
| 75 Years and over | 2 (7.7%) | 0 (0.0%) |
Disability Class: Vision Difficulty
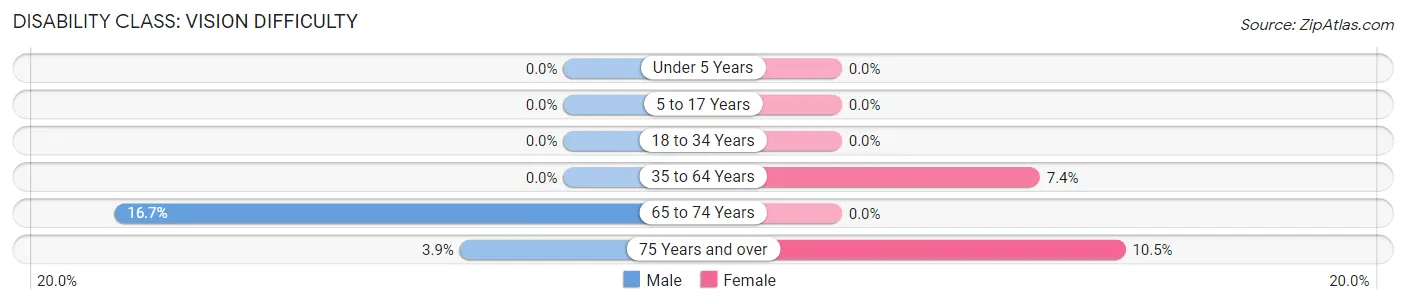
| Age Bracket | Male | Female |
| Under 5 Years | 0 (0.0%) | 0 (0.0%) |
| 5 to 17 Years | 0 (0.0%) | 0 (0.0%) |
| 18 to 34 Years | 0 (0.0%) | 0 (0.0%) |
| 35 to 64 Years | 0 (0.0%) | 5 (7.3%) |
| 65 to 74 Years | 4 (16.7%) | 0 (0.0%) |
| 75 Years and over | 1 (3.8%) | 2 (10.5%) |
Disability Class: Cognitive Difficulty
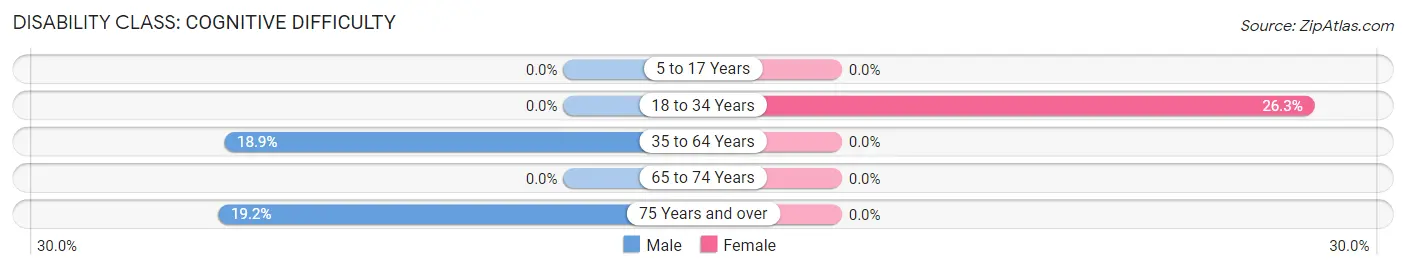
| Age Bracket | Male | Female |
| 5 to 17 Years | 0 (0.0%) | 0 (0.0%) |
| 18 to 34 Years | 0 (0.0%) | 5 (26.3%) |
| 35 to 64 Years | 17 (18.9%) | 0 (0.0%) |
| 65 to 74 Years | 0 (0.0%) | 0 (0.0%) |
| 75 Years and over | 5 (19.2%) | 0 (0.0%) |
Disability Class: Ambulatory Difficulty
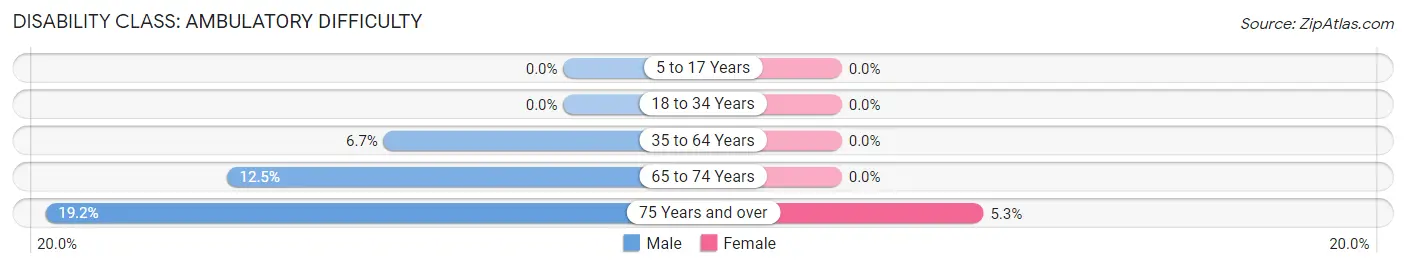
| Age Bracket | Male | Female |
| 5 to 17 Years | 0 (0.0%) | 0 (0.0%) |
| 18 to 34 Years | 0 (0.0%) | 0 (0.0%) |
| 35 to 64 Years | 6 (6.7%) | 0 (0.0%) |
| 65 to 74 Years | 3 (12.5%) | 0 (0.0%) |
| 75 Years and over | 5 (19.2%) | 1 (5.3%) |
Disability Class: Self-Care Difficulty
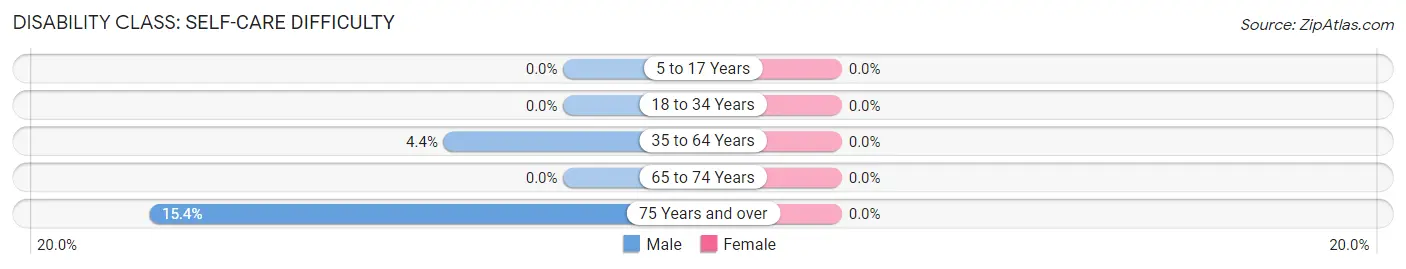
| Age Bracket | Male | Female |
| 5 to 17 Years | 0 (0.0%) | 0 (0.0%) |
| 18 to 34 Years | 0 (0.0%) | 0 (0.0%) |
| 35 to 64 Years | 4 (4.4%) | 0 (0.0%) |
| 65 to 74 Years | 0 (0.0%) | 0 (0.0%) |
| 75 Years and over | 4 (15.4%) | 0 (0.0%) |
Technology Access in Kawela Bay
Computing Device Access in Kawela Bay
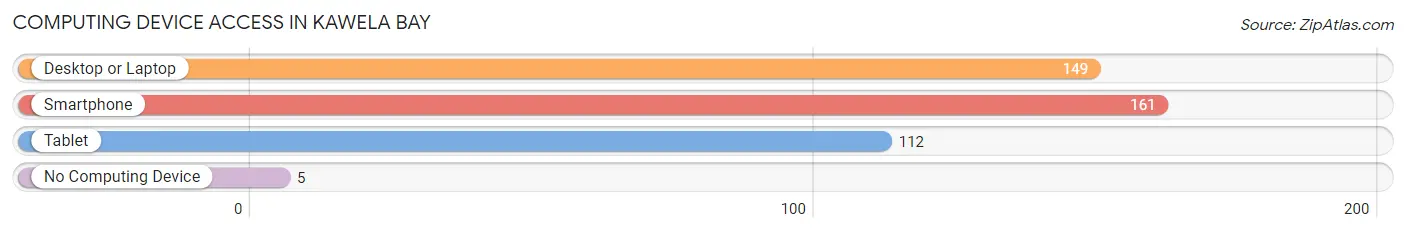
| Device Type | # Households | % Households |
| Desktop or Laptop | 149 | 84.7% |
| Smartphone | 161 | 91.5% |
| Tablet | 112 | 63.6% |
| No Computing Device | 5 | 2.8% |
| Total | 176 | 100.0% |
Internet Access in Kawela Bay
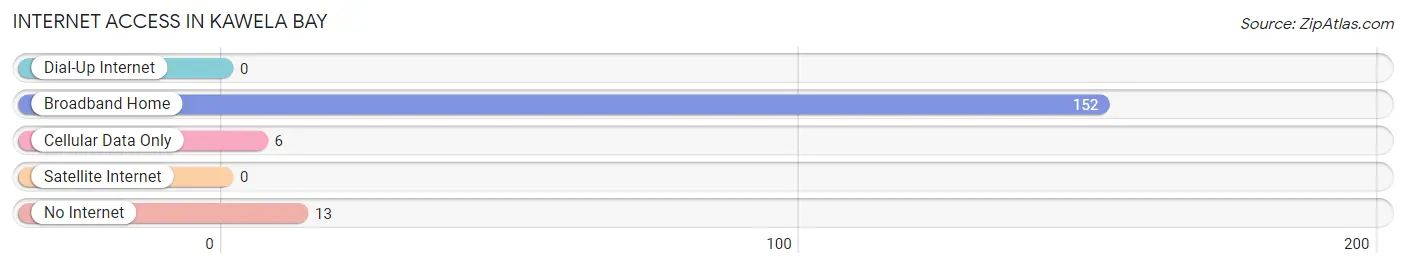
| Internet Type | # Households | % Households |
| Dial-Up Internet | 0 | 0.0% |
| Broadband Home | 152 | 86.4% |
| Cellular Data Only | 6 | 3.4% |
| Satellite Internet | 0 | 0.0% |
| No Internet | 13 | 7.4% |
| Total | 176 | 100.0% |
Kawela Bay Summary
Kawela Bay is a small bay located on the north shore of the Hawaiian island of Oahu. It is located between the towns of Kahuku and Laie, and is part of the Ko’olauloa District. The bay is known for its beautiful white sand beaches, crystal clear waters, and lush tropical vegetation. It is a popular destination for swimming, snorkeling, and other water activities.
History
Kawela Bay has a long and rich history. It was once home to the ancient Hawaiian settlement of Kawela, which was established in the late 1700s. The settlement was a major center of commerce and culture, and was home to many of the island’s most influential families. In the early 1800s, the bay was a major port of call for whaling ships, and was also used as a base for the whaling industry.
In the late 1800s, the bay was used as a military base by the United States Navy. During World War II, the bay was used as a staging area for the invasion of the Japanese-held island of Saipan. After the war, the bay was used as a recreational area, and was home to a number of resorts and hotels.
Geography
Kawela Bay is located on the north shore of Oahu, between the towns of Kahuku and Laie. The bay is approximately 1.5 miles long and 0.5 miles wide. It is surrounded by lush tropical vegetation, and is home to a variety of wildlife, including sea turtles, dolphins, and whales. The bay is also home to a number of coral reefs, which provide a habitat for a variety of fish and other marine life.
Economy
Kawela Bay is a popular tourist destination, and is home to a number of resorts and hotels. The bay is also home to a number of restaurants, bars, and other businesses that cater to tourists. In addition, the bay is home to a number of fishing and boating charters, as well as a number of water sports activities.
Demographics
Kawela Bay is home to a small population of approximately 1,000 people. The majority of the population is of Hawaiian descent, and the area is home to a number of Hawaiian cultural sites. The bay is also home to a number of immigrants from other parts of the world, including the Philippines, Japan, and China. The population is largely middle-class, and the median household income is approximately $50,000.
Common Questions
What is Per Capita Income in Kawela Bay?
Per Capita income in Kawela Bay is $44,638.
What is the Median Family Income in Kawela Bay?
Median Family Income in Kawela Bay is $112,813.
What is the Median Household income in Kawela Bay?
Median Household Income in Kawela Bay is $71,429.
What is Income or Wage Gap in Kawela Bay?
Income or Wage Gap in Kawela Bay is 29.2%.
Women in Kawela Bay earn 70.8 cents for every dollar earned by a man.
What is Inequality or Gini Index in Kawela Bay?
Inequality or Gini Index in Kawela Bay is 0.39.
What is the Total Population of Kawela Bay?
Total Population of Kawela Bay is 365.
What is the Total Male Population of Kawela Bay?
Total Male Population of Kawela Bay is 211.
What is the Total Female Population of Kawela Bay?
Total Female Population of Kawela Bay is 154.
What is the Ratio of Males per 100 Females in Kawela Bay?
There are 137.01 Males per 100 Females in Kawela Bay.
What is the Ratio of Females per 100 Males in Kawela Bay?
There are 72.99 Females per 100 Males in Kawela Bay.
What is the Median Population Age in Kawela Bay?
Median Population Age in Kawela Bay is 45.1 Years.
What is the Average Family Size in Kawela Bay
Average Family Size in Kawela Bay is 3.2 People.
What is the Average Household Size in Kawela Bay
Average Household Size in Kawela Bay is 2.1 People.
How Large is the Labor Force in Kawela Bay?
There are 192 People in the Labor Forcein in Kawela Bay.
What is the Percentage of People in the Labor Force in Kawela Bay?
61.5% of People are in the Labor Force in Kawela Bay.
What is the Unemployment Rate in Kawela Bay?
Unemployment Rate in Kawela Bay is 2.2%.