Zip Codes with the Highest Percentage of Population Employed in Architecture & Engineering in Hawaii
RELATED REPORTS & OPTIONS
Architecture & Engineering
Hawaii
Compare Zip Codes
Map of Zip Codes with the Highest Percentage of Population Employed in Architecture & Engineering in Hawaii
0.0%
15.0%
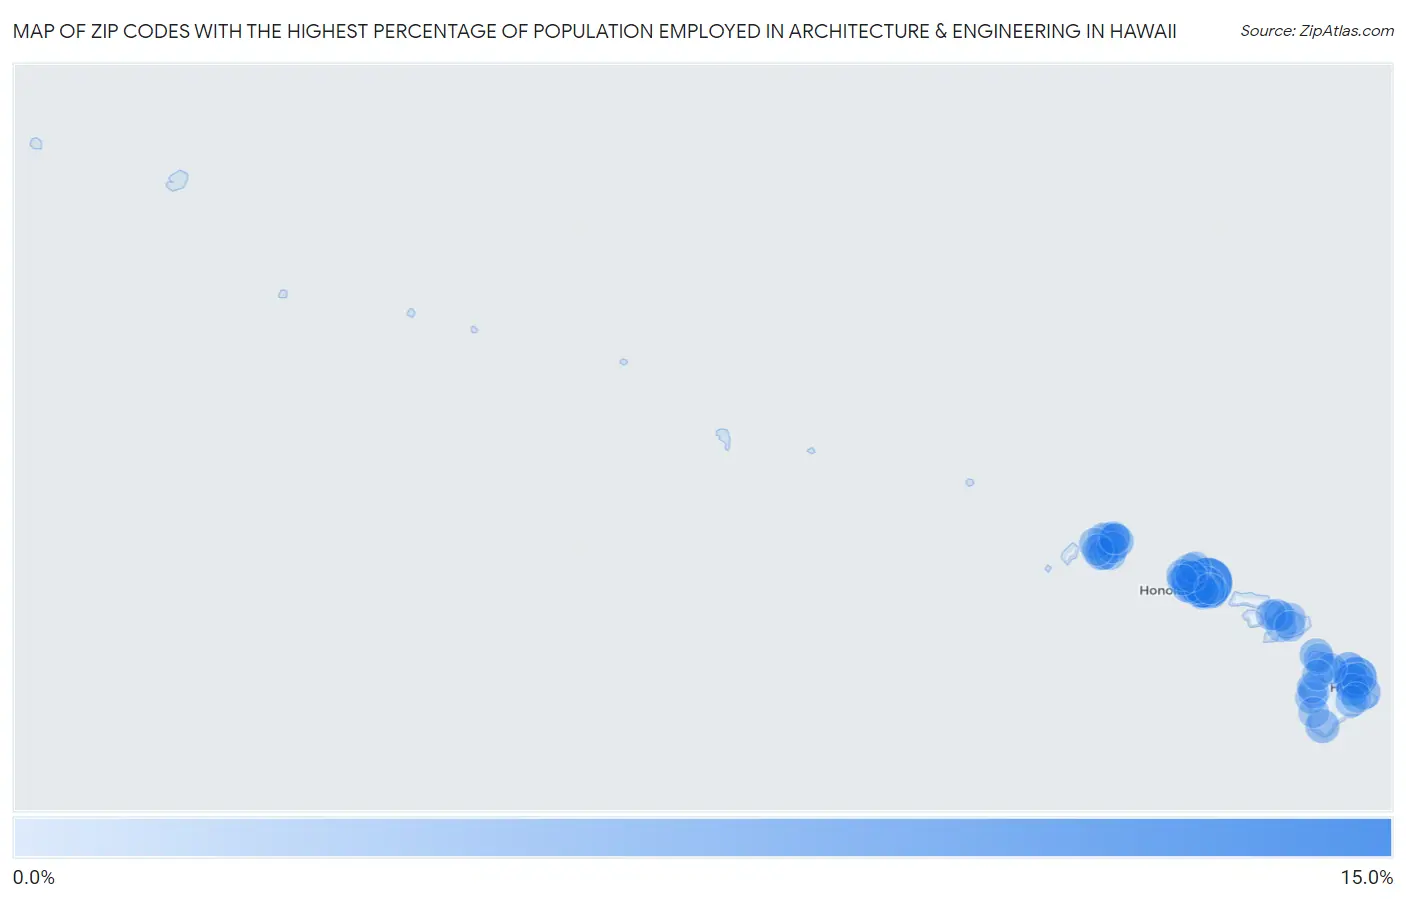
Zip Codes with the Highest Percentage of Population Employed in Architecture & Engineering in Hawaii
| Zip Code | % Employed | vs State | vs National | |
| 1. | 96863 | 13.7% | 1.7%(+12.0)#1 | 2.1%(+11.6)#178 |
| 2. | 96728 | 7.7% | 1.7%(+5.91)#2 | 2.1%(+5.51)#629 |
| 3. | 96857 | 5.8% | 1.7%(+4.01)#3 | 2.1%(+3.61)#1,190 |
| 4. | 96764 | 3.9% | 1.7%(+2.12)#4 | 2.1%(+1.72)#2,986 |
| 5. | 96781 | 3.5% | 1.7%(+1.78)#5 | 2.1%(+1.38)#3,665 |
| 6. | 96813 | 3.5% | 1.7%(+1.70)#6 | 2.1%(+1.30)#3,846 |
| 7. | 96701 | 3.4% | 1.7%(+1.62)#7 | 2.1%(+1.22)#4,012 |
| 8. | 96822 | 3.2% | 1.7%(+1.41)#8 | 2.1%(+1.01)#4,591 |
| 9. | 96746 | 3.0% | 1.7%(+1.28)#9 | 2.1%(+0.885)#4,944 |
| 10. | 96744 | 3.0% | 1.7%(+1.21)#10 | 2.1%(+0.810)#5,200 |
| 11. | 96821 | 2.8% | 1.7%(+1.05)#11 | 2.1%(+0.653)#5,788 |
| 12. | 96825 | 2.7% | 1.7%(+0.991)#12 | 2.1%(+0.592)#5,998 |
| 13. | 96772 | 2.5% | 1.7%(+0.715)#13 | 2.1%(+0.316)#7,152 |
| 14. | 96749 | 2.5% | 1.7%(+0.705)#14 | 2.1%(+0.306)#7,203 |
| 15. | 96734 | 2.4% | 1.7%(+0.671)#15 | 2.1%(+0.272)#7,370 |
| 16. | 96815 | 2.4% | 1.7%(+0.627)#16 | 2.1%(+0.227)#7,587 |
| 17. | 96782 | 2.4% | 1.7%(+0.625)#17 | 2.1%(+0.226)#7,594 |
| 18. | 96814 | 2.3% | 1.7%(+0.505)#18 | 2.1%(+0.106)#8,177 |
| 19. | 96789 | 2.2% | 1.7%(+0.424)#19 | 2.1%(+0.025)#8,629 |
| 20. | 96797 | 2.2% | 1.7%(+0.401)#20 | 2.1%(+0.002)#8,753 |
| 21. | 96719 | 2.1% | 1.7%(+0.356)#21 | 2.1%(-0.044)#9,017 |
| 22. | 96816 | 2.1% | 1.7%(+0.352)#22 | 2.1%(-0.048)#9,037 |
| 23. | 96817 | 1.9% | 1.7%(+0.133)#23 | 2.1%(-0.266)#10,341 |
| 24. | 96706 | 1.9% | 1.7%(+0.127)#24 | 2.1%(-0.272)#10,390 |
| 25. | 96716 | 1.9% | 1.7%(+0.115)#25 | 2.1%(-0.284)#10,455 |
| 26. | 96818 | 1.7% | 1.7%(-0.027)#26 | 2.1%(-0.426)#11,340 |
| 27. | 96720 | 1.7% | 1.7%(-0.028)#27 | 2.1%(-0.427)#11,347 |
| 28. | 96826 | 1.7% | 1.7%(-0.054)#28 | 2.1%(-0.454)#11,525 |
| 29. | 96712 | 1.6% | 1.7%(-0.127)#29 | 2.1%(-0.526)#12,031 |
| 30. | 96722 | 1.4% | 1.7%(-0.332)#30 | 2.1%(-0.732)#13,461 |
| 31. | 96756 | 1.4% | 1.7%(-0.354)#31 | 2.1%(-0.754)#13,619 |
| 32. | 96783 | 1.4% | 1.7%(-0.370)#32 | 2.1%(-0.770)#13,736 |
| 33. | 96793 | 1.4% | 1.7%(-0.383)#33 | 2.1%(-0.782)#13,825 |
| 34. | 96707 | 1.4% | 1.7%(-0.387)#34 | 2.1%(-0.786)#13,857 |
| 35. | 96714 | 1.3% | 1.7%(-0.472)#35 | 2.1%(-0.872)#14,469 |
| 36. | 96750 | 1.3% | 1.7%(-0.478)#36 | 2.1%(-0.878)#14,513 |
| 37. | 96754 | 1.2% | 1.7%(-0.529)#37 | 2.1%(-0.928)#14,912 |
| 38. | 96791 | 1.2% | 1.7%(-0.570)#38 | 2.1%(-0.969)#15,243 |
| 39. | 96752 | 1.2% | 1.7%(-0.574)#39 | 2.1%(-0.974)#15,275 |
| 40. | 96819 | 1.2% | 1.7%(-0.585)#40 | 2.1%(-0.985)#15,367 |
| 41. | 96705 | 1.2% | 1.7%(-0.587)#41 | 2.1%(-0.986)#15,383 |
| 42. | 96768 | 1.1% | 1.7%(-0.639)#42 | 2.1%(-1.04)#15,756 |
| 43. | 96731 | 1.00% | 1.7%(-0.752)#43 | 2.1%(-1.15)#16,620 |
| 44. | 96766 | 0.93% | 1.7%(-0.820)#44 | 2.1%(-1.22)#17,132 |
| 45. | 96785 | 0.93% | 1.7%(-0.822)#45 | 2.1%(-1.22)#17,151 |
| 46. | 96725 | 0.90% | 1.7%(-0.851)#46 | 2.1%(-1.25)#17,380 |
| 47. | 96743 | 0.85% | 1.7%(-0.901)#47 | 2.1%(-1.30)#17,770 |
| 48. | 96786 | 0.84% | 1.7%(-0.908)#48 | 2.1%(-1.31)#17,825 |
| 49. | 96796 | 0.78% | 1.7%(-0.968)#49 | 2.1%(-1.37)#18,268 |
| 50. | 96753 | 0.77% | 1.7%(-0.982)#50 | 2.1%(-1.38)#18,378 |
| 51. | 96703 | 0.65% | 1.7%(-1.10)#51 | 2.1%(-1.50)#19,266 |
| 52. | 96732 | 0.65% | 1.7%(-1.10)#52 | 2.1%(-1.50)#19,272 |
| 53. | 96795 | 0.54% | 1.7%(-1.21)#53 | 2.1%(-1.61)#20,058 |
| 54. | 96740 | 0.52% | 1.7%(-1.23)#54 | 2.1%(-1.63)#20,132 |
| 55. | 96727 | 0.51% | 1.7%(-1.24)#55 | 2.1%(-1.64)#20,206 |
| 56. | 96761 | 0.42% | 1.7%(-1.33)#56 | 2.1%(-1.73)#20,817 |
| 57. | 96792 | 0.42% | 1.7%(-1.33)#57 | 2.1%(-1.73)#20,851 |
| 58. | 96704 | 0.39% | 1.7%(-1.36)#58 | 2.1%(-1.76)#21,039 |
| 59. | 96755 | 0.38% | 1.7%(-1.37)#59 | 2.1%(-1.77)#21,113 |
| 60. | 96738 | 0.37% | 1.7%(-1.38)#60 | 2.1%(-1.78)#21,141 |
| 61. | 96790 | 0.30% | 1.7%(-1.45)#61 | 2.1%(-1.85)#21,542 |
| 62. | 96771 | 0.12% | 1.7%(-1.63)#62 | 2.1%(-2.03)#22,350 |
1
Common Questions
What are the Top 10 Zip Codes with the Highest Percentage of Population Employed in Architecture & Engineering in Hawaii?
Top 10 Zip Codes with the Highest Percentage of Population Employed in Architecture & Engineering in Hawaii are:
What zip code has the Highest Percentage of Population Employed in Architecture & Engineering in Hawaii?
96863 has the Highest Percentage of Population Employed in Architecture & Engineering in Hawaii with 13.7%.
What is the Percentage of Population Employed in Architecture & Engineering in the State of Hawaii?
Percentage of Population Employed in Architecture & Engineering in Hawaii is 1.7%.
What is the Percentage of Population Employed in Architecture & Engineering in the United States?
Percentage of Population Employed in Architecture & Engineering in the United States is 2.1%.