Waialua, HI Map & Demographics
Waialua Map
Waialua Overview
$36,044
PER CAPITA INCOME
$101,513
AVG FAMILY INCOME
$87,266
AVG HOUSEHOLD INCOME
5.9%
WAGE / INCOME GAP [ % ]
94.1¢/ $1
WAGE / INCOME GAP [ $ ]
0.43
INEQUALITY / GINI INDEX
3,053
TOTAL POPULATION
1,479
MALE POPULATION
1,574
FEMALE POPULATION
93.96
MALES / 100 FEMALES
106.42
FEMALES / 100 MALES
46.8
MEDIAN AGE
3.1
AVG FAMILY SIZE
2.9
AVG HOUSEHOLD SIZE
1,568
LABOR FORCE [ PEOPLE ]
59.3%
PERCENT IN LABOR FORCE
5.9%
UNEMPLOYMENT RATE
Waialua Zip Codes
Waialua Area Codes
Income in Waialua
Income Overview in Waialua
Per Capita Income in Waialua is $36,044, while median incomes of families and households are $101,513 and $87,266 respectively.
| Characteristic | Number | Measure |
| Per Capita Income | 3,053 | $36,044 |
| Median Family Income | 763 | $101,513 |
| Mean Family Income | 763 | $107,828 |
| Median Household Income | 1,049 | $87,266 |
| Mean Household Income | 1,049 | $100,651 |
| Income Deficit | 763 | $0 |
| Wage / Income Gap (%) | 3,053 | 5.87% |
| Wage / Income Gap ($) | 3,053 | 94.13¢ per $1 |
| Gini / Inequality Index | 3,053 | 0.43 |
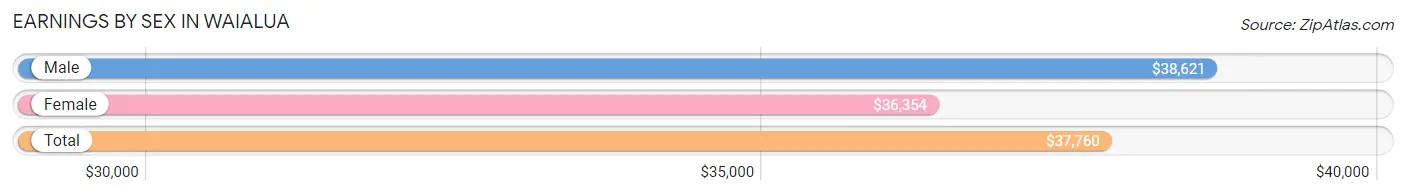
Earnings by Sex in Waialua
Average Earnings in Waialua are $37,760, $38,621 for men and $36,354 for women, a difference of 5.9%.
| Sex | Number | Average Earnings |
| Male | 814 (50.9%) | $38,621 |
| Female | 785 (49.1%) | $36,354 |
| Total | 1,599 (100.0%) | $37,760 |
Earnings by Sex by Income Bracket in Waialua
The most common earnings brackets in Waialua are $100,000+ for men (130 | 16.0%) and $100,000+ for women (143 | 18.2%).
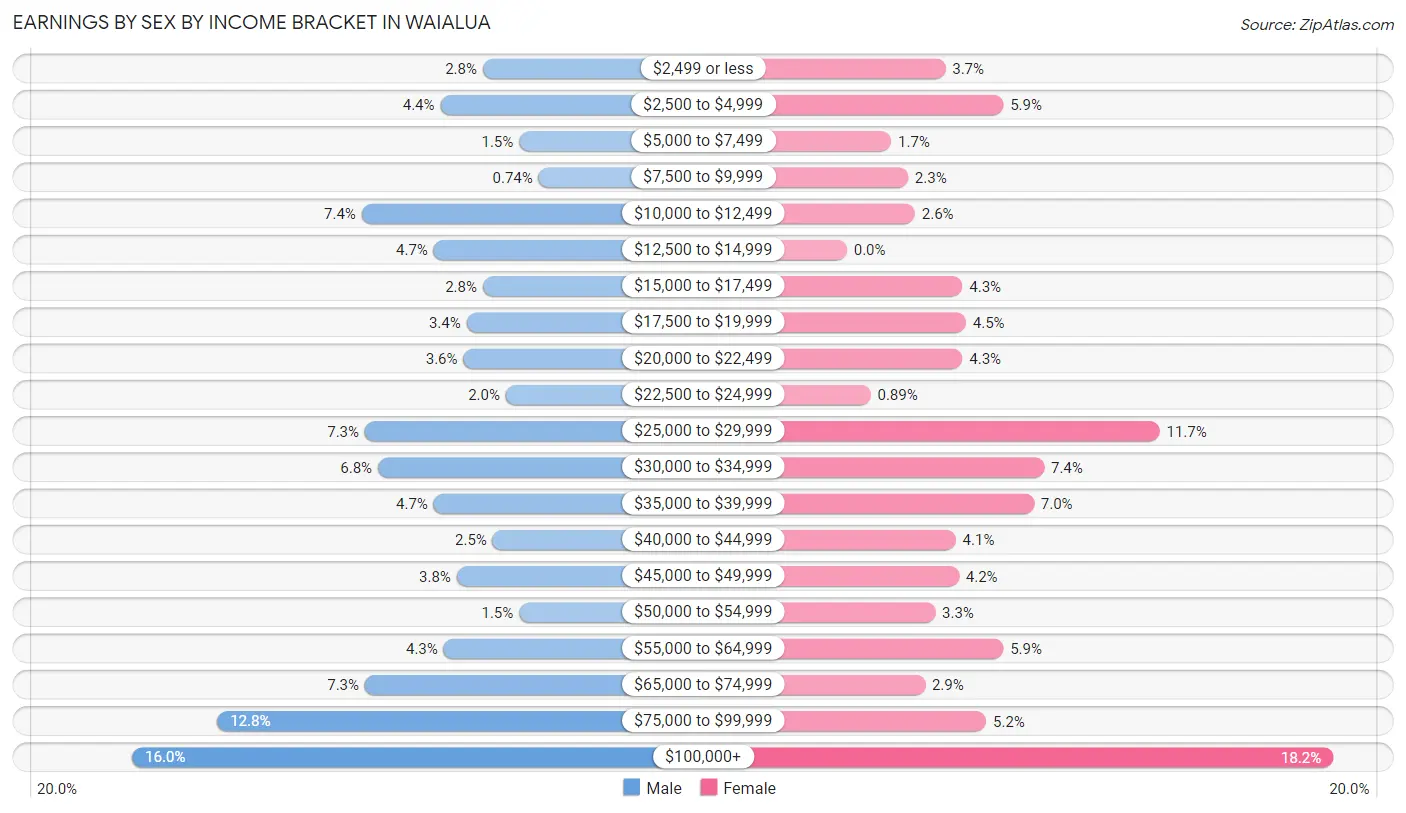
| Income | Male | Female |
| $2,499 or less | 23 (2.8%) | 29 (3.7%) |
| $2,500 to $4,999 | 36 (4.4%) | 46 (5.9%) |
| $5,000 to $7,499 | 12 (1.5%) | 13 (1.7%) |
| $7,500 to $9,999 | 6 (0.7%) | 18 (2.3%) |
| $10,000 to $12,499 | 60 (7.4%) | 20 (2.5%) |
| $12,500 to $14,999 | 38 (4.7%) | 0 (0.0%) |
| $15,000 to $17,499 | 23 (2.8%) | 34 (4.3%) |
| $17,500 to $19,999 | 28 (3.4%) | 35 (4.5%) |
| $20,000 to $22,499 | 29 (3.6%) | 34 (4.3%) |
| $22,500 to $24,999 | 16 (2.0%) | 7 (0.9%) |
| $25,000 to $29,999 | 59 (7.2%) | 92 (11.7%) |
| $30,000 to $34,999 | 55 (6.8%) | 58 (7.4%) |
| $35,000 to $39,999 | 38 (4.7%) | 55 (7.0%) |
| $40,000 to $44,999 | 20 (2.5%) | 32 (4.1%) |
| $45,000 to $49,999 | 31 (3.8%) | 33 (4.2%) |
| $50,000 to $54,999 | 12 (1.5%) | 26 (3.3%) |
| $55,000 to $64,999 | 35 (4.3%) | 46 (5.9%) |
| $65,000 to $74,999 | 59 (7.2%) | 23 (2.9%) |
| $75,000 to $99,999 | 104 (12.8%) | 41 (5.2%) |
| $100,000+ | 130 (16.0%) | 143 (18.2%) |
| Total | 814 (100.0%) | 785 (100.0%) |
Earnings by Sex by Educational Attainment in Waialua
Average earnings in Waialua are $44,813 for men and $38,256 for women, a difference of 14.6%. Men with an educational attainment of graduate degree enjoy the highest average annual earnings of $117,723, while those with high school diploma education earn the least with $52,813. Women with an educational attainment of graduate degree earn the most with the average annual earnings of $82,656, while those with college or associate's degree education have the smallest earnings of $27,043.
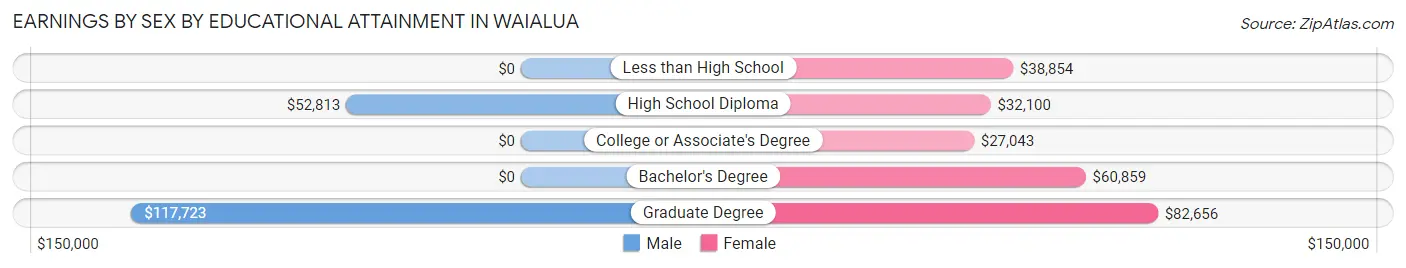
| Educational Attainment | Male Income | Female Income |
| Less than High School | - | - |
| High School Diploma | $52,813 | $32,100 |
| College or Associate's Degree | - | - |
| Bachelor's Degree | - | - |
| Graduate Degree | $117,723 | $82,656 |
| Total | $44,813 | $38,256 |
Family Income in Waialua
Family Income Brackets in Waialua
According to the Waialua family income data, there are 232 families falling into the $100,000 to $149,999 income range, which is the most common income bracket and makes up 30.4% of all families. Conversely, the $15,000 to $24,999 income bracket is the least frequent group with only 12 families (1.6%) belonging to this category.
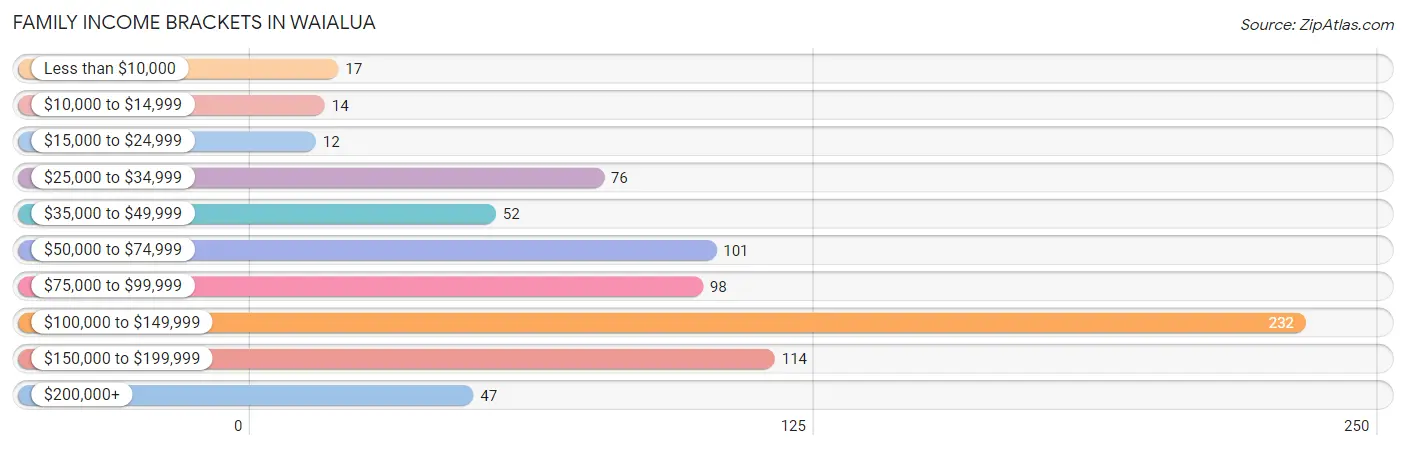
| Income Bracket | # Families | % Families |
| Less than $10,000 | 17 | 2.2% |
| $10,000 to $14,999 | 14 | 1.8% |
| $15,000 to $24,999 | 12 | 1.6% |
| $25,000 to $34,999 | 76 | 10.0% |
| $35,000 to $49,999 | 52 | 6.8% |
| $50,000 to $74,999 | 101 | 13.2% |
| $75,000 to $99,999 | 98 | 12.8% |
| $100,000 to $149,999 | 232 | 30.4% |
| $150,000 to $199,999 | 114 | 14.9% |
| $200,000+ | 47 | 6.2% |
Family Income by Famaliy Size in Waialua
7+ person families (24 | 3.2%) account for the highest median family income in Waialua with $200,313 per family, while 2-person families (404 | 52.9%) have the highest median income of $39,396 per family member.
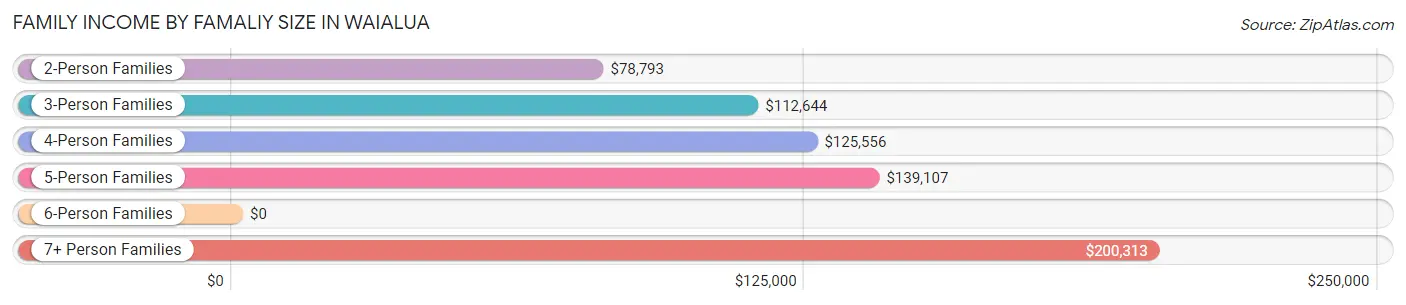
| Income Bracket | # Families | Median Income |
| 2-Person Families | 404 (52.9%) | $78,793 |
| 3-Person Families | 196 (25.7%) | $112,644 |
| 4-Person Families | 42 (5.5%) | $125,556 |
| 5-Person Families | 57 (7.5%) | $139,107 |
| 6-Person Families | 40 (5.2%) | $0 |
| 7+ Person Families | 24 (3.2%) | $200,313 |
| Total | 763 (100.0%) | $101,513 |
Family Income by Number of Earners in Waialua
The median family income in Waialua is $101,513, with families comprising 3+ earners (125) having the highest median family income of $141,131, while families with no earners (126) have the lowest median family income of $38,438, accounting for 16.4% and 16.5% of families, respectively.
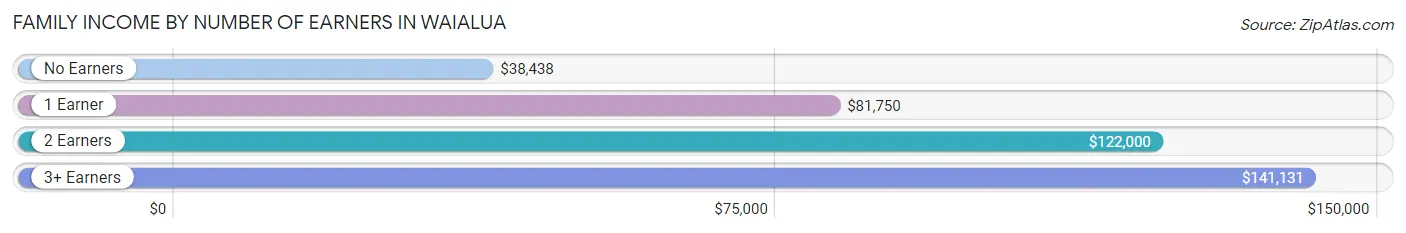
| Number of Earners | # Families | Median Income |
| No Earners | 126 (16.5%) | $38,438 |
| 1 Earner | 246 (32.2%) | $81,750 |
| 2 Earners | 266 (34.9%) | $122,000 |
| 3+ Earners | 125 (16.4%) | $141,131 |
| Total | 763 (100.0%) | $101,513 |
Household Income in Waialua
Household Income Brackets in Waialua
With 300 households falling in the category, the $100,000 to $149,999 income range is the most frequent in Waialua, accounting for 28.6% of all households. In contrast, only 47 households (4.5%) fall into the $10,000 to $14,999 income bracket, making it the least populous group.
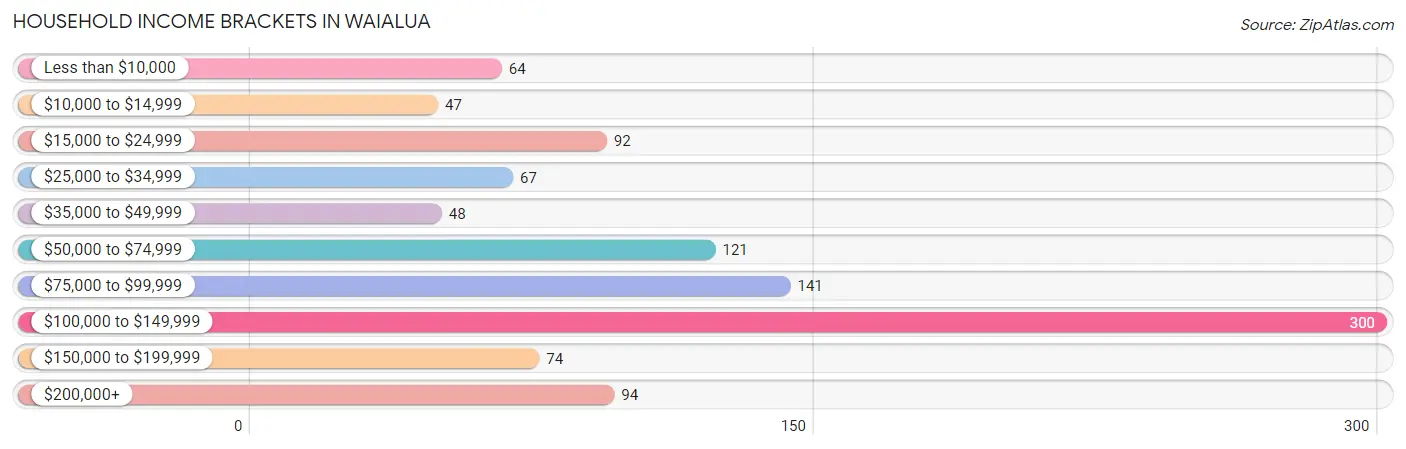
| Income Bracket | # Households | % Households |
| Less than $10,000 | 64 | 6.1% |
| $10,000 to $14,999 | 47 | 4.5% |
| $15,000 to $24,999 | 92 | 8.8% |
| $25,000 to $34,999 | 67 | 6.4% |
| $35,000 to $49,999 | 48 | 4.6% |
| $50,000 to $74,999 | 121 | 11.5% |
| $75,000 to $99,999 | 141 | 13.4% |
| $100,000 to $149,999 | 300 | 28.6% |
| $150,000 to $199,999 | 74 | 7.1% |
| $200,000+ | 94 | 9.0% |
Household Income by Householder Age in Waialua
The median household income in Waialua is $87,266, with the highest median household income of $120,074 found in the 25 to 44 years age bracket for the primary householder. A total of 213 households (20.3%) fall into this category.
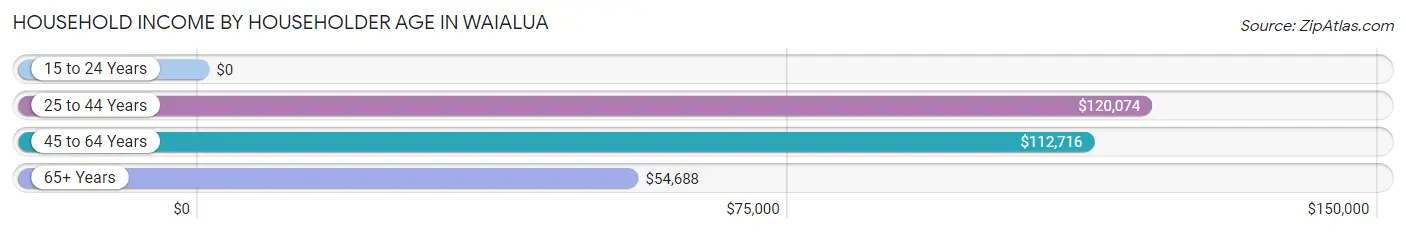
| Income Bracket | # Households | Median Income |
| 15 to 24 Years | 0 (0.0%) | $0 |
| 25 to 44 Years | 213 (20.3%) | $120,074 |
| 45 to 64 Years | 405 (38.6%) | $112,716 |
| 65+ Years | 431 (41.1%) | $54,688 |
| Total | 1,049 (100.0%) | $87,266 |
Poverty in Waialua
Income Below Poverty by Sex and Age in Waialua
With 17.8% poverty level for males and 9.3% for females among the residents of Waialua, 15 year old males and 6 to 11 year old females are the most vulnerable to poverty, with 44 males (89.8%) and 28 females (35.0%) in their respective age groups living below the poverty level.
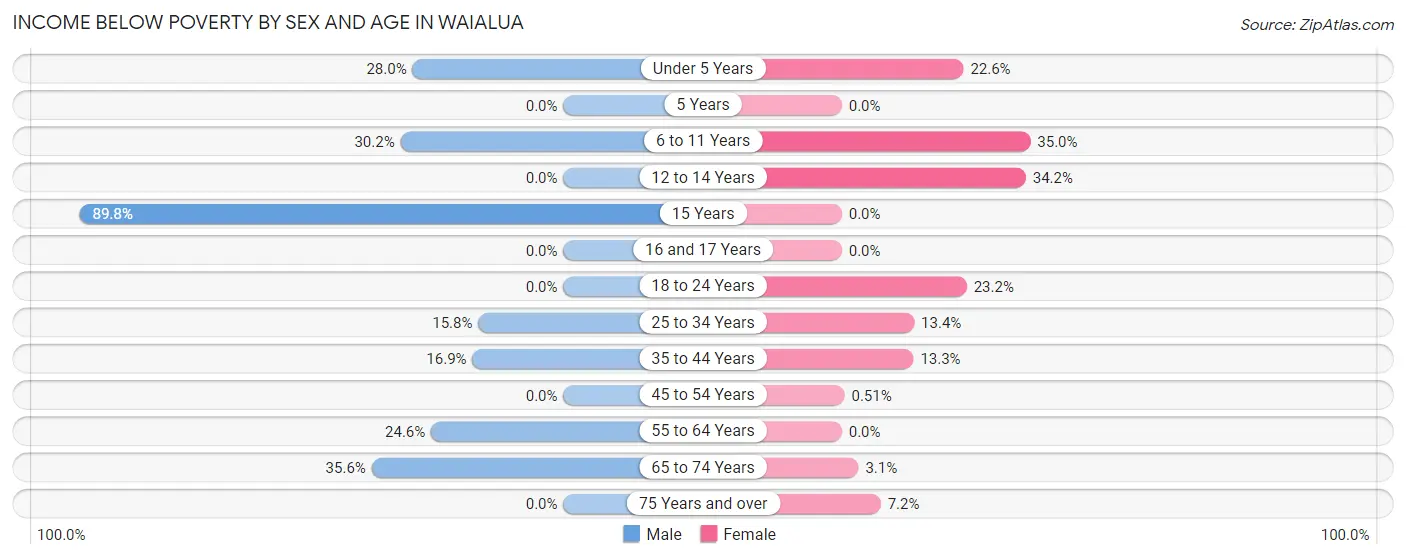
| Age Bracket | Male | Female |
| Under 5 Years | 7 (28.0%) | 7 (22.6%) |
| 5 Years | 0 (0.0%) | 0 (0.0%) |
| 6 to 11 Years | 26 (30.2%) | 28 (35.0%) |
| 12 to 14 Years | 0 (0.0%) | 14 (34.2%) |
| 15 Years | 44 (89.8%) | 0 (0.0%) |
| 16 and 17 Years | 0 (0.0%) | 0 (0.0%) |
| 18 to 24 Years | 0 (0.0%) | 16 (23.2%) |
| 25 to 34 Years | 30 (15.8%) | 27 (13.4%) |
| 35 to 44 Years | 26 (16.9%) | 29 (13.3%) |
| 45 to 54 Years | 0 (0.0%) | 1 (0.5%) |
| 55 to 64 Years | 55 (24.5%) | 0 (0.0%) |
| 65 to 74 Years | 74 (35.6%) | 8 (3.1%) |
| 75 Years and over | 0 (0.0%) | 12 (7.2%) |
| Total | 262 (17.8%) | 142 (9.3%) |
Income Above Poverty by Sex and Age in Waialua
According to the poverty statistics in Waialua, males aged 5 years and females aged 5 years are the age groups that are most secure financially, with 100.0% of males and 100.0% of females in these age groups living above the poverty line.
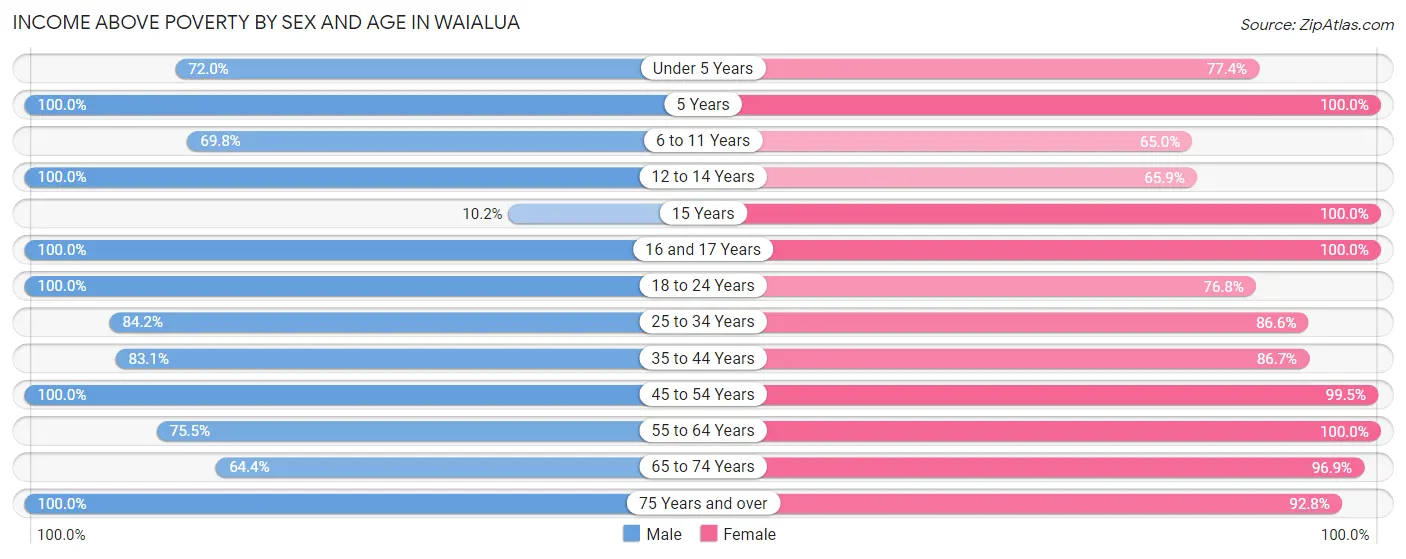
| Age Bracket | Male | Female |
| Under 5 Years | 18 (72.0%) | 24 (77.4%) |
| 5 Years | 5 (100.0%) | 5 (100.0%) |
| 6 to 11 Years | 60 (69.8%) | 52 (65.0%) |
| 12 to 14 Years | 21 (100.0%) | 27 (65.8%) |
| 15 Years | 5 (10.2%) | 5 (100.0%) |
| 16 and 17 Years | 44 (100.0%) | 67 (100.0%) |
| 18 to 24 Years | 96 (100.0%) | 53 (76.8%) |
| 25 to 34 Years | 160 (84.2%) | 174 (86.6%) |
| 35 to 44 Years | 128 (83.1%) | 189 (86.7%) |
| 45 to 54 Years | 246 (100.0%) | 196 (99.5%) |
| 55 to 64 Years | 169 (75.4%) | 180 (100.0%) |
| 65 to 74 Years | 134 (64.4%) | 251 (96.9%) |
| 75 Years and over | 125 (100.0%) | 154 (92.8%) |
| Total | 1,211 (82.2%) | 1,377 (90.6%) |
Income Below Poverty Among Married-Couple Families in Waialua
The poverty statistics for married-couple families in Waialua show that 4.1% or 25 of the total 606 families live below the poverty line. Families with 3 or 4 children have the highest poverty rate of 55.9%, comprising of 19 families. On the other hand, families with 1 or 2 children have the lowest poverty rate of 0.0%, which includes 0 families.
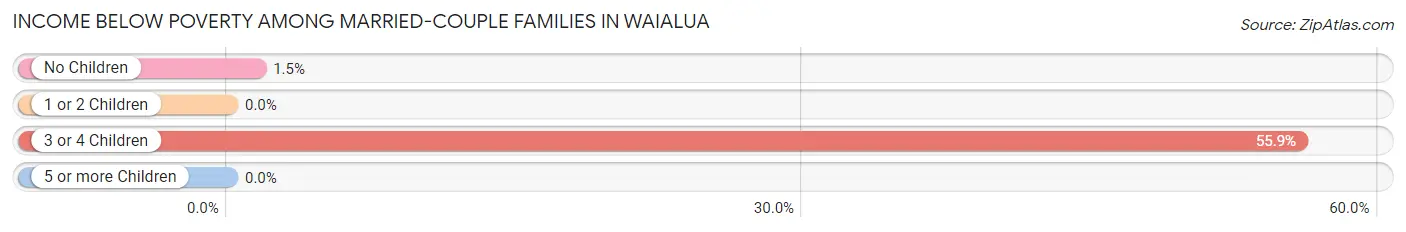
| Children | Above Poverty | Below Poverty |
| No Children | 401 (98.5%) | 6 (1.5%) |
| 1 or 2 Children | 159 (100.0%) | 0 (0.0%) |
| 3 or 4 Children | 15 (44.1%) | 19 (55.9%) |
| 5 or more Children | 6 (100.0%) | 0 (0.0%) |
| Total | 581 (95.9%) | 25 (4.1%) |
Income Below Poverty Among Single-Parent Households in Waialua
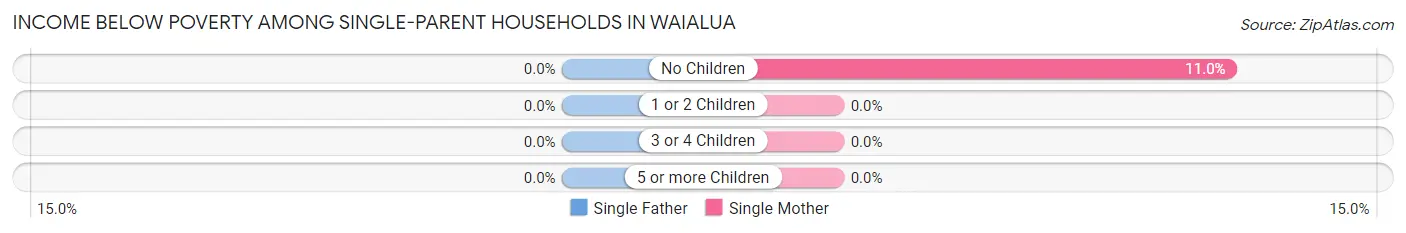
| Children | Single Father | Single Mother |
| No Children | 0 (0.0%) | 11 (11.0%) |
| 1 or 2 Children | 0 (0.0%) | 0 (0.0%) |
| 3 or 4 Children | 0 (0.0%) | 0 (0.0%) |
| 5 or more Children | 0 (0.0%) | 0 (0.0%) |
| Total | 0 (0.0%) | 11 (7.8%) |
Income Below Poverty Among Married-Couple vs Single-Parent Households in Waialua
The poverty data for Waialua shows that 25 of the married-couple family households (4.1%) and 11 of the single-parent households (7.0%) are living below the poverty level. Within the married-couple family households, those with 3 or 4 children have the highest poverty rate, with 19 households (55.9%) falling below the poverty line. Among the single-parent households, those with no children have the highest poverty rate, with 11 household (10.0%) living below poverty.
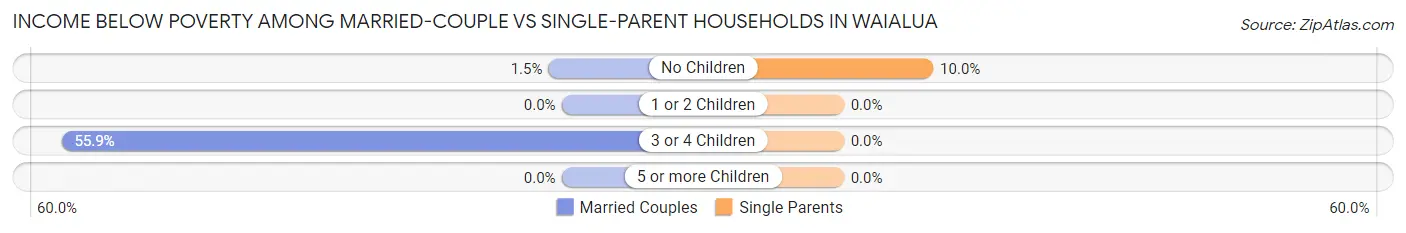
| Children | Married-Couple Families | Single-Parent Households |
| No Children | 6 (1.5%) | 11 (10.0%) |
| 1 or 2 Children | 0 (0.0%) | 0 (0.0%) |
| 3 or 4 Children | 19 (55.9%) | 0 (0.0%) |
| 5 or more Children | 0 (0.0%) | 0 (0.0%) |
| Total | 25 (4.1%) | 11 (7.0%) |
Race in Waialua
The most populous races in Waialua are Asian (944 | 30.9%), Two or more Races (943 | 30.9%), and White / Caucasian (876 | 28.7%).
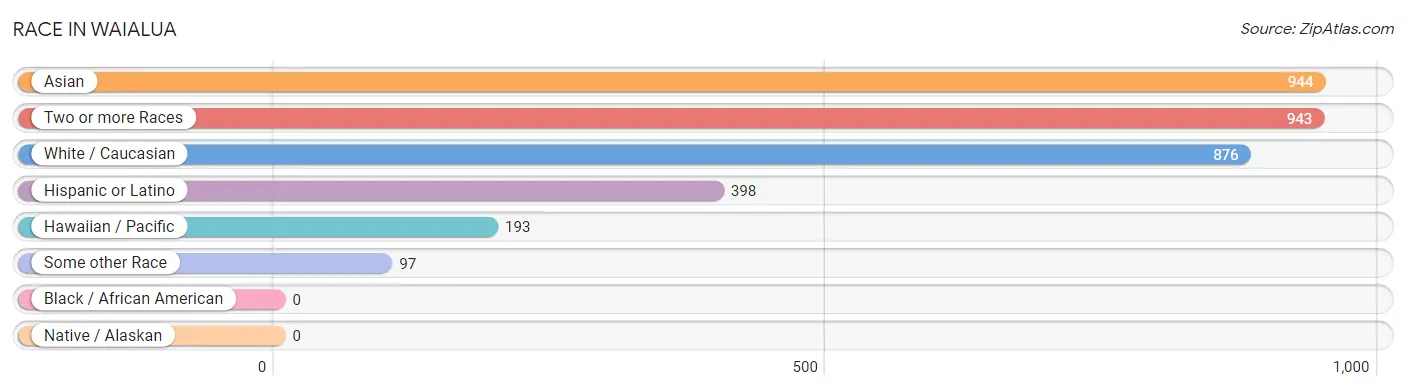
| Race | # Population | % Population |
| Asian | 944 | 30.9% |
| Black / African American | 0 | 0.0% |
| Hawaiian / Pacific | 193 | 6.3% |
| Hispanic or Latino | 398 | 13.0% |
| Native / Alaskan | 0 | 0.0% |
| White / Caucasian | 876 | 28.7% |
| Two or more Races | 943 | 30.9% |
| Some other Race | 97 | 3.2% |
| Total | 3,053 | 100.0% |
Ancestry in Waialua
The most populous ancestries reported in Waialua are Korean (1,305 | 42.7%), Native Hawaiian (729 | 23.9%), Bhutanese (632 | 20.7%), Indian (Asian) (358 | 11.7%), and Irish (253 | 8.3%), together accounting for 107.3% of all Waialua residents.
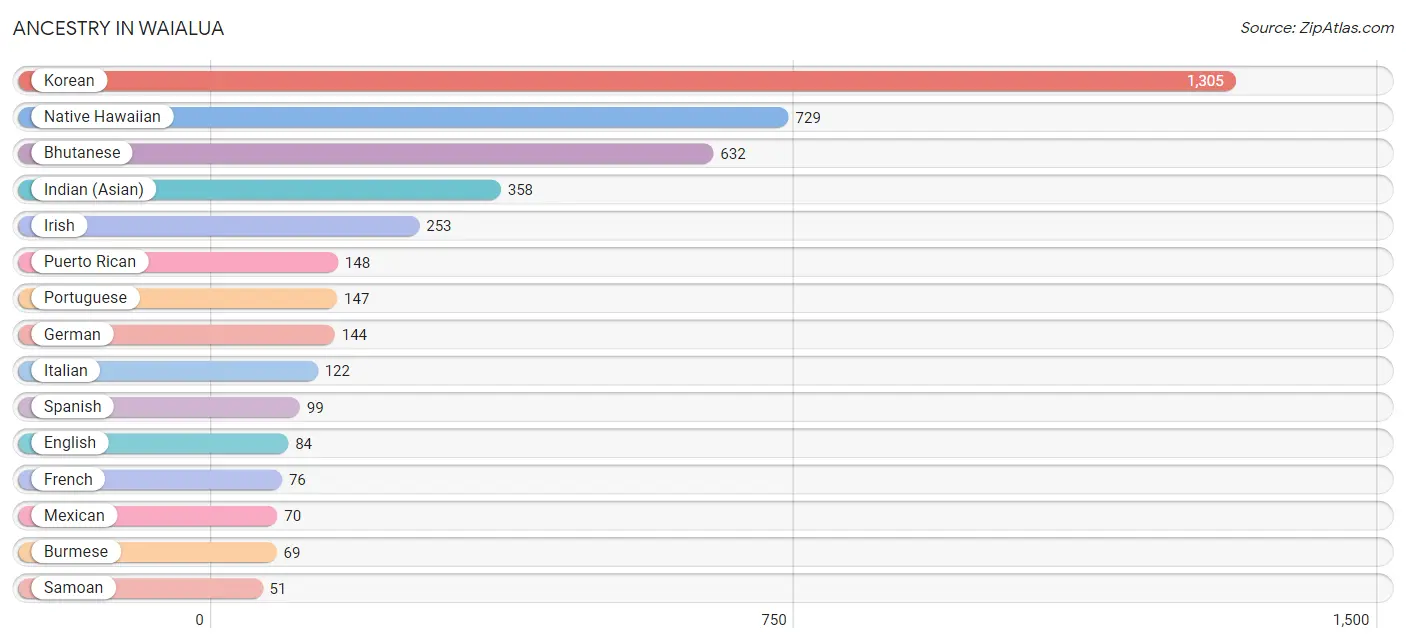
| Ancestry | # Population | % Population |
| American | 7 | 0.2% |
| Arab | 31 | 1.0% |
| Austrian | 11 | 0.4% |
| Bhutanese | 632 | 20.7% |
| Blackfeet | 16 | 0.5% |
| Brazilian | 42 | 1.4% |
| Burmese | 69 | 2.3% |
| Central American Indian | 6 | 0.2% |
| Danish | 5 | 0.2% |
| Dutch | 9 | 0.3% |
| Egyptian | 7 | 0.2% |
| English | 84 | 2.8% |
| European | 45 | 1.5% |
| Finnish | 22 | 0.7% |
| French | 76 | 2.5% |
| French Canadian | 11 | 0.4% |
| German | 144 | 4.7% |
| Guamanian / Chamorro | 8 | 0.3% |
| Icelander | 4 | 0.1% |
| Indian (Asian) | 358 | 11.7% |
| Irish | 253 | 8.3% |
| Italian | 122 | 4.0% |
| Korean | 1,305 | 42.7% |
| Laotian | 5 | 0.2% |
| Lebanese | 24 | 0.8% |
| Lithuanian | 16 | 0.5% |
| Mexican | 70 | 2.3% |
| Native Hawaiian | 729 | 23.9% |
| Northern European | 6 | 0.2% |
| Norwegian | 4 | 0.1% |
| Polish | 37 | 1.2% |
| Portuguese | 147 | 4.8% |
| Puerto Rican | 148 | 4.9% |
| Samoan | 51 | 1.7% |
| Scotch-Irish | 6 | 0.2% |
| Scottish | 8 | 0.3% |
| Sioux | 31 | 1.0% |
| Spanish | 99 | 3.2% |
| Sri Lankan | 45 | 1.5% |
| Thai | 5 | 0.2% |
| West Indian | 6 | 0.2% | View All 41 Rows |
Immigrants in Waialua
The most numerous immigrant groups reported in Waialua came from Asia (428 | 14.0%), South Eastern Asia (415 | 13.6%), Philippines (388 | 12.7%), Brazil (73 | 2.4%), and Latin America (73 | 2.4%), together accounting for 45.1% of all Waialua residents.
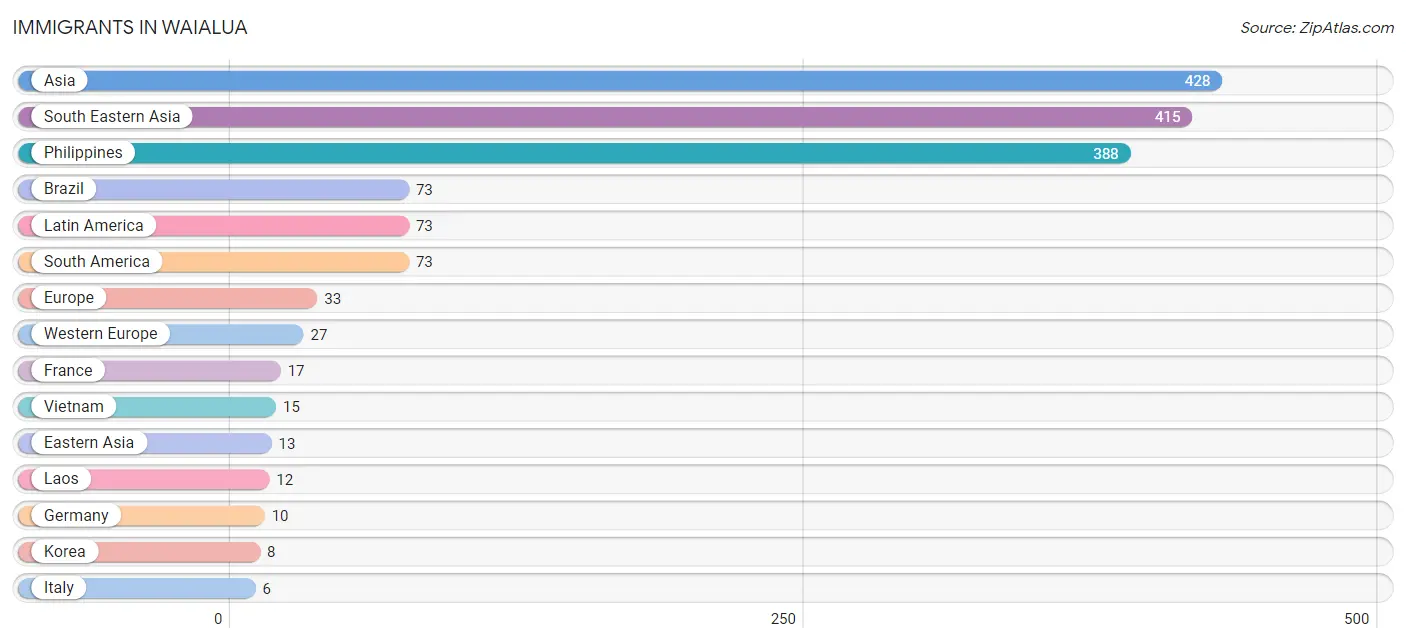
| Immigration Origin | # Population | % Population |
| Asia | 428 | 14.0% |
| Brazil | 73 | 2.4% |
| Eastern Asia | 13 | 0.4% |
| Europe | 33 | 1.1% |
| France | 17 | 0.6% |
| Germany | 10 | 0.3% |
| Italy | 6 | 0.2% |
| Japan | 5 | 0.2% |
| Korea | 8 | 0.3% |
| Laos | 12 | 0.4% |
| Latin America | 73 | 2.4% |
| Micronesia | 1 | 0.0% |
| Oceania | 1 | 0.0% |
| Philippines | 388 | 12.7% |
| South America | 73 | 2.4% |
| South Eastern Asia | 415 | 13.6% |
| Southern Europe | 6 | 0.2% |
| Vietnam | 15 | 0.5% |
| Western Europe | 27 | 0.9% | View All 19 Rows |
Sex and Age in Waialua
Sex and Age in Waialua
The most populous age groups in Waialua are 45 to 49 Years (160 | 10.8%) for men and 65 to 69 Years (172 | 10.9%) for women.
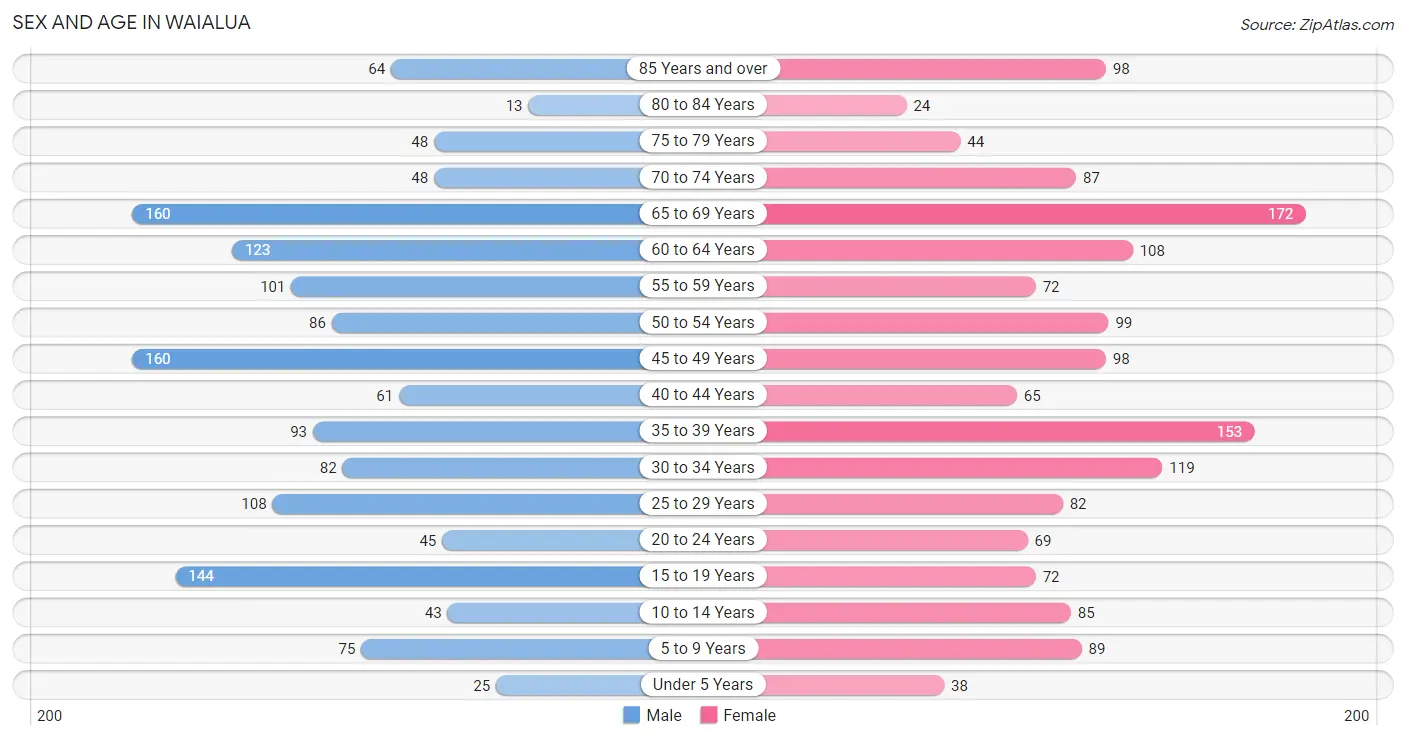
| Age Bracket | Male | Female |
| Under 5 Years | 25 (1.7%) | 38 (2.4%) |
| 5 to 9 Years | 75 (5.1%) | 89 (5.7%) |
| 10 to 14 Years | 43 (2.9%) | 85 (5.4%) |
| 15 to 19 Years | 144 (9.7%) | 72 (4.6%) |
| 20 to 24 Years | 45 (3.0%) | 69 (4.4%) |
| 25 to 29 Years | 108 (7.3%) | 82 (5.2%) |
| 30 to 34 Years | 82 (5.5%) | 119 (7.6%) |
| 35 to 39 Years | 93 (6.3%) | 153 (9.7%) |
| 40 to 44 Years | 61 (4.1%) | 65 (4.1%) |
| 45 to 49 Years | 160 (10.8%) | 98 (6.2%) |
| 50 to 54 Years | 86 (5.8%) | 99 (6.3%) |
| 55 to 59 Years | 101 (6.8%) | 72 (4.6%) |
| 60 to 64 Years | 123 (8.3%) | 108 (6.9%) |
| 65 to 69 Years | 160 (10.8%) | 172 (10.9%) |
| 70 to 74 Years | 48 (3.3%) | 87 (5.5%) |
| 75 to 79 Years | 48 (3.3%) | 44 (2.8%) |
| 80 to 84 Years | 13 (0.9%) | 24 (1.5%) |
| 85 Years and over | 64 (4.3%) | 98 (6.2%) |
| Total | 1,479 (100.0%) | 1,574 (100.0%) |
Families and Households in Waialua
Median Family Size in Waialua
The median family size in Waialua is 3.08 persons per family, with single male/father families (16 | 2.1%) accounting for the largest median family size of 3.19 persons per family. On the other hand, single female/mother families (141 | 18.5%) represent the smallest median family size with 2.74 persons per family.
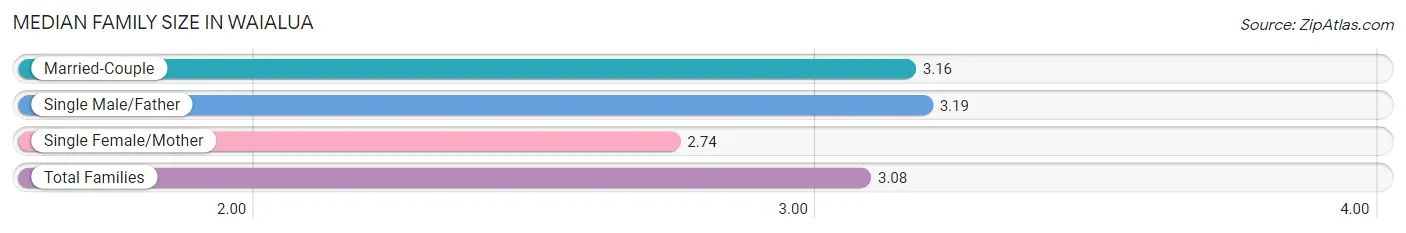
| Family Type | # Families | Family Size |
| Married-Couple | 606 (79.4%) | 3.16 |
| Single Male/Father | 16 (2.1%) | 3.19 |
| Single Female/Mother | 141 (18.5%) | 2.74 |
| Total Families | 763 (100.0%) | 3.08 |
Median Household Size in Waialua
The median household size in Waialua is 2.91 persons per household, with single female/mother households (141 | 13.4%) accounting for the largest median household size of 3.54 persons per household. non-family households (286 | 27.3%) represent the smallest median household size with 1.42 persons per household.
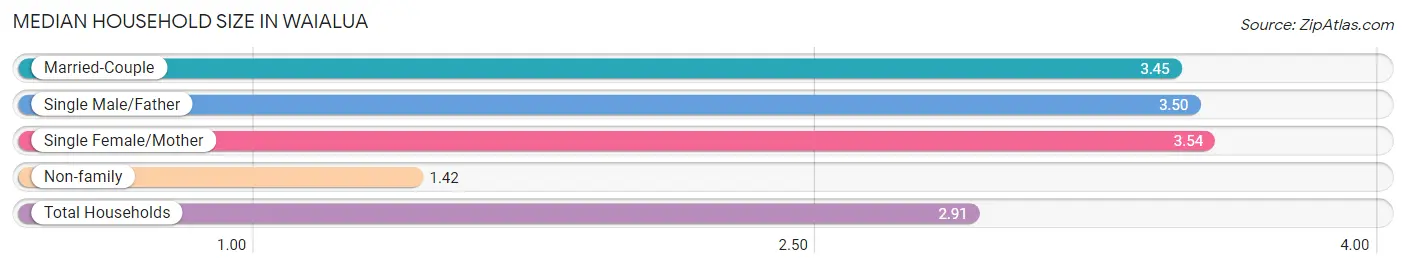
| Household Type | # Households | Household Size |
| Married-Couple | 606 (57.8%) | 3.45 |
| Single Male/Father | 16 (1.5%) | 3.50 |
| Single Female/Mother | 141 (13.4%) | 3.54 |
| Non-family | 286 (27.3%) | 1.42 |
| Total Households | 1,049 (100.0%) | 2.91 |
Household Size by Marriage Status in Waialua
Out of a total of 1,049 households in Waialua, 763 (72.7%) are family households, while 286 (27.3%) are nonfamily households. The most numerous type of family households are 2-person households, comprising 341, and the most common type of nonfamily households are 1-person households, comprising 229.
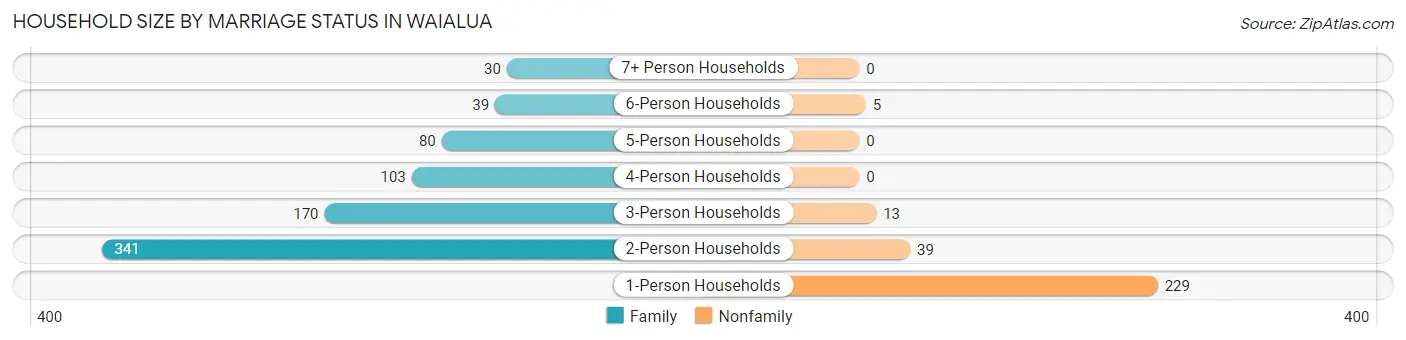
| Household Size | Family Households | Nonfamily Households |
| 1-Person Households | - | 229 (21.8%) |
| 2-Person Households | 341 (32.5%) | 39 (3.7%) |
| 3-Person Households | 170 (16.2%) | 13 (1.2%) |
| 4-Person Households | 103 (9.8%) | 0 (0.0%) |
| 5-Person Households | 80 (7.6%) | 0 (0.0%) |
| 6-Person Households | 39 (3.7%) | 5 (0.5%) |
| 7+ Person Households | 30 (2.9%) | 0 (0.0%) |
| Total | 763 (72.7%) | 286 (27.3%) |
Female Fertility in Waialua
Fertility by Age in Waialua
Average fertility rate in Waialua is 9.0 births per 1,000 women. Women in the age bracket of 20 to 34 years have the highest fertility rate with 19.0 births per 1,000 women. Women in the age bracket of 20 to 34 years acount for 83.3% of all women with births.
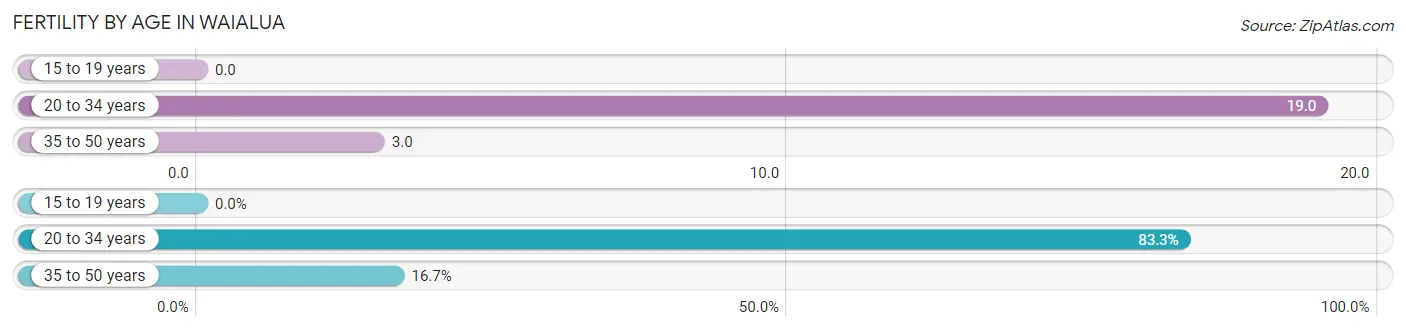
| Age Bracket | Women with Births | Births / 1,000 Women |
| 15 to 19 years | 0 (0.0%) | 0.0 |
| 20 to 34 years | 5 (83.3%) | 19.0 |
| 35 to 50 years | 1 (16.7%) | 3.0 |
| Total | 6 (100.0%) | 9.0 |
Fertility by Age by Marriage Status in Waialua
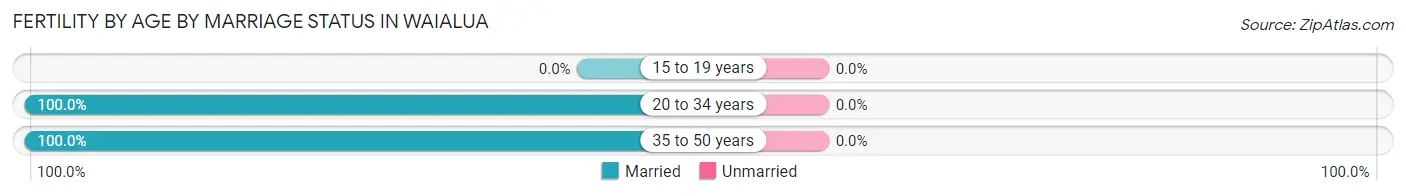
| Age Bracket | Married | Unmarried |
| 15 to 19 years | 0 (0.0%) | 0 (0.0%) |
| 20 to 34 years | 5 (100.0%) | 0 (0.0%) |
| 35 to 50 years | 1 (100.0%) | 0 (0.0%) |
| Total | 6 (100.0%) | 0 (0.0%) |
Fertility by Education in Waialua
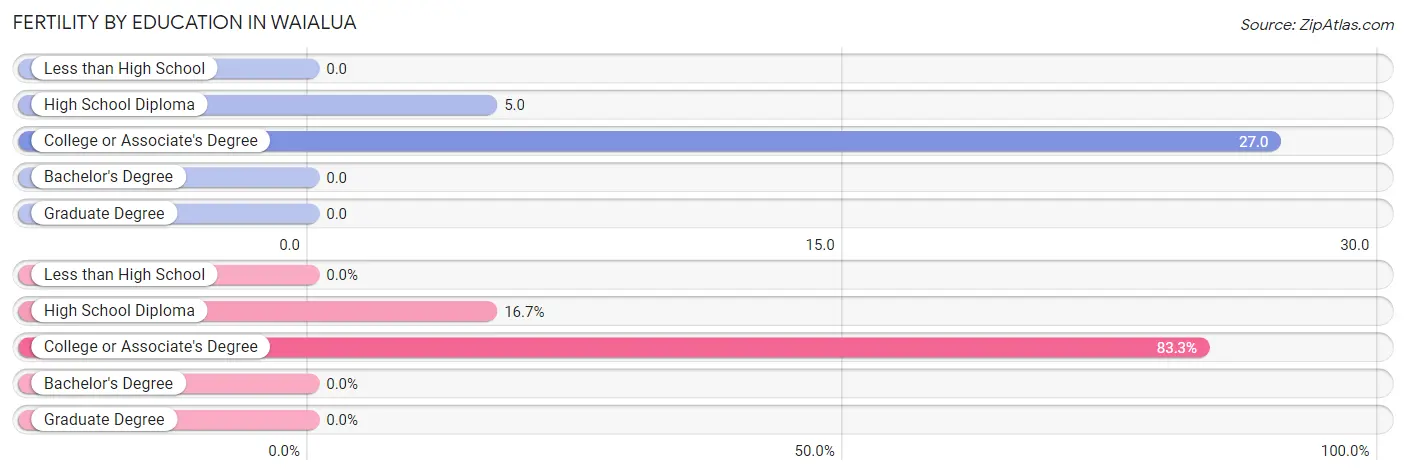
| Educational Attainment | Women with Births | Births / 1,000 Women |
| Less than High School | 0 (0.0%) | 0.0 |
| High School Diploma | 1 (16.7%) | 5.0 |
| College or Associate's Degree | 5 (83.3%) | 27.0 |
| Bachelor's Degree | 0 (0.0%) | 0.0 |
| Graduate Degree | 0 (0.0%) | 0.0 |
| Total | 6 (100.0%) | 9.0 |
Fertility by Education by Marriage Status in Waialua
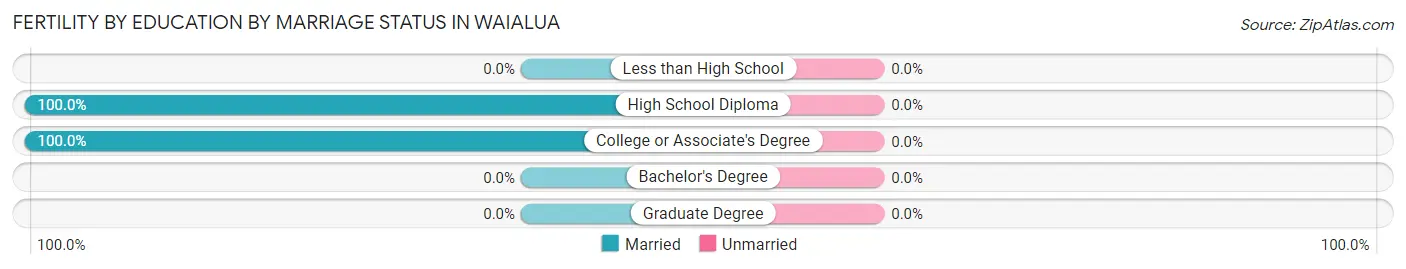
| Educational Attainment | Married | Unmarried |
| Less than High School | 0 (0.0%) | 0 (0.0%) |
| High School Diploma | 1 (100.0%) | 0 (0.0%) |
| College or Associate's Degree | 5 (100.0%) | 0 (0.0%) |
| Bachelor's Degree | 0 (0.0%) | 0 (0.0%) |
| Graduate Degree | 0 (0.0%) | 0 (0.0%) |
| Total | 6 (100.0%) | 0 (0.0%) |
Employment Characteristics in Waialua
Employment by Class of Employer in Waialua
Among the 1,426 employed individuals in Waialua, private company employees (841 | 59.0%), not-for-profit organizations (141 | 9.9%), and self-employed (not incorporated) (115 | 8.1%) make up the most common classes of employment.
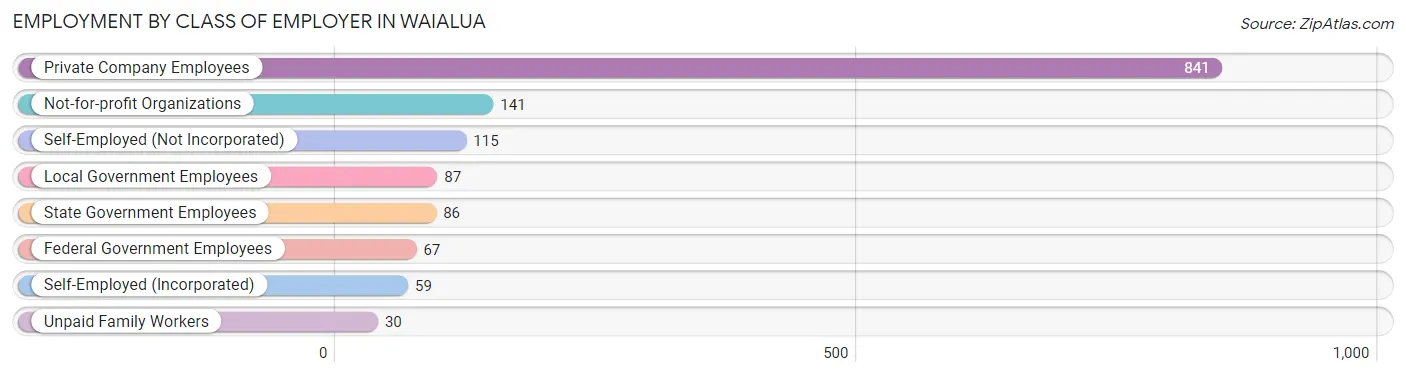
| Employer Class | # Employees | % Employees |
| Private Company Employees | 841 | 59.0% |
| Self-Employed (Incorporated) | 59 | 4.1% |
| Self-Employed (Not Incorporated) | 115 | 8.1% |
| Not-for-profit Organizations | 141 | 9.9% |
| Local Government Employees | 87 | 6.1% |
| State Government Employees | 86 | 6.0% |
| Federal Government Employees | 67 | 4.7% |
| Unpaid Family Workers | 30 | 2.1% |
| Total | 1,426 | 100.0% |
Employment Status by Age in Waialua
According to the labor force statistics for Waialua, out of the total population over 16 years of age (2,644), 59.3% or 1,568 individuals are in the labor force, with 5.9% or 93 of them unemployed. The age group with the highest labor force participation rate is 25 to 29 years, with 89.5% or 170 individuals in the labor force. Within the labor force, the 16 to 19 years age range has the highest percentage of unemployed individuals, with 19.0% or 11 of them being unemployed.
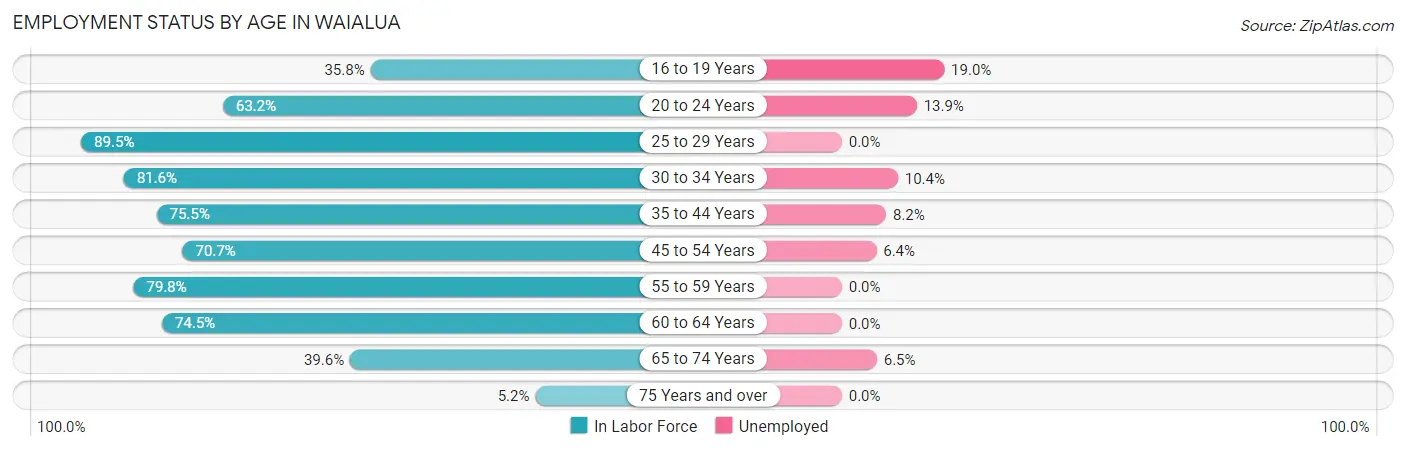
| Age Bracket | In Labor Force | Unemployed |
| 16 to 19 Years | 58 (35.8%) | 11 (19.0%) |
| 20 to 24 Years | 72 (63.2%) | 10 (13.9%) |
| 25 to 29 Years | 170 (89.5%) | 0 (0.0%) |
| 30 to 34 Years | 164 (81.6%) | 17 (10.4%) |
| 35 to 44 Years | 281 (75.5%) | 23 (8.2%) |
| 45 to 54 Years | 313 (70.7%) | 20 (6.4%) |
| 55 to 59 Years | 138 (79.8%) | 0 (0.0%) |
| 60 to 64 Years | 172 (74.5%) | 0 (0.0%) |
| 65 to 74 Years | 185 (39.6%) | 12 (6.5%) |
| 75 Years and over | 15 (5.2%) | 0 (0.0%) |
| Total | 1,568 (59.3%) | 93 (5.9%) |
Employment Status by Educational Attainment in Waialua
According to labor force statistics for Waialua, 76.9% of individuals (1,238) out of the total population between 25 and 64 years of age (1,610) are in the labor force, with 4.8% or 59 of them being unemployed. The group with the highest labor force participation rate are those with the educational attainment of less than high school, with 100.0% or 50 individuals in the labor force. Within the labor force, individuals with less than high school education have the highest percentage of unemployment, with 20.0% or 10 of them being unemployed.
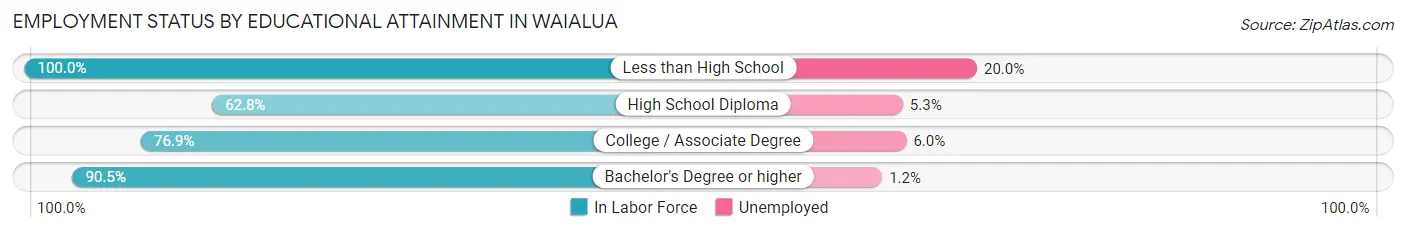
| Educational Attainment | In Labor Force | Unemployed |
| Less than High School | 50 (100.0%) | 10 (20.0%) |
| High School Diploma | 323 (62.8%) | 27 (5.3%) |
| College / Associate Degree | 464 (76.9%) | 36 (6.0%) |
| Bachelor's Degree or higher | 401 (90.5%) | 5 (1.2%) |
| Total | 1,238 (76.9%) | 77 (4.8%) |
Employment Occupations by Sex in Waialua
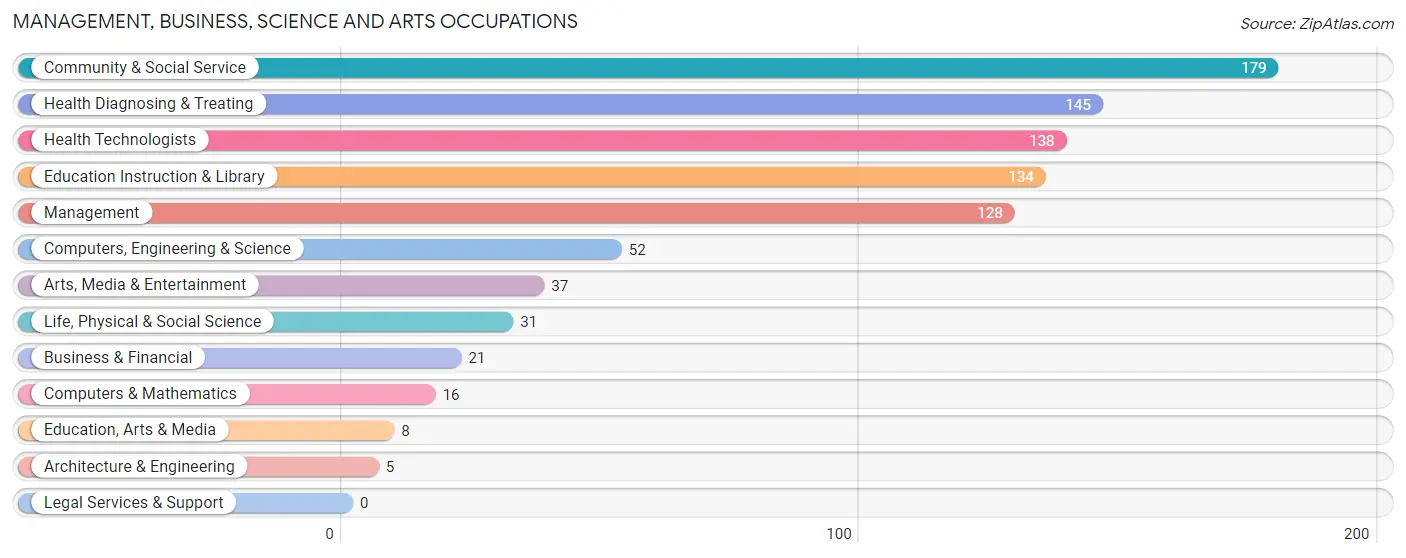
Management, Business, Science and Arts Occupations
The most common Management, Business, Science and Arts occupations in Waialua are Community & Social Service (179 | 12.1%), Health Diagnosing & Treating (145 | 9.8%), Health Technologists (138 | 9.4%), Education Instruction & Library (134 | 9.1%), and Management (128 | 8.7%).
Management, Business, Science and Arts Occupations by Sex
Within the Management, Business, Science and Arts occupations in Waialua, the most male-oriented occupations are Architecture & Engineering (100.0%), Management (60.2%), and Arts, Media & Entertainment (48.6%), while the most female-oriented occupations are Business & Financial (100.0%), Education, Arts & Media (100.0%), and Health Technologists (89.1%).
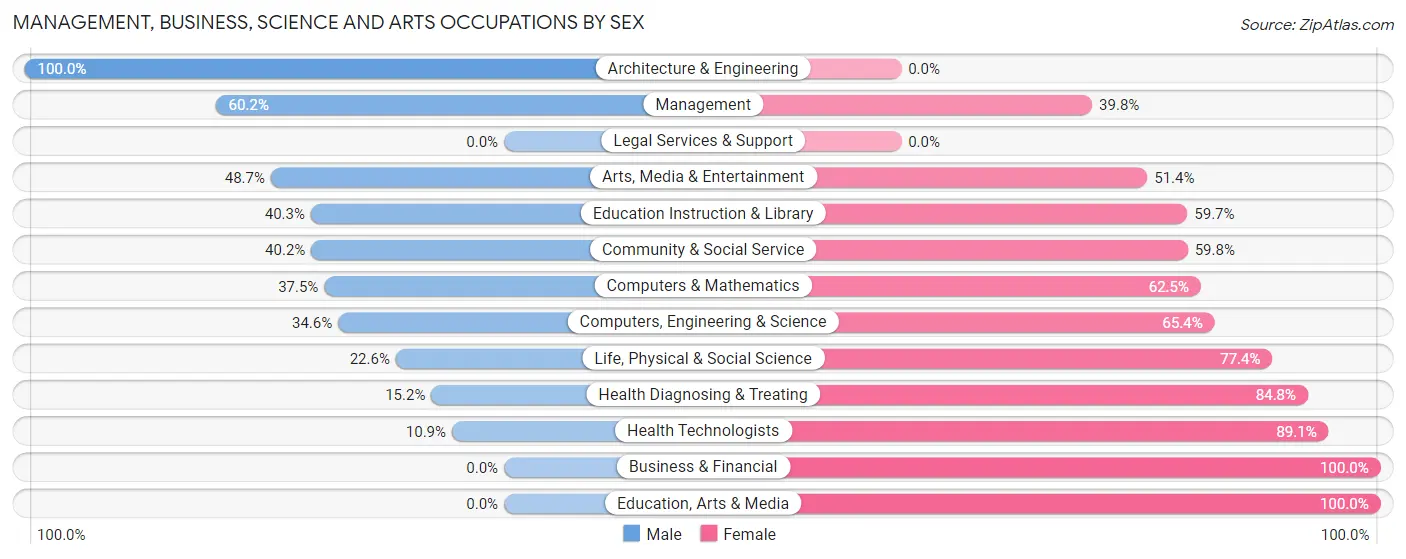
| Occupation | Male | Female |
| Management | 77 (60.2%) | 51 (39.8%) |
| Business & Financial | 0 (0.0%) | 21 (100.0%) |
| Computers, Engineering & Science | 18 (34.6%) | 34 (65.4%) |
| Computers & Mathematics | 6 (37.5%) | 10 (62.5%) |
| Architecture & Engineering | 5 (100.0%) | 0 (0.0%) |
| Life, Physical & Social Science | 7 (22.6%) | 24 (77.4%) |
| Community & Social Service | 72 (40.2%) | 107 (59.8%) |
| Education, Arts & Media | 0 (0.0%) | 8 (100.0%) |
| Legal Services & Support | 0 (0.0%) | 0 (0.0%) |
| Education Instruction & Library | 54 (40.3%) | 80 (59.7%) |
| Arts, Media & Entertainment | 18 (48.6%) | 19 (51.3%) |
| Health Diagnosing & Treating | 22 (15.2%) | 123 (84.8%) |
| Health Technologists | 15 (10.9%) | 123 (89.1%) |
| Total (Category) | 189 (36.0%) | 336 (64.0%) |
| Total (Overall) | 752 (51.0%) | 723 (49.0%) |
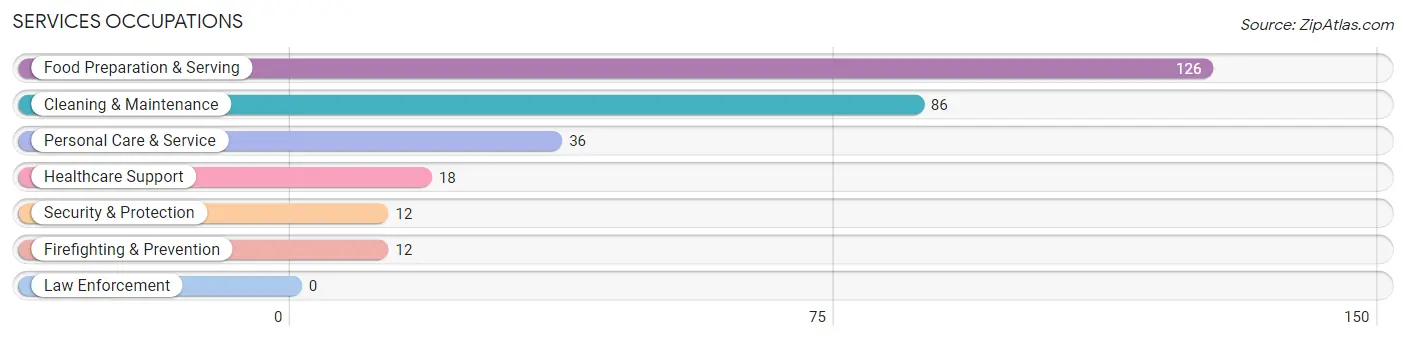
Services Occupations
The most common Services occupations in Waialua are Food Preparation & Serving (126 | 8.5%), Cleaning & Maintenance (86 | 5.8%), Personal Care & Service (36 | 2.4%), Healthcare Support (18 | 1.2%), and Security & Protection (12 | 0.8%).
Services Occupations by Sex
Within the Services occupations in Waialua, the most male-oriented occupations are Cleaning & Maintenance (83.7%), Security & Protection (41.7%), and Firefighting & Prevention (41.7%), while the most female-oriented occupations are Healthcare Support (100.0%), Personal Care & Service (100.0%), and Food Preparation & Serving (62.7%).
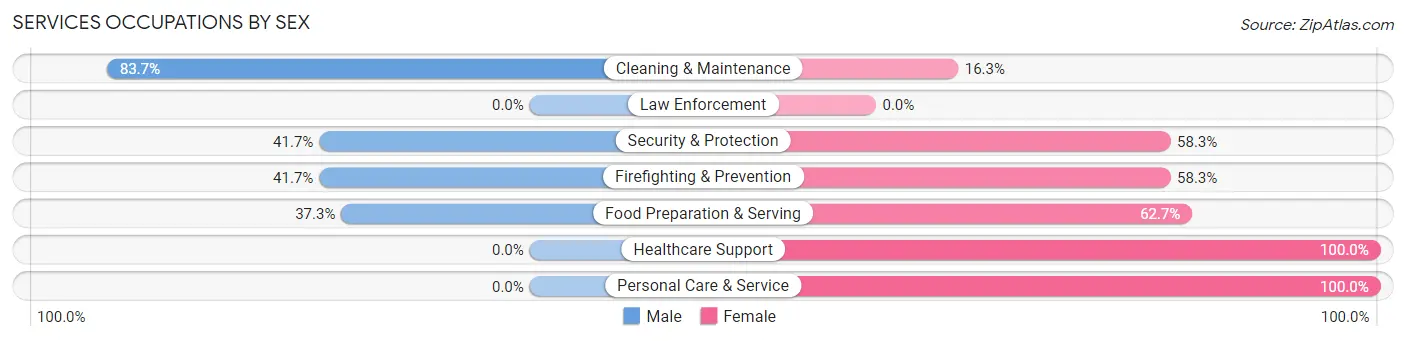
| Occupation | Male | Female |
| Healthcare Support | 0 (0.0%) | 18 (100.0%) |
| Security & Protection | 5 (41.7%) | 7 (58.3%) |
| Firefighting & Prevention | 5 (41.7%) | 7 (58.3%) |
| Law Enforcement | 0 (0.0%) | 0 (0.0%) |
| Food Preparation & Serving | 47 (37.3%) | 79 (62.7%) |
| Cleaning & Maintenance | 72 (83.7%) | 14 (16.3%) |
| Personal Care & Service | 0 (0.0%) | 36 (100.0%) |
| Total (Category) | 124 (44.6%) | 154 (55.4%) |
| Total (Overall) | 752 (51.0%) | 723 (49.0%) |
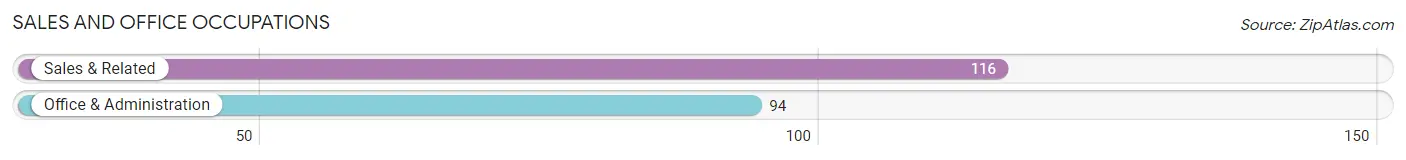
Sales and Office Occupations
The most common Sales and Office occupations in Waialua are Sales & Related (116 | 7.9%), and Office & Administration (94 | 6.4%).
Sales and Office Occupations by Sex
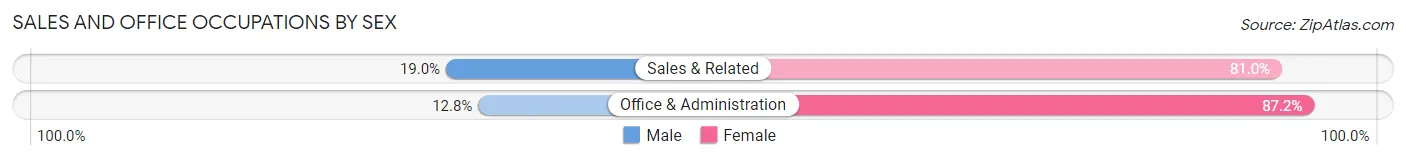
| Occupation | Male | Female |
| Sales & Related | 22 (19.0%) | 94 (81.0%) |
| Office & Administration | 12 (12.8%) | 82 (87.2%) |
| Total (Category) | 34 (16.2%) | 176 (83.8%) |
| Total (Overall) | 752 (51.0%) | 723 (49.0%) |
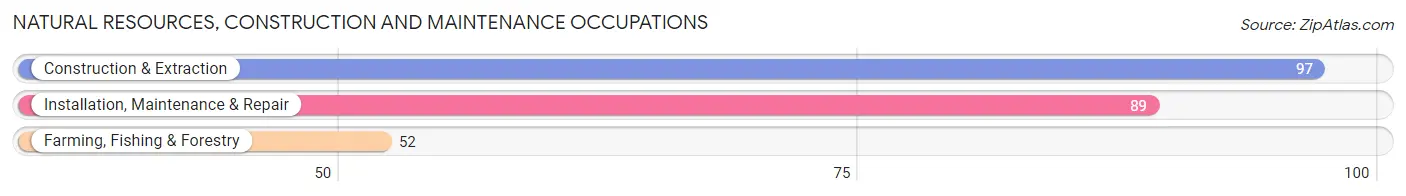
Natural Resources, Construction and Maintenance Occupations
The most common Natural Resources, Construction and Maintenance occupations in Waialua are Construction & Extraction (97 | 6.6%), Installation, Maintenance & Repair (89 | 6.0%), and Farming, Fishing & Forestry (52 | 3.5%).
Natural Resources, Construction and Maintenance Occupations by Sex
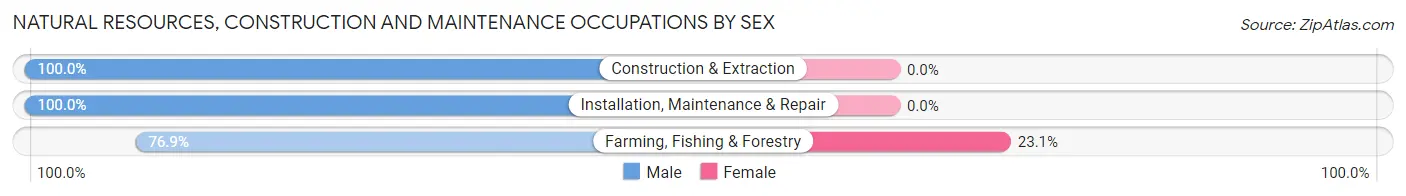
| Occupation | Male | Female |
| Farming, Fishing & Forestry | 40 (76.9%) | 12 (23.1%) |
| Construction & Extraction | 97 (100.0%) | 0 (0.0%) |
| Installation, Maintenance & Repair | 89 (100.0%) | 0 (0.0%) |
| Total (Category) | 226 (95.0%) | 12 (5.0%) |
| Total (Overall) | 752 (51.0%) | 723 (49.0%) |
Production, Transportation and Moving Occupations
The most common Production, Transportation and Moving occupations in Waialua are Production (135 | 9.1%), Transportation (74 | 5.0%), and Material Moving (15 | 1.0%).
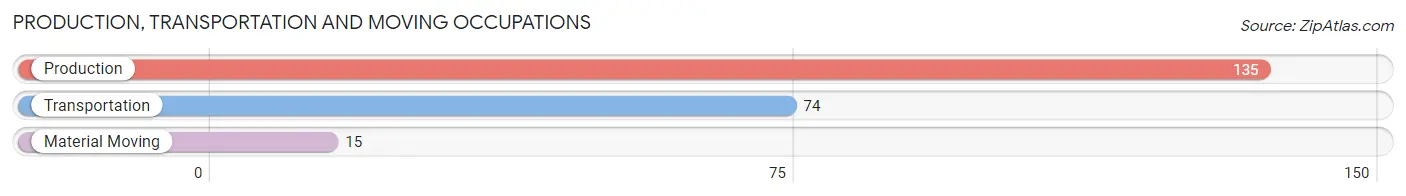
Production, Transportation and Moving Occupations by Sex
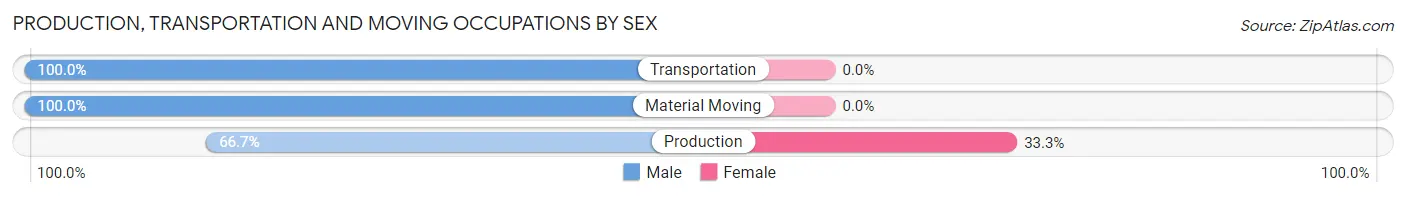
| Occupation | Male | Female |
| Production | 90 (66.7%) | 45 (33.3%) |
| Transportation | 74 (100.0%) | 0 (0.0%) |
| Material Moving | 15 (100.0%) | 0 (0.0%) |
| Total (Category) | 179 (79.9%) | 45 (20.1%) |
| Total (Overall) | 752 (51.0%) | 723 (49.0%) |
Employment Industries by Sex in Waialua
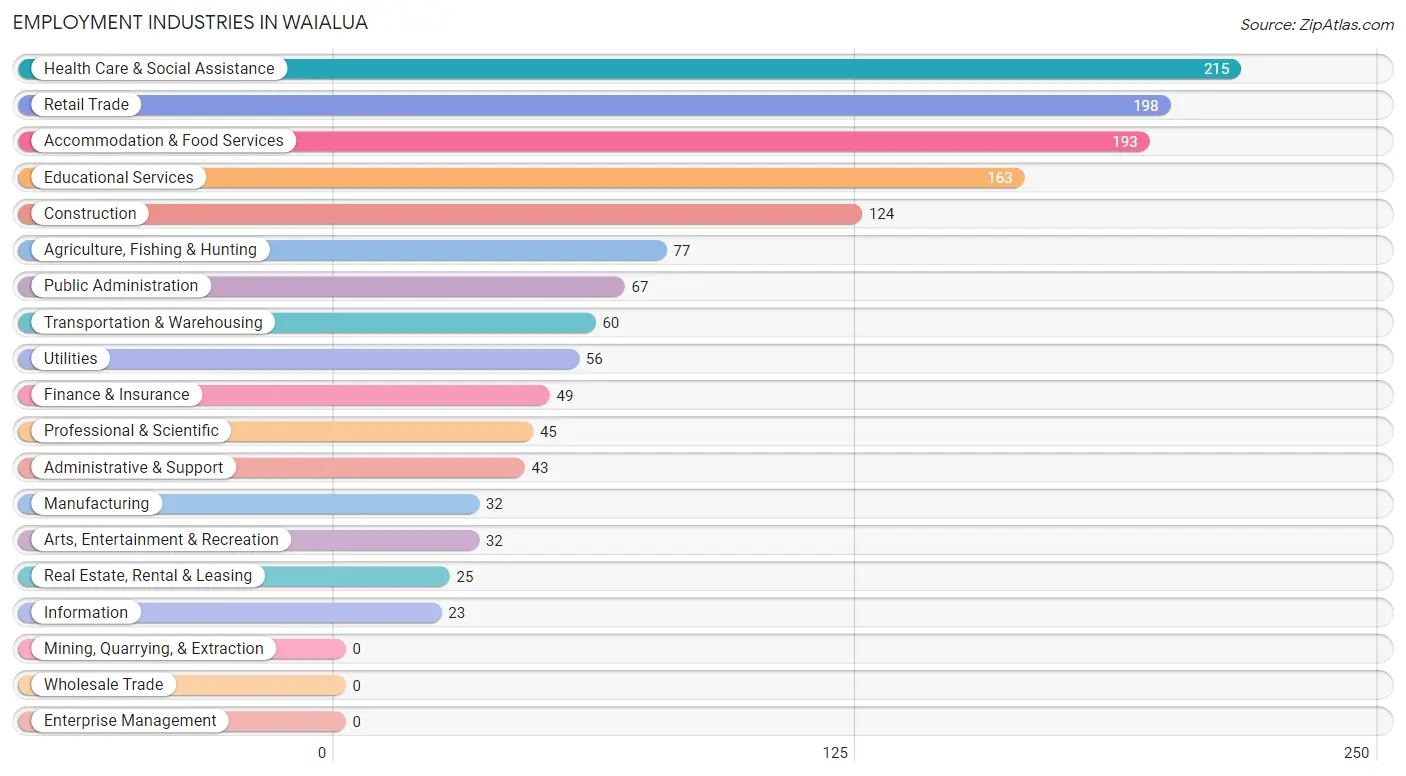
Employment Industries in Waialua
The major employment industries in Waialua include Health Care & Social Assistance (215 | 14.6%), Retail Trade (198 | 13.4%), Accommodation & Food Services (193 | 13.1%), Educational Services (163 | 11.1%), and Construction (124 | 8.4%).
Employment Industries by Sex in Waialua
The Waialua industries that see more men than women are Transportation & Warehousing (100.0%), Utilities (100.0%), and Construction (87.1%), whereas the industries that tend to have a higher number of women are Finance & Insurance (100.0%), Health Care & Social Assistance (78.1%), and Professional & Scientific (75.6%).
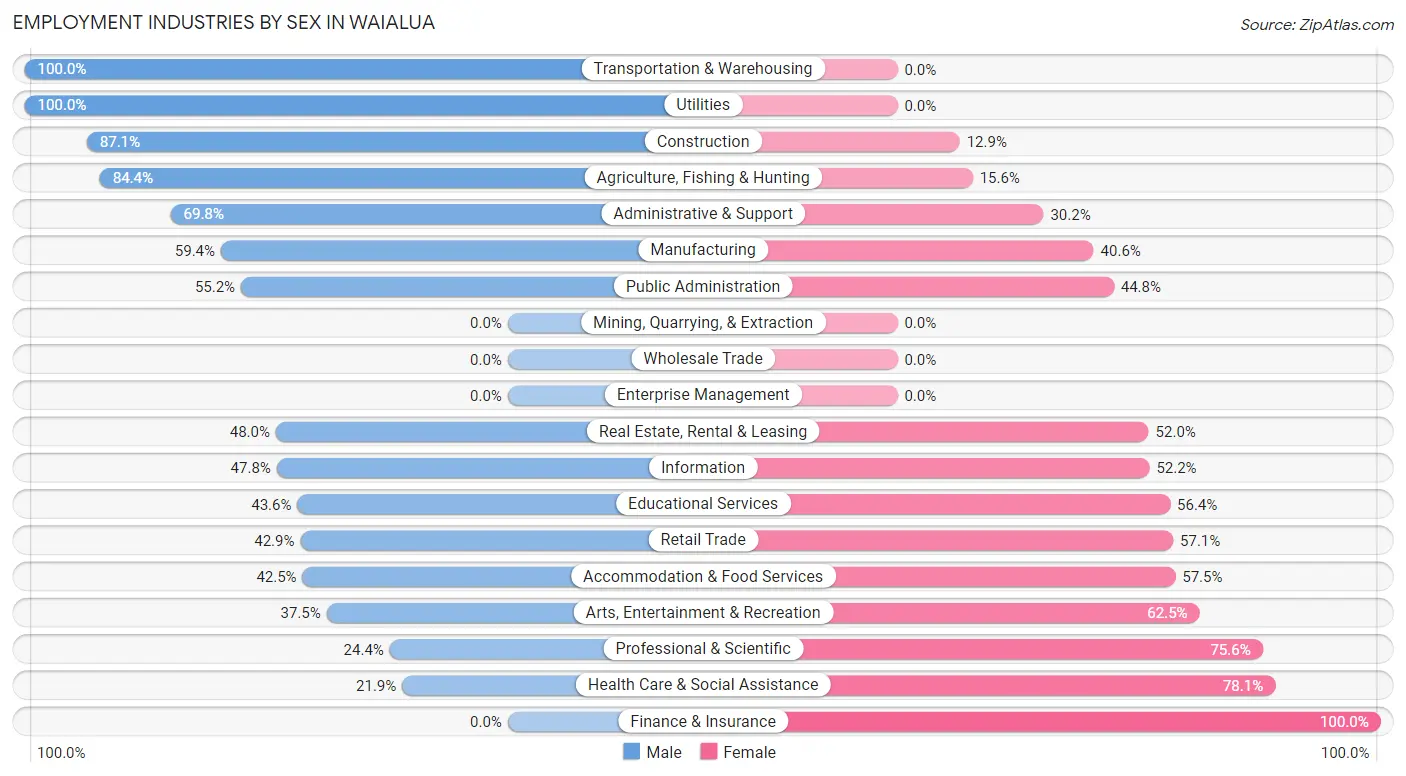
| Industry | Male | Female |
| Agriculture, Fishing & Hunting | 65 (84.4%) | 12 (15.6%) |
| Mining, Quarrying, & Extraction | 0 (0.0%) | 0 (0.0%) |
| Construction | 108 (87.1%) | 16 (12.9%) |
| Manufacturing | 19 (59.4%) | 13 (40.6%) |
| Wholesale Trade | 0 (0.0%) | 0 (0.0%) |
| Retail Trade | 85 (42.9%) | 113 (57.1%) |
| Transportation & Warehousing | 60 (100.0%) | 0 (0.0%) |
| Utilities | 56 (100.0%) | 0 (0.0%) |
| Information | 11 (47.8%) | 12 (52.2%) |
| Finance & Insurance | 0 (0.0%) | 49 (100.0%) |
| Real Estate, Rental & Leasing | 12 (48.0%) | 13 (52.0%) |
| Professional & Scientific | 11 (24.4%) | 34 (75.6%) |
| Enterprise Management | 0 (0.0%) | 0 (0.0%) |
| Administrative & Support | 30 (69.8%) | 13 (30.2%) |
| Educational Services | 71 (43.6%) | 92 (56.4%) |
| Health Care & Social Assistance | 47 (21.9%) | 168 (78.1%) |
| Arts, Entertainment & Recreation | 12 (37.5%) | 20 (62.5%) |
| Accommodation & Food Services | 82 (42.5%) | 111 (57.5%) |
| Public Administration | 37 (55.2%) | 30 (44.8%) |
| Total | 752 (51.0%) | 723 (49.0%) |
Education in Waialua
School Enrollment in Waialua
The most common levels of schooling among the 584 students in Waialua are high school (211 | 36.1%), elementary school (100 | 17.1%), and middle school (81 | 13.9%).
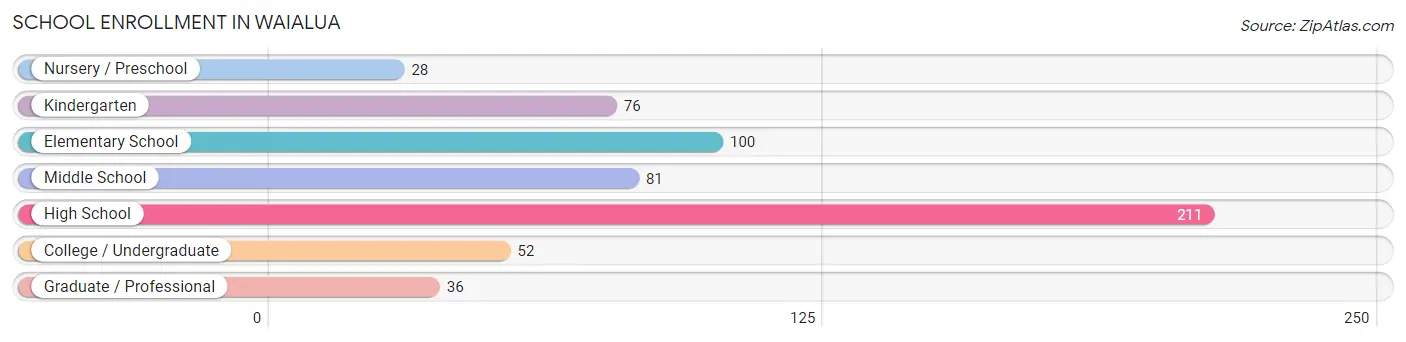
| School Level | # Students | % Students |
| Nursery / Preschool | 28 | 4.8% |
| Kindergarten | 76 | 13.0% |
| Elementary School | 100 | 17.1% |
| Middle School | 81 | 13.9% |
| High School | 211 | 36.1% |
| College / Undergraduate | 52 | 8.9% |
| Graduate / Professional | 36 | 6.2% |
| Total | 584 | 100.0% |
School Enrollment by Age by Funding Source in Waialua
Out of a total of 584 students who are enrolled in schools in Waialua, 109 (18.7%) attend a private institution, while the remaining 475 (81.3%) are enrolled in public schools. The age group of 3 to 4 year olds has the highest likelihood of being enrolled in private schools, with 28 (100.0% in the age bracket) enrolled. Conversely, the age group of 15 to 17 year olds has the lowest likelihood of being enrolled in a private school, with 165 (100.0% in the age bracket) attending a public institution.
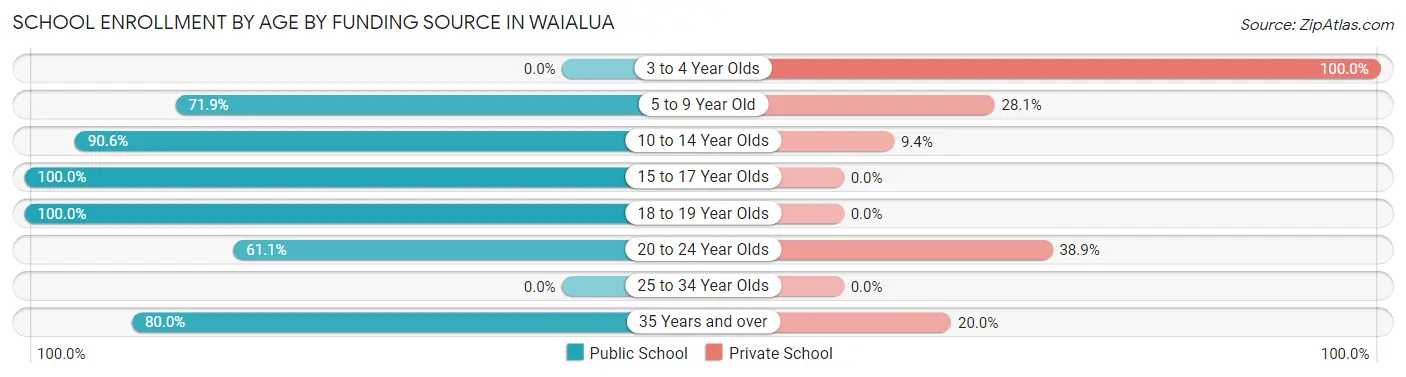
| Age Bracket | Public School | Private School |
| 3 to 4 Year Olds | 0 (0.0%) | 28 (100.0%) |
| 5 to 9 Year Old | 110 (71.9%) | 43 (28.1%) |
| 10 to 14 Year Olds | 116 (90.6%) | 12 (9.4%) |
| 15 to 17 Year Olds | 165 (100.0%) | 0 (0.0%) |
| 18 to 19 Year Olds | 14 (100.0%) | 0 (0.0%) |
| 20 to 24 Year Olds | 22 (61.1%) | 14 (38.9%) |
| 25 to 34 Year Olds | 0 (0.0%) | 0 (0.0%) |
| 35 Years and over | 48 (80.0%) | 12 (20.0%) |
| Total | 475 (81.3%) | 109 (18.7%) |
Educational Attainment by Field of Study in Waialua
Science & technology (139 | 17.3%), social sciences (126 | 15.7%), business (117 | 14.5%), education (78 | 9.7%), and communications (78 | 9.7%) are the most common fields of study among 804 individuals in Waialua who have obtained a bachelor's degree or higher.
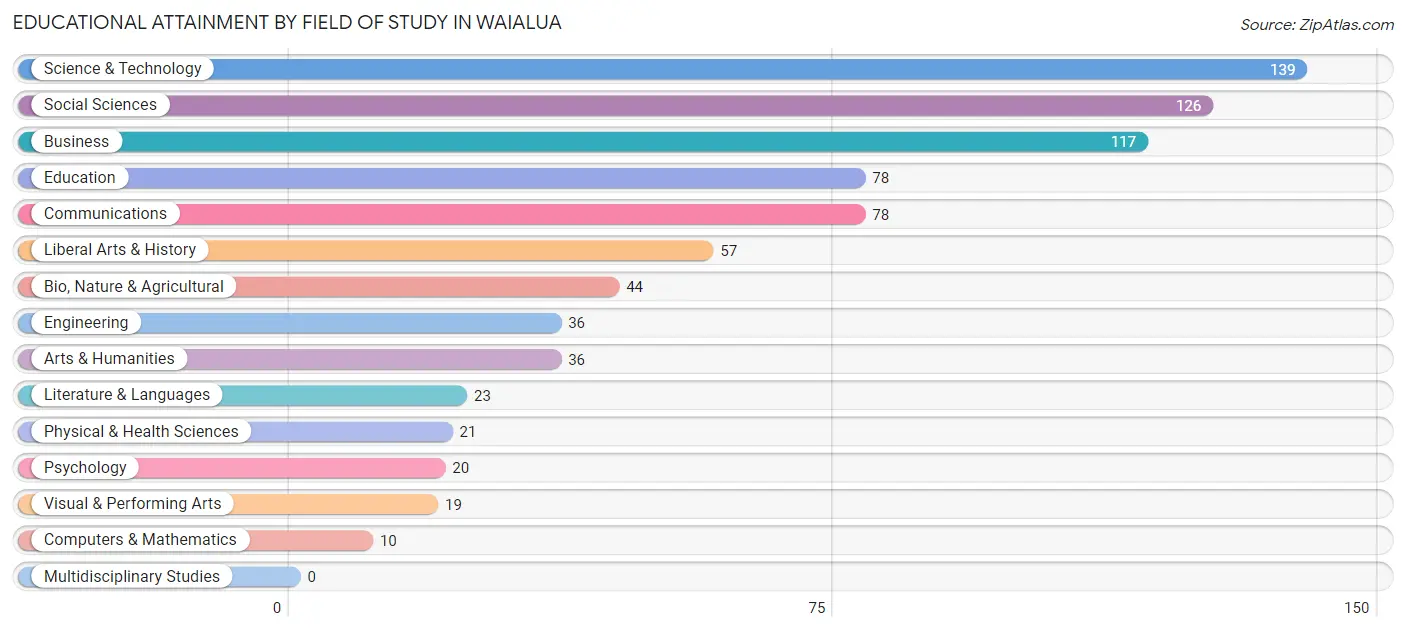
| Field of Study | # Graduates | % Graduates |
| Computers & Mathematics | 10 | 1.2% |
| Bio, Nature & Agricultural | 44 | 5.5% |
| Physical & Health Sciences | 21 | 2.6% |
| Psychology | 20 | 2.5% |
| Social Sciences | 126 | 15.7% |
| Engineering | 36 | 4.5% |
| Multidisciplinary Studies | 0 | 0.0% |
| Science & Technology | 139 | 17.3% |
| Business | 117 | 14.5% |
| Education | 78 | 9.7% |
| Literature & Languages | 23 | 2.9% |
| Liberal Arts & History | 57 | 7.1% |
| Visual & Performing Arts | 19 | 2.4% |
| Communications | 78 | 9.7% |
| Arts & Humanities | 36 | 4.5% |
| Total | 804 | 100.0% |
Transportation & Commute in Waialua
Vehicle Availability by Sex in Waialua
The most prevalent vehicle ownership categories in Waialua are males with 3 vehicles (354, accounting for 47.5%) and females with 3 vehicles (240, making up 52.1%).
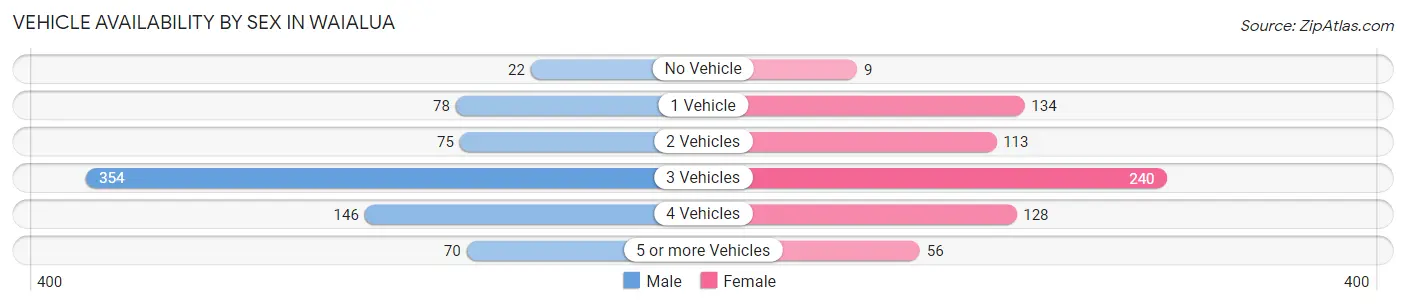
| Vehicles Available | Male | Female |
| No Vehicle | 22 (2.9%) | 9 (1.3%) |
| 1 Vehicle | 78 (10.5%) | 134 (19.7%) |
| 2 Vehicles | 75 (10.1%) | 113 (16.6%) |
| 3 Vehicles | 354 (47.5%) | 240 (35.3%) |
| 4 Vehicles | 146 (19.6%) | 128 (18.8%) |
| 5 or more Vehicles | 70 (9.4%) | 56 (8.2%) |
| Total | 745 (100.0%) | 680 (100.0%) |
Commute Time in Waialua
The most frequently occuring commute durations in Waialua are 30 to 34 minutes (238 commuters, 18.3%), 60 to 89 minutes (212 commuters, 16.3%), and 45 to 59 minutes (179 commuters, 13.8%).
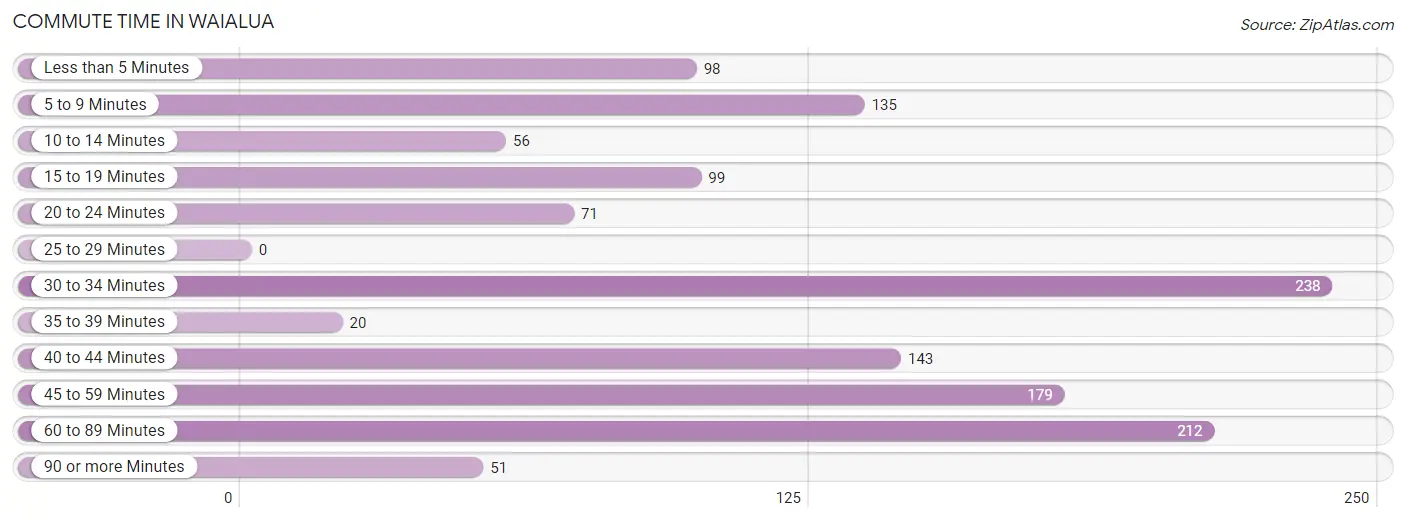
| Commute Time | # Commuters | % Commuters |
| Less than 5 Minutes | 98 | 7.5% |
| 5 to 9 Minutes | 135 | 10.4% |
| 10 to 14 Minutes | 56 | 4.3% |
| 15 to 19 Minutes | 99 | 7.6% |
| 20 to 24 Minutes | 71 | 5.4% |
| 25 to 29 Minutes | 0 | 0.0% |
| 30 to 34 Minutes | 238 | 18.3% |
| 35 to 39 Minutes | 20 | 1.5% |
| 40 to 44 Minutes | 143 | 11.0% |
| 45 to 59 Minutes | 179 | 13.8% |
| 60 to 89 Minutes | 212 | 16.3% |
| 90 or more Minutes | 51 | 3.9% |
Commute Time by Sex in Waialua
The most common commute times in Waialua are 30 to 34 minutes (123 commuters, 17.4%) for males and 30 to 34 minutes (115 commuters, 19.4%) for females.
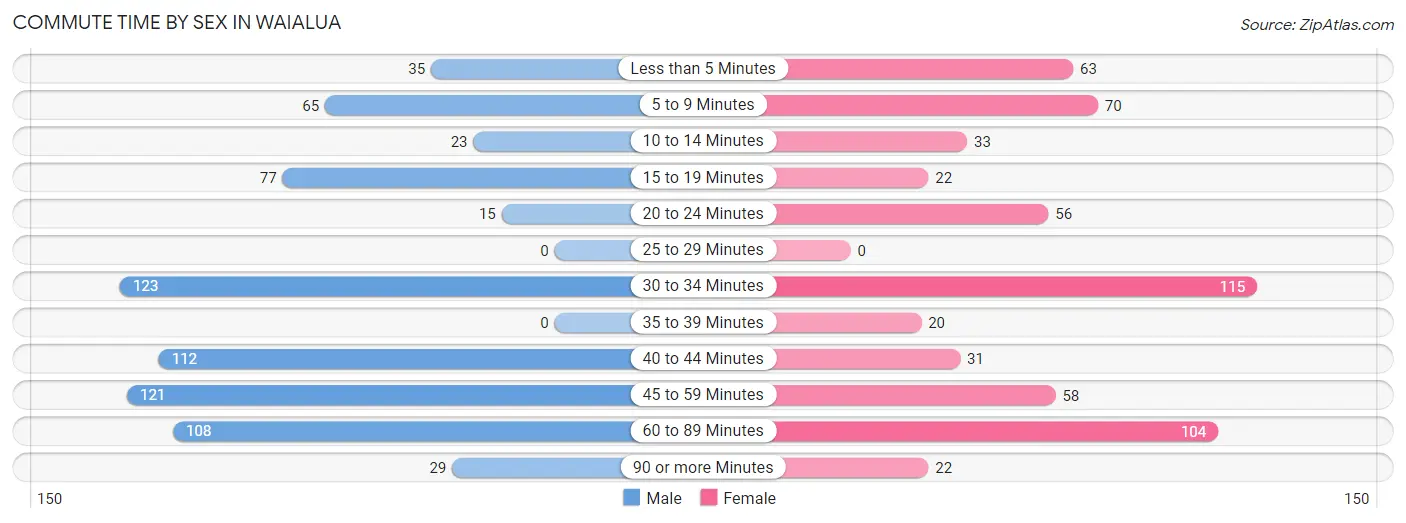
| Commute Time | Male | Female |
| Less than 5 Minutes | 35 (4.9%) | 63 (10.6%) |
| 5 to 9 Minutes | 65 (9.2%) | 70 (11.8%) |
| 10 to 14 Minutes | 23 (3.3%) | 33 (5.6%) |
| 15 to 19 Minutes | 77 (10.9%) | 22 (3.7%) |
| 20 to 24 Minutes | 15 (2.1%) | 56 (9.4%) |
| 25 to 29 Minutes | 0 (0.0%) | 0 (0.0%) |
| 30 to 34 Minutes | 123 (17.4%) | 115 (19.4%) |
| 35 to 39 Minutes | 0 (0.0%) | 20 (3.4%) |
| 40 to 44 Minutes | 112 (15.8%) | 31 (5.2%) |
| 45 to 59 Minutes | 121 (17.1%) | 58 (9.8%) |
| 60 to 89 Minutes | 108 (15.2%) | 104 (17.5%) |
| 90 or more Minutes | 29 (4.1%) | 22 (3.7%) |
Time of Departure to Work by Sex in Waialua
The most frequent times of departure to work in Waialua are 6:00 AM to 6:29 AM (118, 16.7%) for males and 7:00 AM to 7:29 AM (112, 18.9%) for females.
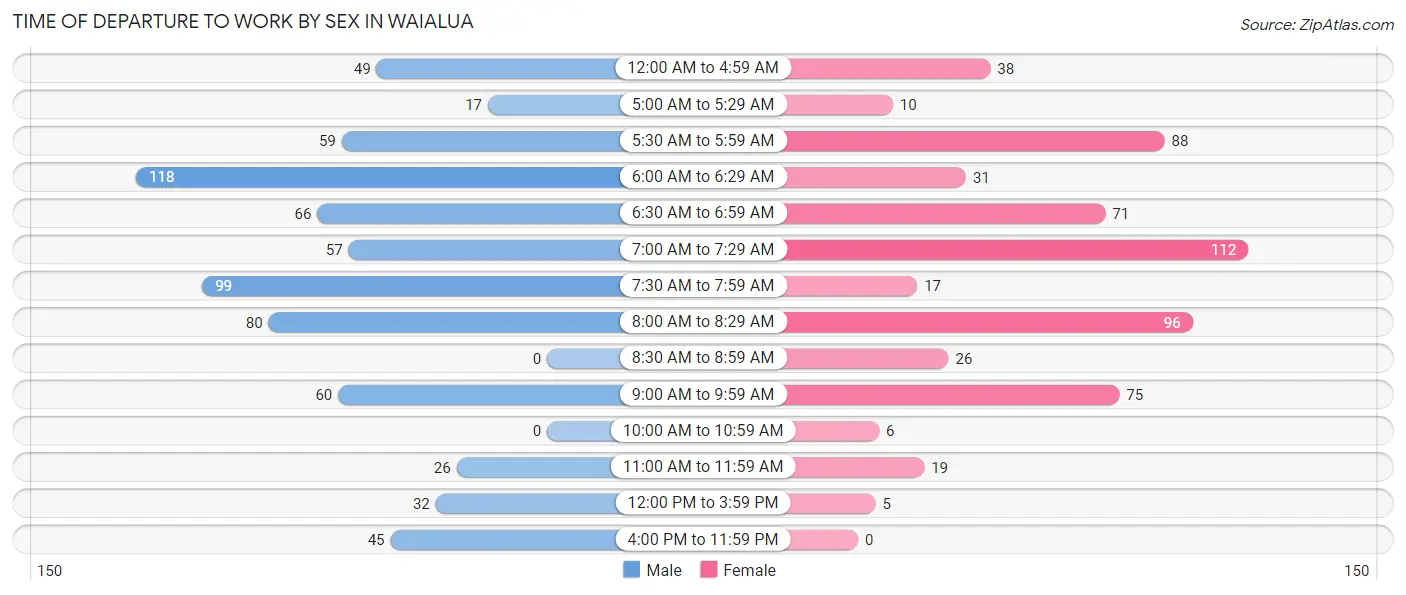
| Time of Departure | Male | Female |
| 12:00 AM to 4:59 AM | 49 (6.9%) | 38 (6.4%) |
| 5:00 AM to 5:29 AM | 17 (2.4%) | 10 (1.7%) |
| 5:30 AM to 5:59 AM | 59 (8.3%) | 88 (14.8%) |
| 6:00 AM to 6:29 AM | 118 (16.7%) | 31 (5.2%) |
| 6:30 AM to 6:59 AM | 66 (9.3%) | 71 (11.9%) |
| 7:00 AM to 7:29 AM | 57 (8.1%) | 112 (18.9%) |
| 7:30 AM to 7:59 AM | 99 (14.0%) | 17 (2.9%) |
| 8:00 AM to 8:29 AM | 80 (11.3%) | 96 (16.2%) |
| 8:30 AM to 8:59 AM | 0 (0.0%) | 26 (4.4%) |
| 9:00 AM to 9:59 AM | 60 (8.5%) | 75 (12.6%) |
| 10:00 AM to 10:59 AM | 0 (0.0%) | 6 (1.0%) |
| 11:00 AM to 11:59 AM | 26 (3.7%) | 19 (3.2%) |
| 12:00 PM to 3:59 PM | 32 (4.5%) | 5 (0.8%) |
| 4:00 PM to 11:59 PM | 45 (6.4%) | 0 (0.0%) |
| Total | 708 (100.0%) | 594 (100.0%) |
Housing Occupancy in Waialua
Occupancy by Ownership in Waialua
Of the total 1,049 dwellings in Waialua, owner-occupied units account for 609 (58.1%), while renter-occupied units make up 440 (41.9%).
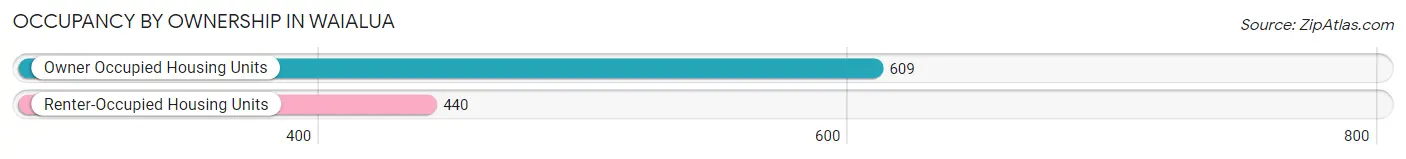
| Occupancy | # Housing Units | % Housing Units |
| Owner Occupied Housing Units | 609 | 58.1% |
| Renter-Occupied Housing Units | 440 | 41.9% |
| Total Occupied Housing Units | 1,049 | 100.0% |
Occupancy by Household Size in Waialua
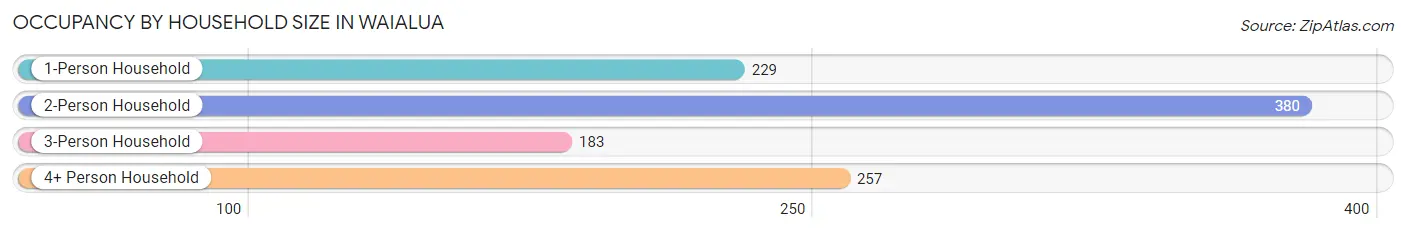
| Household Size | # Housing Units | % Housing Units |
| 1-Person Household | 229 | 21.8% |
| 2-Person Household | 380 | 36.2% |
| 3-Person Household | 183 | 17.4% |
| 4+ Person Household | 257 | 24.5% |
| Total Housing Units | 1,049 | 100.0% |
Occupancy by Ownership by Household Size in Waialua
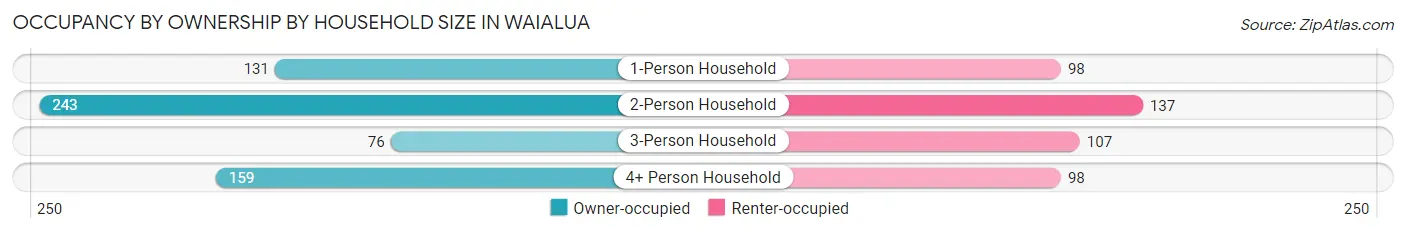
| Household Size | Owner-occupied | Renter-occupied |
| 1-Person Household | 131 (57.2%) | 98 (42.8%) |
| 2-Person Household | 243 (63.9%) | 137 (36.0%) |
| 3-Person Household | 76 (41.5%) | 107 (58.5%) |
| 4+ Person Household | 159 (61.9%) | 98 (38.1%) |
| Total Housing Units | 609 (58.1%) | 440 (41.9%) |
Occupancy by Educational Attainment in Waialua
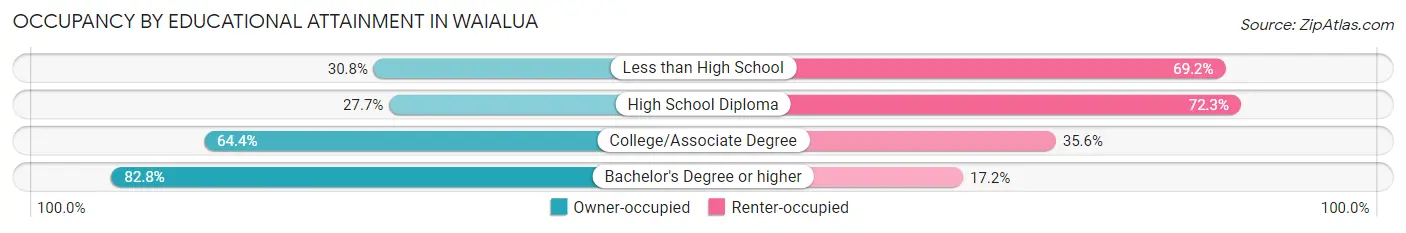
| Household Size | Owner-occupied | Renter-occupied |
| Less than High School | 16 (30.8%) | 36 (69.2%) |
| High School Diploma | 79 (27.7%) | 206 (72.3%) |
| College/Associate Degree | 264 (64.4%) | 146 (35.6%) |
| Bachelor's Degree or higher | 250 (82.8%) | 52 (17.2%) |
Occupancy by Age of Householder in Waialua
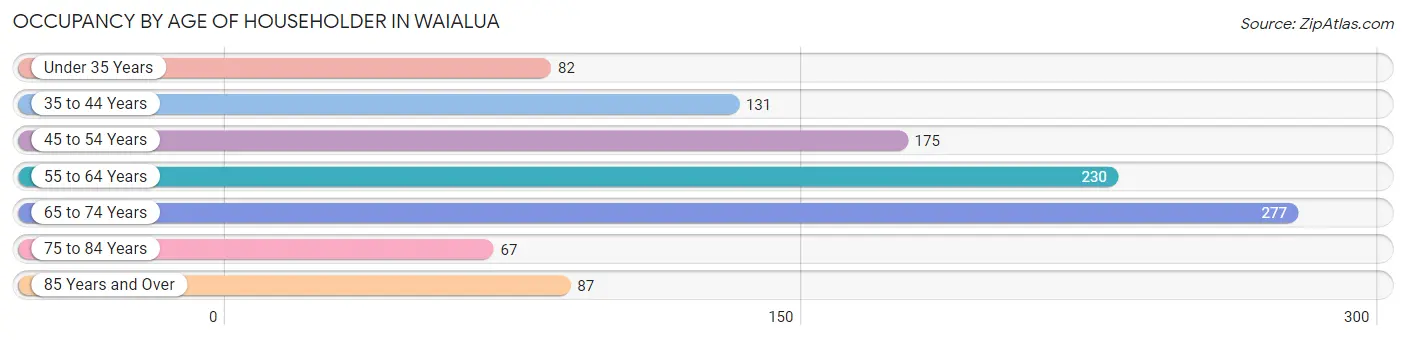
| Age Bracket | # Households | % Households |
| Under 35 Years | 82 | 7.8% |
| 35 to 44 Years | 131 | 12.5% |
| 45 to 54 Years | 175 | 16.7% |
| 55 to 64 Years | 230 | 21.9% |
| 65 to 74 Years | 277 | 26.4% |
| 75 to 84 Years | 67 | 6.4% |
| 85 Years and Over | 87 | 8.3% |
| Total | 1,049 | 100.0% |
Housing Finances in Waialua
Median Income by Occupancy in Waialua
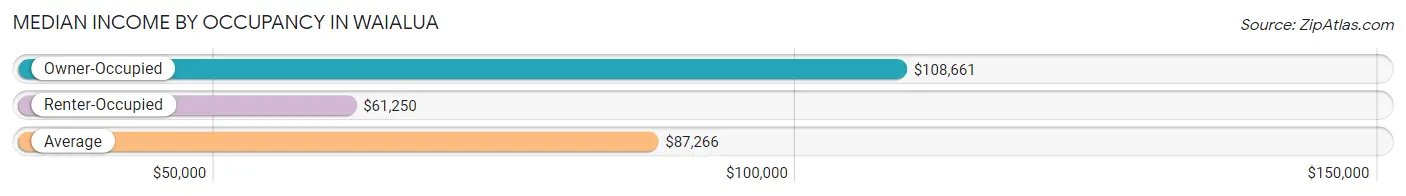
| Occupancy Type | # Households | Median Income |
| Owner-Occupied | 609 (58.1%) | $108,661 |
| Renter-Occupied | 440 (41.9%) | $61,250 |
| Average | 1,049 (100.0%) | $87,266 |
Occupancy by Householder Income Bracket in Waialua
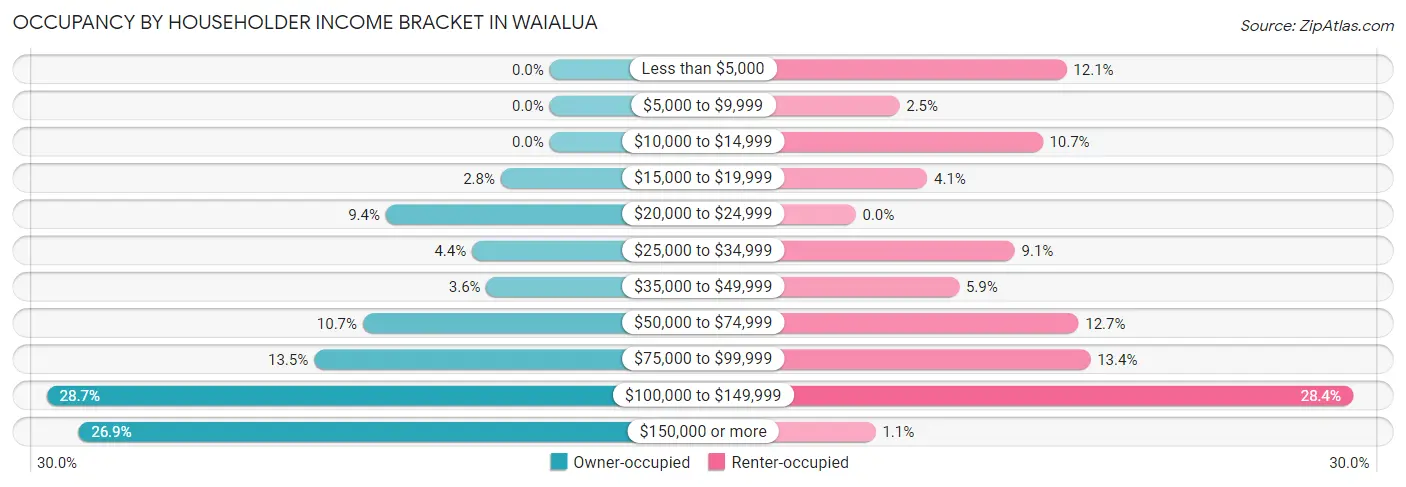
| Income Bracket | Owner-occupied | Renter-occupied |
| Less than $5,000 | 0 (0.0%) | 53 (12.0%) |
| $5,000 to $9,999 | 0 (0.0%) | 11 (2.5%) |
| $10,000 to $14,999 | 0 (0.0%) | 47 (10.7%) |
| $15,000 to $19,999 | 17 (2.8%) | 18 (4.1%) |
| $20,000 to $24,999 | 57 (9.4%) | 0 (0.0%) |
| $25,000 to $34,999 | 27 (4.4%) | 40 (9.1%) |
| $35,000 to $49,999 | 22 (3.6%) | 26 (5.9%) |
| $50,000 to $74,999 | 65 (10.7%) | 56 (12.7%) |
| $75,000 to $99,999 | 82 (13.5%) | 59 (13.4%) |
| $100,000 to $149,999 | 175 (28.7%) | 125 (28.4%) |
| $150,000 or more | 164 (26.9%) | 5 (1.1%) |
| Total | 609 (100.0%) | 440 (100.0%) |
Monthly Housing Cost Tiers in Waialua
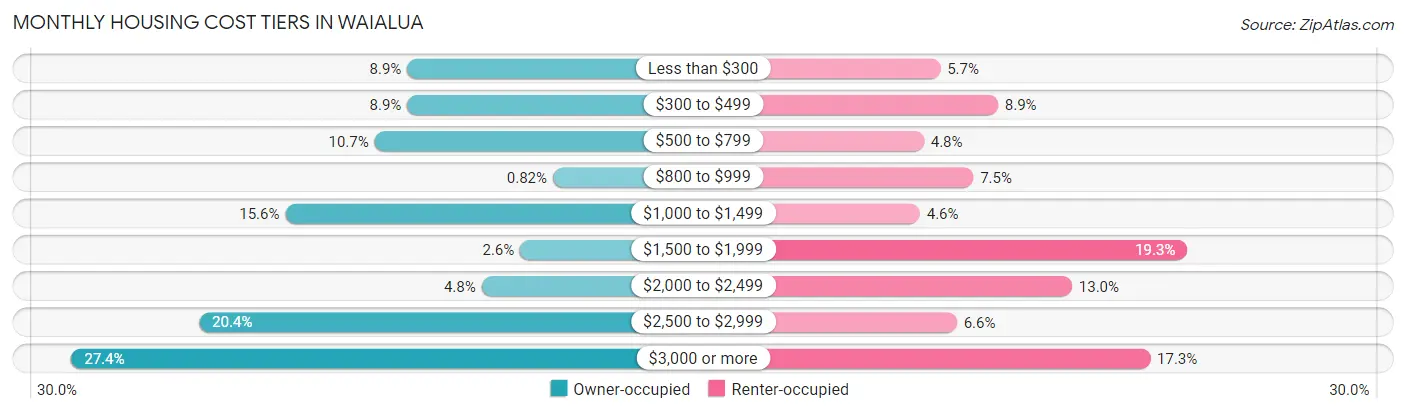
| Monthly Cost | Owner-occupied | Renter-occupied |
| Less than $300 | 54 (8.9%) | 25 (5.7%) |
| $300 to $499 | 54 (8.9%) | 39 (8.9%) |
| $500 to $799 | 65 (10.7%) | 21 (4.8%) |
| $800 to $999 | 5 (0.8%) | 33 (7.5%) |
| $1,000 to $1,499 | 95 (15.6%) | 20 (4.5%) |
| $1,500 to $1,999 | 16 (2.6%) | 85 (19.3%) |
| $2,000 to $2,499 | 29 (4.8%) | 57 (13.0%) |
| $2,500 to $2,999 | 124 (20.4%) | 29 (6.6%) |
| $3,000 or more | 167 (27.4%) | 76 (17.3%) |
| Total | 609 (100.0%) | 440 (100.0%) |
Physical Housing Characteristics in Waialua
Housing Structures in Waialua
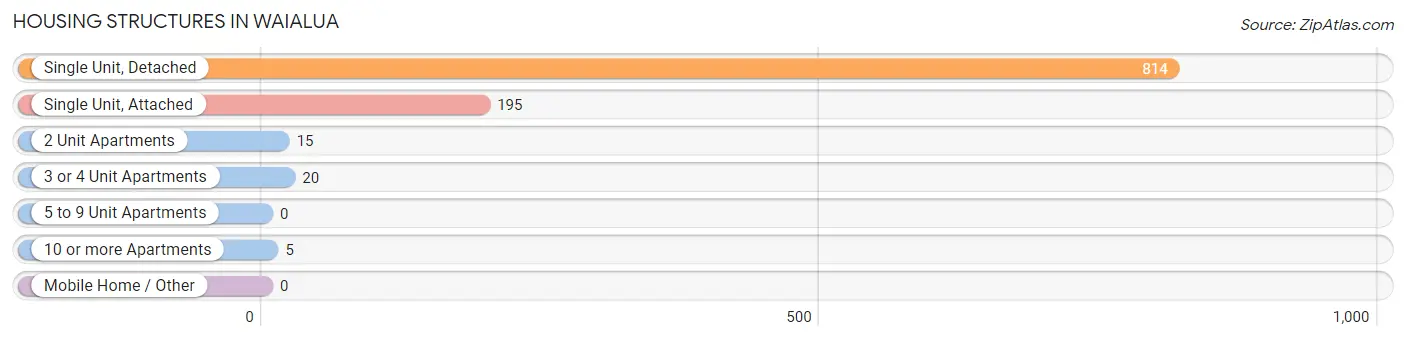
| Structure Type | # Housing Units | % Housing Units |
| Single Unit, Detached | 814 | 77.6% |
| Single Unit, Attached | 195 | 18.6% |
| 2 Unit Apartments | 15 | 1.4% |
| 3 or 4 Unit Apartments | 20 | 1.9% |
| 5 to 9 Unit Apartments | 0 | 0.0% |
| 10 or more Apartments | 5 | 0.5% |
| Mobile Home / Other | 0 | 0.0% |
| Total | 1,049 | 100.0% |
Housing Structures by Occupancy in Waialua
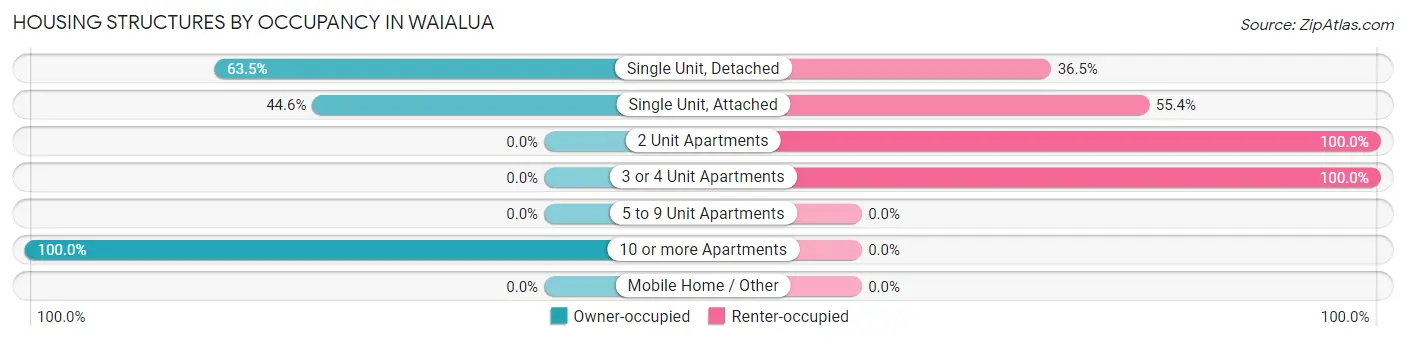
| Structure Type | Owner-occupied | Renter-occupied |
| Single Unit, Detached | 517 (63.5%) | 297 (36.5%) |
| Single Unit, Attached | 87 (44.6%) | 108 (55.4%) |
| 2 Unit Apartments | 0 (0.0%) | 15 (100.0%) |
| 3 or 4 Unit Apartments | 0 (0.0%) | 20 (100.0%) |
| 5 to 9 Unit Apartments | 0 (0.0%) | 0 (0.0%) |
| 10 or more Apartments | 5 (100.0%) | 0 (0.0%) |
| Mobile Home / Other | 0 (0.0%) | 0 (0.0%) |
| Total | 609 (58.1%) | 440 (41.9%) |
Housing Structures by Number of Rooms in Waialua
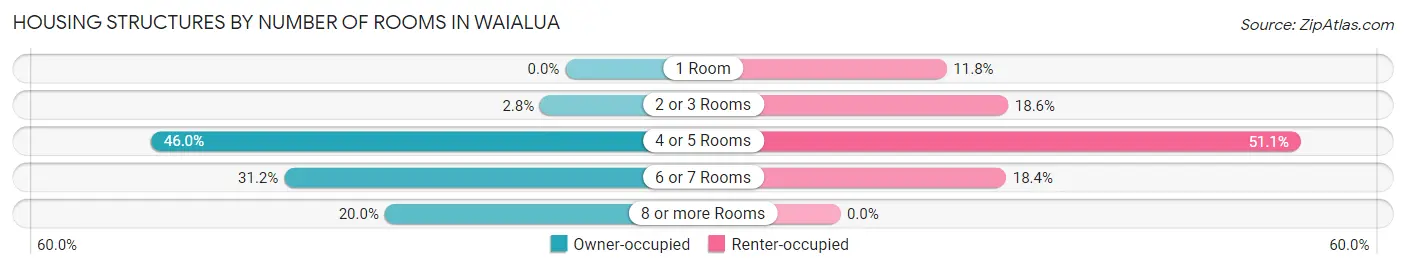
| Number of Rooms | Owner-occupied | Renter-occupied |
| 1 Room | 0 (0.0%) | 52 (11.8%) |
| 2 or 3 Rooms | 17 (2.8%) | 82 (18.6%) |
| 4 or 5 Rooms | 280 (46.0%) | 225 (51.1%) |
| 6 or 7 Rooms | 190 (31.2%) | 81 (18.4%) |
| 8 or more Rooms | 122 (20.0%) | 0 (0.0%) |
| Total | 609 (100.0%) | 440 (100.0%) |
Housing Structure by Heating Type in Waialua
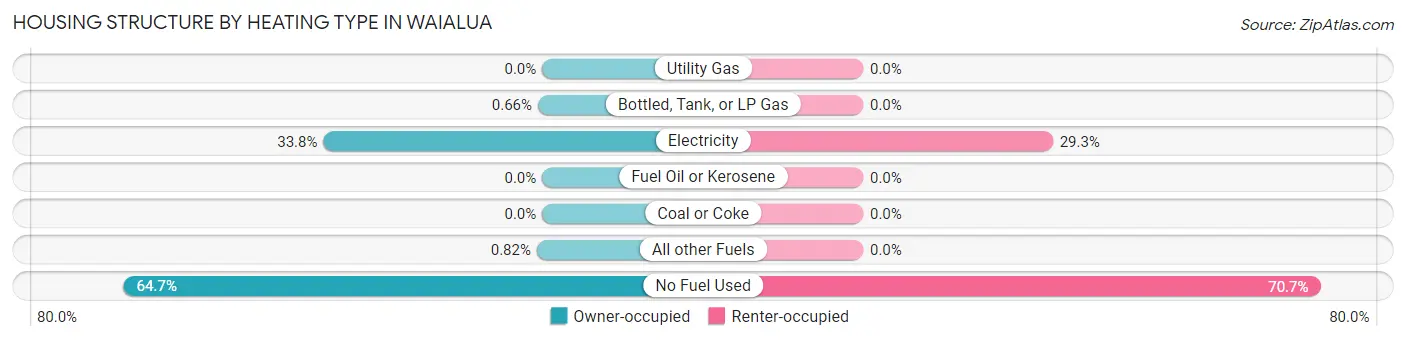
| Heating Type | Owner-occupied | Renter-occupied |
| Utility Gas | 0 (0.0%) | 0 (0.0%) |
| Bottled, Tank, or LP Gas | 4 (0.7%) | 0 (0.0%) |
| Electricity | 206 (33.8%) | 129 (29.3%) |
| Fuel Oil or Kerosene | 0 (0.0%) | 0 (0.0%) |
| Coal or Coke | 0 (0.0%) | 0 (0.0%) |
| All other Fuels | 5 (0.8%) | 0 (0.0%) |
| No Fuel Used | 394 (64.7%) | 311 (70.7%) |
| Total | 609 (100.0%) | 440 (100.0%) |
Household Vehicle Usage in Waialua
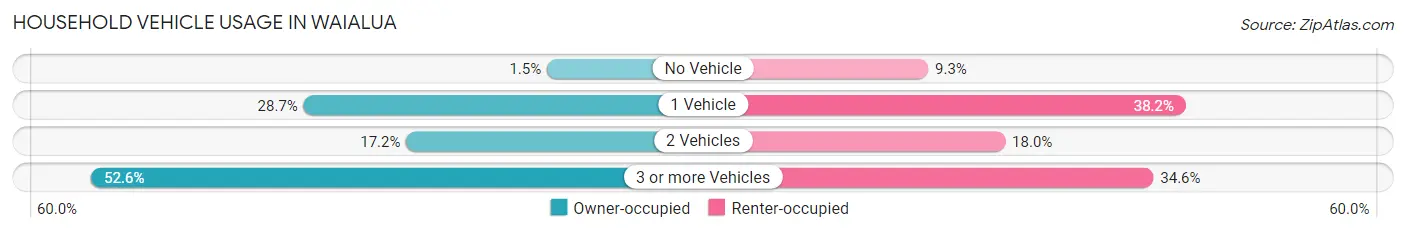
| Vehicles per Household | Owner-occupied | Renter-occupied |
| No Vehicle | 9 (1.5%) | 41 (9.3%) |
| 1 Vehicle | 175 (28.7%) | 168 (38.2%) |
| 2 Vehicles | 105 (17.2%) | 79 (17.9%) |
| 3 or more Vehicles | 320 (52.5%) | 152 (34.5%) |
| Total | 609 (100.0%) | 440 (100.0%) |
Real Estate & Mortgages in Waialua
Real Estate and Mortgage Overview in Waialua
| Characteristic | Without Mortgage | With Mortgage |
| Housing Units | 220 | 389 |
| Median Property Value | $827,100 | $901,500 |
| Median Household Income | $61,500 | $121 |
| Monthly Housing Costs | $558 | $167 |
| Real Estate Taxes | $2,506 | $0 |
Property Value by Mortgage Status in Waialua
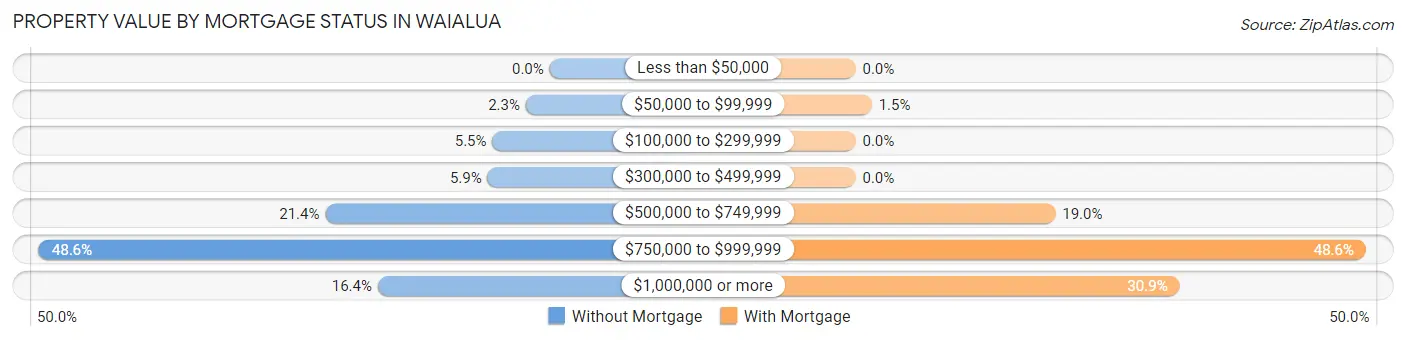
| Property Value | Without Mortgage | With Mortgage |
| Less than $50,000 | 0 (0.0%) | 0 (0.0%) |
| $50,000 to $99,999 | 5 (2.3%) | 6 (1.5%) |
| $100,000 to $299,999 | 12 (5.4%) | 0 (0.0%) |
| $300,000 to $499,999 | 13 (5.9%) | 0 (0.0%) |
| $500,000 to $749,999 | 47 (21.4%) | 74 (19.0%) |
| $750,000 to $999,999 | 107 (48.6%) | 189 (48.6%) |
| $1,000,000 or more | 36 (16.4%) | 120 (30.8%) |
| Total | 220 (100.0%) | 389 (100.0%) |
Household Income by Mortgage Status in Waialua
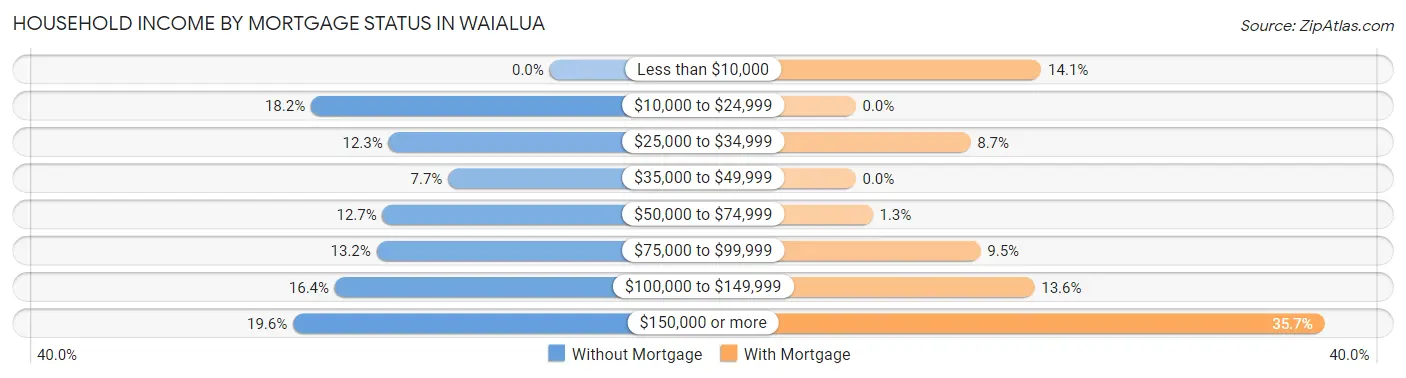
| Household Income | Without Mortgage | With Mortgage |
| Less than $10,000 | 0 (0.0%) | 55 (14.1%) |
| $10,000 to $24,999 | 40 (18.2%) | 0 (0.0%) |
| $25,000 to $34,999 | 27 (12.3%) | 34 (8.7%) |
| $35,000 to $49,999 | 17 (7.7%) | 0 (0.0%) |
| $50,000 to $74,999 | 28 (12.7%) | 5 (1.3%) |
| $75,000 to $99,999 | 29 (13.2%) | 37 (9.5%) |
| $100,000 to $149,999 | 36 (16.4%) | 53 (13.6%) |
| $150,000 or more | 43 (19.6%) | 139 (35.7%) |
| Total | 220 (100.0%) | 389 (100.0%) |
Property Value to Household Income Ratio in Waialua
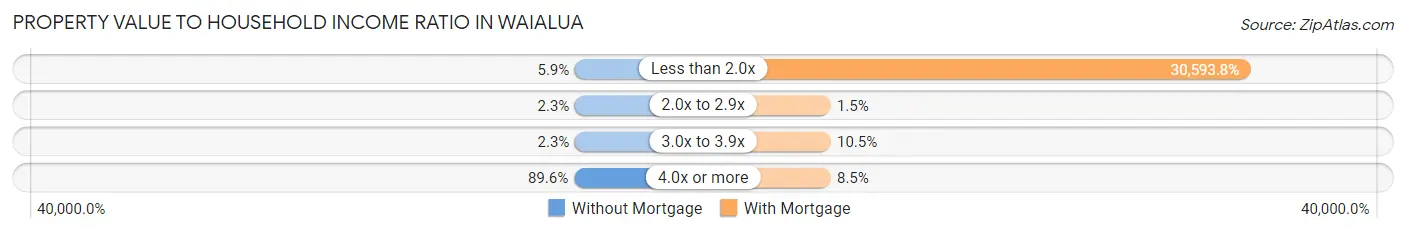
| Value-to-Income Ratio | Without Mortgage | With Mortgage |
| Less than 2.0x | 13 (5.9%) | 119,010 (30,593.8%) |
| 2.0x to 2.9x | 5 (2.3%) | 6 (1.5%) |
| 3.0x to 3.9x | 5 (2.3%) | 41 (10.5%) |
| 4.0x or more | 197 (89.5%) | 33 (8.5%) |
| Total | 220 (100.0%) | 389 (100.0%) |
Real Estate Taxes by Mortgage Status in Waialua
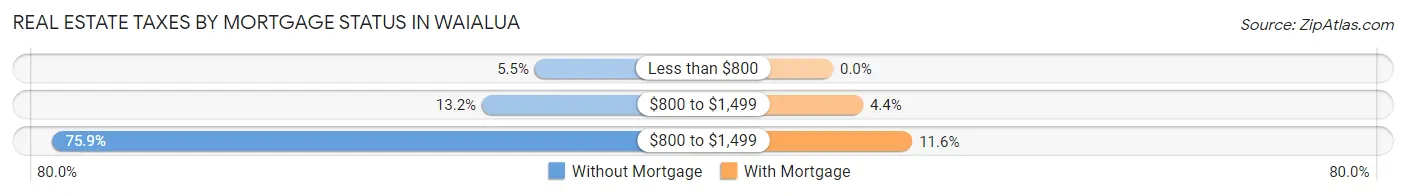
| Property Taxes | Without Mortgage | With Mortgage |
| Less than $800 | 12 (5.4%) | 0 (0.0%) |
| $800 to $1,499 | 29 (13.2%) | 17 (4.4%) |
| $800 to $1,499 | 167 (75.9%) | 45 (11.6%) |
| Total | 220 (100.0%) | 389 (100.0%) |
Health & Disability in Waialua
Health Insurance Coverage by Age in Waialua
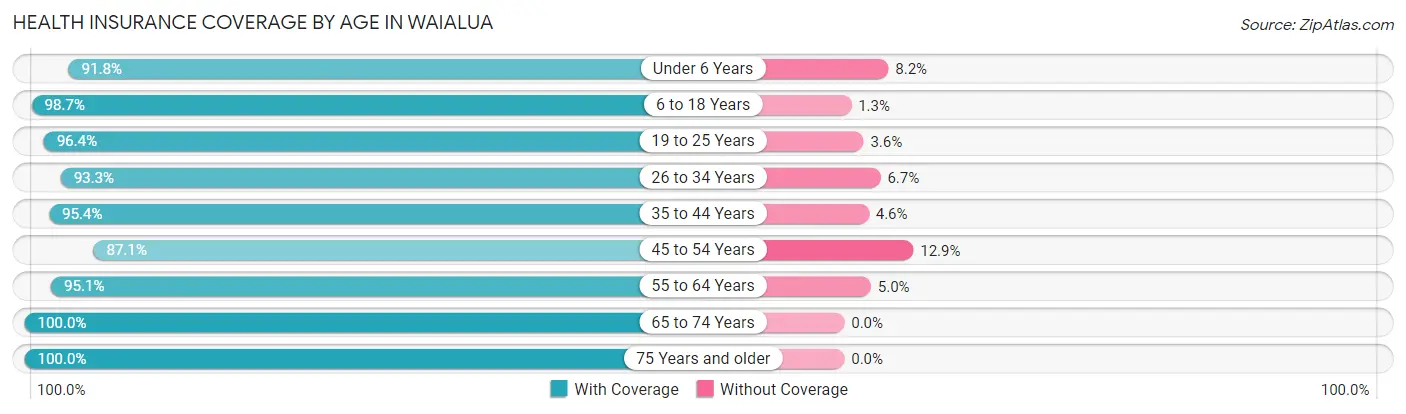
| Age Bracket | With Coverage | Without Coverage |
| Under 6 Years | 67 (91.8%) | 6 (8.2%) |
| 6 to 18 Years | 460 (98.7%) | 6 (1.3%) |
| 19 to 25 Years | 189 (96.4%) | 7 (3.6%) |
| 26 to 34 Years | 318 (93.3%) | 23 (6.7%) |
| 35 to 44 Years | 355 (95.4%) | 17 (4.6%) |
| 45 to 54 Years | 386 (87.1%) | 57 (12.9%) |
| 55 to 64 Years | 384 (95.1%) | 20 (5.0%) |
| 65 to 74 Years | 467 (100.0%) | 0 (0.0%) |
| 75 Years and older | 291 (100.0%) | 0 (0.0%) |
| Total | 2,917 (95.6%) | 136 (4.4%) |
Health Insurance Coverage by Citizenship Status in Waialua
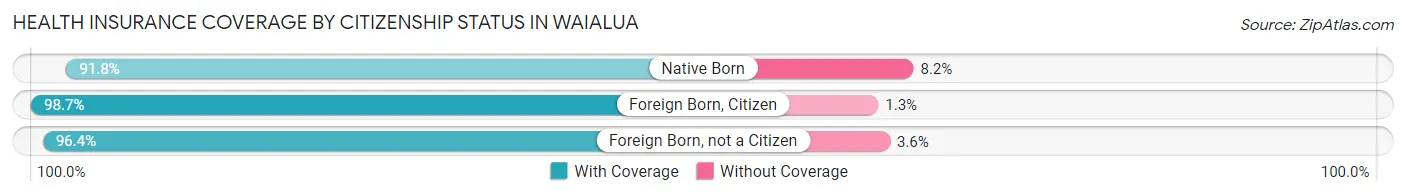
| Citizenship Status | With Coverage | Without Coverage |
| Native Born | 67 (91.8%) | 6 (8.2%) |
| Foreign Born, Citizen | 460 (98.7%) | 6 (1.3%) |
| Foreign Born, not a Citizen | 189 (96.4%) | 7 (3.6%) |
Health Insurance Coverage by Household Income in Waialua
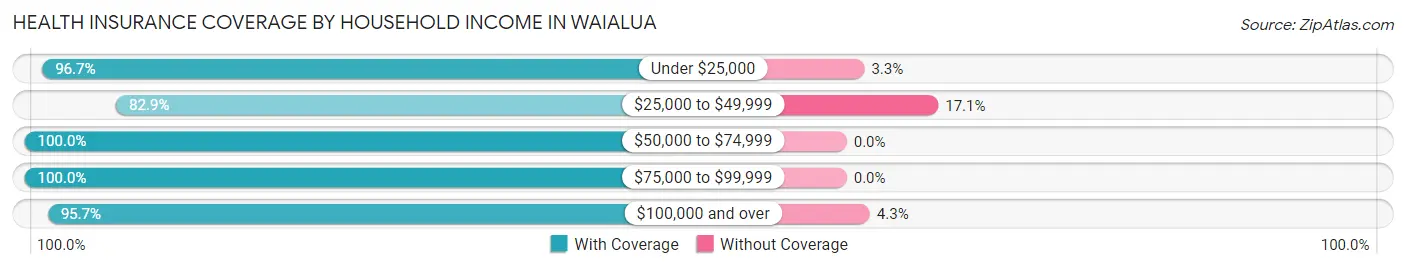
| Household Income | With Coverage | Without Coverage |
| Under $25,000 | 321 (96.7%) | 11 (3.3%) |
| $25,000 to $49,999 | 232 (82.9%) | 48 (17.1%) |
| $50,000 to $74,999 | 288 (100.0%) | 0 (0.0%) |
| $75,000 to $99,999 | 370 (100.0%) | 0 (0.0%) |
| $100,000 and over | 1,702 (95.7%) | 77 (4.3%) |
Public vs Private Health Insurance Coverage by Age in Waialua
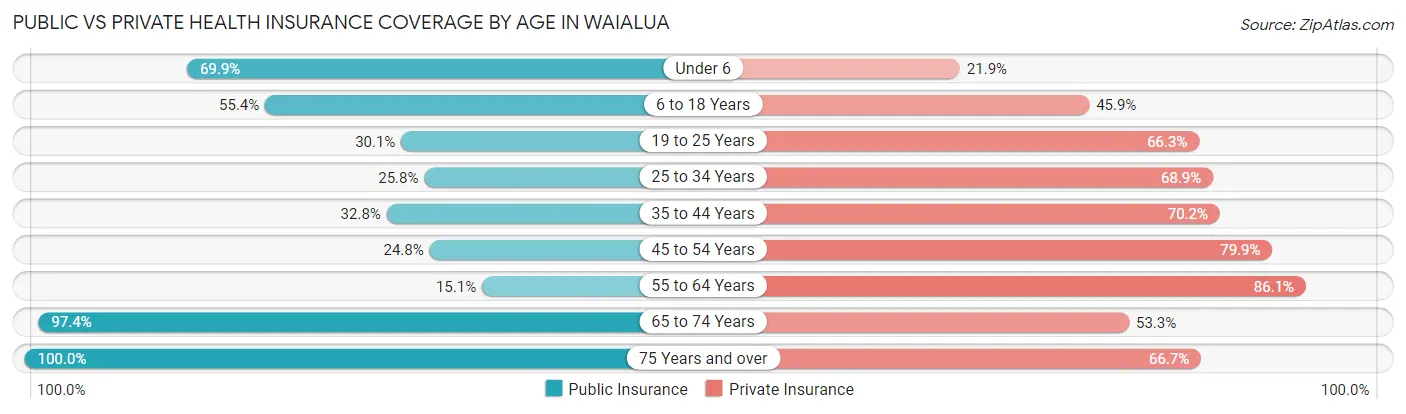
| Age Bracket | Public Insurance | Private Insurance |
| Under 6 | 51 (69.9%) | 16 (21.9%) |
| 6 to 18 Years | 258 (55.4%) | 214 (45.9%) |
| 19 to 25 Years | 59 (30.1%) | 130 (66.3%) |
| 25 to 34 Years | 88 (25.8%) | 235 (68.9%) |
| 35 to 44 Years | 122 (32.8%) | 261 (70.2%) |
| 45 to 54 Years | 110 (24.8%) | 354 (79.9%) |
| 55 to 64 Years | 61 (15.1%) | 348 (86.1%) |
| 65 to 74 Years | 455 (97.4%) | 249 (53.3%) |
| 75 Years and over | 291 (100.0%) | 194 (66.7%) |
| Total | 1,495 (49.0%) | 2,001 (65.5%) |
Disability Status by Sex by Age in Waialua
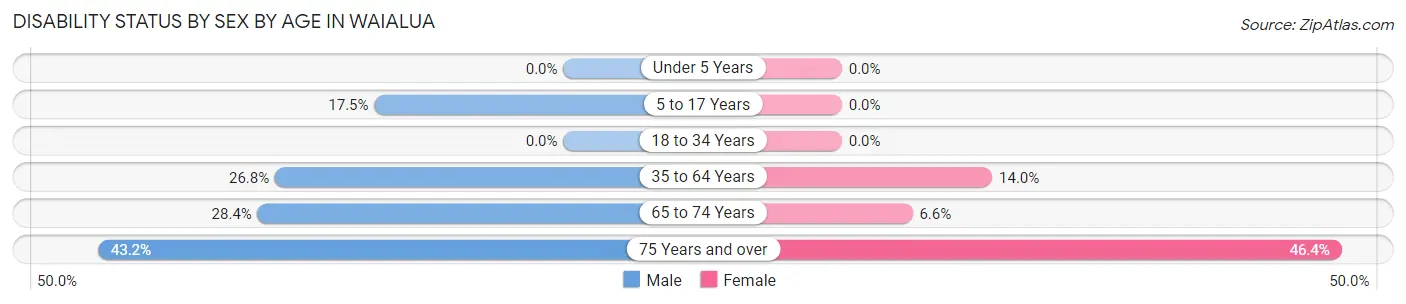
| Age Bracket | Male | Female |
| Under 5 Years | 0 (0.0%) | 0 (0.0%) |
| 5 to 17 Years | 37 (17.5%) | 0 (0.0%) |
| 18 to 34 Years | 0 (0.0%) | 0 (0.0%) |
| 35 to 64 Years | 167 (26.8%) | 83 (14.0%) |
| 65 to 74 Years | 59 (28.4%) | 17 (6.6%) |
| 75 Years and over | 54 (43.2%) | 77 (46.4%) |
Disability Class by Sex by Age in Waialua
Disability Class: Hearing Difficulty
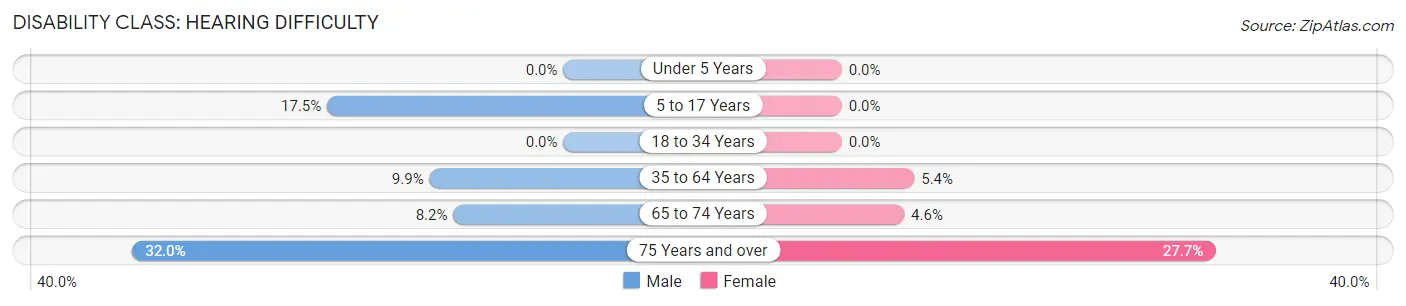
| Age Bracket | Male | Female |
| Under 5 Years | 0 (0.0%) | 0 (0.0%) |
| 5 to 17 Years | 37 (17.5%) | 0 (0.0%) |
| 18 to 34 Years | 0 (0.0%) | 0 (0.0%) |
| 35 to 64 Years | 62 (9.9%) | 32 (5.4%) |
| 65 to 74 Years | 17 (8.2%) | 12 (4.6%) |
| 75 Years and over | 40 (32.0%) | 46 (27.7%) |
Disability Class: Vision Difficulty
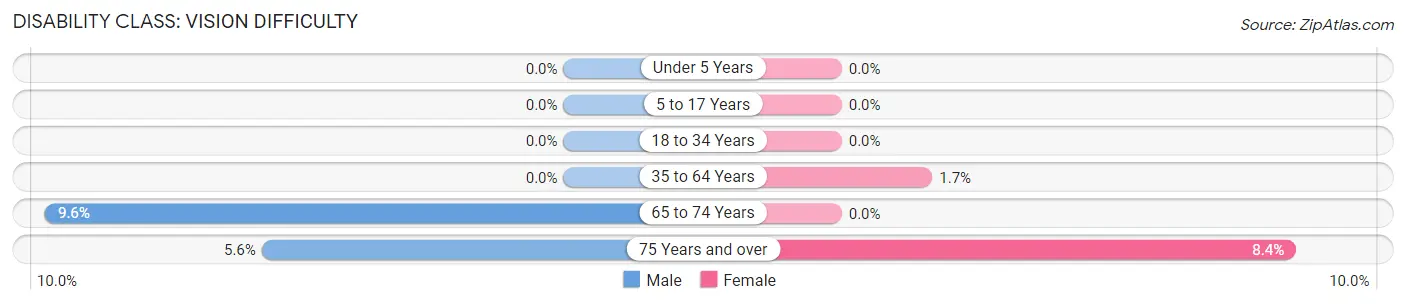
| Age Bracket | Male | Female |
| Under 5 Years | 0 (0.0%) | 0 (0.0%) |
| 5 to 17 Years | 0 (0.0%) | 0 (0.0%) |
| 18 to 34 Years | 0 (0.0%) | 0 (0.0%) |
| 35 to 64 Years | 0 (0.0%) | 10 (1.7%) |
| 65 to 74 Years | 20 (9.6%) | 0 (0.0%) |
| 75 Years and over | 7 (5.6%) | 14 (8.4%) |
Disability Class: Cognitive Difficulty
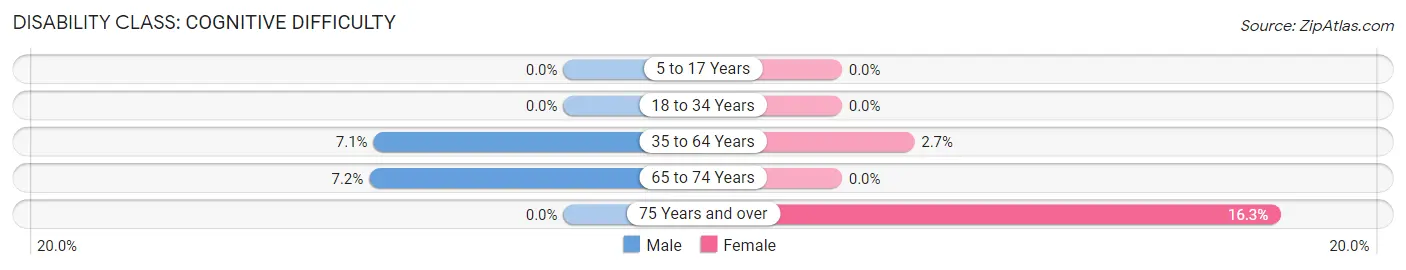
| Age Bracket | Male | Female |
| 5 to 17 Years | 0 (0.0%) | 0 (0.0%) |
| 18 to 34 Years | 0 (0.0%) | 0 (0.0%) |
| 35 to 64 Years | 44 (7.0%) | 16 (2.7%) |
| 65 to 74 Years | 15 (7.2%) | 0 (0.0%) |
| 75 Years and over | 0 (0.0%) | 27 (16.3%) |
Disability Class: Ambulatory Difficulty
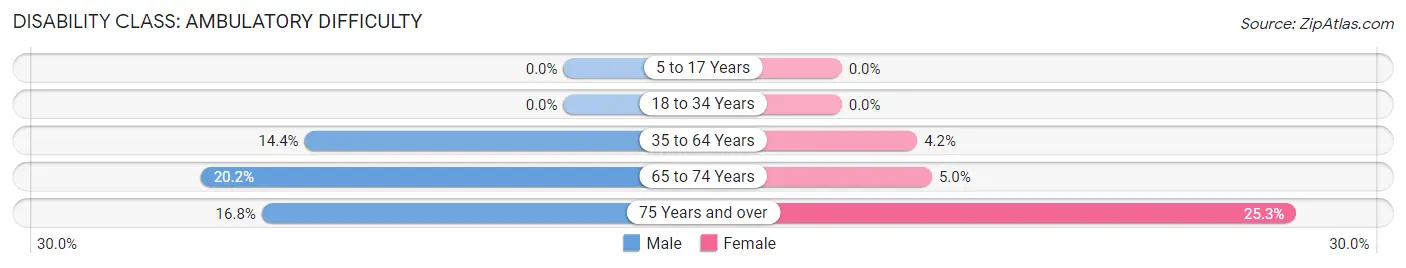
| Age Bracket | Male | Female |
| 5 to 17 Years | 0 (0.0%) | 0 (0.0%) |
| 18 to 34 Years | 0 (0.0%) | 0 (0.0%) |
| 35 to 64 Years | 90 (14.4%) | 25 (4.2%) |
| 65 to 74 Years | 42 (20.2%) | 13 (5.0%) |
| 75 Years and over | 21 (16.8%) | 42 (25.3%) |
Disability Class: Self-Care Difficulty
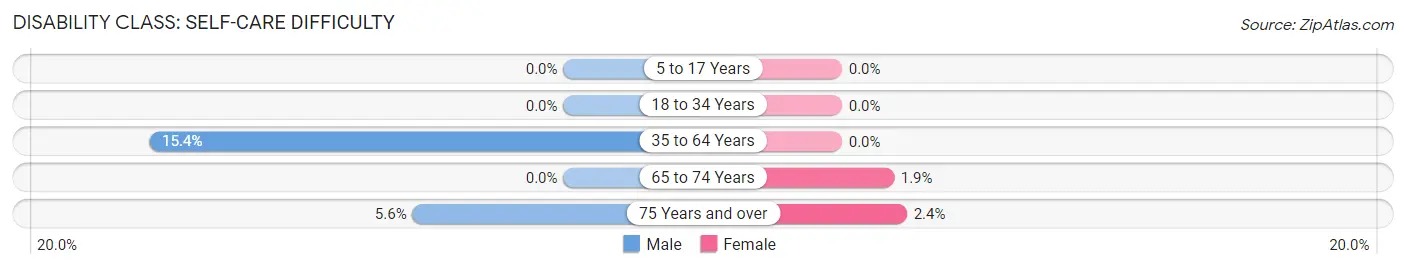
| Age Bracket | Male | Female |
| 5 to 17 Years | 0 (0.0%) | 0 (0.0%) |
| 18 to 34 Years | 0 (0.0%) | 0 (0.0%) |
| 35 to 64 Years | 96 (15.4%) | 0 (0.0%) |
| 65 to 74 Years | 0 (0.0%) | 5 (1.9%) |
| 75 Years and over | 7 (5.6%) | 4 (2.4%) |
Technology Access in Waialua
Computing Device Access in Waialua
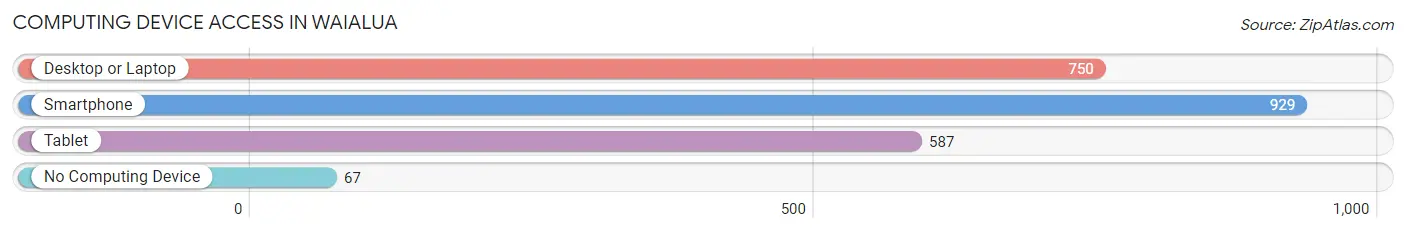
| Device Type | # Households | % Households |
| Desktop or Laptop | 750 | 71.5% |
| Smartphone | 929 | 88.6% |
| Tablet | 587 | 56.0% |
| No Computing Device | 67 | 6.4% |
| Total | 1,049 | 100.0% |
Internet Access in Waialua
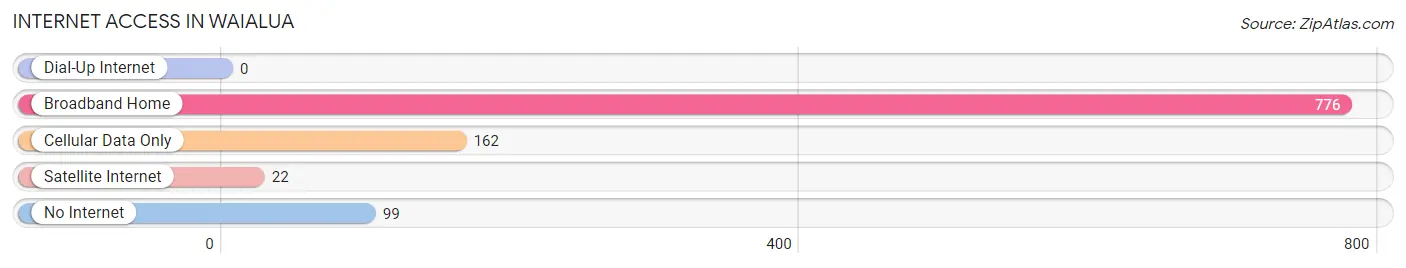
| Internet Type | # Households | % Households |
| Dial-Up Internet | 0 | 0.0% |
| Broadband Home | 776 | 74.0% |
| Cellular Data Only | 162 | 15.4% |
| Satellite Internet | 22 | 2.1% |
| No Internet | 99 | 9.4% |
| Total | 1,049 | 100.0% |
Waialua Summary
Waialua is a small town located on the North Shore of Oahu, Hawaii. It is located in the Waialua District of the island and is part of the City and County of Honolulu. The population of Waialua was 4,106 at the 2010 census.
History
Waialua has a long and rich history. The area was first settled by Polynesian voyagers in the 13th century. The area was then occupied by the Hawaiian Kingdom in the early 1800s. The area was then annexed by the United States in 1898.
In the early 1900s, Waialua was a thriving sugar plantation town. The Waialua Sugar Company was established in 1901 and was the largest sugar plantation in Hawaii. The plantation was the main employer in the area and provided jobs for many of the local residents. The plantation closed in 1996 and the land was sold to developers.
Geography
Waialua is located on the North Shore of Oahu, Hawaii. It is located in the Waialua District of the island and is part of the City and County of Honolulu. The town is located on the Waialua Bay and is bordered by the towns of Haleiwa to the east and Waianae to the west. The town is located at 21°37'N, 158°2'W.
The town has a total area of 4.2 square miles, of which 4.1 square miles is land and 0.1 square miles is water. The town is located at an elevation of about 50 feet above sea level.
Economy
Waialua’s economy is largely based on tourism and agriculture. The town is home to several tourist attractions, including the Waialua Sugar Mill, the Waialua Bay Beach Park, and the Waialua Botanical Garden. The town is also home to several farms, including the Waialua Farm, which produces a variety of fruits and vegetables.
The town is also home to several small businesses, including restaurants, shops, and art galleries. The town is also home to several small manufacturing companies, including the Waialua Boat Works, which produces custom-made boats.
Demographics
As of the 2010 census, there were 4,106 people, 1,541 households, and 1,093 families residing in the town. The population density was 990.3 people per square mile. The racial makeup of the town was 44.3% White, 0.7% African American, 0.3% Native American, 24.2% Asian, 0.2% Pacific Islander, 0.7% from other races, and 29.7% from two or more races. Hispanic or Latino of any race were 8.2% of the population.
The median income for a household in the town was $60,938, and the median income for a family was $68,750. The per capita income for the town was $25,945. About 8.2% of families and 10.2% of the population were below the poverty line, including 14.2% of those under age 18 and 5.2% of those age 65 or over.
Common Questions
What is Per Capita Income in Waialua?
Per Capita income in Waialua is $36,044.
What is the Median Family Income in Waialua?
Median Family Income in Waialua is $101,513.
What is the Median Household income in Waialua?
Median Household Income in Waialua is $87,266.
What is Income or Wage Gap in Waialua?
Income or Wage Gap in Waialua is 5.9%.
Women in Waialua earn 94.1 cents for every dollar earned by a man.
What is Inequality or Gini Index in Waialua?
Inequality or Gini Index in Waialua is 0.43.
What is the Total Population of Waialua?
Total Population of Waialua is 3,053.
What is the Total Male Population of Waialua?
Total Male Population of Waialua is 1,479.
What is the Total Female Population of Waialua?
Total Female Population of Waialua is 1,574.
What is the Ratio of Males per 100 Females in Waialua?
There are 93.96 Males per 100 Females in Waialua.
What is the Ratio of Females per 100 Males in Waialua?
There are 106.42 Females per 100 Males in Waialua.
What is the Median Population Age in Waialua?
Median Population Age in Waialua is 46.8 Years.
What is the Average Family Size in Waialua
Average Family Size in Waialua is 3.1 People.
What is the Average Household Size in Waialua
Average Household Size in Waialua is 2.9 People.
How Large is the Labor Force in Waialua?
There are 1,568 People in the Labor Forcein in Waialua.
What is the Percentage of People in the Labor Force in Waialua?
59.3% of People are in the Labor Force in Waialua.
What is the Unemployment Rate in Waialua?
Unemployment Rate in Waialua is 5.9%.