Ugandan Disability Age 5 to 17
COMPARE
Ugandan
Select to Compare
Disability Age 5 to 17
Ugandan Disability Age 5 to 17
6.2%
DISABILITY | AGE 5 TO 17
0.0/ 100
METRIC RATING
283rd/ 347
METRIC RANK
Ugandan Disability Age 5 to 17 Correlation Chart
The statistical analysis conducted on geographies consisting of 93,800,816 people shows a poor negative correlation between the proportion of Ugandans and percentage of population with a disability between the ages 5 and 17 in the United States with a correlation coefficient (R) of -0.128 and weighted average of 6.2%. On average, for every 1% (one percent) increase in Ugandans within a typical geography, there is a decrease of 0.19% in percentage of population with a disability between the ages 5 and 17.
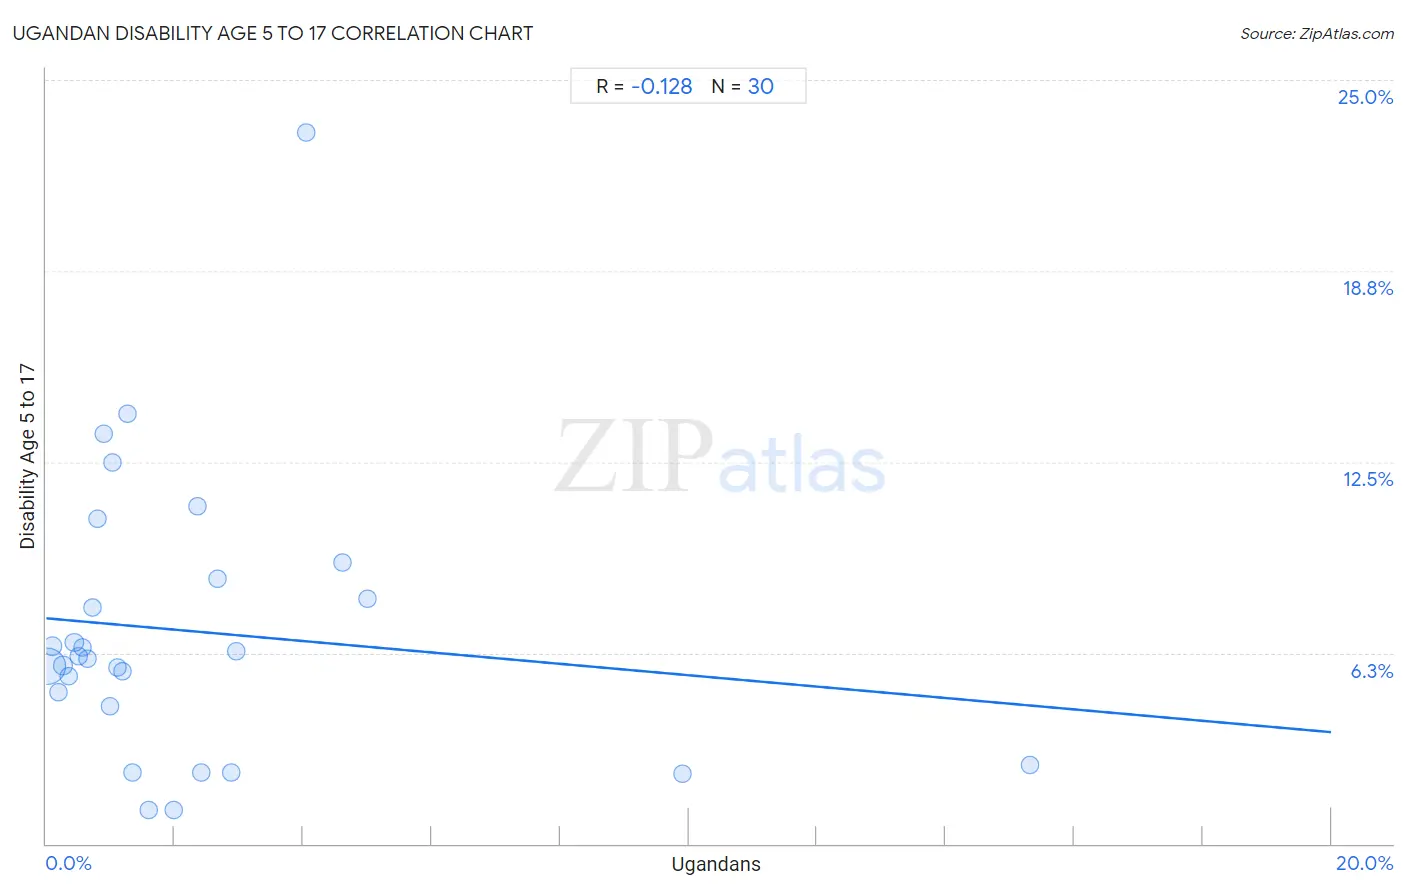
It is essential to understand that the correlation between the percentage of Ugandans and percentage of population with a disability between the ages 5 and 17 does not imply a direct cause-and-effect relationship. It remains uncertain whether the presence of Ugandans influences an upward or downward trend in the level of percentage of population with a disability between the ages 5 and 17 within an area, or if Ugandans simply ended up residing in those areas with higher or lower levels of percentage of population with a disability between the ages 5 and 17 due to other factors.
Demographics Similar to Ugandans by Disability Age 5 to 17
In terms of disability age 5 to 17, the demographic groups most similar to Ugandans are Subsaharan African (6.2%, a difference of 0.030%), English (6.2%, a difference of 0.030%), Colville (6.2%, a difference of 0.070%), German (6.1%, a difference of 0.16%), and Pima (6.2%, a difference of 0.26%).
| Demographics | Rating | Rank | Disability Age 5 to 17 |
| Japanese | 0.1 /100 | #276 | Tragic 6.1% |
| Puget Sound Salish | 0.1 /100 | #277 | Tragic 6.1% |
| Immigrants from Liberia | 0.1 /100 | #278 | Tragic 6.1% |
| Immigrants from Jamaica | 0.1 /100 | #279 | Tragic 6.1% |
| Portuguese | 0.1 /100 | #280 | Tragic 6.1% |
| Scottish | 0.0 /100 | #281 | Tragic 6.1% |
| Germans | 0.0 /100 | #282 | Tragic 6.1% |
| Ugandans | 0.0 /100 | #283 | Tragic 6.2% |
| Sub-Saharan Africans | 0.0 /100 | #284 | Tragic 6.2% |
| English | 0.0 /100 | #285 | Tragic 6.2% |
| Colville | 0.0 /100 | #286 | Tragic 6.2% |
| Pima | 0.0 /100 | #287 | Tragic 6.2% |
| Jamaicans | 0.0 /100 | #288 | Tragic 6.2% |
| Yaqui | 0.0 /100 | #289 | Tragic 6.2% |
| Immigrants from Congo | 0.0 /100 | #290 | Tragic 6.2% |
Ugandan Disability Age 5 to 17 Correlation Summary
| Measurement | Ugandan Data | Disability Age 5 to 17 Data |
| Minimum | 0.016% | 1.1% |
| Maximum | 15.3% | 23.3% |
| Range | 15.3% | 22.2% |
| Mean | 2.3% | 7.0% |
| Median | 1.1% | 6.1% |
| Interquartile 25% (IQ1) | 0.57% | 4.5% |
| Interquartile 75% (IQ3) | 2.7% | 8.7% |
| Interquartile Range (IQR) | 2.1% | 4.2% |
| Standard Deviation (Sample) | 3.2% | 4.6% |
| Standard Deviation (Population) | 3.1% | 4.6% |
Correlation Details
| Ugandan Percentile | Sample Size | Disability Age 5 to 17 |
[ 0.0% - 0.5% ] 0.016% | 81,459,251 | 5.8% |
[ 0.0% - 0.5% ] 0.10% | 6,179,648 | 6.5% |
[ 0.0% - 0.5% ] 0.19% | 2,301,920 | 5.0% |
[ 0.0% - 0.5% ] 0.26% | 1,400,880 | 5.8% |
[ 0.0% - 0.5% ] 0.35% | 559,024 | 5.5% |
[ 0.0% - 0.5% ] 0.44% | 541,708 | 6.6% |
[ 0.0% - 0.5% ] 0.50% | 256,857 | 6.1% |
[ 0.5% - 1.0% ] 0.57% | 193,805 | 6.4% |
[ 0.5% - 1.0% ] 0.64% | 252,596 | 6.1% |
[ 0.5% - 1.0% ] 0.72% | 114,417 | 7.7% |
[ 0.5% - 1.0% ] 0.79% | 107,393 | 10.6% |
[ 0.5% - 1.0% ] 0.90% | 39,705 | 13.4% |
[ 0.5% - 1.0% ] 0.99% | 27,089 | 4.5% |
[ 1.0% - 1.5% ] 1.03% | 18,170 | 12.5% |
[ 1.0% - 1.5% ] 1.10% | 134,979 | 5.8% |
[ 1.0% - 1.5% ] 1.19% | 44,208 | 5.6% |
[ 1.0% - 1.5% ] 1.26% | 13,516 | 14.1% |
[ 1.0% - 1.5% ] 1.35% | 44,893 | 2.3% |
[ 1.5% - 2.0% ] 1.60% | 5,682 | 1.1% |
[ 1.5% - 2.0% ] 1.99% | 604 | 1.1% |
[ 2.0% - 2.5% ] 2.36% | 14,202 | 11.0% |
[ 2.0% - 2.5% ] 2.42% | 8,359 | 2.3% |
[ 2.5% - 3.0% ] 2.67% | 1,010 | 8.7% |
[ 2.5% - 3.0% ] 2.87% | 16,145 | 2.3% |
[ 2.5% - 3.0% ] 2.96% | 34,536 | 6.3% |
[ 4.0% - 4.5% ] 4.05% | 1,210 | 23.3% |
[ 4.5% - 5.0% ] 4.61% | 26,684 | 9.2% |
[ 5.0% - 5.5% ] 5.00% | 180 | 8.0% |
[ 9.5% - 10.0% ] 9.90% | 1,303 | 2.3% |
[ 15.0% - 15.5% ] 15.32% | 842 | 2.6% |