Spanish American Disability Age 5 to 17
COMPARE
Spanish American
Select to Compare
Disability Age 5 to 17
Spanish American Disability Age 5 to 17
6.2%
DISABILITY | AGE 5 TO 17
0.0/ 100
METRIC RATING
296th/ 347
METRIC RANK
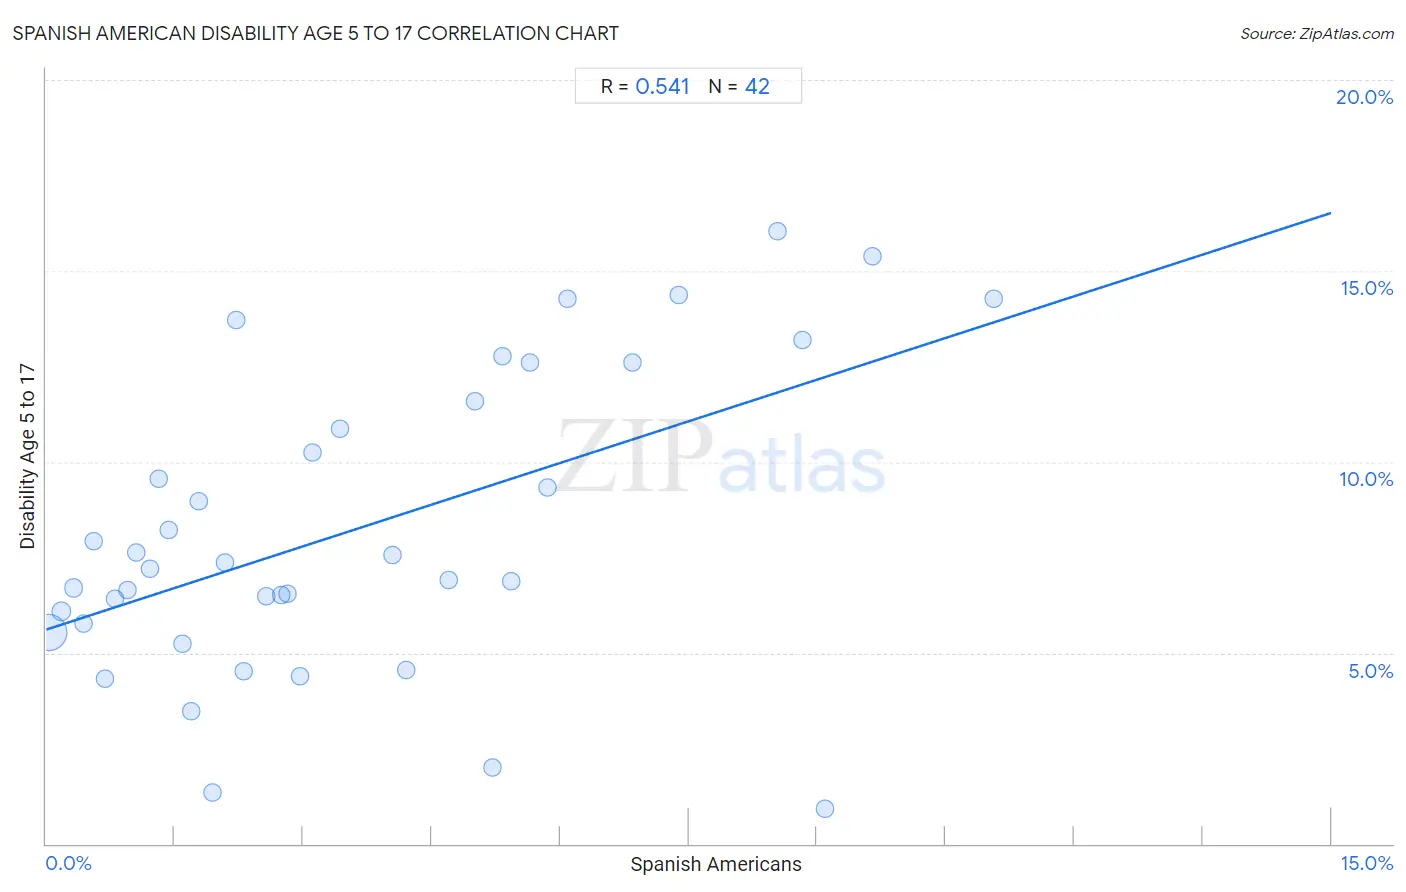
Spanish American Disability Age 5 to 17 Correlation Chart
The statistical analysis conducted on geographies consisting of 102,877,820 people shows a substantial positive correlation between the proportion of Spanish Americans and percentage of population with a disability between the ages 5 and 17 in the United States with a correlation coefficient (R) of 0.541 and weighted average of 6.2%. On average, for every 1% (one percent) increase in Spanish Americans within a typical geography, there is an increase of 0.73% in percentage of population with a disability between the ages 5 and 17.
It is essential to understand that the correlation between the percentage of Spanish Americans and percentage of population with a disability between the ages 5 and 17 does not imply a direct cause-and-effect relationship. It remains uncertain whether the presence of Spanish Americans influences an upward or downward trend in the level of percentage of population with a disability between the ages 5 and 17 within an area, or if Spanish Americans simply ended up residing in those areas with higher or lower levels of percentage of population with a disability between the ages 5 and 17 due to other factors.
Demographics Similar to Spanish Americans by Disability Age 5 to 17
In terms of disability age 5 to 17, the demographic groups most similar to Spanish Americans are Cree (6.2%, a difference of 0.020%), Immigrants from Bahamas (6.2%, a difference of 0.12%), Lumbee (6.2%, a difference of 0.19%), Central American Indian (6.2%, a difference of 0.30%), and Irish (6.2%, a difference of 0.30%).
| Demographics | Rating | Rank | Disability Age 5 to 17 |
| Yaqui | 0.0 /100 | #289 | Tragic 6.2% |
| Immigrants from Congo | 0.0 /100 | #290 | Tragic 6.2% |
| Whites/Caucasians | 0.0 /100 | #291 | Tragic 6.2% |
| Immigrants from Senegal | 0.0 /100 | #292 | Tragic 6.2% |
| Central American Indians | 0.0 /100 | #293 | Tragic 6.2% |
| Irish | 0.0 /100 | #294 | Tragic 6.2% |
| Cree | 0.0 /100 | #295 | Tragic 6.2% |
| Spanish Americans | 0.0 /100 | #296 | Tragic 6.2% |
| Immigrants from Bahamas | 0.0 /100 | #297 | Tragic 6.2% |
| Lumbee | 0.0 /100 | #298 | Tragic 6.2% |
| Welsh | 0.0 /100 | #299 | Tragic 6.3% |
| Carpatho Rusyns | 0.0 /100 | #300 | Tragic 6.3% |
| U.S. Virgin Islanders | 0.0 /100 | #301 | Tragic 6.3% |
| Celtics | 0.0 /100 | #302 | Tragic 6.3% |
| Yakama | 0.0 /100 | #303 | Tragic 6.3% |
Spanish American Disability Age 5 to 17 Correlation Summary
| Measurement | Spanish American Data | Disability Age 5 to 17 Data |
| Minimum | 0.023% | 0.92% |
| Maximum | 11.1% | 16.0% |
| Range | 11.0% | 15.1% |
| Mean | 3.6% | 8.3% |
| Median | 2.8% | 7.3% |
| Interquartile 25% (IQ1) | 1.3% | 5.8% |
| Interquartile 75% (IQ3) | 5.4% | 11.6% |
| Interquartile Range (IQR) | 4.1% | 5.8% |
| Standard Deviation (Sample) | 2.9% | 3.9% |
| Standard Deviation (Population) | 2.9% | 3.9% |
Correlation Details
| Spanish American Percentile | Sample Size | Disability Age 5 to 17 |
[ 0.0% - 0.5% ] 0.023% | 92,535,520 | 5.5% |
[ 0.0% - 0.5% ] 0.17% | 5,457,882 | 6.1% |
[ 0.0% - 0.5% ] 0.31% | 1,642,629 | 6.7% |
[ 0.0% - 0.5% ] 0.44% | 1,667,450 | 5.8% |
[ 0.5% - 1.0% ] 0.55% | 443,867 | 7.9% |
[ 0.5% - 1.0% ] 0.68% | 289,818 | 4.3% |
[ 0.5% - 1.0% ] 0.80% | 226,755 | 6.4% |
[ 0.5% - 1.0% ] 0.95% | 71,998 | 6.6% |
[ 1.0% - 1.5% ] 1.05% | 162,348 | 7.6% |
[ 1.0% - 1.5% ] 1.21% | 104,589 | 7.2% |
[ 1.0% - 1.5% ] 1.31% | 42,443 | 9.6% |
[ 1.0% - 1.5% ] 1.43% | 61,833 | 8.2% |
[ 1.5% - 2.0% ] 1.59% | 31,692 | 5.2% |
[ 1.5% - 2.0% ] 1.69% | 9,237 | 3.5% |
[ 1.5% - 2.0% ] 1.78% | 17,520 | 9.0% |
[ 1.5% - 2.0% ] 1.94% | 2,165 | 1.3% |
[ 2.0% - 2.5% ] 2.09% | 13,427 | 7.4% |
[ 2.0% - 2.5% ] 2.21% | 14,598 | 13.7% |
[ 2.0% - 2.5% ] 2.31% | 9,044 | 4.5% |
[ 2.5% - 3.0% ] 2.58% | 9,165 | 6.5% |
[ 2.5% - 3.0% ] 2.75% | 1,019 | 6.5% |
[ 2.5% - 3.0% ] 2.82% | 7,866 | 6.5% |
[ 2.5% - 3.0% ] 2.96% | 5,571 | 4.4% |
[ 3.0% - 3.5% ] 3.11% | 7,203 | 10.2% |
[ 3.0% - 3.5% ] 3.44% | 6,781 | 10.9% |
[ 4.0% - 4.5% ] 4.05% | 4,347 | 7.6% |
[ 4.0% - 4.5% ] 4.20% | 1,953 | 4.6% |
[ 4.5% - 5.0% ] 4.71% | 1,594 | 6.9% |
[ 5.0% - 5.5% ] 5.00% | 1,639 | 11.6% |
[ 5.0% - 5.5% ] 5.21% | 2,398 | 2.0% |
[ 5.0% - 5.5% ] 5.33% | 1,501 | 12.8% |
[ 5.0% - 5.5% ] 5.42% | 4,224 | 6.9% |
[ 5.5% - 6.0% ] 5.65% | 2,955 | 12.6% |
[ 5.5% - 6.0% ] 5.86% | 5,156 | 9.3% |
[ 6.0% - 6.5% ] 6.08% | 148 | 14.3% |
[ 6.5% - 7.0% ] 6.84% | 3,217 | 12.6% |
[ 7.0% - 7.5% ] 7.39% | 1,381 | 14.4% |
[ 8.5% - 9.0% ] 8.54% | 984 | 16.0% |
[ 8.5% - 9.0% ] 8.83% | 634 | 13.2% |
[ 9.0% - 9.5% ] 9.09% | 2,806 | 0.92% |
[ 9.5% - 10.0% ] 9.65% | 228 | 15.4% |
[ 11.0% - 11.5% ] 11.06% | 235 | 14.3% |