French American Indian Disability Age 5 to 17
COMPARE
French American Indian
Select to Compare
Disability Age 5 to 17
French American Indian Disability Age 5 to 17
6.6%
DISABILITY | AGE 5 TO 17
0.0/ 100
METRIC RATING
327th/ 347
METRIC RANK
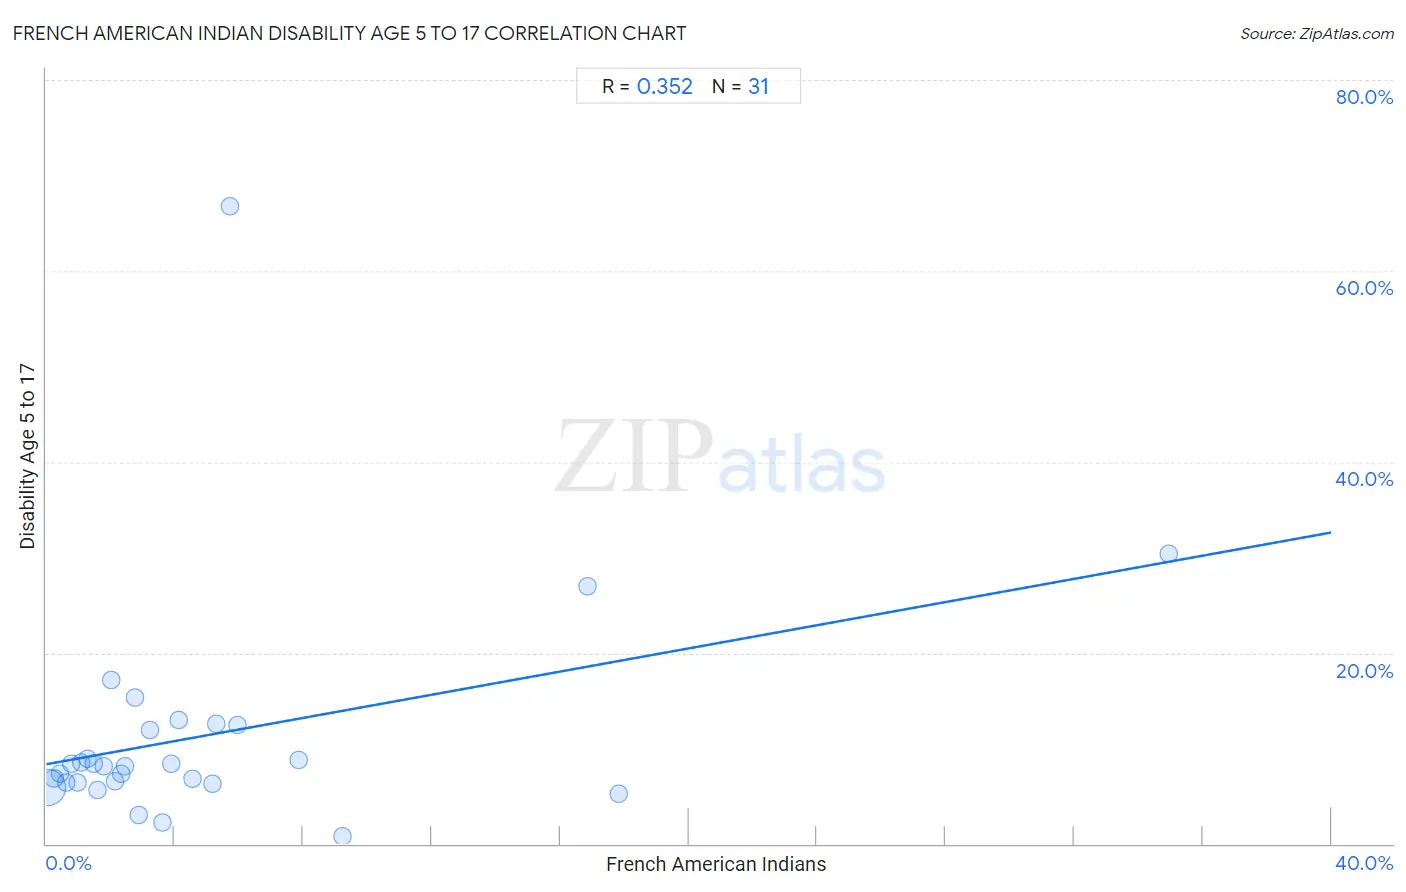
French American Indian Disability Age 5 to 17 Correlation Chart
The statistical analysis conducted on geographies consisting of 131,646,511 people shows a mild positive correlation between the proportion of French American Indians and percentage of population with a disability between the ages 5 and 17 in the United States with a correlation coefficient (R) of 0.352 and weighted average of 6.6%. On average, for every 1% (one percent) increase in French American Indians within a typical geography, there is an increase of 0.61% in percentage of population with a disability between the ages 5 and 17.
It is essential to understand that the correlation between the percentage of French American Indians and percentage of population with a disability between the ages 5 and 17 does not imply a direct cause-and-effect relationship. It remains uncertain whether the presence of French American Indians influences an upward or downward trend in the level of percentage of population with a disability between the ages 5 and 17 within an area, or if French American Indians simply ended up residing in those areas with higher or lower levels of percentage of population with a disability between the ages 5 and 17 due to other factors.
Demographics Similar to French American Indians by Disability Age 5 to 17
In terms of disability age 5 to 17, the demographic groups most similar to French American Indians are Pennsylvania German (6.6%, a difference of 0.23%), Blackfeet (6.6%, a difference of 0.40%), Potawatomi (6.5%, a difference of 0.44%), American (6.5%, a difference of 0.58%), and Dominican (6.5%, a difference of 0.63%).
| Demographics | Rating | Rank | Disability Age 5 to 17 |
| Africans | 0.0 /100 | #320 | Tragic 6.5% |
| Tohono O'odham | 0.0 /100 | #321 | Tragic 6.5% |
| Slovaks | 0.0 /100 | #322 | Tragic 6.5% |
| Osage | 0.0 /100 | #323 | Tragic 6.5% |
| Dominicans | 0.0 /100 | #324 | Tragic 6.5% |
| Americans | 0.0 /100 | #325 | Tragic 6.5% |
| Potawatomi | 0.0 /100 | #326 | Tragic 6.5% |
| French American Indians | 0.0 /100 | #327 | Tragic 6.6% |
| Pennsylvania Germans | 0.0 /100 | #328 | Tragic 6.6% |
| Blackfeet | 0.0 /100 | #329 | Tragic 6.6% |
| Dutch West Indians | 0.0 /100 | #330 | Tragic 6.7% |
| French Canadians | 0.0 /100 | #331 | Tragic 6.7% |
| Immigrants from the Azores | 0.0 /100 | #332 | Tragic 6.7% |
| Blacks/African Americans | 0.0 /100 | #333 | Tragic 6.8% |
| Seminole | 0.0 /100 | #334 | Tragic 6.8% |
French American Indian Disability Age 5 to 17 Correlation Summary
| Measurement | French American Indian Data | Disability Age 5 to 17 Data |
| Minimum | 0.025% | 0.85% |
| Maximum | 34.9% | 66.8% |
| Range | 34.9% | 65.9% |
| Mean | 4.9% | 11.3% |
| Median | 2.8% | 8.2% |
| Interquartile 25% (IQ1) | 1.3% | 6.4% |
| Interquartile 75% (IQ3) | 5.3% | 12.5% |
| Interquartile Range (IQR) | 4.0% | 6.1% |
| Standard Deviation (Sample) | 7.0% | 12.0% |
| Standard Deviation (Population) | 6.9% | 11.8% |
Correlation Details
| French American Indian Percentile | Sample Size | Disability Age 5 to 17 |
[ 0.0% - 0.5% ] 0.025% | 124,887,806 | 5.9% |
[ 0.0% - 0.5% ] 0.24% | 4,784,321 | 6.8% |
[ 0.0% - 0.5% ] 0.43% | 1,137,630 | 7.4% |
[ 0.5% - 1.0% ] 0.63% | 334,920 | 6.4% |
[ 0.5% - 1.0% ] 0.78% | 150,441 | 8.3% |
[ 0.5% - 1.0% ] 0.97% | 64,155 | 6.4% |
[ 1.0% - 1.5% ] 1.09% | 134,000 | 8.5% |
[ 1.0% - 1.5% ] 1.30% | 48,761 | 9.0% |
[ 1.0% - 1.5% ] 1.48% | 22,572 | 8.3% |
[ 1.5% - 2.0% ] 1.59% | 10,391 | 5.7% |
[ 1.5% - 2.0% ] 1.80% | 26,531 | 8.2% |
[ 2.0% - 2.5% ] 2.03% | 3,448 | 17.1% |
[ 2.0% - 2.5% ] 2.15% | 10,722 | 6.5% |
[ 2.0% - 2.5% ] 2.34% | 10,412 | 7.3% |
[ 2.0% - 2.5% ] 2.45% | 898 | 8.1% |
[ 2.5% - 3.0% ] 2.76% | 362 | 15.3% |
[ 2.5% - 3.0% ] 2.88% | 6,240 | 3.0% |
[ 3.0% - 3.5% ] 3.22% | 2,331 | 11.9% |
[ 3.5% - 4.0% ] 3.61% | 1,026 | 2.2% |
[ 3.5% - 4.0% ] 3.88% | 1,210 | 8.4% |
[ 4.0% - 4.5% ] 4.14% | 290 | 12.9% |
[ 4.5% - 5.0% ] 4.55% | 506 | 6.9% |
[ 5.0% - 5.5% ] 5.18% | 1,236 | 6.3% |
[ 5.0% - 5.5% ] 5.31% | 1,300 | 12.6% |
[ 5.5% - 6.0% ] 5.71% | 666 | 66.8% |
[ 5.5% - 6.0% ] 5.96% | 1,191 | 12.5% |
[ 7.5% - 8.0% ] 7.85% | 1,554 | 8.8% |
[ 9.0% - 9.5% ] 9.23% | 758 | 0.85% |
[ 16.5% - 17.0% ] 16.86% | 172 | 26.9% |
[ 17.5% - 18.0% ] 17.82% | 578 | 5.3% |
[ 34.5% - 35.0% ] 34.94% | 83 | 30.4% |