Cherokee Disability Age 5 to 17
COMPARE
Cherokee
Select to Compare
Disability Age 5 to 17
Cherokee Disability Age 5 to 17
6.9%
DISABILITY | AGE 5 TO 17
0.0/ 100
METRIC RATING
340th/ 347
METRIC RANK
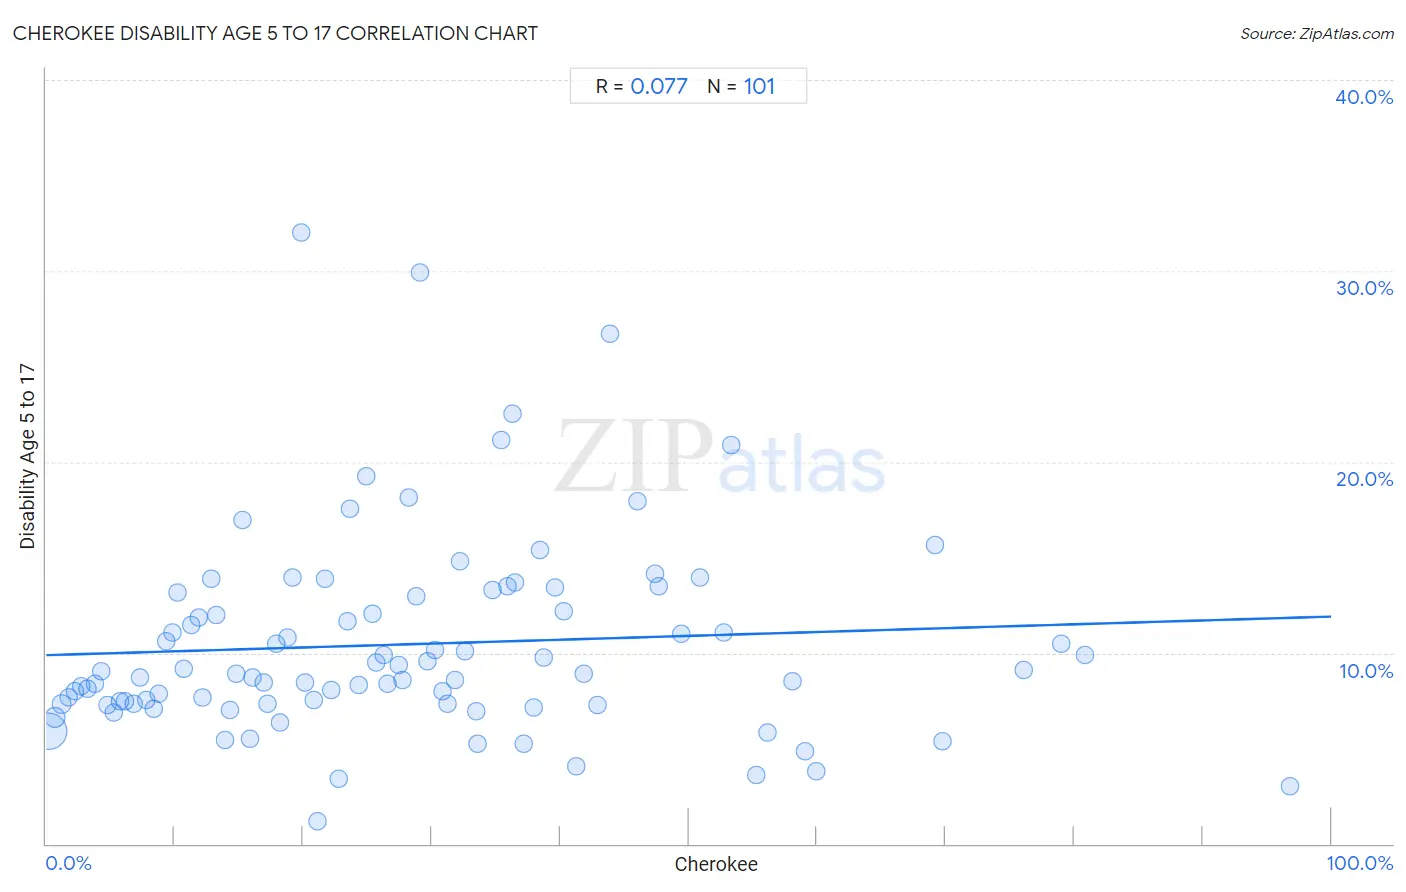
Cherokee Disability Age 5 to 17 Correlation Chart
The statistical analysis conducted on geographies consisting of 487,353,111 people shows a slight positive correlation between the proportion of Cherokee and percentage of population with a disability between the ages 5 and 17 in the United States with a correlation coefficient (R) of 0.077 and weighted average of 6.9%. On average, for every 1% (one percent) increase in Cherokee within a typical geography, there is an increase of 0.020% in percentage of population with a disability between the ages 5 and 17.
It is essential to understand that the correlation between the percentage of Cherokee and percentage of population with a disability between the ages 5 and 17 does not imply a direct cause-and-effect relationship. It remains uncertain whether the presence of Cherokee influences an upward or downward trend in the level of percentage of population with a disability between the ages 5 and 17 within an area, or if Cherokee simply ended up residing in those areas with higher or lower levels of percentage of population with a disability between the ages 5 and 17 due to other factors.
Demographics Similar to Cherokee by Disability Age 5 to 17
In terms of disability age 5 to 17, the demographic groups most similar to Cherokee are Choctaw (6.9%, a difference of 0.26%), Cape Verdean (7.0%, a difference of 0.54%), Iroquois (6.9%, a difference of 0.59%), Creek (6.9%, a difference of 0.83%), and Chickasaw (6.8%, a difference of 1.3%).
| Demographics | Rating | Rank | Disability Age 5 to 17 |
| Blacks/African Americans | 0.0 /100 | #333 | Tragic 6.8% |
| Seminole | 0.0 /100 | #334 | Tragic 6.8% |
| Ottawa | 0.0 /100 | #335 | Tragic 6.8% |
| Chickasaw | 0.0 /100 | #336 | Tragic 6.8% |
| Creek | 0.0 /100 | #337 | Tragic 6.9% |
| Iroquois | 0.0 /100 | #338 | Tragic 6.9% |
| Choctaw | 0.0 /100 | #339 | Tragic 6.9% |
| Cherokee | 0.0 /100 | #340 | Tragic 6.9% |
| Cape Verdeans | 0.0 /100 | #341 | Tragic 7.0% |
| Chippewa | 0.0 /100 | #342 | Tragic 7.1% |
| Immigrants from Cabo Verde | 0.0 /100 | #343 | Tragic 7.1% |
| Cajuns | 0.0 /100 | #344 | Tragic 7.2% |
| Tsimshian | 0.0 /100 | #345 | Tragic 7.9% |
| Puerto Ricans | 0.0 /100 | #346 | Tragic 8.3% |
| Houma | 0.0 /100 | #347 | Tragic 9.1% |
Cherokee Disability Age 5 to 17 Correlation Summary
| Measurement | Cherokee Data | Disability Age 5 to 17 Data |
| Minimum | 0.20% | 1.2% |
| Maximum | 96.8% | 32.0% |
| Range | 96.6% | 30.8% |
| Mean | 28.2% | 10.4% |
| Median | 25.4% | 8.9% |
| Interquartile 25% (IQ1) | 12.5% | 7.3% |
| Interquartile 75% (IQ3) | 38.6% | 13.1% |
| Interquartile Range (IQR) | 26.0% | 5.8% |
| Standard Deviation (Sample) | 20.1% | 5.3% |
| Standard Deviation (Population) | 20.0% | 5.2% |
Correlation Details
| Cherokee Percentile | Sample Size | Disability Age 5 to 17 |
[ 0.0% - 0.5% ] 0.20% | 405,029,403 | 5.9% |
[ 0.5% - 1.0% ] 0.67% | 56,362,726 | 6.6% |
[ 1.0% - 1.5% ] 1.19% | 11,518,047 | 7.3% |
[ 1.5% - 2.0% ] 1.74% | 5,459,524 | 7.6% |
[ 2.0% - 2.5% ] 2.22% | 2,544,078 | 8.0% |
[ 2.5% - 3.0% ] 2.72% | 1,440,923 | 8.3% |
[ 3.0% - 3.5% ] 3.23% | 811,958 | 8.1% |
[ 3.5% - 4.0% ] 3.76% | 589,058 | 8.4% |
[ 4.0% - 4.5% ] 4.26% | 374,166 | 9.1% |
[ 4.5% - 5.0% ] 4.80% | 771,365 | 7.3% |
[ 5.0% - 5.5% ] 5.25% | 411,243 | 6.9% |
[ 5.5% - 6.0% ] 5.78% | 364,908 | 7.5% |
[ 6.0% - 6.5% ] 6.16% | 117,413 | 7.5% |
[ 6.5% - 7.0% ] 6.79% | 134,189 | 7.3% |
[ 7.0% - 7.5% ] 7.25% | 144,043 | 8.7% |
[ 7.5% - 8.0% ] 7.76% | 178,379 | 7.5% |
[ 8.0% - 8.5% ] 8.33% | 67,425 | 7.1% |
[ 8.5% - 9.0% ] 8.72% | 101,096 | 7.8% |
[ 9.0% - 9.5% ] 9.29% | 57,996 | 10.6% |
[ 9.5% - 10.0% ] 9.82% | 30,264 | 11.1% |
[ 10.0% - 10.5% ] 10.22% | 52,503 | 13.2% |
[ 10.5% - 11.0% ] 10.67% | 22,258 | 9.2% |
[ 11.0% - 11.5% ] 11.29% | 17,093 | 11.5% |
[ 11.5% - 12.0% ] 11.87% | 20,242 | 11.9% |
[ 12.0% - 12.5% ] 12.20% | 41,410 | 7.7% |
[ 12.5% - 13.0% ] 12.85% | 5,181 | 13.9% |
[ 13.0% - 13.5% ] 13.23% | 10,804 | 12.0% |
[ 13.5% - 14.0% ] 13.88% | 18,924 | 5.4% |
[ 14.0% - 14.5% ] 14.29% | 52,841 | 7.0% |
[ 14.5% - 15.0% ] 14.81% | 47,609 | 8.9% |
[ 15.0% - 15.5% ] 15.30% | 10,053 | 17.0% |
[ 15.5% - 16.0% ] 15.87% | 8,767 | 5.5% |
[ 16.0% - 16.5% ] 16.09% | 37,797 | 8.7% |
[ 16.5% - 17.0% ] 16.89% | 72,029 | 8.5% |
[ 17.0% - 17.5% ] 17.25% | 10,835 | 7.4% |
[ 17.5% - 18.0% ] 17.87% | 8,720 | 10.4% |
[ 18.0% - 18.5% ] 18.16% | 40,594 | 6.3% |
[ 18.5% - 19.0% ] 18.77% | 19,423 | 10.8% |
[ 19.0% - 19.5% ] 19.13% | 1,762 | 14.0% |
[ 19.5% - 20.0% ] 19.83% | 847 | 32.0% |
[ 20.0% - 20.5% ] 20.18% | 31,314 | 8.4% |
[ 20.5% - 21.0% ] 20.86% | 20,102 | 7.5% |
[ 21.0% - 21.5% ] 21.14% | 6,136 | 1.2% |
[ 21.5% - 22.0% ] 21.73% | 15,008 | 13.9% |
[ 22.0% - 22.5% ] 22.17% | 3,148 | 8.1% |
[ 22.5% - 23.0% ] 22.77% | 3,966 | 3.4% |
[ 23.0% - 23.5% ] 23.42% | 696 | 11.7% |
[ 23.5% - 24.0% ] 23.67% | 5,877 | 17.6% |
[ 24.0% - 24.5% ] 24.28% | 12,896 | 8.3% |
[ 24.5% - 25.0% ] 24.92% | 2,693 | 19.2% |
[ 25.0% - 25.5% ] 25.43% | 17,350 | 12.1% |
[ 25.5% - 26.0% ] 25.64% | 9,008 | 9.5% |
[ 26.0% - 26.5% ] 26.25% | 8,457 | 9.9% |
[ 26.5% - 27.0% ] 26.52% | 969 | 8.4% |
[ 27.0% - 27.5% ] 27.42% | 19,115 | 9.3% |
[ 27.5% - 28.0% ] 27.70% | 2,155 | 8.6% |
[ 28.0% - 28.5% ] 28.20% | 3,503 | 18.1% |
[ 28.5% - 29.0% ] 28.79% | 1,466 | 13.0% |
[ 29.0% - 29.5% ] 29.10% | 756 | 29.9% |
[ 29.5% - 30.0% ] 29.70% | 10,864 | 9.5% |
[ 30.0% - 30.5% ] 30.23% | 4,217 | 10.2% |
[ 30.5% - 31.0% ] 30.79% | 7,456 | 8.0% |
[ 31.0% - 31.5% ] 31.20% | 7,318 | 7.3% |
[ 31.5% - 32.0% ] 31.82% | 7,184 | 8.6% |
[ 32.0% - 32.5% ] 32.24% | 183 | 14.8% |
[ 32.5% - 33.0% ] 32.62% | 2,293 | 10.1% |
[ 33.0% - 33.5% ] 33.49% | 16,782 | 7.0% |
[ 33.5% - 34.0% ] 33.55% | 1,368 | 5.3% |
[ 34.5% - 35.0% ] 34.71% | 4,500 | 13.3% |
[ 35.0% - 35.5% ] 35.41% | 6,735 | 21.2% |
[ 35.5% - 36.0% ] 35.87% | 11,892 | 13.5% |
[ 36.0% - 36.5% ] 36.28% | 317 | 22.5% |
[ 36.5% - 37.0% ] 36.52% | 827 | 13.7% |
[ 37.0% - 37.5% ] 37.17% | 460 | 5.2% |
[ 37.5% - 38.0% ] 37.98% | 258 | 7.1% |
[ 38.0% - 38.5% ] 38.41% | 3,697 | 15.4% |
[ 38.5% - 39.0% ] 38.69% | 32,250 | 9.8% |
[ 39.5% - 40.0% ] 39.57% | 4,509 | 13.4% |
[ 40.0% - 40.5% ] 40.30% | 6,665 | 12.2% |
[ 41.0% - 41.5% ] 41.23% | 1,266 | 4.0% |
[ 41.5% - 42.0% ] 41.81% | 3,200 | 8.9% |
[ 42.5% - 43.0% ] 42.86% | 840 | 7.3% |
[ 43.5% - 44.0% ] 43.89% | 540 | 26.7% |
[ 46.0% - 46.5% ] 46.03% | 2,900 | 18.0% |
[ 47.0% - 47.5% ] 47.41% | 2,871 | 14.2% |
[ 47.5% - 48.0% ] 47.66% | 770 | 13.5% |
[ 49.0% - 49.5% ] 49.41% | 4,795 | 11.0% |
[ 50.5% - 51.0% ] 50.84% | 1,548 | 13.9% |
[ 52.5% - 53.0% ] 52.70% | 4,501 | 11.1% |
[ 53.0% - 53.5% ] 53.31% | 1,467 | 20.9% |
[ 55.0% - 55.5% ] 55.25% | 1,171 | 3.6% |
[ 56.0% - 56.5% ] 56.15% | 1,464 | 5.8% |
[ 58.0% - 58.5% ] 58.05% | 348 | 8.5% |
[ 59.0% - 59.5% ] 59.09% | 12,720 | 4.9% |
[ 59.5% - 60.0% ] 59.93% | 277 | 3.8% |
[ 69.0% - 69.5% ] 69.19% | 1,279 | 15.6% |
[ 69.5% - 70.0% ] 69.72% | 535 | 5.4% |
[ 76.0% - 76.5% ] 76.10% | 410 | 9.1% |
[ 79.0% - 79.5% ] 79.02% | 6,854 | 10.4% |
[ 80.5% - 81.0% ] 80.85% | 726 | 9.9% |
[ 96.5% - 97.0% ] 96.79% | 343 | 3.0% |