Immigrants from Micronesia Disability Age 5 to 17
COMPARE
Immigrants from Micronesia
Select to Compare
Disability Age 5 to 17
Immigrants from Micronesia Disability Age 5 to 17
5.9%
DISABILITY | AGE 5 TO 17
1.9/ 100
METRIC RATING
245th/ 347
METRIC RANK
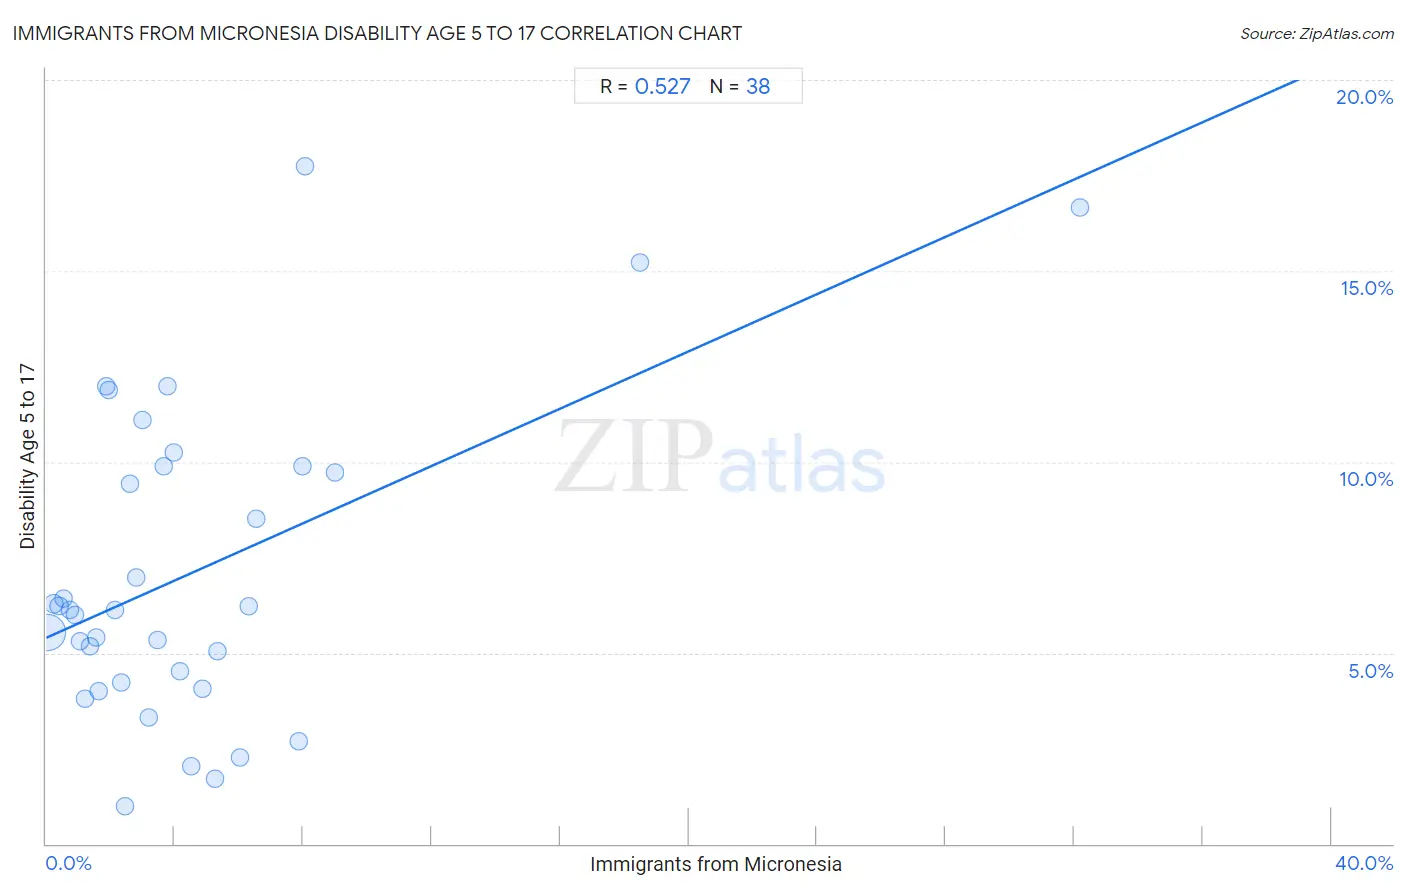
Immigrants from Micronesia Disability Age 5 to 17 Correlation Chart
The statistical analysis conducted on geographies consisting of 61,532,994 people shows a substantial positive correlation between the proportion of Immigrants from Micronesia and percentage of population with a disability between the ages 5 and 17 in the United States with a correlation coefficient (R) of 0.527 and weighted average of 5.9%. On average, for every 1% (one percent) increase in Immigrants from Micronesia within a typical geography, there is an increase of 0.38% in percentage of population with a disability between the ages 5 and 17.
It is essential to understand that the correlation between the percentage of Immigrants from Micronesia and percentage of population with a disability between the ages 5 and 17 does not imply a direct cause-and-effect relationship. It remains uncertain whether the presence of Immigrants from Micronesia influences an upward or downward trend in the level of percentage of population with a disability between the ages 5 and 17 within an area, or if Immigrants from Micronesia simply ended up residing in those areas with higher or lower levels of percentage of population with a disability between the ages 5 and 17 due to other factors.
Demographics Similar to Immigrants from Micronesia by Disability Age 5 to 17
In terms of disability age 5 to 17, the demographic groups most similar to Immigrants from Micronesia are Immigrants from Germany (5.9%, a difference of 0.0%), Tlingit-Haida (5.9%, a difference of 0.0%), Immigrants from Honduras (5.9%, a difference of 0.030%), Indonesian (5.9%, a difference of 0.060%), and Spaniard (5.9%, a difference of 0.070%).
| Demographics | Rating | Rank | Disability Age 5 to 17 |
| Hungarians | 2.6 /100 | #238 | Tragic 5.8% |
| German Russians | 2.4 /100 | #239 | Tragic 5.9% |
| West Indians | 2.4 /100 | #240 | Tragic 5.9% |
| Immigrants from Caribbean | 2.1 /100 | #241 | Tragic 5.9% |
| Spaniards | 2.0 /100 | #242 | Tragic 5.9% |
| Indonesians | 2.0 /100 | #243 | Tragic 5.9% |
| Immigrants from Germany | 1.9 /100 | #244 | Tragic 5.9% |
| Immigrants from Micronesia | 1.9 /100 | #245 | Tragic 5.9% |
| Tlingit-Haida | 1.9 /100 | #246 | Tragic 5.9% |
| Immigrants from Honduras | 1.8 /100 | #247 | Tragic 5.9% |
| British | 1.7 /100 | #248 | Tragic 5.9% |
| Immigrants from Ghana | 1.7 /100 | #249 | Tragic 5.9% |
| Poles | 1.5 /100 | #250 | Tragic 5.9% |
| Immigrants from Cambodia | 1.5 /100 | #251 | Tragic 5.9% |
| Hondurans | 1.5 /100 | #252 | Tragic 5.9% |
Immigrants from Micronesia Disability Age 5 to 17 Correlation Summary
| Measurement | Immigrants from Micronesia Data | Disability Age 5 to 17 Data |
| Minimum | 0.022% | 0.99% |
| Maximum | 32.2% | 17.7% |
| Range | 32.1% | 16.8% |
| Mean | 4.6% | 7.1% |
| Median | 3.1% | 6.1% |
| Interquartile 25% (IQ1) | 1.6% | 4.2% |
| Interquartile 75% (IQ3) | 5.3% | 9.9% |
| Interquartile Range (IQR) | 3.8% | 5.6% |
| Standard Deviation (Sample) | 5.7% | 4.1% |
| Standard Deviation (Population) | 5.7% | 4.0% |
Correlation Details
| Immigrants from Micronesia Percentile | Sample Size | Disability Age 5 to 17 |
[ 0.0% - 0.5% ] 0.022% | 53,362,284 | 5.5% |
[ 0.0% - 0.5% ] 0.22% | 3,443,360 | 6.3% |
[ 0.0% - 0.5% ] 0.39% | 1,631,102 | 6.2% |
[ 0.5% - 1.0% ] 0.54% | 903,464 | 6.4% |
[ 0.5% - 1.0% ] 0.73% | 519,464 | 6.1% |
[ 0.5% - 1.0% ] 0.90% | 465,458 | 6.0% |
[ 1.0% - 1.5% ] 1.05% | 181,275 | 5.3% |
[ 1.0% - 1.5% ] 1.22% | 78,941 | 3.8% |
[ 1.0% - 1.5% ] 1.36% | 35,058 | 5.2% |
[ 1.5% - 2.0% ] 1.56% | 129,643 | 5.4% |
[ 1.5% - 2.0% ] 1.63% | 381,141 | 4.0% |
[ 1.5% - 2.0% ] 1.86% | 8,733 | 12.0% |
[ 1.5% - 2.0% ] 1.95% | 667 | 11.9% |
[ 2.0% - 2.5% ] 2.13% | 124,127 | 6.1% |
[ 2.0% - 2.5% ] 2.33% | 71,948 | 4.2% |
[ 2.0% - 2.5% ] 2.46% | 1,907 | 0.99% |
[ 2.5% - 3.0% ] 2.59% | 55,175 | 9.4% |
[ 2.5% - 3.0% ] 2.81% | 3,701 | 7.0% |
[ 2.5% - 3.0% ] 2.99% | 8,254 | 11.1% |
[ 3.0% - 3.5% ] 3.19% | 58,742 | 3.3% |
[ 3.0% - 3.5% ] 3.48% | 3,850 | 5.3% |
[ 3.5% - 4.0% ] 3.66% | 9,383 | 9.9% |
[ 3.5% - 4.0% ] 3.77% | 7,797 | 12.0% |
[ 3.5% - 4.0% ] 3.95% | 11,207 | 10.3% |
[ 4.0% - 4.5% ] 4.17% | 624 | 4.5% |
[ 4.5% - 5.0% ] 4.52% | 1,129 | 2.0% |
[ 4.5% - 5.0% ] 4.87% | 10,042 | 4.0% |
[ 5.0% - 5.5% ] 5.26% | 2,356 | 1.7% |
[ 5.0% - 5.5% ] 5.31% | 414 | 5.0% |
[ 6.0% - 6.5% ] 6.04% | 844 | 2.2% |
[ 6.0% - 6.5% ] 6.28% | 2,005 | 6.2% |
[ 6.5% - 7.0% ] 6.53% | 3,477 | 8.5% |
[ 7.5% - 8.0% ] 7.87% | 4,842 | 2.7% |
[ 7.5% - 8.0% ] 7.96% | 5,391 | 9.9% |
[ 8.0% - 8.5% ] 8.05% | 2,820 | 17.7% |
[ 8.5% - 9.0% ] 9.00% | 1,278 | 9.7% |
[ 18.0% - 18.5% ] 18.47% | 693 | 15.2% |
[ 32.0% - 32.5% ] 32.16% | 398 | 16.7% |