Celtic Disability Age 5 to 17
COMPARE
Celtic
Select to Compare
Disability Age 5 to 17
Celtic Disability Age 5 to 17
6.3%
DISABILITY | AGE 5 TO 17
0.0/ 100
METRIC RATING
302nd/ 347
METRIC RANK
Celtic Disability Age 5 to 17 Correlation Chart
The statistical analysis conducted on geographies consisting of 168,097,292 people shows a poor negative correlation between the proportion of Celtics and percentage of population with a disability between the ages 5 and 17 in the United States with a correlation coefficient (R) of -0.105 and weighted average of 6.3%. On average, for every 1% (one percent) increase in Celtics within a typical geography, there is a decrease of 0.16% in percentage of population with a disability between the ages 5 and 17.
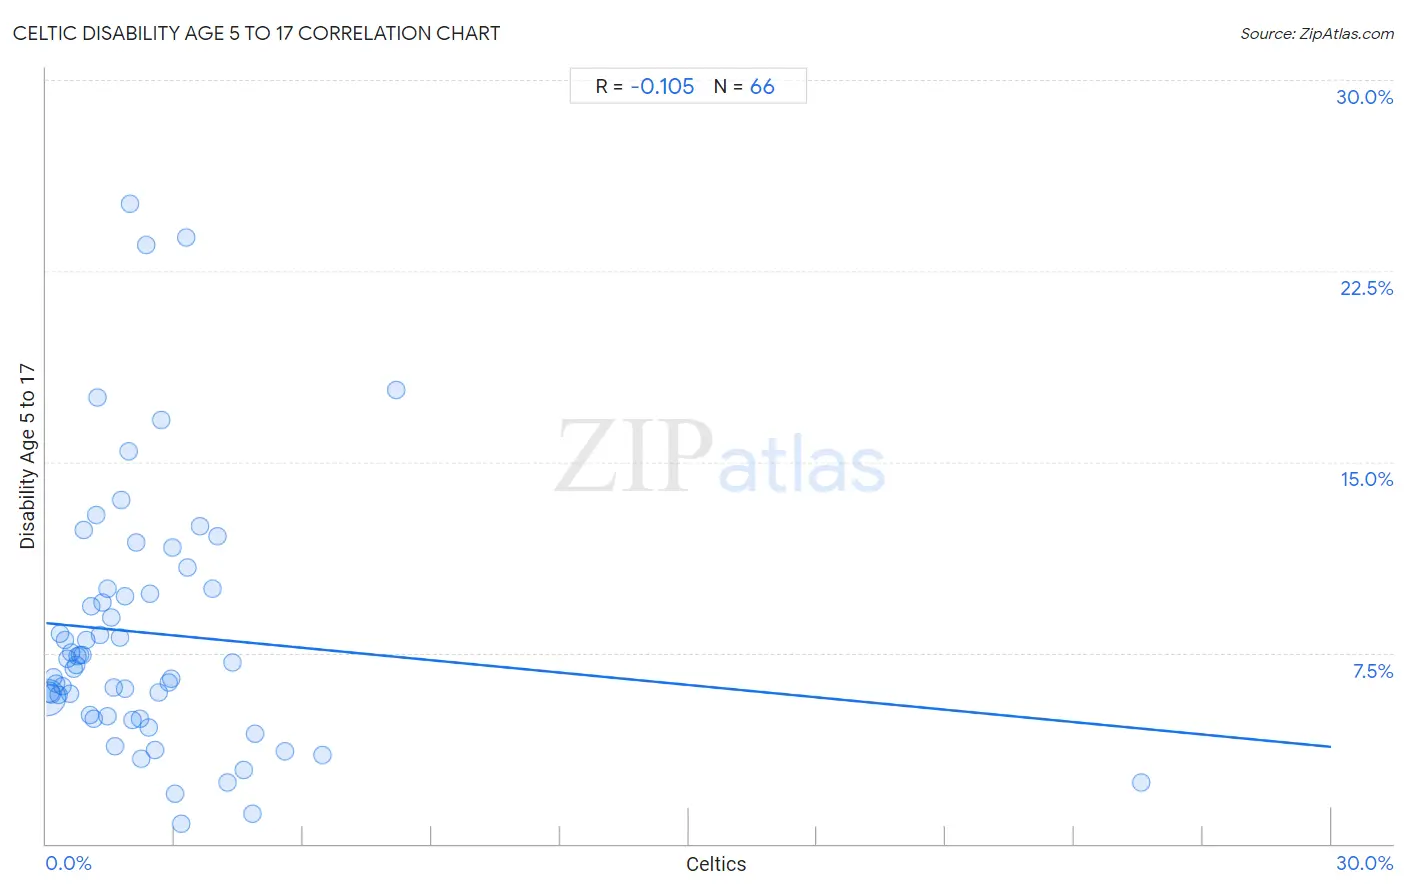
It is essential to understand that the correlation between the percentage of Celtics and percentage of population with a disability between the ages 5 and 17 does not imply a direct cause-and-effect relationship. It remains uncertain whether the presence of Celtics influences an upward or downward trend in the level of percentage of population with a disability between the ages 5 and 17 within an area, or if Celtics simply ended up residing in those areas with higher or lower levels of percentage of population with a disability between the ages 5 and 17 due to other factors.
Demographics Similar to Celtics by Disability Age 5 to 17
In terms of disability age 5 to 17, the demographic groups most similar to Celtics are Yakama (6.3%, a difference of 0.10%), Senegalese (6.3%, a difference of 0.18%), U.S. Virgin Islander (6.3%, a difference of 0.33%), Native/Alaskan (6.3%, a difference of 0.33%), and Carpatho Rusyn (6.3%, a difference of 0.35%).
| Demographics | Rating | Rank | Disability Age 5 to 17 |
| Cree | 0.0 /100 | #295 | Tragic 6.2% |
| Spanish Americans | 0.0 /100 | #296 | Tragic 6.2% |
| Immigrants from Bahamas | 0.0 /100 | #297 | Tragic 6.2% |
| Lumbee | 0.0 /100 | #298 | Tragic 6.2% |
| Welsh | 0.0 /100 | #299 | Tragic 6.3% |
| Carpatho Rusyns | 0.0 /100 | #300 | Tragic 6.3% |
| U.S. Virgin Islanders | 0.0 /100 | #301 | Tragic 6.3% |
| Celtics | 0.0 /100 | #302 | Tragic 6.3% |
| Yakama | 0.0 /100 | #303 | Tragic 6.3% |
| Senegalese | 0.0 /100 | #304 | Tragic 6.3% |
| Natives/Alaskans | 0.0 /100 | #305 | Tragic 6.3% |
| Nonimmigrants | 0.0 /100 | #306 | Tragic 6.3% |
| Bahamians | 0.0 /100 | #307 | Tragic 6.3% |
| Scotch-Irish | 0.0 /100 | #308 | Tragic 6.3% |
| Hmong | 0.0 /100 | #309 | Tragic 6.3% |
Celtic Disability Age 5 to 17 Correlation Summary
| Measurement | Celtic Data | Disability Age 5 to 17 Data |
| Minimum | 0.018% | 0.80% |
| Maximum | 25.6% | 25.1% |
| Range | 25.5% | 24.3% |
| Mean | 2.4% | 8.3% |
| Median | 1.8% | 7.1% |
| Interquartile 25% (IQ1) | 0.84% | 5.0% |
| Interquartile 75% (IQ3) | 3.0% | 10.0% |
| Interquartile Range (IQR) | 2.1% | 5.0% |
| Standard Deviation (Sample) | 3.3% | 5.1% |
| Standard Deviation (Population) | 3.3% | 5.1% |
Correlation Details
| Celtic Percentile | Sample Size | Disability Age 5 to 17 |
[ 0.0% - 0.5% ] 0.018% | 128,246,005 | 5.8% |
[ 0.0% - 0.5% ] 0.071% | 22,319,877 | 6.0% |
[ 0.0% - 0.5% ] 0.12% | 8,050,811 | 5.9% |
[ 0.0% - 0.5% ] 0.18% | 3,341,025 | 6.5% |
[ 0.0% - 0.5% ] 0.23% | 2,139,468 | 6.3% |
[ 0.0% - 0.5% ] 0.28% | 1,294,013 | 5.8% |
[ 0.0% - 0.5% ] 0.33% | 570,416 | 8.2% |
[ 0.0% - 0.5% ] 0.39% | 399,116 | 6.2% |
[ 0.0% - 0.5% ] 0.44% | 167,814 | 8.0% |
[ 0.0% - 0.5% ] 0.49% | 207,860 | 7.3% |
[ 0.5% - 1.0% ] 0.54% | 170,679 | 5.9% |
[ 0.5% - 1.0% ] 0.59% | 126,012 | 7.5% |
[ 0.5% - 1.0% ] 0.64% | 202,283 | 6.9% |
[ 0.5% - 1.0% ] 0.70% | 85,786 | 7.0% |
[ 0.5% - 1.0% ] 0.73% | 111,204 | 7.4% |
[ 0.5% - 1.0% ] 0.79% | 199,684 | 7.4% |
[ 0.5% - 1.0% ] 0.84% | 38,627 | 7.4% |
[ 0.5% - 1.0% ] 0.89% | 22,814 | 12.3% |
[ 0.5% - 1.0% ] 0.94% | 65,947 | 8.0% |
[ 1.0% - 1.5% ] 1.01% | 21,839 | 5.1% |
[ 1.0% - 1.5% ] 1.06% | 9,911 | 9.3% |
[ 1.0% - 1.5% ] 1.11% | 31,387 | 4.9% |
[ 1.0% - 1.5% ] 1.15% | 37,009 | 12.9% |
[ 1.0% - 1.5% ] 1.20% | 8,837 | 17.6% |
[ 1.0% - 1.5% ] 1.25% | 17,431 | 8.2% |
[ 1.0% - 1.5% ] 1.31% | 5,628 | 9.5% |
[ 1.0% - 1.5% ] 1.42% | 2,395 | 5.0% |
[ 1.0% - 1.5% ] 1.44% | 11,184 | 10.0% |
[ 1.5% - 2.0% ] 1.51% | 21,586 | 8.9% |
[ 1.5% - 2.0% ] 1.58% | 21,149 | 6.1% |
[ 1.5% - 2.0% ] 1.61% | 11,866 | 3.8% |
[ 1.5% - 2.0% ] 1.71% | 24,568 | 8.1% |
[ 1.5% - 2.0% ] 1.76% | 7,383 | 13.5% |
[ 1.5% - 2.0% ] 1.83% | 6,566 | 6.1% |
[ 1.5% - 2.0% ] 1.85% | 3,084 | 9.7% |
[ 1.5% - 2.0% ] 1.94% | 2,015 | 15.4% |
[ 1.5% - 2.0% ] 1.96% | 3,766 | 25.1% |
[ 2.0% - 2.5% ] 2.02% | 4,159 | 4.9% |
[ 2.0% - 2.5% ] 2.10% | 5,432 | 11.9% |
[ 2.0% - 2.5% ] 2.18% | 12,524 | 4.9% |
[ 2.0% - 2.5% ] 2.22% | 856 | 3.3% |
[ 2.0% - 2.5% ] 2.34% | 128 | 23.5% |
[ 2.0% - 2.5% ] 2.41% | 16,376 | 4.6% |
[ 2.0% - 2.5% ] 2.44% | 4,597 | 9.8% |
[ 2.5% - 3.0% ] 2.54% | 5,560 | 3.7% |
[ 2.5% - 3.0% ] 2.62% | 2,560 | 6.0% |
[ 2.5% - 3.0% ] 2.69% | 781 | 16.7% |
[ 2.5% - 3.0% ] 2.86% | 5,279 | 6.4% |
[ 2.5% - 3.0% ] 2.92% | 3,018 | 6.5% |
[ 2.5% - 3.0% ] 2.95% | 1,220 | 11.6% |
[ 3.0% - 3.5% ] 3.00% | 1,700 | 1.9% |
[ 3.0% - 3.5% ] 3.16% | 729 | 0.80% |
[ 3.0% - 3.5% ] 3.27% | 1,468 | 23.8% |
[ 3.0% - 3.5% ] 3.29% | 2,702 | 10.9% |
[ 3.5% - 4.0% ] 3.60% | 2,753 | 12.5% |
[ 3.5% - 4.0% ] 3.88% | 103 | 10.0% |
[ 4.0% - 4.5% ] 4.01% | 424 | 12.1% |
[ 4.0% - 4.5% ] 4.22% | 2,298 | 2.4% |
[ 4.0% - 4.5% ] 4.35% | 138 | 7.1% |
[ 4.5% - 5.0% ] 4.60% | 7,087 | 2.9% |
[ 4.5% - 5.0% ] 4.82% | 1,059 | 1.2% |
[ 4.5% - 5.0% ] 4.87% | 1,457 | 4.3% |
[ 5.5% - 6.0% ] 5.57% | 3,179 | 3.6% |
[ 6.0% - 6.5% ] 6.46% | 681 | 3.5% |
[ 8.0% - 8.5% ] 8.17% | 1,396 | 17.8% |
[ 25.5% - 26.0% ] 25.56% | 583 | 2.4% |