Immigrants from Armenia Disability Age 5 to 17
COMPARE
Immigrants from Armenia
Select to Compare
Disability Age 5 to 17
Immigrants from Armenia Disability Age 5 to 17
4.1%
DISABILITY | AGE 5 TO 17
100.0/ 100
METRIC RATING
1st/ 347
METRIC RANK
Immigrants from Armenia Disability Age 5 to 17 Correlation Chart
The statistical analysis conducted on geographies consisting of 97,408,018 people shows a mild negative correlation between the proportion of Immigrants from Armenia and percentage of population with a disability between the ages 5 and 17 in the United States with a correlation coefficient (R) of -0.375 and weighted average of 4.1%. On average, for every 1% (one percent) increase in Immigrants from Armenia within a typical geography, there is a decrease of 0.17% in percentage of population with a disability between the ages 5 and 17.
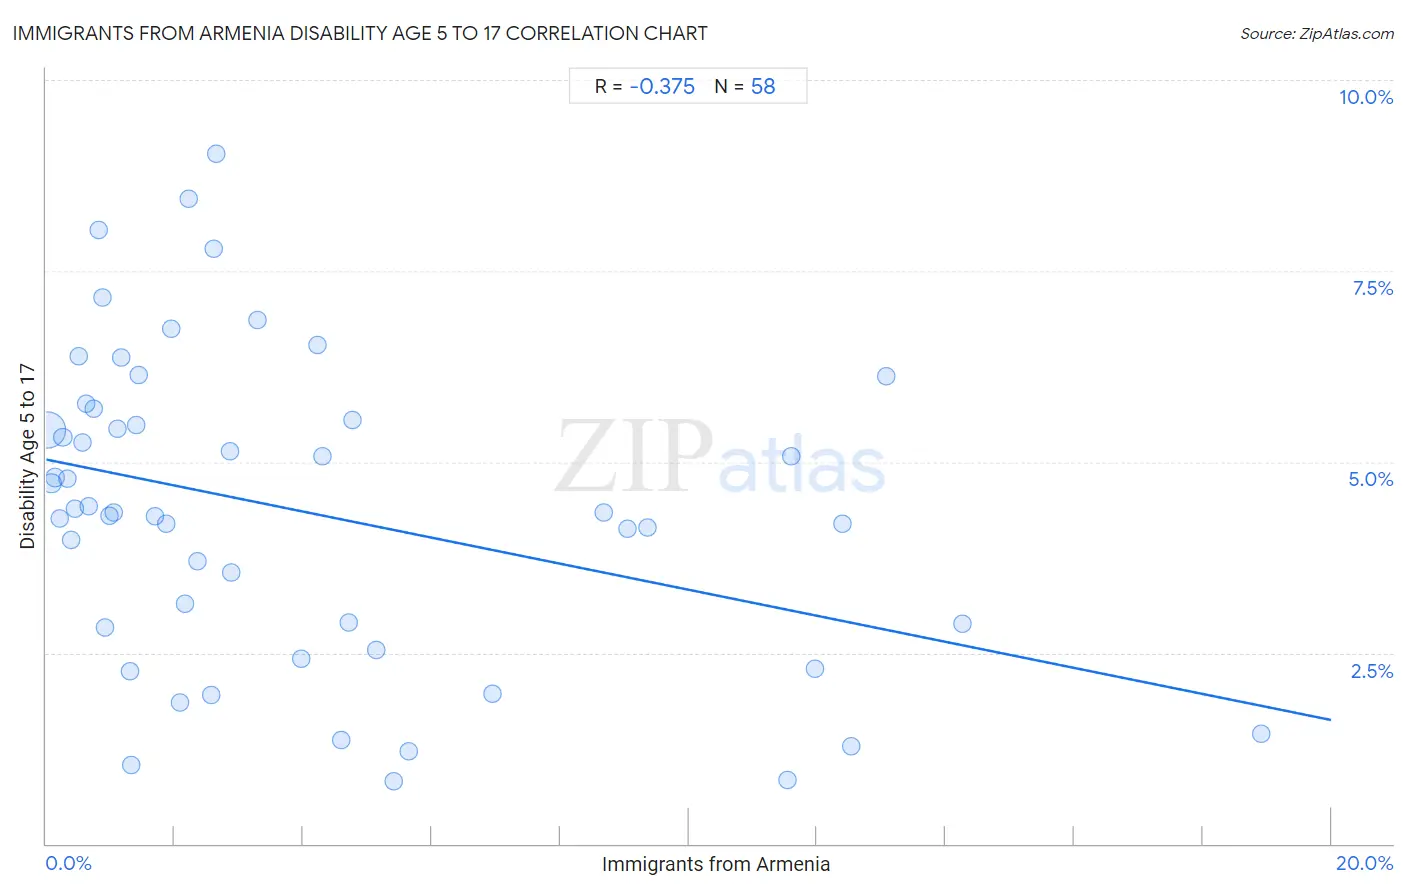
It is essential to understand that the correlation between the percentage of Immigrants from Armenia and percentage of population with a disability between the ages 5 and 17 does not imply a direct cause-and-effect relationship. It remains uncertain whether the presence of Immigrants from Armenia influences an upward or downward trend in the level of percentage of population with a disability between the ages 5 and 17 within an area, or if Immigrants from Armenia simply ended up residing in those areas with higher or lower levels of percentage of population with a disability between the ages 5 and 17 due to other factors.
Demographics Similar to Immigrants from Armenia by Disability Age 5 to 17
In terms of disability age 5 to 17, the demographic groups most similar to Immigrants from Armenia are Immigrants from Taiwan (4.2%, a difference of 3.4%), Immigrants from Hong Kong (4.3%, a difference of 6.0%), Filipino (4.3%, a difference of 7.1%), Immigrants from Iran (4.4%, a difference of 7.7%), and Immigrants from Israel (4.5%, a difference of 11.3%).
| Demographics | Rating | Rank | Disability Age 5 to 17 |
| Immigrants from Armenia | 100.0 /100 | #1 | Exceptional 4.1% |
| Immigrants from Taiwan | 100.0 /100 | #2 | Exceptional 4.2% |
| Immigrants from Hong Kong | 100.0 /100 | #3 | Exceptional 4.3% |
| Filipinos | 100.0 /100 | #4 | Exceptional 4.3% |
| Immigrants from Iran | 100.0 /100 | #5 | Exceptional 4.4% |
| Immigrants from Israel | 100.0 /100 | #6 | Exceptional 4.5% |
| Immigrants from China | 100.0 /100 | #7 | Exceptional 4.5% |
| Indians (Asian) | 100.0 /100 | #8 | Exceptional 4.6% |
| Immigrants from Eastern Asia | 100.0 /100 | #9 | Exceptional 4.6% |
| Immigrants from India | 100.0 /100 | #10 | Exceptional 4.6% |
| Armenians | 100.0 /100 | #11 | Exceptional 4.6% |
| Iranians | 100.0 /100 | #12 | Exceptional 4.6% |
| Thais | 100.0 /100 | #13 | Exceptional 4.7% |
| Immigrants from Korea | 100.0 /100 | #14 | Exceptional 4.7% |
| Chinese | 100.0 /100 | #15 | Exceptional 4.7% |
Immigrants from Armenia Disability Age 5 to 17 Correlation Summary
| Measurement | Immigrants from Armenia Data | Disability Age 5 to 17 Data |
| Minimum | 0.020% | 0.81% |
| Maximum | 18.9% | 9.0% |
| Range | 18.9% | 8.2% |
| Mean | 4.0% | 4.3% |
| Median | 2.2% | 4.3% |
| Interquartile 25% (IQ1) | 0.87% | 2.8% |
| Interquartile 75% (IQ3) | 5.1% | 5.5% |
| Interquartile Range (IQR) | 4.3% | 2.7% |
| Standard Deviation (Sample) | 4.4% | 2.0% |
| Standard Deviation (Population) | 4.4% | 2.0% |
Correlation Details
| Immigrants from Armenia Percentile | Sample Size | Disability Age 5 to 17 |
[ 0.0% - 0.5% ] 0.020% | 71,800,277 | 5.4% |
[ 0.0% - 0.5% ] 0.084% | 8,172,766 | 4.7% |
[ 0.0% - 0.5% ] 0.14% | 4,392,888 | 4.8% |
[ 0.0% - 0.5% ] 0.21% | 2,304,190 | 4.3% |
[ 0.0% - 0.5% ] 0.26% | 1,810,388 | 5.3% |
[ 0.0% - 0.5% ] 0.33% | 663,620 | 4.8% |
[ 0.0% - 0.5% ] 0.39% | 605,580 | 4.0% |
[ 0.0% - 0.5% ] 0.45% | 448,429 | 4.4% |
[ 0.5% - 1.0% ] 0.51% | 96,691 | 6.4% |
[ 0.5% - 1.0% ] 0.57% | 173,886 | 5.3% |
[ 0.5% - 1.0% ] 0.62% | 399,573 | 5.8% |
[ 0.5% - 1.0% ] 0.66% | 118,743 | 4.4% |
[ 0.5% - 1.0% ] 0.74% | 225,375 | 5.7% |
[ 0.5% - 1.0% ] 0.82% | 81,260 | 8.0% |
[ 0.5% - 1.0% ] 0.87% | 32,730 | 7.2% |
[ 0.5% - 1.0% ] 0.92% | 104,155 | 2.8% |
[ 0.5% - 1.0% ] 0.98% | 3,932,408 | 4.3% |
[ 1.0% - 1.5% ] 1.05% | 141,895 | 4.3% |
[ 1.0% - 1.5% ] 1.11% | 126,181 | 5.4% |
[ 1.0% - 1.5% ] 1.17% | 121,433 | 6.4% |
[ 1.0% - 1.5% ] 1.30% | 42,915 | 2.3% |
[ 1.0% - 1.5% ] 1.32% | 20,092 | 1.0% |
[ 1.0% - 1.5% ] 1.41% | 91,800 | 5.5% |
[ 1.0% - 1.5% ] 1.44% | 64,674 | 6.1% |
[ 1.5% - 2.0% ] 1.70% | 63,193 | 4.3% |
[ 1.5% - 2.0% ] 1.87% | 7,126 | 4.2% |
[ 1.5% - 2.0% ] 1.95% | 120,343 | 6.8% |
[ 2.0% - 2.5% ] 2.08% | 42,719 | 1.8% |
[ 2.0% - 2.5% ] 2.16% | 34,649 | 3.1% |
[ 2.0% - 2.5% ] 2.22% | 59,449 | 8.4% |
[ 2.0% - 2.5% ] 2.36% | 85,620 | 3.7% |
[ 2.5% - 3.0% ] 2.56% | 35,918 | 1.9% |
[ 2.5% - 3.0% ] 2.60% | 67,937 | 7.8% |
[ 2.5% - 3.0% ] 2.65% | 5,474 | 9.0% |
[ 2.5% - 3.0% ] 2.86% | 2,451 | 5.1% |
[ 2.5% - 3.0% ] 2.88% | 30,333 | 3.6% |
[ 3.0% - 3.5% ] 3.29% | 30,982 | 6.9% |
[ 3.5% - 4.0% ] 3.97% | 27,479 | 2.4% |
[ 4.0% - 4.5% ] 4.23% | 76,335 | 6.5% |
[ 4.0% - 4.5% ] 4.29% | 53,862 | 5.1% |
[ 4.5% - 5.0% ] 4.58% | 15,377 | 1.4% |
[ 4.5% - 5.0% ] 4.71% | 60,090 | 2.9% |
[ 4.5% - 5.0% ] 4.77% | 55,451 | 5.5% |
[ 5.0% - 5.5% ] 5.14% | 45,764 | 2.5% |
[ 5.0% - 5.5% ] 5.41% | 7,509 | 0.81% |
[ 5.5% - 6.0% ] 5.64% | 12,312 | 1.2% |
[ 6.5% - 7.0% ] 6.95% | 54,643 | 2.0% |
[ 8.5% - 9.0% ] 8.68% | 27,119 | 4.3% |
[ 9.0% - 9.5% ] 9.04% | 51,654 | 4.1% |
[ 9.0% - 9.5% ] 9.35% | 18,951 | 4.1% |
[ 11.5% - 12.0% ] 11.54% | 18,445 | 0.84% |
[ 11.5% - 12.0% ] 11.59% | 22,831 | 5.1% |
[ 11.5% - 12.0% ] 11.97% | 194,512 | 2.3% |
[ 12.0% - 12.5% ] 12.39% | 16,679 | 4.2% |
[ 12.5% - 13.0% ] 12.54% | 32,294 | 1.3% |
[ 13.0% - 13.5% ] 13.08% | 650 | 6.1% |
[ 14.0% - 14.5% ] 14.26% | 22,163 | 2.9% |
[ 18.5% - 19.0% ] 18.91% | 35,755 | 1.4% |