Greek Disability Age 5 to 17
COMPARE
Greek
Select to Compare
Disability Age 5 to 17
Greek Disability Age 5 to 17
5.6%
DISABILITY | AGE 5 TO 17
60.6/ 100
METRIC RATING
166th/ 347
METRIC RANK
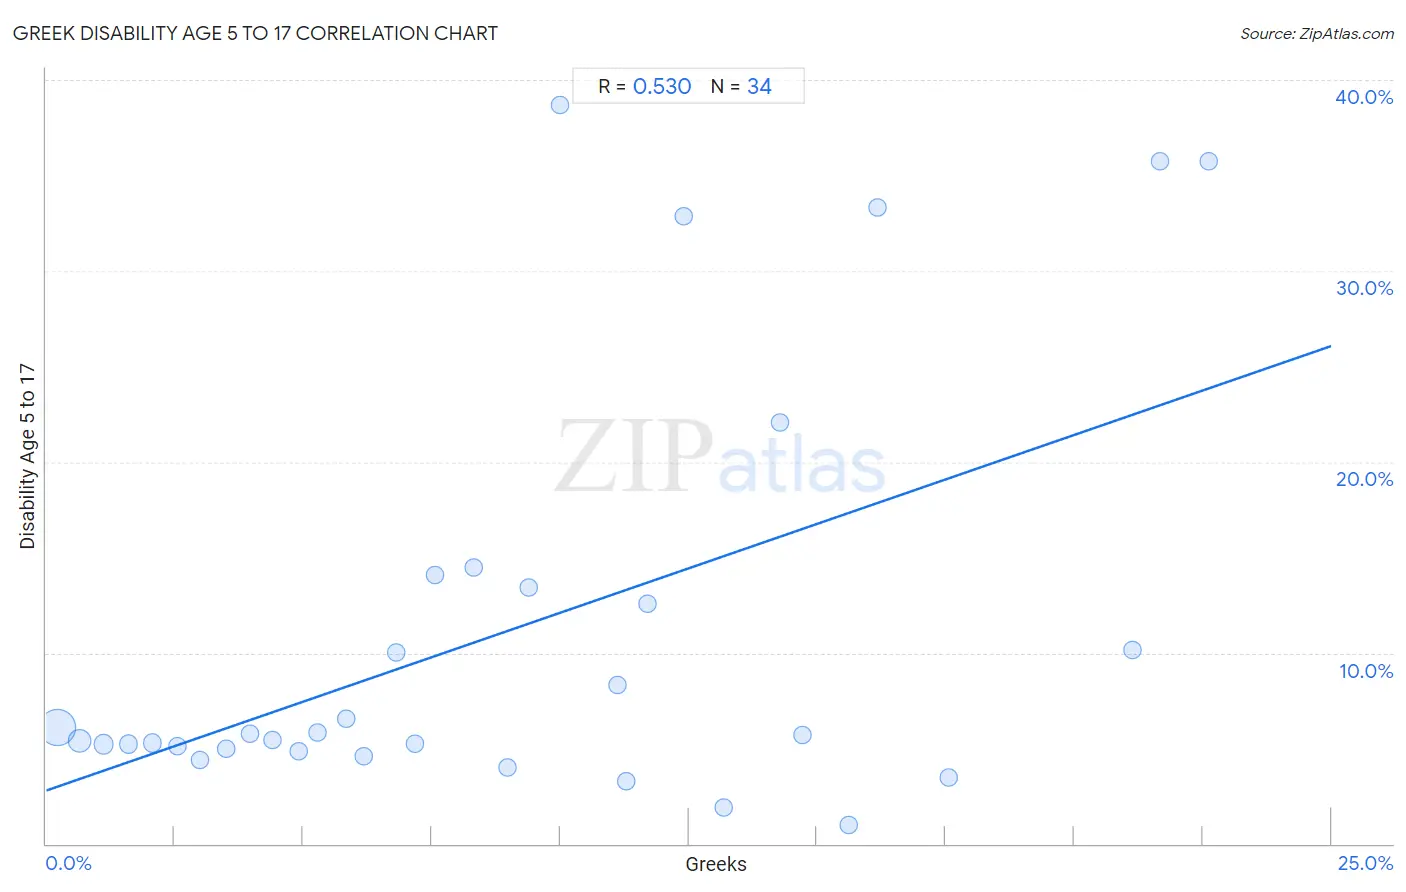
Greek Disability Age 5 to 17 Correlation Chart
The statistical analysis conducted on geographies consisting of 476,363,974 people shows a substantial positive correlation between the proportion of Greeks and percentage of population with a disability between the ages 5 and 17 in the United States with a correlation coefficient (R) of 0.530 and weighted average of 5.6%. On average, for every 1% (one percent) increase in Greeks within a typical geography, there is an increase of 0.93% in percentage of population with a disability between the ages 5 and 17.
It is essential to understand that the correlation between the percentage of Greeks and percentage of population with a disability between the ages 5 and 17 does not imply a direct cause-and-effect relationship. It remains uncertain whether the presence of Greeks influences an upward or downward trend in the level of percentage of population with a disability between the ages 5 and 17 within an area, or if Greeks simply ended up residing in those areas with higher or lower levels of percentage of population with a disability between the ages 5 and 17 due to other factors.
Demographics Similar to Greeks by Disability Age 5 to 17
In terms of disability age 5 to 17, the demographic groups most similar to Greeks are Lebanese (5.6%, a difference of 0.040%), Immigrants from Scotland (5.6%, a difference of 0.070%), Immigrants from Burma/Myanmar (5.6%, a difference of 0.070%), Immigrants from Southern Europe (5.6%, a difference of 0.18%), and Iraqi (5.6%, a difference of 0.23%).
| Demographics | Rating | Rank | Disability Age 5 to 17 |
| Immigrants from Zimbabwe | 75.3 /100 | #159 | Good 5.5% |
| South Africans | 73.3 /100 | #160 | Good 5.5% |
| Immigrants from Saudi Arabia | 69.1 /100 | #161 | Good 5.5% |
| Zimbabweans | 67.2 /100 | #162 | Good 5.5% |
| Immigrants from Southern Europe | 64.0 /100 | #163 | Good 5.6% |
| Immigrants from Scotland | 61.9 /100 | #164 | Good 5.6% |
| Lebanese | 61.4 /100 | #165 | Good 5.6% |
| Greeks | 60.6 /100 | #166 | Good 5.6% |
| Immigrants from Burma/Myanmar | 59.3 /100 | #167 | Average 5.6% |
| Iraqis | 56.0 /100 | #168 | Average 5.6% |
| Immigrants from Norway | 55.7 /100 | #169 | Average 5.6% |
| Serbians | 54.0 /100 | #170 | Average 5.6% |
| Immigrants from Iraq | 53.9 /100 | #171 | Average 5.6% |
| Ukrainians | 51.5 /100 | #172 | Average 5.6% |
| Uruguayans | 51.0 /100 | #173 | Average 5.6% |
Greek Disability Age 5 to 17 Correlation Summary
| Measurement | Greek Data | Disability Age 5 to 17 Data |
| Minimum | 0.21% | 0.96% |
| Maximum | 22.6% | 38.7% |
| Range | 22.4% | 37.7% |
| Mean | 9.0% | 11.2% |
| Median | 7.9% | 5.7% |
| Interquartile 25% (IQ1) | 4.0% | 5.0% |
| Interquartile 75% (IQ3) | 13.2% | 13.4% |
| Interquartile Range (IQR) | 9.2% | 8.5% |
| Standard Deviation (Sample) | 6.3% | 11.0% |
| Standard Deviation (Population) | 6.2% | 10.8% |
Correlation Details
| Greek Percentile | Sample Size | Disability Age 5 to 17 |
[ 0.0% - 0.5% ] 0.21% | 327,532,734 | 6.1% |
[ 0.5% - 1.0% ] 0.65% | 101,487,710 | 5.4% |
[ 1.0% - 1.5% ] 1.11% | 26,397,059 | 5.2% |
[ 1.5% - 2.0% ] 1.61% | 10,484,511 | 5.2% |
[ 2.0% - 2.5% ] 2.06% | 4,165,375 | 5.3% |
[ 2.5% - 3.0% ] 2.55% | 2,712,713 | 5.1% |
[ 2.5% - 3.0% ] 3.00% | 1,454,595 | 4.4% |
[ 3.0% - 3.5% ] 3.50% | 722,616 | 5.0% |
[ 3.5% - 4.0% ] 3.96% | 278,862 | 5.7% |
[ 4.0% - 4.5% ] 4.40% | 462,268 | 5.4% |
[ 4.5% - 5.0% ] 4.90% | 118,112 | 4.9% |
[ 5.0% - 5.5% ] 5.29% | 145,880 | 5.8% |
[ 5.5% - 6.0% ] 5.84% | 105,225 | 6.6% |
[ 6.0% - 6.5% ] 6.18% | 64,869 | 4.6% |
[ 6.5% - 7.0% ] 6.81% | 53,944 | 10.0% |
[ 7.0% - 7.5% ] 7.18% | 77,445 | 5.3% |
[ 7.5% - 8.0% ] 7.57% | 26,234 | 14.1% |
[ 8.0% - 8.5% ] 8.31% | 1,035 | 14.5% |
[ 8.5% - 9.0% ] 8.98% | 958 | 4.0% |
[ 9.0% - 9.5% ] 9.39% | 543 | 13.4% |
[ 10.0% - 10.5% ] 10.00% | 190 | 38.7% |
[ 11.0% - 11.5% ] 11.12% | 10,814 | 8.3% |
[ 11.0% - 11.5% ] 11.30% | 46,706 | 3.3% |
[ 11.5% - 12.0% ] 11.70% | 2,282 | 12.6% |
[ 12.0% - 12.5% ] 12.41% | 572 | 32.8% |
[ 13.0% - 13.5% ] 13.17% | 463 | 1.9% |
[ 14.0% - 14.5% ] 14.29% | 525 | 22.1% |
[ 14.5% - 15.0% ] 14.72% | 3,063 | 5.7% |
[ 15.5% - 16.0% ] 15.62% | 4,065 | 0.96% |
[ 16.0% - 16.5% ] 16.16% | 198 | 33.3% |
[ 17.5% - 18.0% ] 17.55% | 188 | 3.4% |
[ 21.0% - 21.5% ] 21.13% | 1,940 | 10.2% |
[ 21.5% - 22.0% ] 21.68% | 143 | 35.7% |
[ 22.5% - 23.0% ] 22.63% | 137 | 35.7% |