Assyrian/Chaldean/Syriac vs Cheyenne Disability Age 5 to 17
COMPARE
Assyrian/Chaldean/Syriac
Cheyenne
Disability Age 5 to 17
Disability Age 5 to 17 Comparison
Assyrians/Chaldeans/Syriacs
Cheyenne
5.0%
DISABILITY AGE 5 TO 17
100.0/ 100
METRIC RATING
46th/ 347
METRIC RANK
6.0%
DISABILITY AGE 5 TO 17
0.2/ 100
METRIC RATING
274th/ 347
METRIC RANK
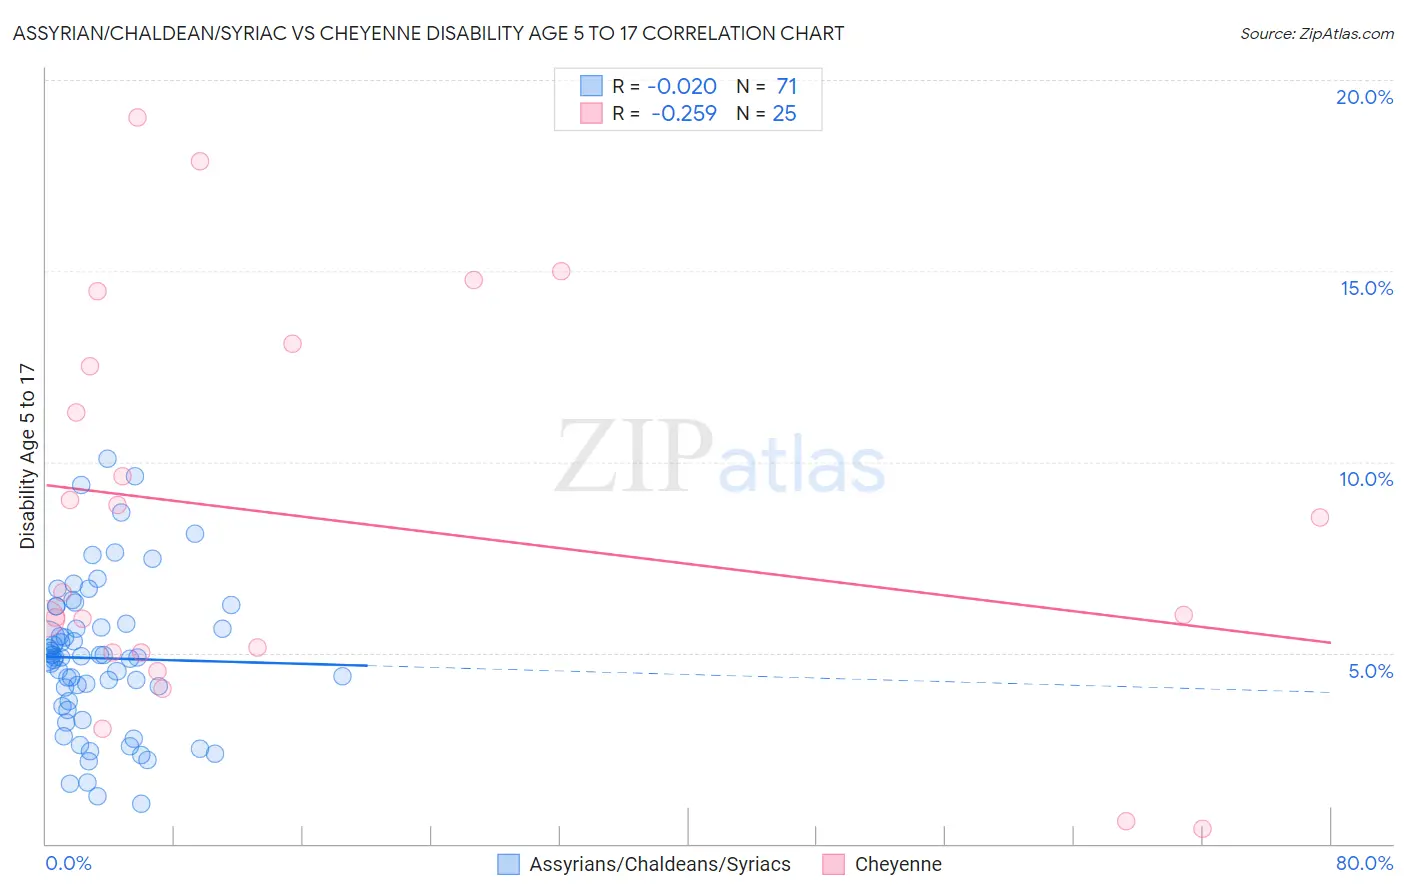
Assyrian/Chaldean/Syriac vs Cheyenne Disability Age 5 to 17 Correlation Chart
The statistical analysis conducted on geographies consisting of 110,004,122 people shows no correlation between the proportion of Assyrians/Chaldeans/Syriacs and percentage of population with a disability between the ages 5 and 17 in the United States with a correlation coefficient (R) of -0.020 and weighted average of 5.0%. Similarly, the statistical analysis conducted on geographies consisting of 80,502,855 people shows a weak negative correlation between the proportion of Cheyenne and percentage of population with a disability between the ages 5 and 17 in the United States with a correlation coefficient (R) of -0.259 and weighted average of 6.0%, a difference of 19.7%.
Disability Age 5 to 17 Correlation Summary
| Measurement | Assyrian/Chaldean/Syriac | Cheyenne |
| Minimum | 1.0% | 0.39% |
| Maximum | 10.1% | 19.0% |
| Range | 9.0% | 18.6% |
| Mean | 4.9% | 8.5% |
| Median | 4.9% | 6.6% |
| Interquartile 25% (IQ1) | 3.6% | 5.0% |
| Interquartile 75% (IQ3) | 5.8% | 12.8% |
| Interquartile Range (IQR) | 2.2% | 7.8% |
| Standard Deviation (Sample) | 2.0% | 5.1% |
| Standard Deviation (Population) | 1.9% | 5.0% |
Similar Demographics by Disability Age 5 to 17
Demographics Similar to Assyrians/Chaldeans/Syriacs by Disability Age 5 to 17
In terms of disability age 5 to 17, the demographic groups most similar to Assyrians/Chaldeans/Syriacs are Tongan (5.0%, a difference of 0.070%), Vietnamese (5.1%, a difference of 0.13%), Egyptian (5.0%, a difference of 0.14%), Immigrants from Russia (5.0%, a difference of 0.18%), and Korean (5.1%, a difference of 0.31%).
| Demographics | Rating | Rank | Disability Age 5 to 17 |
| Immigrants | Argentina | 100.0 /100 | #39 | Exceptional 5.0% |
| Okinawans | 100.0 /100 | #40 | Exceptional 5.0% |
| Immigrants | Australia | 100.0 /100 | #41 | Exceptional 5.0% |
| Immigrants | Sri Lanka | 100.0 /100 | #42 | Exceptional 5.0% |
| Immigrants | Russia | 100.0 /100 | #43 | Exceptional 5.0% |
| Egyptians | 100.0 /100 | #44 | Exceptional 5.0% |
| Tongans | 100.0 /100 | #45 | Exceptional 5.0% |
| Assyrians/Chaldeans/Syriacs | 100.0 /100 | #46 | Exceptional 5.0% |
| Vietnamese | 100.0 /100 | #47 | Exceptional 5.1% |
| Koreans | 100.0 /100 | #48 | Exceptional 5.1% |
| Immigrants | Western Asia | 100.0 /100 | #49 | Exceptional 5.1% |
| Argentineans | 99.9 /100 | #50 | Exceptional 5.1% |
| Turks | 99.9 /100 | #51 | Exceptional 5.1% |
| Immigrants | Fiji | 99.9 /100 | #52 | Exceptional 5.1% |
| Immigrants | Lithuania | 99.9 /100 | #53 | Exceptional 5.1% |
Demographics Similar to Cheyenne by Disability Age 5 to 17
In terms of disability age 5 to 17, the demographic groups most similar to Cheyenne are Alaska Native (6.0%, a difference of 0.11%), Dutch (6.0%, a difference of 0.11%), Finnish (6.0%, a difference of 0.16%), Immigrants from Zaire (6.0%, a difference of 0.19%), and Japanese (6.1%, a difference of 0.21%).
| Demographics | Rating | Rank | Disability Age 5 to 17 |
| Spanish | 0.5 /100 | #267 | Tragic 6.0% |
| Sioux | 0.4 /100 | #268 | Tragic 6.0% |
| Liberians | 0.4 /100 | #269 | Tragic 6.0% |
| Immigrants | Somalia | 0.4 /100 | #270 | Tragic 6.0% |
| Immigrants | Zaire | 0.2 /100 | #271 | Tragic 6.0% |
| Finns | 0.2 /100 | #272 | Tragic 6.0% |
| Alaska Natives | 0.2 /100 | #273 | Tragic 6.0% |
| Cheyenne | 0.2 /100 | #274 | Tragic 6.0% |
| Dutch | 0.2 /100 | #275 | Tragic 6.0% |
| Japanese | 0.1 /100 | #276 | Tragic 6.1% |
| Puget Sound Salish | 0.1 /100 | #277 | Tragic 6.1% |
| Immigrants | Liberia | 0.1 /100 | #278 | Tragic 6.1% |
| Immigrants | Jamaica | 0.1 /100 | #279 | Tragic 6.1% |
| Portuguese | 0.1 /100 | #280 | Tragic 6.1% |
| Scottish | 0.0 /100 | #281 | Tragic 6.1% |