Immigrants from Syria Disability Age 5 to 17
COMPARE
Immigrants from Syria
Select to Compare
Disability Age 5 to 17
Immigrants from Syria Disability Age 5 to 17
5.2%
DISABILITY | AGE 5 TO 17
99.7/ 100
METRIC RATING
68th/ 347
METRIC RANK
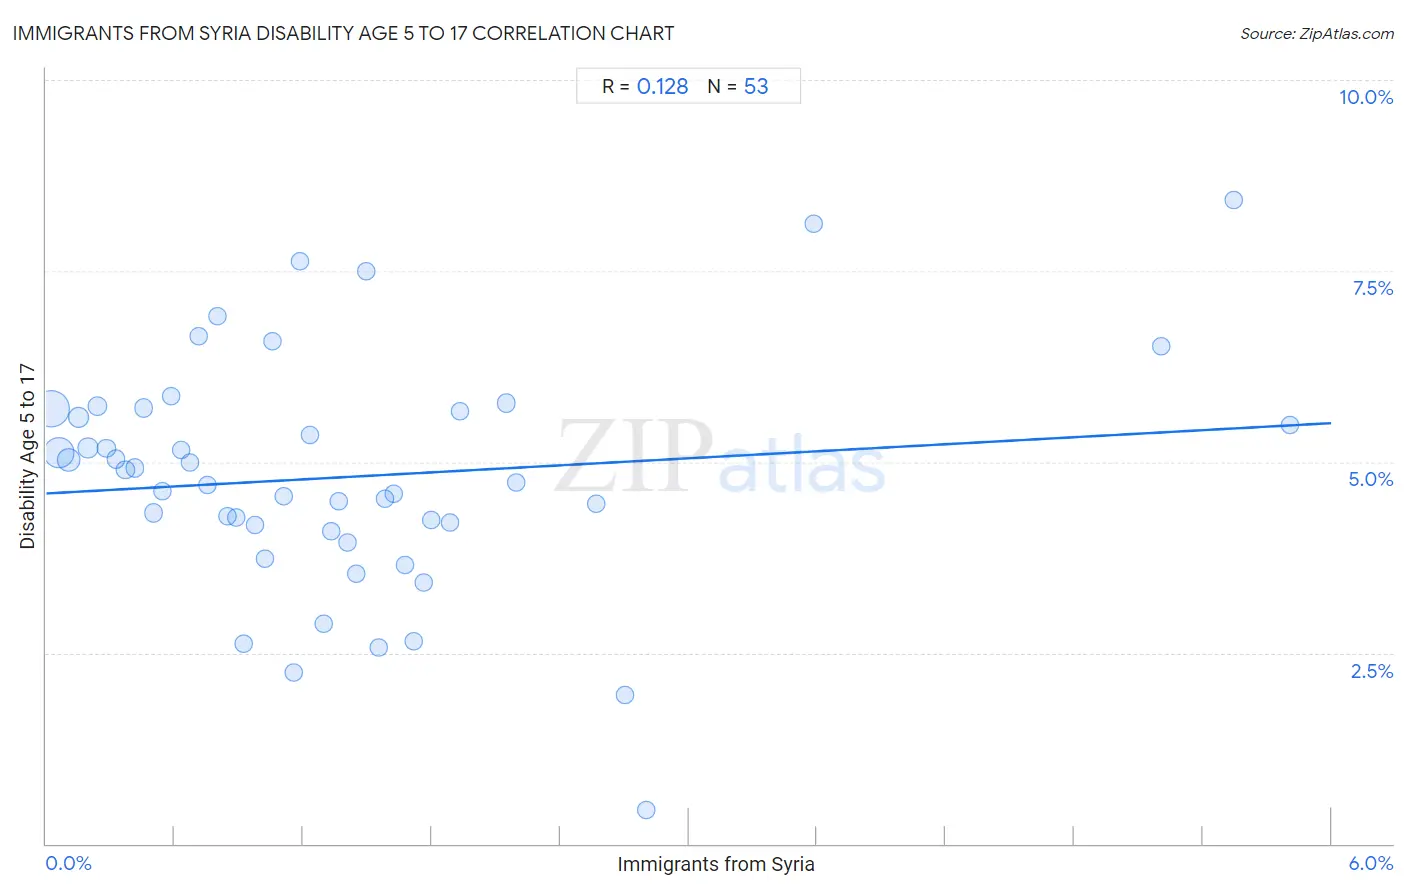
Immigrants from Syria Disability Age 5 to 17 Correlation Chart
The statistical analysis conducted on geographies consisting of 173,683,578 people shows a poor positive correlation between the proportion of Immigrants from Syria and percentage of population with a disability between the ages 5 and 17 in the United States with a correlation coefficient (R) of 0.128 and weighted average of 5.2%. On average, for every 1% (one percent) increase in Immigrants from Syria within a typical geography, there is an increase of 0.15% in percentage of population with a disability between the ages 5 and 17.
It is essential to understand that the correlation between the percentage of Immigrants from Syria and percentage of population with a disability between the ages 5 and 17 does not imply a direct cause-and-effect relationship. It remains uncertain whether the presence of Immigrants from Syria influences an upward or downward trend in the level of percentage of population with a disability between the ages 5 and 17 within an area, or if Immigrants from Syria simply ended up residing in those areas with higher or lower levels of percentage of population with a disability between the ages 5 and 17 due to other factors.
Demographics Similar to Immigrants from Syria by Disability Age 5 to 17
In terms of disability age 5 to 17, the demographic groups most similar to Immigrants from Syria are Guyanese (5.2%, a difference of 0.11%), Macedonian (5.2%, a difference of 0.14%), Immigrants from Belgium (5.2%, a difference of 0.15%), Palestinian (5.2%, a difference of 0.17%), and Jordanian (5.2%, a difference of 0.20%).
| Demographics | Rating | Rank | Disability Age 5 to 17 |
| Immigrants from Switzerland | 99.8 /100 | #61 | Exceptional 5.2% |
| Immigrants from Ireland | 99.8 /100 | #62 | Exceptional 5.2% |
| Immigrants from Bangladesh | 99.8 /100 | #63 | Exceptional 5.2% |
| Immigrants from South Eastern Asia | 99.8 /100 | #64 | Exceptional 5.2% |
| Immigrants from Greece | 99.8 /100 | #65 | Exceptional 5.2% |
| Palestinians | 99.8 /100 | #66 | Exceptional 5.2% |
| Macedonians | 99.8 /100 | #67 | Exceptional 5.2% |
| Immigrants from Syria | 99.7 /100 | #68 | Exceptional 5.2% |
| Guyanese | 99.7 /100 | #69 | Exceptional 5.2% |
| Immigrants from Belgium | 99.7 /100 | #70 | Exceptional 5.2% |
| Jordanians | 99.7 /100 | #71 | Exceptional 5.2% |
| Immigrants from Vietnam | 99.7 /100 | #72 | Exceptional 5.2% |
| Immigrants from Czechoslovakia | 99.7 /100 | #73 | Exceptional 5.2% |
| Immigrants from Romania | 99.7 /100 | #74 | Exceptional 5.2% |
| Immigrants from Moldova | 99.6 /100 | #75 | Exceptional 5.2% |
Immigrants from Syria Disability Age 5 to 17 Correlation Summary
| Measurement | Immigrants from Syria Data | Disability Age 5 to 17 Data |
| Minimum | 0.021% | 0.44% |
| Maximum | 5.8% | 8.4% |
| Range | 5.8% | 8.0% |
| Mean | 1.4% | 4.8% |
| Median | 1.2% | 4.7% |
| Interquartile 25% (IQ1) | 0.56% | 4.1% |
| Interquartile 75% (IQ3) | 1.7% | 5.7% |
| Interquartile Range (IQR) | 1.2% | 1.5% |
| Standard Deviation (Sample) | 1.3% | 1.5% |
| Standard Deviation (Population) | 1.3% | 1.5% |
Correlation Details
| Immigrants from Syria Percentile | Sample Size | Disability Age 5 to 17 |
[ 0.0% - 0.5% ] 0.021% | 70,566,214 | 5.7% |
[ 0.0% - 0.5% ] 0.060% | 45,784,762 | 5.1% |
[ 0.0% - 0.5% ] 0.11% | 19,260,855 | 5.0% |
[ 0.0% - 0.5% ] 0.15% | 10,431,777 | 5.6% |
[ 0.0% - 0.5% ] 0.20% | 5,834,325 | 5.2% |
[ 0.0% - 0.5% ] 0.24% | 5,335,288 | 5.7% |
[ 0.0% - 0.5% ] 0.28% | 3,249,974 | 5.2% |
[ 0.0% - 0.5% ] 0.33% | 2,043,648 | 5.0% |
[ 0.0% - 0.5% ] 0.37% | 1,460,220 | 4.9% |
[ 0.0% - 0.5% ] 0.41% | 1,101,016 | 4.9% |
[ 0.0% - 0.5% ] 0.46% | 852,729 | 5.7% |
[ 0.0% - 0.5% ] 0.50% | 1,546,038 | 4.3% |
[ 0.5% - 1.0% ] 0.54% | 545,735 | 4.6% |
[ 0.5% - 1.0% ] 0.58% | 761,248 | 5.9% |
[ 0.5% - 1.0% ] 0.63% | 581,079 | 5.2% |
[ 0.5% - 1.0% ] 0.67% | 162,130 | 5.0% |
[ 0.5% - 1.0% ] 0.71% | 342,854 | 6.6% |
[ 0.5% - 1.0% ] 0.75% | 389,433 | 4.7% |
[ 0.5% - 1.0% ] 0.80% | 488,355 | 6.9% |
[ 0.5% - 1.0% ] 0.85% | 229,137 | 4.3% |
[ 0.5% - 1.0% ] 0.89% | 238,027 | 4.3% |
[ 0.5% - 1.0% ] 0.92% | 265,656 | 2.6% |
[ 0.5% - 1.0% ] 0.98% | 182,116 | 4.2% |
[ 1.0% - 1.5% ] 1.02% | 316,914 | 3.7% |
[ 1.0% - 1.5% ] 1.06% | 177,379 | 6.6% |
[ 1.0% - 1.5% ] 1.11% | 134,021 | 4.6% |
[ 1.0% - 1.5% ] 1.16% | 49,586 | 2.2% |
[ 1.0% - 1.5% ] 1.18% | 123,075 | 7.6% |
[ 1.0% - 1.5% ] 1.23% | 267,825 | 5.3% |
[ 1.0% - 1.5% ] 1.30% | 18,512 | 2.9% |
[ 1.0% - 1.5% ] 1.33% | 39,730 | 4.1% |
[ 1.0% - 1.5% ] 1.37% | 94,053 | 4.5% |
[ 1.0% - 1.5% ] 1.41% | 52,708 | 3.9% |
[ 1.0% - 1.5% ] 1.45% | 53,930 | 3.5% |
[ 1.0% - 1.5% ] 1.49% | 45,602 | 7.5% |
[ 1.5% - 2.0% ] 1.55% | 258 | 2.6% |
[ 1.5% - 2.0% ] 1.58% | 68,001 | 4.5% |
[ 1.5% - 2.0% ] 1.62% | 146,379 | 4.6% |
[ 1.5% - 2.0% ] 1.67% | 4,362 | 3.6% |
[ 1.5% - 2.0% ] 1.72% | 22,017 | 2.6% |
[ 1.5% - 2.0% ] 1.76% | 32,376 | 3.4% |
[ 1.5% - 2.0% ] 1.80% | 17,212 | 4.2% |
[ 1.5% - 2.0% ] 1.89% | 23,700 | 4.2% |
[ 1.5% - 2.0% ] 1.93% | 31,671 | 5.7% |
[ 2.0% - 2.5% ] 2.15% | 83,343 | 5.8% |
[ 2.0% - 2.5% ] 2.19% | 27,468 | 4.7% |
[ 2.5% - 3.0% ] 2.57% | 80,113 | 4.5% |
[ 2.5% - 3.0% ] 2.70% | 35,960 | 1.9% |
[ 2.5% - 3.0% ] 2.80% | 8,180 | 0.44% |
[ 3.5% - 4.0% ] 3.58% | 24,985 | 8.1% |
[ 5.0% - 5.5% ] 5.21% | 29,286 | 6.5% |
[ 5.5% - 6.0% ] 5.54% | 16,358 | 8.4% |
[ 5.5% - 6.0% ] 5.81% | 5,958 | 5.5% |