European Disability Age 5 to 17
COMPARE
European
Select to Compare
Disability Age 5 to 17
European Disability Age 5 to 17
5.8%
DISABILITY | AGE 5 TO 17
4.5/ 100
METRIC RATING
231st/ 347
METRIC RANK
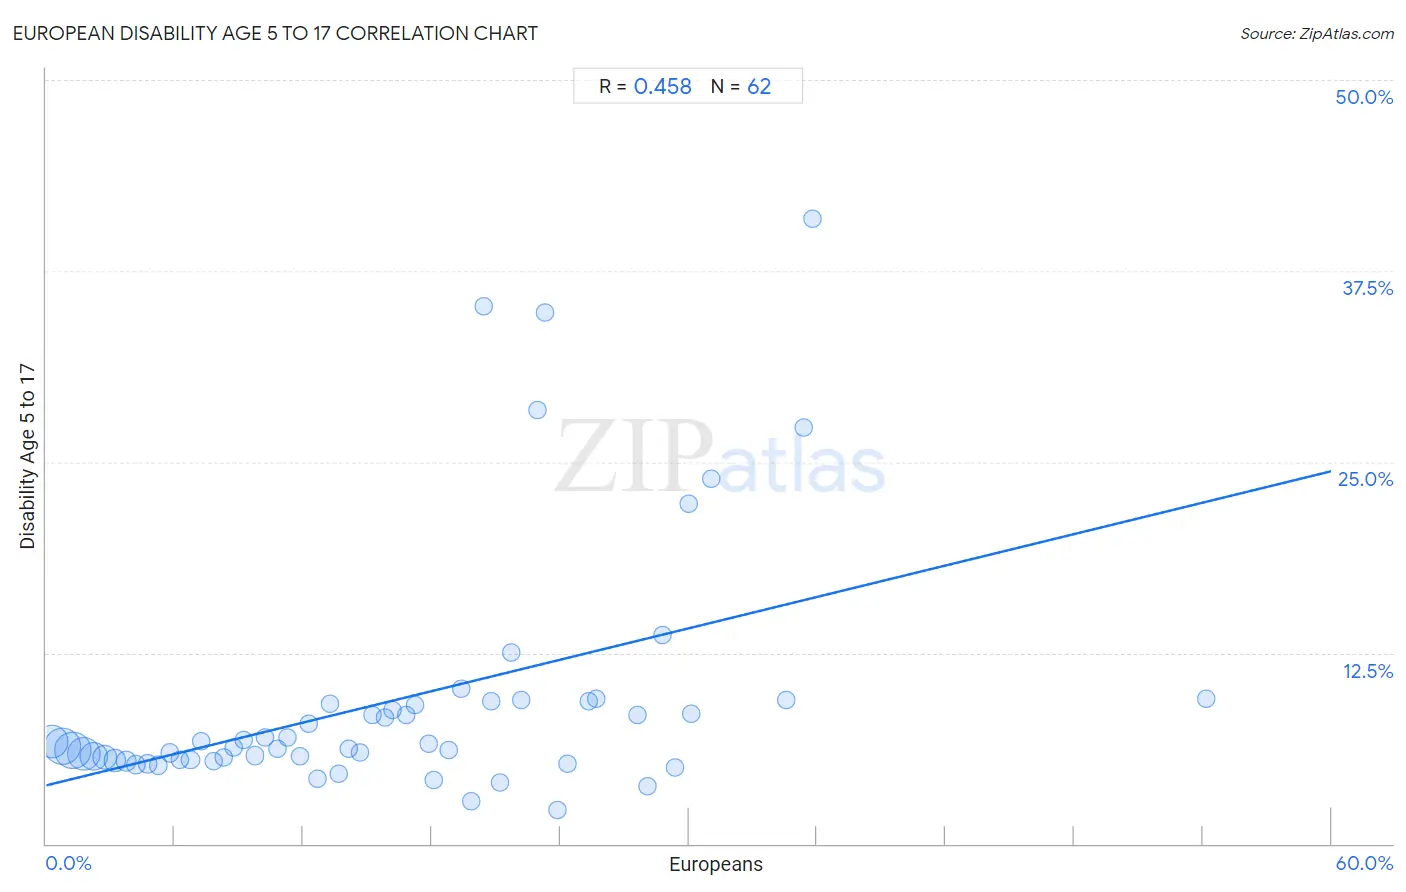
European Disability Age 5 to 17 Correlation Chart
The statistical analysis conducted on geographies consisting of 549,684,135 people shows a moderate positive correlation between the proportion of Europeans and percentage of population with a disability between the ages 5 and 17 in the United States with a correlation coefficient (R) of 0.458 and weighted average of 5.8%. On average, for every 1% (one percent) increase in Europeans within a typical geography, there is an increase of 0.34% in percentage of population with a disability between the ages 5 and 17.
It is essential to understand that the correlation between the percentage of Europeans and percentage of population with a disability between the ages 5 and 17 does not imply a direct cause-and-effect relationship. It remains uncertain whether the presence of Europeans influences an upward or downward trend in the level of percentage of population with a disability between the ages 5 and 17 within an area, or if Europeans simply ended up residing in those areas with higher or lower levels of percentage of population with a disability between the ages 5 and 17 due to other factors.
Demographics Similar to Europeans by Disability Age 5 to 17
In terms of disability age 5 to 17, the demographic groups most similar to Europeans are Ghanaian (5.8%, a difference of 0.070%), Bangladeshi (5.8%, a difference of 0.080%), Haitian (5.8%, a difference of 0.090%), Swiss (5.8%, a difference of 0.17%), and Immigrants from Laos (5.8%, a difference of 0.20%).
| Demographics | Rating | Rank | Disability Age 5 to 17 |
| Mexicans | 5.7 /100 | #224 | Tragic 5.8% |
| Guamanians/Chamorros | 5.6 /100 | #225 | Tragic 5.8% |
| British West Indians | 5.4 /100 | #226 | Tragic 5.8% |
| Swiss | 5.1 /100 | #227 | Tragic 5.8% |
| Haitians | 4.8 /100 | #228 | Tragic 5.8% |
| Bangladeshis | 4.8 /100 | #229 | Tragic 5.8% |
| Ghanaians | 4.7 /100 | #230 | Tragic 5.8% |
| Europeans | 4.5 /100 | #231 | Tragic 5.8% |
| Immigrants from Laos | 3.8 /100 | #232 | Tragic 5.8% |
| Immigrants from West Indies | 3.5 /100 | #233 | Tragic 5.8% |
| Immigrants from Kenya | 3.4 /100 | #234 | Tragic 5.8% |
| Malaysians | 3.4 /100 | #235 | Tragic 5.8% |
| Immigrants from Brazil | 3.2 /100 | #236 | Tragic 5.8% |
| Sudanese | 2.9 /100 | #237 | Tragic 5.8% |
| Hungarians | 2.6 /100 | #238 | Tragic 5.8% |
European Disability Age 5 to 17 Correlation Summary
| Measurement | European Data | Disability Age 5 to 17 Data |
| Minimum | 0.27% | 2.2% |
| Maximum | 54.2% | 40.9% |
| Range | 53.9% | 38.7% |
| Mean | 16.4% | 9.4% |
| Median | 15.5% | 6.5% |
| Interquartile 25% (IQ1) | 7.8% | 5.5% |
| Interquartile 75% (IQ3) | 23.3% | 9.3% |
| Interquartile Range (IQR) | 15.5% | 3.8% |
| Standard Deviation (Sample) | 10.8% | 8.1% |
| Standard Deviation (Population) | 10.7% | 8.0% |
Correlation Details
| European Percentile | Sample Size | Disability Age 5 to 17 |
[ 0.0% - 0.5% ] 0.27% | 83,401,407 | 6.7% |
[ 0.5% - 1.0% ] 0.77% | 108,316,431 | 6.4% |
[ 1.0% - 1.5% ] 1.25% | 104,237,587 | 6.1% |
[ 1.5% - 2.0% ] 1.73% | 85,761,600 | 5.9% |
[ 2.0% - 2.5% ] 2.23% | 57,644,495 | 5.8% |
[ 2.5% - 3.0% ] 2.73% | 38,865,365 | 5.7% |
[ 3.0% - 3.5% ] 3.22% | 23,119,578 | 5.5% |
[ 3.5% - 4.0% ] 3.74% | 15,142,920 | 5.4% |
[ 4.0% - 4.5% ] 4.20% | 11,189,640 | 5.2% |
[ 4.5% - 5.0% ] 4.74% | 6,590,262 | 5.2% |
[ 5.0% - 5.5% ] 5.23% | 4,739,534 | 5.1% |
[ 5.5% - 6.0% ] 5.75% | 2,407,479 | 5.9% |
[ 6.0% - 6.5% ] 6.24% | 1,857,799 | 5.5% |
[ 6.5% - 7.0% ] 6.74% | 1,649,896 | 5.5% |
[ 7.0% - 7.5% ] 7.25% | 780,444 | 6.7% |
[ 7.5% - 8.0% ] 7.83% | 807,964 | 5.4% |
[ 8.0% - 8.5% ] 8.28% | 524,435 | 5.7% |
[ 8.5% - 9.0% ] 8.75% | 367,514 | 6.3% |
[ 9.0% - 9.5% ] 9.20% | 368,305 | 6.8% |
[ 9.5% - 10.0% ] 9.72% | 460,541 | 5.8% |
[ 10.0% - 10.5% ] 10.19% | 211,317 | 6.9% |
[ 10.5% - 11.0% ] 10.79% | 114,995 | 6.2% |
[ 11.0% - 11.5% ] 11.24% | 144,534 | 6.9% |
[ 11.5% - 12.0% ] 11.83% | 97,884 | 5.7% |
[ 12.0% - 12.5% ] 12.28% | 100,071 | 7.9% |
[ 12.5% - 13.0% ] 12.64% | 119,986 | 4.3% |
[ 13.0% - 13.5% ] 13.24% | 40,677 | 9.1% |
[ 13.5% - 14.0% ] 13.66% | 158,753 | 4.6% |
[ 14.0% - 14.5% ] 14.11% | 29,232 | 6.3% |
[ 14.5% - 15.0% ] 14.65% | 87,812 | 6.0% |
[ 15.0% - 15.5% ] 15.22% | 66,999 | 8.4% |
[ 15.5% - 16.0% ] 15.82% | 63,858 | 8.3% |
[ 16.0% - 16.5% ] 16.16% | 1,727 | 8.8% |
[ 16.5% - 17.0% ] 16.83% | 42,378 | 8.4% |
[ 17.0% - 17.5% ] 17.23% | 30,743 | 9.1% |
[ 17.5% - 18.0% ] 17.87% | 39,051 | 6.6% |
[ 18.0% - 18.5% ] 18.12% | 19,177 | 4.2% |
[ 18.5% - 19.0% ] 18.78% | 8,088 | 6.1% |
[ 19.0% - 19.5% ] 19.38% | 13,198 | 10.1% |
[ 19.5% - 20.0% ] 19.84% | 2,883 | 2.8% |
[ 20.0% - 20.5% ] 20.43% | 2,394 | 35.2% |
[ 20.5% - 21.0% ] 20.79% | 2,415 | 9.4% |
[ 21.0% - 21.5% ] 21.19% | 13,787 | 4.0% |
[ 21.5% - 22.0% ] 21.72% | 10,002 | 12.5% |
[ 22.0% - 22.5% ] 22.20% | 4,401 | 9.4% |
[ 22.5% - 23.0% ] 22.93% | 663 | 28.4% |
[ 23.0% - 23.5% ] 23.28% | 2,264 | 34.8% |
[ 23.5% - 24.0% ] 23.84% | 1,686 | 2.2% |
[ 24.0% - 24.5% ] 24.33% | 2,918 | 5.3% |
[ 25.0% - 25.5% ] 25.33% | 7,563 | 9.3% |
[ 25.5% - 26.0% ] 25.69% | 1,156 | 9.5% |
[ 27.5% - 28.0% ] 27.58% | 475 | 8.4% |
[ 28.0% - 28.5% ] 28.07% | 1,521 | 3.8% |
[ 28.5% - 29.0% ] 28.79% | 1,532 | 13.7% |
[ 29.0% - 29.5% ] 29.39% | 473 | 5.0% |
[ 30.0% - 30.5% ] 30.00% | 60 | 22.2% |
[ 30.0% - 30.5% ] 30.11% | 362 | 8.5% |
[ 31.0% - 31.5% ] 31.07% | 988 | 23.9% |
[ 34.5% - 35.0% ] 34.57% | 2,152 | 9.4% |
[ 35.0% - 35.5% ] 35.37% | 311 | 27.3% |
[ 35.5% - 36.0% ] 35.77% | 274 | 40.9% |
[ 54.0% - 54.5% ] 54.19% | 179 | 9.5% |