Pueblo Disability Age 5 to 17
COMPARE
Pueblo
Select to Compare
Disability Age 5 to 17
Pueblo Disability Age 5 to 17
5.7%
DISABILITY | AGE 5 TO 17
27.5/ 100
METRIC RATING
189th/ 347
METRIC RANK
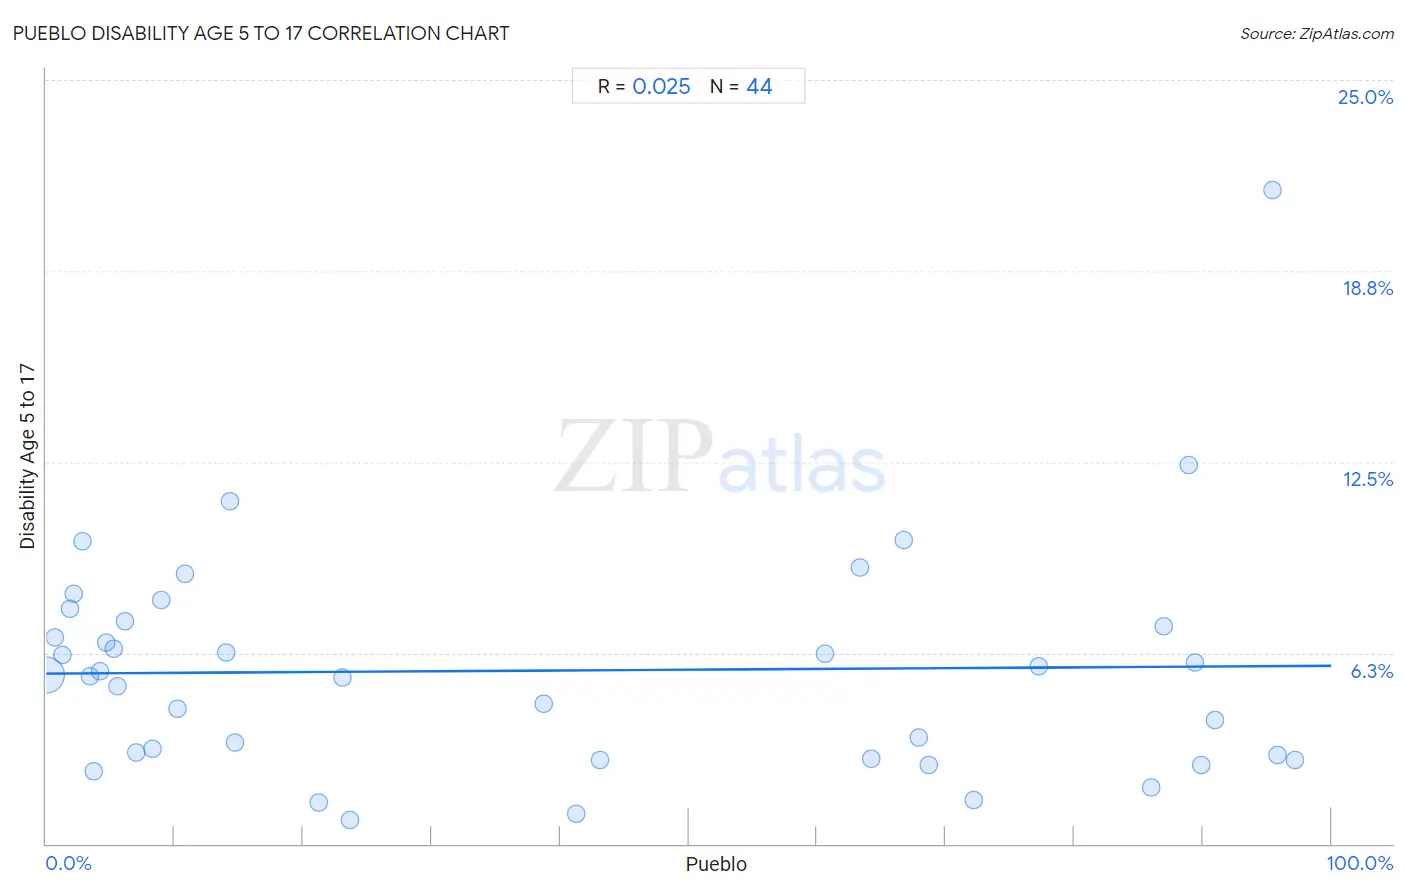
Pueblo Disability Age 5 to 17 Correlation Chart
The statistical analysis conducted on geographies consisting of 119,704,648 people shows no correlation between the proportion of Pueblo and percentage of population with a disability between the ages 5 and 17 in the United States with a correlation coefficient (R) of 0.025 and weighted average of 5.7%. On average, for every 1% (one percent) increase in Pueblo within a typical geography, there is an increase of 0.0026% in percentage of population with a disability between the ages 5 and 17.
It is essential to understand that the correlation between the percentage of Pueblo and percentage of population with a disability between the ages 5 and 17 does not imply a direct cause-and-effect relationship. It remains uncertain whether the presence of Pueblo influences an upward or downward trend in the level of percentage of population with a disability between the ages 5 and 17 within an area, or if Pueblo simply ended up residing in those areas with higher or lower levels of percentage of population with a disability between the ages 5 and 17 due to other factors.
Demographics Similar to Pueblo by Disability Age 5 to 17
In terms of disability age 5 to 17, the demographic groups most similar to Pueblo are Immigrants from Eastern Africa (5.7%, a difference of 0.010%), Marshallese (5.7%, a difference of 0.040%), Danish (5.7%, a difference of 0.060%), Immigrants from Bosnia and Herzegovina (5.7%, a difference of 0.070%), and Immigrants from Canada (5.7%, a difference of 0.090%).
| Demographics | Rating | Rank | Disability Age 5 to 17 |
| Mexican American Indians | 35.2 /100 | #182 | Fair 5.6% |
| Immigrants from Latin America | 34.3 /100 | #183 | Fair 5.6% |
| Syrians | 33.8 /100 | #184 | Fair 5.6% |
| Immigrants from Mexico | 33.7 /100 | #185 | Fair 5.6% |
| Fijians | 31.7 /100 | #186 | Fair 5.7% |
| Immigrants from Thailand | 30.2 /100 | #187 | Fair 5.7% |
| Marshallese | 28.1 /100 | #188 | Fair 5.7% |
| Pueblo | 27.5 /100 | #189 | Fair 5.7% |
| Immigrants from Eastern Africa | 27.3 /100 | #190 | Fair 5.7% |
| Danes | 26.5 /100 | #191 | Fair 5.7% |
| Immigrants from Bosnia and Herzegovina | 26.3 /100 | #192 | Fair 5.7% |
| Immigrants from Canada | 26.1 /100 | #193 | Fair 5.7% |
| Croatians | 23.6 /100 | #194 | Fair 5.7% |
| Immigrants from Nigeria | 23.4 /100 | #195 | Fair 5.7% |
| Inupiat | 23.3 /100 | #196 | Fair 5.7% |
Pueblo Disability Age 5 to 17 Correlation Summary
| Measurement | Pueblo Data | Disability Age 5 to 17 Data |
| Minimum | 0.045% | 0.78% |
| Maximum | 97.2% | 21.4% |
| Range | 97.2% | 20.6% |
| Mean | 38.2% | 5.7% |
| Median | 22.1% | 5.5% |
| Interquartile 25% (IQ1) | 5.4% | 2.8% |
| Interquartile 75% (IQ3) | 70.5% | 7.2% |
| Interquartile Range (IQR) | 65.1% | 4.3% |
| Standard Deviation (Sample) | 35.8% | 3.7% |
| Standard Deviation (Population) | 35.4% | 3.7% |
Correlation Details
| Pueblo Percentile | Sample Size | Disability Age 5 to 17 |
[ 0.0% - 0.5% ] 0.045% | 116,416,705 | 5.5% |
[ 0.5% - 1.0% ] 0.68% | 1,430,122 | 6.8% |
[ 1.0% - 1.5% ] 1.28% | 1,213,079 | 6.2% |
[ 1.5% - 2.0% ] 1.81% | 248,307 | 7.7% |
[ 2.0% - 2.5% ] 2.16% | 21,408 | 8.2% |
[ 2.5% - 3.0% ] 2.85% | 94,173 | 9.9% |
[ 3.0% - 3.5% ] 3.38% | 6,448 | 5.5% |
[ 3.5% - 4.0% ] 3.74% | 7,190 | 2.4% |
[ 4.0% - 4.5% ] 4.18% | 119,674 | 5.6% |
[ 4.5% - 5.0% ] 4.63% | 10,665 | 6.6% |
[ 5.0% - 5.5% ] 5.26% | 3,709 | 6.4% |
[ 5.5% - 6.0% ] 5.53% | 1,646 | 5.2% |
[ 6.0% - 6.5% ] 6.10% | 2,902 | 7.3% |
[ 7.0% - 7.5% ] 7.00% | 20,354 | 3.0% |
[ 8.0% - 8.5% ] 8.25% | 388 | 3.1% |
[ 8.5% - 9.0% ] 8.91% | 18,479 | 8.0% |
[ 10.0% - 10.5% ] 10.17% | 423 | 4.4% |
[ 10.5% - 11.0% ] 10.84% | 489 | 8.8% |
[ 13.5% - 14.0% ] 13.97% | 11,614 | 6.3% |
[ 14.0% - 14.5% ] 14.30% | 3,894 | 11.2% |
[ 14.5% - 15.0% ] 14.72% | 15,895 | 3.3% |
[ 21.0% - 21.5% ] 21.20% | 2,165 | 1.3% |
[ 23.0% - 23.5% ] 23.03% | 2,336 | 5.4% |
[ 23.5% - 24.0% ] 23.61% | 610 | 0.78% |
[ 38.5% - 39.0% ] 38.72% | 3,817 | 4.6% |
[ 41.0% - 41.5% ] 41.23% | 2,906 | 0.99% |
[ 43.0% - 43.5% ] 43.06% | 922 | 2.7% |
[ 60.5% - 61.0% ] 60.63% | 1,270 | 6.2% |
[ 63.0% - 63.5% ] 63.32% | 2,841 | 9.1% |
[ 64.0% - 64.5% ] 64.25% | 3,393 | 2.8% |
[ 66.5% - 67.0% ] 66.75% | 2,021 | 9.9% |
[ 67.5% - 68.0% ] 67.86% | 1,422 | 3.5% |
[ 68.5% - 69.0% ] 68.70% | 722 | 2.6% |
[ 72.0% - 72.5% ] 72.20% | 957 | 1.4% |
[ 77.0% - 77.5% ] 77.26% | 5,520 | 5.8% |
[ 85.5% - 86.0% ] 85.97% | 1,283 | 1.9% |
[ 86.5% - 87.0% ] 86.99% | 1,430 | 7.1% |
[ 88.5% - 89.0% ] 88.93% | 1,824 | 12.4% |
[ 89.0% - 89.5% ] 89.37% | 2,070 | 5.9% |
[ 89.5% - 90.0% ] 89.84% | 1,132 | 2.6% |
[ 90.5% - 91.0% ] 90.95% | 1,259 | 4.0% |
[ 95.0% - 95.5% ] 95.45% | 1,362 | 21.4% |
[ 95.5% - 96.0% ] 95.79% | 9,033 | 2.9% |
[ 97.0% - 97.5% ] 97.20% | 6,789 | 2.7% |