Somali Disability Age 5 to 17
COMPARE
Somali
Select to Compare
Disability Age 5 to 17
Somali Disability Age 5 to 17
5.9%
DISABILITY | AGE 5 TO 17
0.8/ 100
METRIC RATING
260th/ 347
METRIC RANK
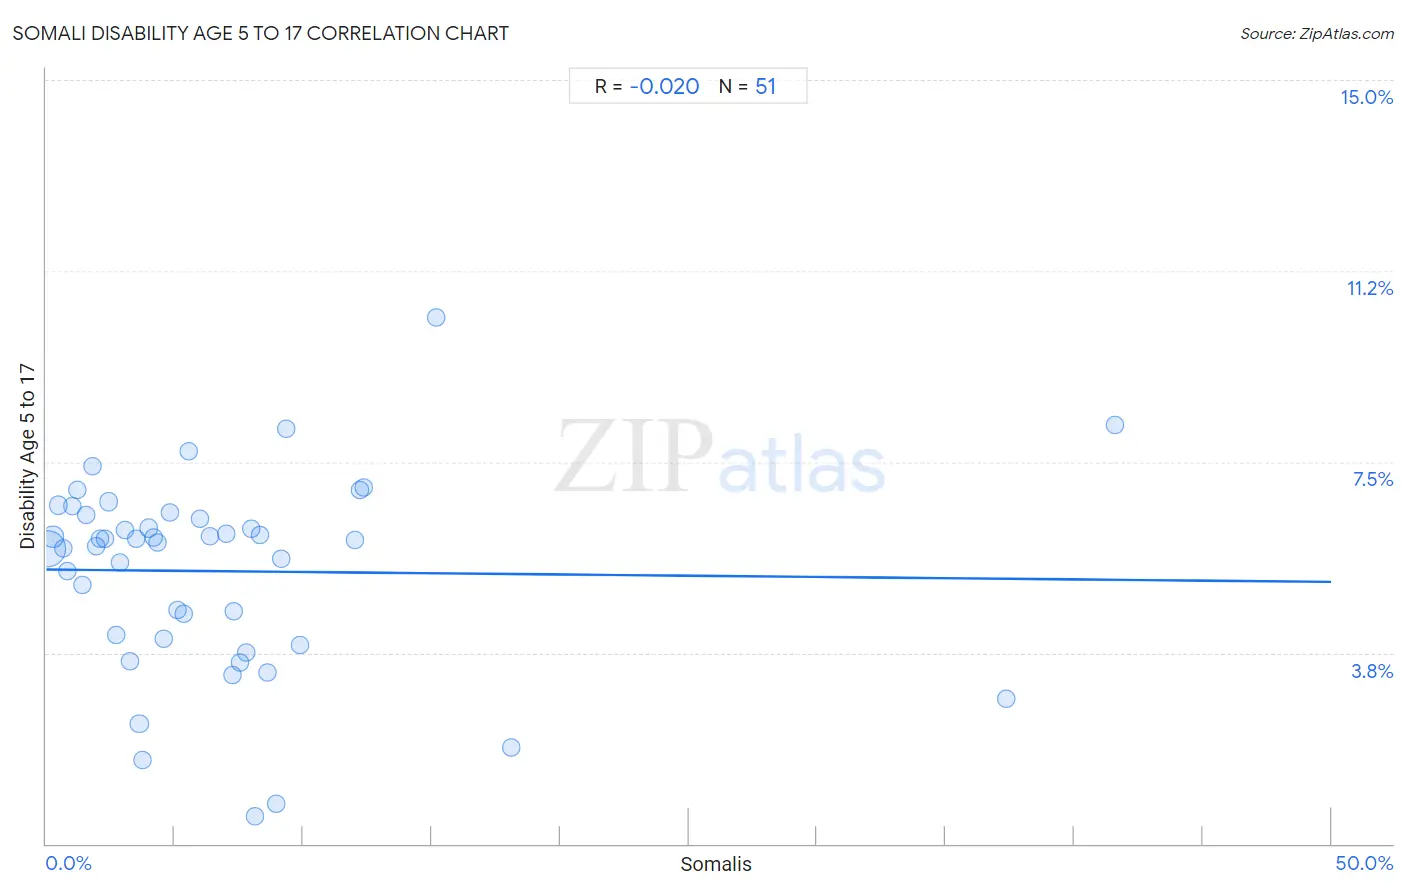
Somali Disability Age 5 to 17 Correlation Chart
The statistical analysis conducted on geographies consisting of 99,029,276 people shows no correlation between the proportion of Somalis and percentage of population with a disability between the ages 5 and 17 in the United States with a correlation coefficient (R) of -0.020 and weighted average of 5.9%. On average, for every 1% (one percent) increase in Somalis within a typical geography, there is a decrease of 0.0049% in percentage of population with a disability between the ages 5 and 17.
It is essential to understand that the correlation between the percentage of Somalis and percentage of population with a disability between the ages 5 and 17 does not imply a direct cause-and-effect relationship. It remains uncertain whether the presence of Somalis influences an upward or downward trend in the level of percentage of population with a disability between the ages 5 and 17 within an area, or if Somalis simply ended up residing in those areas with higher or lower levels of percentage of population with a disability between the ages 5 and 17 due to other factors.
Demographics Similar to Somalis by Disability Age 5 to 17
In terms of disability age 5 to 17, the demographic groups most similar to Somalis are Immigrants from Middle Africa (5.9%, a difference of 0.070%), Immigrants from Western Africa (5.9%, a difference of 0.10%), Slavic (5.9%, a difference of 0.13%), Czechoslovakian (5.9%, a difference of 0.18%), and Brazilian (5.9%, a difference of 0.19%).
| Demographics | Rating | Rank | Disability Age 5 to 17 |
| Scandinavians | 1.4 /100 | #253 | Tragic 5.9% |
| Barbadians | 1.3 /100 | #254 | Tragic 5.9% |
| Italians | 1.2 /100 | #255 | Tragic 5.9% |
| Hopi | 1.0 /100 | #256 | Tragic 5.9% |
| Hispanics or Latinos | 1.0 /100 | #257 | Tragic 5.9% |
| Brazilians | 0.9 /100 | #258 | Tragic 5.9% |
| Slavs | 0.9 /100 | #259 | Tragic 5.9% |
| Somalis | 0.8 /100 | #260 | Tragic 5.9% |
| Immigrants from Middle Africa | 0.7 /100 | #261 | Tragic 5.9% |
| Immigrants from Western Africa | 0.7 /100 | #262 | Tragic 5.9% |
| Czechoslovakians | 0.7 /100 | #263 | Tragic 5.9% |
| Canadians | 0.6 /100 | #264 | Tragic 6.0% |
| Panamanians | 0.6 /100 | #265 | Tragic 6.0% |
| Slovenes | 0.6 /100 | #266 | Tragic 6.0% |
| Spanish | 0.5 /100 | #267 | Tragic 6.0% |
Somali Disability Age 5 to 17 Correlation Summary
| Measurement | Somali Data | Disability Age 5 to 17 Data |
| Minimum | 0.041% | 0.54% |
| Maximum | 41.6% | 10.3% |
| Range | 41.5% | 9.8% |
| Mean | 6.8% | 5.4% |
| Median | 4.8% | 6.0% |
| Interquartile 25% (IQ1) | 2.3% | 4.0% |
| Interquartile 75% (IQ3) | 8.3% | 6.5% |
| Interquartile Range (IQR) | 6.0% | 2.4% |
| Standard Deviation (Sample) | 7.8% | 1.9% |
| Standard Deviation (Population) | 7.7% | 1.9% |
Correlation Details
| Somali Percentile | Sample Size | Disability Age 5 to 17 |
[ 0.0% - 0.5% ] 0.041% | 72,657,144 | 5.8% |
[ 0.0% - 0.5% ] 0.26% | 10,885,924 | 6.0% |
[ 0.0% - 0.5% ] 0.47% | 3,159,487 | 6.6% |
[ 0.5% - 1.0% ] 0.66% | 3,116,607 | 5.8% |
[ 0.5% - 1.0% ] 0.82% | 1,263,977 | 5.4% |
[ 1.0% - 1.5% ] 1.04% | 1,007,768 | 6.6% |
[ 1.0% - 1.5% ] 1.20% | 1,109,989 | 7.0% |
[ 1.0% - 1.5% ] 1.40% | 449,399 | 5.1% |
[ 1.5% - 2.0% ] 1.57% | 659,255 | 6.5% |
[ 1.5% - 2.0% ] 1.78% | 187,013 | 7.4% |
[ 1.5% - 2.0% ] 1.95% | 580,421 | 5.8% |
[ 2.0% - 2.5% ] 2.11% | 248,636 | 6.0% |
[ 2.0% - 2.5% ] 2.28% | 145,273 | 6.0% |
[ 2.0% - 2.5% ] 2.44% | 970,275 | 6.7% |
[ 2.5% - 3.0% ] 2.72% | 217,516 | 4.1% |
[ 2.5% - 3.0% ] 2.86% | 236,661 | 5.5% |
[ 3.0% - 3.5% ] 3.06% | 186,061 | 6.2% |
[ 3.0% - 3.5% ] 3.24% | 143,512 | 3.6% |
[ 3.5% - 4.0% ] 3.51% | 172,840 | 6.0% |
[ 3.5% - 4.0% ] 3.62% | 104,916 | 2.4% |
[ 3.5% - 4.0% ] 3.74% | 14,053 | 1.6% |
[ 3.5% - 4.0% ] 3.99% | 205,507 | 6.2% |
[ 4.0% - 4.5% ] 4.17% | 3,548 | 6.0% |
[ 4.0% - 4.5% ] 4.33% | 54,028 | 5.9% |
[ 4.5% - 5.0% ] 4.58% | 21,569 | 4.0% |
[ 4.5% - 5.0% ] 4.80% | 510,556 | 6.5% |
[ 5.0% - 5.5% ] 5.11% | 17,532 | 4.6% |
[ 5.0% - 5.5% ] 5.36% | 27,523 | 4.5% |
[ 5.5% - 6.0% ] 5.57% | 88,768 | 7.7% |
[ 5.5% - 6.0% ] 5.97% | 23,433 | 6.4% |
[ 6.0% - 6.5% ] 6.37% | 68,910 | 6.0% |
[ 7.0% - 7.5% ] 7.01% | 67,999 | 6.1% |
[ 7.0% - 7.5% ] 7.23% | 42,581 | 3.3% |
[ 7.0% - 7.5% ] 7.31% | 26,760 | 4.6% |
[ 7.5% - 8.0% ] 7.53% | 32,681 | 3.6% |
[ 7.5% - 8.0% ] 7.77% | 30,973 | 3.8% |
[ 7.5% - 8.0% ] 7.98% | 61,423 | 6.2% |
[ 8.0% - 8.5% ] 8.11% | 13,956 | 0.54% |
[ 8.0% - 8.5% ] 8.32% | 17,099 | 6.1% |
[ 8.5% - 9.0% ] 8.63% | 22,827 | 3.4% |
[ 8.5% - 9.0% ] 8.95% | 14,759 | 0.79% |
[ 9.0% - 9.5% ] 9.13% | 23,110 | 5.6% |
[ 9.0% - 9.5% ] 9.36% | 5,984 | 8.1% |
[ 9.5% - 10.0% ] 9.85% | 24,418 | 3.9% |
[ 12.0% - 12.5% ] 12.03% | 32,136 | 6.0% |
[ 12.0% - 12.5% ] 12.22% | 30,625 | 6.9% |
[ 12.0% - 12.5% ] 12.34% | 28,172 | 7.0% |
[ 15.0% - 15.5% ] 15.16% | 3,693 | 10.3% |
[ 18.0% - 18.5% ] 18.08% | 1,930 | 1.9% |
[ 37.0% - 37.5% ] 37.34% | 1,157 | 2.8% |
[ 41.5% - 42.0% ] 41.59% | 8,892 | 8.2% |