Immigrants from Israel Disability Age 5 to 17
COMPARE
Immigrants from Israel
Select to Compare
Disability Age 5 to 17
Immigrants from Israel Disability Age 5 to 17
4.5%
DISABILITY | AGE 5 TO 17
100.0/ 100
METRIC RATING
6th/ 347
METRIC RANK
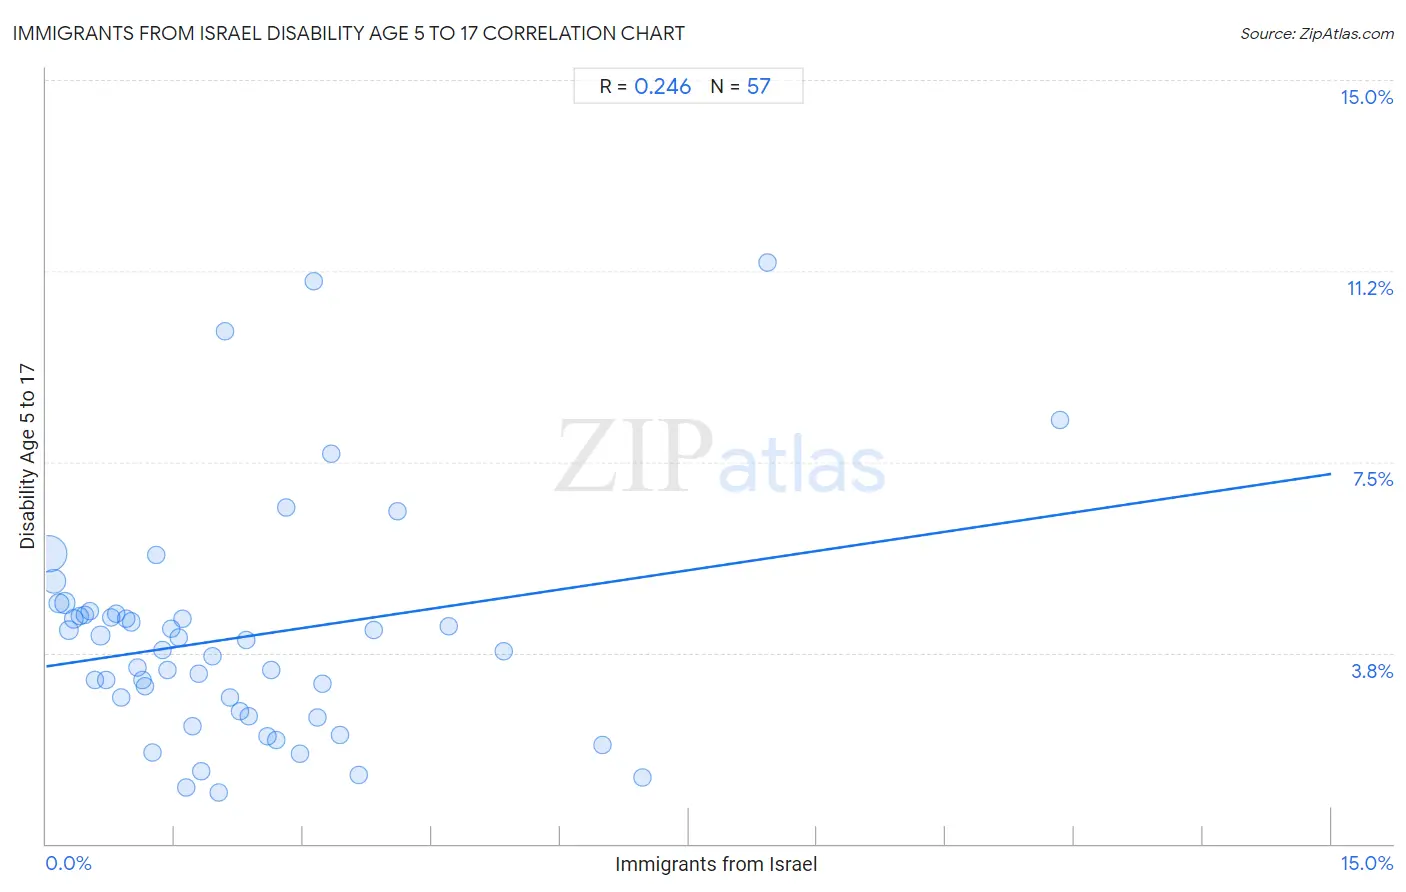
Immigrants from Israel Disability Age 5 to 17 Correlation Chart
The statistical analysis conducted on geographies consisting of 208,803,975 people shows a weak positive correlation between the proportion of Immigrants from Israel and percentage of population with a disability between the ages 5 and 17 in the United States with a correlation coefficient (R) of 0.246 and weighted average of 4.5%. On average, for every 1% (one percent) increase in Immigrants from Israel within a typical geography, there is an increase of 0.25% in percentage of population with a disability between the ages 5 and 17.
It is essential to understand that the correlation between the percentage of Immigrants from Israel and percentage of population with a disability between the ages 5 and 17 does not imply a direct cause-and-effect relationship. It remains uncertain whether the presence of Immigrants from Israel influences an upward or downward trend in the level of percentage of population with a disability between the ages 5 and 17 within an area, or if Immigrants from Israel simply ended up residing in those areas with higher or lower levels of percentage of population with a disability between the ages 5 and 17 due to other factors.
Demographics Similar to Immigrants from Israel by Disability Age 5 to 17
In terms of disability age 5 to 17, the demographic groups most similar to Immigrants from Israel are Immigrants from China (4.5%, a difference of 0.31%), Indian (Asian) (4.6%, a difference of 1.2%), Immigrants from Eastern Asia (4.6%, a difference of 1.6%), Immigrants from India (4.6%, a difference of 1.7%), and Armenian (4.6%, a difference of 1.8%).
| Demographics | Rating | Rank | Disability Age 5 to 17 |
| Immigrants from Armenia | 100.0 /100 | #1 | Exceptional 4.1% |
| Immigrants from Taiwan | 100.0 /100 | #2 | Exceptional 4.2% |
| Immigrants from Hong Kong | 100.0 /100 | #3 | Exceptional 4.3% |
| Filipinos | 100.0 /100 | #4 | Exceptional 4.3% |
| Immigrants from Iran | 100.0 /100 | #5 | Exceptional 4.4% |
| Immigrants from Israel | 100.0 /100 | #6 | Exceptional 4.5% |
| Immigrants from China | 100.0 /100 | #7 | Exceptional 4.5% |
| Indians (Asian) | 100.0 /100 | #8 | Exceptional 4.6% |
| Immigrants from Eastern Asia | 100.0 /100 | #9 | Exceptional 4.6% |
| Immigrants from India | 100.0 /100 | #10 | Exceptional 4.6% |
| Armenians | 100.0 /100 | #11 | Exceptional 4.6% |
| Iranians | 100.0 /100 | #12 | Exceptional 4.6% |
| Thais | 100.0 /100 | #13 | Exceptional 4.7% |
| Immigrants from Korea | 100.0 /100 | #14 | Exceptional 4.7% |
| Chinese | 100.0 /100 | #15 | Exceptional 4.7% |
Immigrants from Israel Disability Age 5 to 17 Correlation Summary
| Measurement | Immigrants from Israel Data | Disability Age 5 to 17 Data |
| Minimum | 0.027% | 1.0% |
| Maximum | 11.8% | 11.4% |
| Range | 11.8% | 10.4% |
| Mean | 2.3% | 4.1% |
| Median | 1.7% | 3.8% |
| Interquartile 25% (IQ1) | 0.84% | 2.6% |
| Interquartile 75% (IQ3) | 3.0% | 4.5% |
| Interquartile Range (IQR) | 2.2% | 1.9% |
| Standard Deviation (Sample) | 2.2% | 2.2% |
| Standard Deviation (Population) | 2.1% | 2.2% |
Correlation Details
| Immigrants from Israel Percentile | Sample Size | Disability Age 5 to 17 |
[ 0.0% - 0.5% ] 0.027% | 115,480,550 | 5.7% |
[ 0.0% - 0.5% ] 0.087% | 38,056,284 | 5.1% |
[ 0.0% - 0.5% ] 0.15% | 13,507,627 | 4.7% |
[ 0.0% - 0.5% ] 0.22% | 16,397,188 | 4.7% |
[ 0.0% - 0.5% ] 0.27% | 6,006,476 | 4.2% |
[ 0.0% - 0.5% ] 0.32% | 7,064,609 | 4.4% |
[ 0.0% - 0.5% ] 0.39% | 2,170,149 | 4.5% |
[ 0.0% - 0.5% ] 0.45% | 1,589,031 | 4.5% |
[ 0.5% - 1.0% ] 0.51% | 1,359,312 | 4.6% |
[ 0.5% - 1.0% ] 0.57% | 810,953 | 3.2% |
[ 0.5% - 1.0% ] 0.63% | 952,752 | 4.1% |
[ 0.5% - 1.0% ] 0.70% | 593,931 | 3.2% |
[ 0.5% - 1.0% ] 0.76% | 621,135 | 4.5% |
[ 0.5% - 1.0% ] 0.81% | 437,833 | 4.5% |
[ 0.5% - 1.0% ] 0.87% | 615,953 | 2.9% |
[ 0.5% - 1.0% ] 0.94% | 645,745 | 4.4% |
[ 0.5% - 1.0% ] 1.00% | 218,851 | 4.4% |
[ 1.0% - 1.5% ] 1.06% | 255,620 | 3.5% |
[ 1.0% - 1.5% ] 1.13% | 342,285 | 3.2% |
[ 1.0% - 1.5% ] 1.15% | 181,565 | 3.1% |
[ 1.0% - 1.5% ] 1.24% | 112,624 | 1.8% |
[ 1.0% - 1.5% ] 1.28% | 144,613 | 5.7% |
[ 1.0% - 1.5% ] 1.36% | 87,263 | 3.8% |
[ 1.0% - 1.5% ] 1.41% | 98,003 | 3.4% |
[ 1.0% - 1.5% ] 1.47% | 33,349 | 4.2% |
[ 1.5% - 2.0% ] 1.55% | 87,328 | 4.1% |
[ 1.5% - 2.0% ] 1.59% | 108,204 | 4.4% |
[ 1.5% - 2.0% ] 1.63% | 1,350 | 1.1% |
[ 1.5% - 2.0% ] 1.70% | 40,396 | 2.3% |
[ 1.5% - 2.0% ] 1.78% | 117,805 | 3.3% |
[ 1.5% - 2.0% ] 1.81% | 81,463 | 1.4% |
[ 1.5% - 2.0% ] 1.95% | 47,972 | 3.7% |
[ 2.0% - 2.5% ] 2.01% | 1,445 | 1.0% |
[ 2.0% - 2.5% ] 2.08% | 6,244 | 10.1% |
[ 2.0% - 2.5% ] 2.14% | 57,280 | 2.9% |
[ 2.0% - 2.5% ] 2.27% | 50,132 | 2.6% |
[ 2.0% - 2.5% ] 2.34% | 13,401 | 4.0% |
[ 2.0% - 2.5% ] 2.37% | 18,693 | 2.5% |
[ 2.5% - 3.0% ] 2.58% | 16,190 | 2.1% |
[ 2.5% - 3.0% ] 2.62% | 62,698 | 3.4% |
[ 2.5% - 3.0% ] 2.69% | 73,051 | 2.0% |
[ 2.5% - 3.0% ] 2.81% | 39,621 | 6.6% |
[ 2.5% - 3.0% ] 2.96% | 3,818 | 1.8% |
[ 3.0% - 3.5% ] 3.12% | 641 | 11.0% |
[ 3.0% - 3.5% ] 3.17% | 41,621 | 2.5% |
[ 3.0% - 3.5% ] 3.23% | 30,598 | 3.1% |
[ 3.0% - 3.5% ] 3.33% | 32,881 | 7.7% |
[ 3.0% - 3.5% ] 3.43% | 962 | 2.1% |
[ 3.5% - 4.0% ] 3.65% | 1,207 | 1.4% |
[ 3.5% - 4.0% ] 3.82% | 2,750 | 4.2% |
[ 4.0% - 4.5% ] 4.10% | 20,411 | 6.5% |
[ 4.5% - 5.0% ] 4.70% | 31,517 | 4.3% |
[ 5.0% - 5.5% ] 5.35% | 1,066 | 3.8% |
[ 6.0% - 6.5% ] 6.49% | 18,210 | 2.0% |
[ 6.5% - 7.0% ] 6.96% | 9,860 | 1.3% |
[ 8.0% - 8.5% ] 8.42% | 1,366 | 11.4% |
[ 11.5% - 12.0% ] 11.83% | 93 | 8.3% |