Romanian Disability Age 5 to 17
COMPARE
Romanian
Select to Compare
Disability Age 5 to 17
Romanian Disability Age 5 to 17
5.4%
DISABILITY | AGE 5 TO 17
94.1/ 100
METRIC RATING
129th/ 347
METRIC RANK
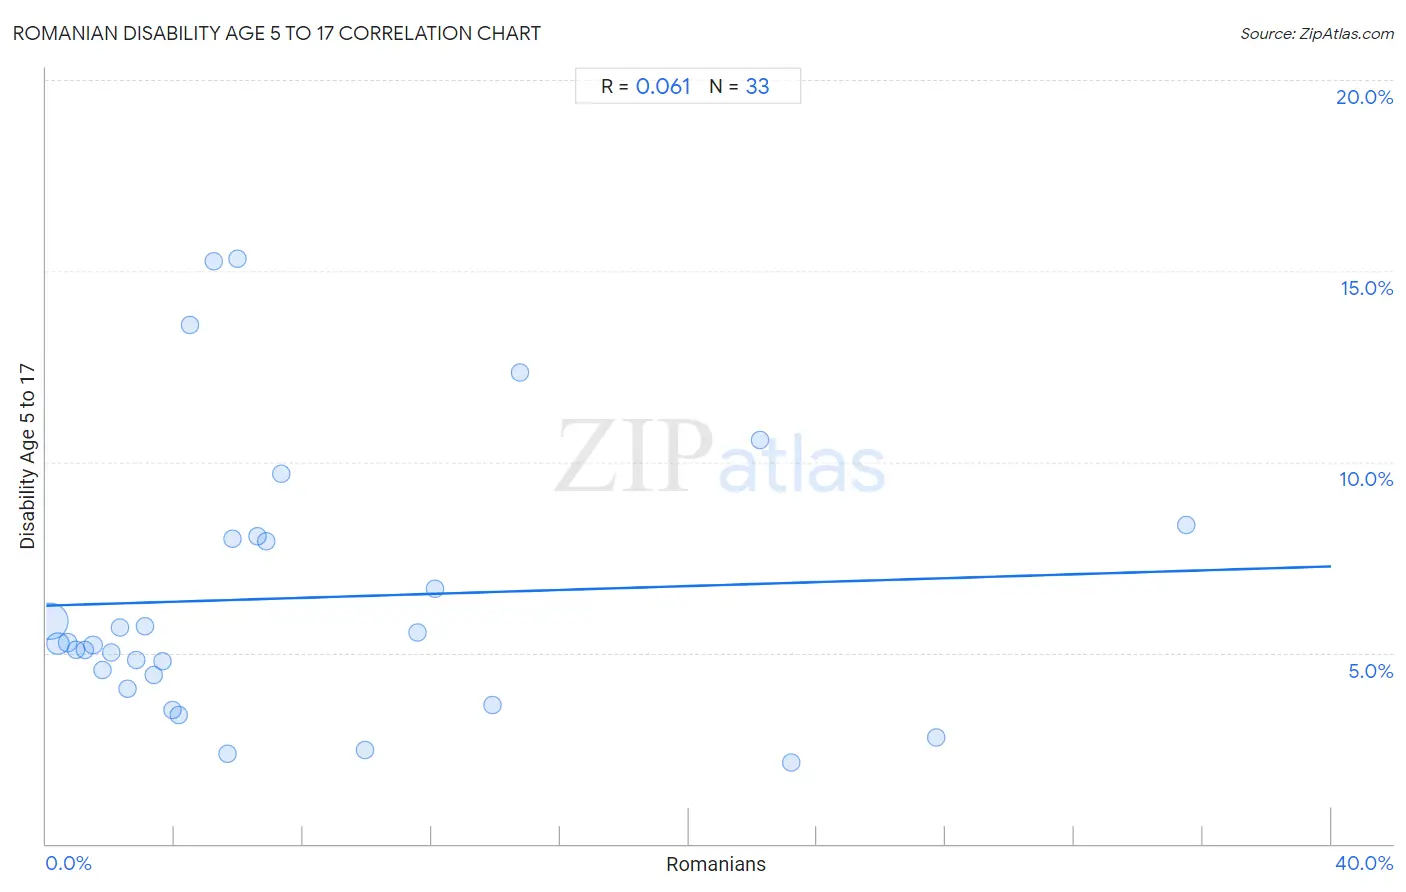
Romanian Disability Age 5 to 17 Correlation Chart
The statistical analysis conducted on geographies consisting of 374,482,125 people shows a slight positive correlation between the proportion of Romanians and percentage of population with a disability between the ages 5 and 17 in the United States with a correlation coefficient (R) of 0.061 and weighted average of 5.4%. On average, for every 1% (one percent) increase in Romanians within a typical geography, there is an increase of 0.026% in percentage of population with a disability between the ages 5 and 17.
It is essential to understand that the correlation between the percentage of Romanians and percentage of population with a disability between the ages 5 and 17 does not imply a direct cause-and-effect relationship. It remains uncertain whether the presence of Romanians influences an upward or downward trend in the level of percentage of population with a disability between the ages 5 and 17 within an area, or if Romanians simply ended up residing in those areas with higher or lower levels of percentage of population with a disability between the ages 5 and 17 due to other factors.
Demographics Similar to Romanians by Disability Age 5 to 17
In terms of disability age 5 to 17, the demographic groups most similar to Romanians are Immigrants from Bulgaria (5.4%, a difference of 0.020%), Immigrants from Venezuela (5.4%, a difference of 0.090%), Latvian (5.4%, a difference of 0.20%), New Zealander (5.4%, a difference of 0.21%), and Immigrants from Chile (5.4%, a difference of 0.22%).
| Demographics | Rating | Rank | Disability Age 5 to 17 |
| Chileans | 95.8 /100 | #122 | Exceptional 5.4% |
| Immigrants from Ethiopia | 95.5 /100 | #123 | Exceptional 5.4% |
| Crow | 95.0 /100 | #124 | Exceptional 5.4% |
| Immigrants from Chile | 95.0 /100 | #125 | Exceptional 5.4% |
| New Zealanders | 95.0 /100 | #126 | Exceptional 5.4% |
| Latvians | 95.0 /100 | #127 | Exceptional 5.4% |
| Immigrants from Venezuela | 94.5 /100 | #128 | Exceptional 5.4% |
| Romanians | 94.1 /100 | #129 | Exceptional 5.4% |
| Immigrants from Bulgaria | 94.0 /100 | #130 | Exceptional 5.4% |
| Arabs | 92.9 /100 | #131 | Exceptional 5.4% |
| Immigrants from Colombia | 92.9 /100 | #132 | Exceptional 5.4% |
| Venezuelans | 92.7 /100 | #133 | Exceptional 5.4% |
| Yuman | 92.3 /100 | #134 | Exceptional 5.4% |
| Immigrants from Belize | 91.7 /100 | #135 | Exceptional 5.4% |
| Immigrants from Denmark | 91.4 /100 | #136 | Exceptional 5.4% |
Romanian Disability Age 5 to 17 Correlation Summary
| Measurement | Romanian Data | Disability Age 5 to 17 Data |
| Minimum | 0.10% | 2.1% |
| Maximum | 35.5% | 15.3% |
| Range | 35.4% | 13.2% |
| Mean | 7.7% | 6.4% |
| Median | 4.5% | 5.2% |
| Interquartile 25% (IQ1) | 2.2% | 4.2% |
| Interquartile 75% (IQ3) | 10.7% | 8.0% |
| Interquartile Range (IQR) | 8.6% | 3.8% |
| Standard Deviation (Sample) | 8.5% | 3.5% |
| Standard Deviation (Population) | 8.3% | 3.5% |
Correlation Details
| Romanian Percentile | Sample Size | Disability Age 5 to 17 |
[ 0.0% - 0.5% ] 0.10% | 282,953,314 | 5.8% |
[ 0.0% - 0.5% ] 0.36% | 61,838,776 | 5.2% |
[ 0.5% - 1.0% ] 0.66% | 15,232,886 | 5.3% |
[ 0.5% - 1.0% ] 0.93% | 7,230,548 | 5.1% |
[ 1.0% - 1.5% ] 1.19% | 3,237,234 | 5.1% |
[ 1.0% - 1.5% ] 1.46% | 1,394,896 | 5.2% |
[ 1.5% - 2.0% ] 1.75% | 878,301 | 4.6% |
[ 2.0% - 2.5% ] 2.03% | 538,743 | 5.0% |
[ 2.0% - 2.5% ] 2.29% | 332,313 | 5.7% |
[ 2.5% - 3.0% ] 2.53% | 288,731 | 4.0% |
[ 2.5% - 3.0% ] 2.82% | 176,482 | 4.8% |
[ 3.0% - 3.5% ] 3.09% | 33,493 | 5.7% |
[ 3.0% - 3.5% ] 3.34% | 106,963 | 4.4% |
[ 3.5% - 4.0% ] 3.63% | 80,295 | 4.8% |
[ 3.5% - 4.0% ] 3.93% | 55,040 | 3.5% |
[ 4.0% - 4.5% ] 4.13% | 56,256 | 3.4% |
[ 4.0% - 4.5% ] 4.48% | 5,820 | 13.6% |
[ 5.0% - 5.5% ] 5.21% | 5,044 | 15.2% |
[ 5.5% - 6.0% ] 5.64% | 1,949 | 2.4% |
[ 5.5% - 6.0% ] 5.81% | 9,350 | 8.0% |
[ 5.5% - 6.0% ] 5.97% | 4,205 | 15.3% |
[ 6.5% - 7.0% ] 6.56% | 3,536 | 8.0% |
[ 6.5% - 7.0% ] 6.84% | 3,858 | 7.9% |
[ 7.0% - 7.5% ] 7.32% | 164 | 9.7% |
[ 9.5% - 10.0% ] 9.94% | 2,405 | 2.5% |
[ 11.5% - 12.0% ] 11.56% | 5,501 | 5.5% |
[ 12.0% - 12.5% ] 12.10% | 1,885 | 6.7% |
[ 13.5% - 14.0% ] 13.88% | 353 | 3.6% |
[ 14.5% - 15.0% ] 14.75% | 278 | 12.3% |
[ 22.0% - 22.5% ] 22.22% | 783 | 10.6% |
[ 23.0% - 23.5% ] 23.18% | 962 | 2.1% |
[ 27.5% - 28.0% ] 27.70% | 1,668 | 2.8% |
[ 35.0% - 35.5% ] 35.48% | 93 | 8.3% |